Page 1
Opportunities to learn algebra 29
________________________________________________________________________________________________________________________
Global Education Review is a publication of The School of Education at Mercy College, New York. This is an Open Access article distributed under the terms of the Creative
Commons Attribution 4.0 International License (CC by 4.0), permitting all use, distribution, and reproduction in any medium, provided the original work is properly cited, a
link to the license is provided, and you indicate if changes were made. Citation: Ayieko, Rachel Angela (2018). The relationship between opportunities to learn
algebra and student’s algebra achievement: A comparative study. Global Education Review, 5 (3), 29-56.
The Relationship between Opportunities to Learn Algebra and
Students’ Algebra Achievement: A Comparative Study
Rachel Angela Ayieko
Duquesne University
Abstract
The article provides a report on the comparison of Opportunities to Learn algebra and eighth grade
students’ algebra achievement in three countries: Botswana, Singapore and the United States. The study
used student and teacher data from the Trends in International Mathematics and Science Study (2011 and
2015). By using a multilevel regression analysis, the study presents the models within the three countries
of the relationships between Opportunities to Learn algebra and eighth-grade students’ algebra
achievement of the recent TIMSS cycle. The findings indicate that the Opportunities to Learn algebra are
context specific and align with the expectations of the curriculum guides from the governing bodies within
the countries. Also, the study shows that students who learned particular algebra topics in the early grades
had significantly higher algebra scores in the TIMSS 2015 assessment. In particular, students who had
been taught properties of functions and simplifying and evaluating algebraic expressions before eighth
grade in the United States had significantly higher scores. Also, Singaporean students who had been
taught simple linear equations and inequalities and simultaneous equations had higher algebra scores.
Implications for policy and research are discussed.
Keywords
Curriculum, algebra achievement, achievement, Trends in International Mathematics and Science Study
(TIMSS).
Introduction
The technological advancement in the 21st
century will require greater numbers of more
graduates with fluency in Science Technology
Engineering and Mathematics related fields
(Graham, Frederick, Byars-Winston, Hunter, &
Handelsman, 2013). Notably, computer
technology expertise, advanced sciences,
economic and mathematics-related fields
require graduates with fluency in the use of
symbolic notation as a tool (Nofre, Priestley, &
Alberts, 2014). Symbolic notation in
mathematics is taught in the algebra strand of
mathematics in middle school and is introduced
by some teachers in the early elementary school
years (Blanton & Kaput, 2005; MacGregor &
Price, 2003). In the United States, Moses and
team (1989) introduced the Algebra Project with
an aim of making algebra available to all
students in Cambridge, Massachusetts. They
argued that access to algebra would provide
_______________________________ Corresponding Author:
Rachel Angela Ayieko, Duquesne University, 106A Canevin
Hall, 600 Forbes Ave., Pittsburgh, PA 15282
Email: [email protected]
Page 2
30 Global Education Review 5(3)
students with a smoother transition to high
school mathematics, and in turn provide a
gateway to college entry. Therefore, success in
learning algebra in elementary school may be
viewed as a civil right for all students because of
its importance in learning high school
mathematics, college entry, and its application
to various fields in the present technological age.
The teaching and learning of algebra is a
challenge for teachers and students (Kierian,
2007; Rakes, Valentine, McGatha, & Ronau,
2010). Across nations, content guidelines and
expectations differ on grade levels for teaching
algebra and the depth of coverage (e.g., Chin et
al., 2012; Common Core State Standards
Initiative [CCSSI] 2010; Kesamang, Mudongo,
Keatimilwe & Botaane, 2012). Therefore, a
comparative analysis of the opportunities to
learn algebra before high school, and relating
these learning opportunities to students’ algebra
mastery is a step towards demystifying the
learning of this component of mathematics. A
cross-national analysis provides a broad scope
for considering the possibilities of the influence
of the Opportunities to Learn the algebra
content on students’ mathematics achievement.
This study drew on the Trends in
International Mathematics and Science Study
(TIMSS) 2011 and 2015 data to examine the
changes in the Opportunities to Learn (OTL)
algebra, and eighth-grade students’ algebra
achievement in three countries with markedly
different TIMSS achievement scores: Botswana,
Singapore, and the United States. Further, the
research focuses on the influence of the recent
OTL algebra on students’ algebra achievement
across the three countries. The questions
guiding the study: (a) How did the Opportunities
to Learn algebra and students’ mathematics
achievement differ between three countries in
2011 and 2015? (b) What was the intended and
implemented algebra curriculum in elementary
and lower secondary school in 2011 in the three
countries? (c) What is the relationship between
Opportunities to Learn algebra and eighth-grade
students’ achievement in algebra across the
three countries in 2015 while controlling for
students’ background and gender?
The selection of each country in three
continents considered: the language of
instruction, previous TIMSS achievement scores,
and curricular differences. These three countries
use English as the language of instruction.
Similar to having a coherent and rigorous
curriculum like other higher-achieving nations,
Singapore is unique in Asia for having classroom
instruction conducted in English, and the
curriculum materials provided in English
(Wang-Iverson, Myers, & Lim, 2010). Botswana
is one of the two Sub-Saharan African countries
that took part in the TIMSS-2011 and 2015 that
uses English as the language of instruction.
South Africa, which is the other African country
that participated in TIMSS in the two cycles was
not selected because the language of instruction
is either English or Afrikaans. For this reason,
Botswana was preferred because of single
English language policy for instruction. The
United States is unique as a country because it
consists of several states that all use English as
the language of instruction and therefore
provides variation in education policies that may
exist among the different states.
The TIMSS achievement scores were also
used to select the countries for inclusion in the
study. Singapore has consistently posted a high
score on international assessments at the eighth-
grade level (Mullis, Martin, & Foy, 2008;
Organization for Economic Cooperation and
Development [OECD], 2010). Therefore,
information from a high-achieving nation serves
as a benchmark for lower achieving nations,
such as Botswana. Botswana is one of the
African countries that has shown steady
economic and political stability and is unique in
providing educational resources to the entire
school-aged population. However, with all these
Page 3
Opportunities to learn algebra 31
positive attributes, it still posted a low score in
both TIMSS math assessments. Curricular
differences are also worth noting as a factor for
selection of countries. Singapore and Botswana
all use a national curriculum, whereas in United
States the state education and the local school
district agencies decide on the curriculum and
accountability measures that are aligned with
the standards shared across the United States.
Beginning in 2010 the United States began to
transition to a national curriculum and by 2015,
43 states, four US territories, and the
Department of Defense Education had adopted
the common core state standards (National
Governors Association of Best Practices &
Council of Chief State School Officers [NGA &
CCSSO], 2010; Malley, Neidorf, Arora, Kroeger
& American Institutes of Research, 2016)
International comparisons may provide
vital information for policy and practice even
though countries may have different cultural
patterns, beliefs, educational structures,
curriculum, and expectations (Desimone, Smith,
Baker, & Ueno, 2005; Schmidt et al., 2001). This
study compared the in-country relationships in
three countries rather than making comparisons
of the relationships across the selected countries,
i.e., in each selected country the Opportunities
to learn algebra were analyzed as cases and the
comparisons of the relationships between these
Opportunities to learn and algebra achievement
within the countries then compared. This large-
scale comparative study across varying contexts,
both within and between the three countries,
allows for a broader consideration of influencing
factors on student achievement and provides a
more extensive generalization of findings. The
similarities and differences of factors related to
student achievement across contexts, which are
not usually apparent, can be illuminated using
such a study.
Theoretical Perspective
The theory guiding this study draws on the
Opportunity to Learn (OTL) framework. The
literature provided is organized by first
discussing the OTL framework. OTL is also
elaborated in regard to the intended curriculum
and implemented curriculum. Following is a
summary of studies on algebra learning as well
as those on the relationships between OTL
algebra and student achievement. Included in
the literature are discussions on the connections
between the documented studies and the
presented research.
Opportunity to Learn
Carroll (1963) introduced Opportunities to
Learn in the proposed dimensions of the model
of learning. According to Carroll, the OTL
dimension falls within the external conditions
that can be adjusted to improve learning. OTL
was defined as “the amount of time allowed for
learning” (Carroll, 1963, p. 26). The expanded
definitions of OTL are the intended time
allocated to learn or teach a topic in the national
curriculum guides or reported by teachers. It is
also the proportion of teachers in a country
covering the topic (Schmidt et al., 2001) or the
relative emphasis on a specific topic (Floden,
2002). Floden (2002) elaborated that the time
teachers plan to spend teaching a topic is
another measure of OTL. In addition, the time
teachers actually spent teaching a topic or the
time a student is present when learning a topic is
measured as an OTL. OTL is also the degree to
which a student engages in specific instructional
activities (Floden, 2002). Schmidt and
colleagues (2001) and Floden (2002)
categorized OTL into the intended or the
implemented curriculum. The intended
curriculum includes the content standards used
to guide instruction, whereas the implemented
curriculum represents the percentage of
instructional time spent or teachers’ reports on
Page 4
32 Global Education Review 5(3)
coverage of a topic (Schmidt et al., 2001).
Similarly, Floden (2002) added that the
intended curriculum includes the topics
scheduled to be taught in a school year or the
time a teacher sets aside to teach the topic. In
addition to Schmidt and colleagues (2001)
summary of the implemented curriculum as an
OTL, Floden (2002) included the count of the
textbook pages on the topic, the teacher’s report
on the emphasis of the topic in relation to other
topics (Floden, 2002). Floden (2002) stated that
OTL is also the academic learning time which is
the time that students are engaged in learning or
the estimated time students complete a given
task successfully or paying attention.
Other definitions of OTL include
approaches to teaching experience (Blömeke &
Delaney, 2014; Schmidt, Blömeke, et al., 2011;
Schmidt, Cogan, & Houang, 2011), access to
qualified teachers, resources for learning, and
the goals set by instructors (Oakes, 1990). OTL
is a focal area of study in international
comparisons (Floden, 2002) and was found to
be positively related to students’ mathematics
achievement (Floden, 2002; Schmidt et al.,
2001; Törnroos, 2005). This study draws from
Floden (2002) and Schmidt and team’s (2001)
OTL that is categorized as the intended and
implemented curriculum. In particular, the
intended curriculum for this study is the
schedule or time for an algebra topic to be
taught in a school year. The implemented
curriculum is the teachers’ reports on the
coverage of an algebra topic. OTL might explain
the variations in student mathematics
achievement across nations that can inform
policy decisions on curriculum preparation and
promising opportunities that make significant
improvements in students’ learning.
Algebra Learning
Scholars have found that teaching algebra in the
early elementary grades (Grades 1-5) is possible
and critical to students’ success in learning more
advanced algebra in secondary school. Knuth,
Stephens, Blanton, and Gardiner (2016)
suggested the infusion of algebra in mathematics
learning in the earlier grades. In particular, the
use of variables, introducing the equal sign as
relational instead of an operation, and functional
relationships were taught with notable success
among third-fifth grade students (Knuth et al.,
2016). Early studies on algebra learning
document positive outcomes with the
introduction of functional thinking in lower
elementary (e.g., Martinez & Barbara, 2006;
Tanışlı, 2011; Warren, Cooper, & Lamb, 2006).
Notably, the nature of selected mathematics
tasks (Bjuland, 2012; Gardiner & Sawrey, 2016)
and approaches to teaching algebra (Chan, 2015;
Whitin & Whitin, 2014) enabled first and fourth
grade students to engage in functional thinking
and algebraic reasoning. Similarly, Blanton,
Stephens, Knuth, Gardiner, Isler and Kim (2015)
reported that third grade students who were
engaged in an early algebra intervention were
able to correctly interpret the equal sign as a
relational symbol, represent unknown quantities
using variable notation, use a structural
approach to solve selected tasks, and represent
relationships of variables using covariational
reasoning. According to Blanton and team
(2015) the algebraic reasoning the third graders
exhibited were critical benchmarks for the
development of algebraic thinking that often
proved to be a challenge for students in the
middle grades and beyond.
One of the factors related to the learning
of algebra is the opportunity to learn. Therefore,
a focus on the grade level when students learned
or were taught algebra tasks could explain the
advantages of their success at the eighth-grade
level. This study adapted the conceptualization
of OTL used by Floden (2002) and Schmidt et al.
(2001), which is the percentage of instructional
time spent on the topic and the curriculum
Page 5
Opportunities to learn algebra 33
offered. Specifically, this study compared the
OTL algebra content of mathematics in two
years (2011 and 2015) in the three countries.
OTL Algebra in the Three Countries
The curriculum for teaching algebra varies
across the selected countries. In Botswana, the
mathematics curriculum in algebra is
concentrated in the upper primary (Grades 5-7)
and lower secondary (Grades 8-10). In upper
primary suggested algebra topics include using
algebra to communicate numbers, number
patterns and arithmetic sequences, solving and
simplifying linear expressions (Masole,
Gabalebatse, Guga, Pharithi, 2016; Botswana
Examination Council, 2016). In lower secondary
the algebra curriculum includes simplification of
algebraic expressions, expansion and
factorization, evaluation and formulae for
numeric values, and formation and solving
linear and systems of equations using real-life
situations, patterns, and sequences (Barungwi,
Cele, Mudongo, Morake, & Hlomani, 2008;
Masole, et al., 2016; Ministry of Education
Botswana, 2010).
In Singapore, algebra content in the
primary (Grades 1-6) includes algebraic
expressions with one variable and lower
secondary (Grades 7-8) includes quadratic
equations, linear inequalities, simultaneous
equations, linear equations, algebraic
expressions and formulae, rate and speed,
algebraic manipulation, and set language and
notation, functions and graphs (Chee et al.,
2016; Quek et al., 2008; Ministry of Education
Singapore, 2007). At eighth grade, a substantial
section of the mathematics curriculum is algebra
(Kaur, 2008).
However, in the United States, the
curriculum guides vary across the different
states and school districts (Keene, 2008; Malley,
et al., 2016). In algebra, the curriculum topics in
middle school (Grades 6-8) include numeric
values, algebraic patterns, geometric patterns or
sequences, powers of expressions containing
variables (National Council of Teachers of
Mathematics [NCTM], 2000). Other topics
include evaluating expressions for a given
numeric value, simplification and comparison of
algebraic expressions, using expressions to
model situations, simple linear equations,
simultaneous equations, and multiple
representations of functions, function
properties, radicals and integer exponents
(Keene, 2008; Malley, et al., 2016). While the
United States in America claimed to adopt the
Common Core State Standards of Mathematics
in 2011(NGA & CCSSO, 2010), the instruction
provided in this study followed NCTM
standards.
Figure 1 summarizes the hypothesized
relationships of this study (including the
background variables: gender and academic
resources (background). Students’ gender and
academic resources (background) are used as
control variables because they are factors that
have been found to influence student academic
achievement. The students’ background
variables are a Socio-economic measure, a term
introduced by Carnoy (2015), which includes
parental level of education and the number of
books in the students’ home. I hypothesize that
those students who have had the OTL various
content areas of algebra in before and at eighth
grade have higher algebra achievement,
controlling for their background and gender.
Page 6
34 Global Education Review 5(3)
Figure 1. The hypothesized relationships between the OTL algebra and eighth grade students’ algebra
achievement.
Method
Data and Sampling
The study used data from TIMSS 2011 and 2015.
TIMSS 2011 and 2015 are the fifth and sixth
cycles of the TIMSS comparative assessment of
mathematics and science around in the world,
respectively. These studies are cross-sectional
surveys of information about the teaching and
learning of mathematics cross-nationally in the
fourth and eighth grades of school. The fourth
grade was considered as the students who have
been in school for four years beginning from first
grade with a mean age of at least 9.5 years.
Similarly, students sampled for the eighth-grade
study have been in school for the last eight years
and mean age of at least 13.5 years (Laroche,
Joncas & Foy, 2016). The data were collected
through a disproportionate sampling procedure
in which whole classes were selected after
dividing the target population into strata (Olson
et al., 2008). The schools were sampled in each
of the strata in the first stage and then the
classes within the schools in the second stage.
Stratification improves efficiency, makes
estimates more reliable, and allows for
differences in sampling based on the population
years (Laroche, Joncas & Foy, 2016). The
variables used for stratifying the samples were
agreed upon by consultation between the
National Research Centers of the participating
countries and Statistics Canada (Mullis Martin,
Foy & Arora (2012); Mullis, Martin, Foy &
Hooper (2016)
TIMSS aims to get a 100% participation
rate for the sampled schools and classes. The
sampling team set the required participation
rates at 85% minimum for the schools and 95%
for the classrooms, or a combined participation
rate of 75% years (Laroche, Joncas & Foy, 2016).
For each of the sampled schools, two schools
were identified as replacement schools in the
specified stratum. In order to cater for the
differing sizes of the schools and classes and
non-participation, unique sampling weights
were introduced (Laroche, Joncas & Foy, 2016).
The sampling weights were calculated for each
grade and study and were taken into
consideration during any TIMSS analysis.
The TIMSS data was collected from
students, teachers, principals, and education
representatives in the participating countries.
Algebra achievement
Students' background
(OTL)
Algebra topics taught before eighth
grade
(OTL)
Algebra topics taught at the eighth grade
level
Page 7
Opportunities to learn algebra 35
Background information was collected from the
students and their teachers. In addition, the
students and their teachers responded to
questions about the learning and teaching of
mathematics. Information about the curriculum
was obtained from education representatives in
each of the participating countries. The
principals in the participating countries
provided information about their schools. In
sum, 45 countries and 14 benchmarking entities
participated in 2011 and 57 countries and 7
benchmarking entities in 2015. The information
gathered from the data informs policy and
practice towards the improvement in teaching
and learning of mathematics and science.
The study focused on three countries,
Botswana (n=5400 in 2011; n=5964 in 2015),
Singapore (n=5927in 2011; n=6116 in 2015), and
the United States (n=10,477 in 2011; n=10,491 in
2015) that participated in the TIMSS -2011 and
2015. The International Association for the
Evaluation of Educational Achievement (IEA)
had national research coordinators from each of
the participating countries conducting the
survey. The target population was students, and
their teachers, who were classified by the
International Standard of Classification of
Education to be in eighth grade or its equivalent.
In Botswana, the ninth-grade students
responded to the eighth-grade survey but in
Singapore and the United States the eighth-
grade students were the respondents in the
study. The study relied on the students’ and
teachers’ self-reports on the opportunities to
learn specific algebra content and the amount of
time devoted to teaching algebra and the
students’ algebra achievement. Table 1 presents
a description of the variables used in the study.
Analysis
The first two research questions required
descriptive information of the OTL algebra and
eighth-grade student mathematics achievement
information in the three countries.
Research question one: “How did the
Opportunities to Learn algebra and students’
mathematics achievement differ across the three
countries in 2011 and 2015?” This research
question was answered using means, standard
deviations that illustrate the variations in OTL
and students’ mathematics achievement in the
three countries, and a one-way ANOVA to test
for differences in the means. The analysis
included mean differences by country and a
combination of data from 2011 and 2015 with
mean difference tests conducted where
appropriate. These analyses were conducted
using the IEA International Database Analyzer
(IDB). The IDB analyzer was used to merge the
files for the three countries and for descriptive
analysis of the merged data. This software is a
plugin used in the SPSS1 (IBM Corporation,
2012) platform that considers the complex
sampling in selecting the appropriate weight and
correcting for the standard error.
Descriptive information on teachers’
reports about when they intended to teach
specific algebra content as well as the
percentages of teachers whose reports included
when they taught specific algebra content was
used for the analysis of the second research
question: “What was the intended and
implemented algebra curriculum in elementary
and lower secondary school in 2015?” Data was
collected from respondents in the respective
countries providing information on the intended
curriculum and data available from the TIMSS
database.
Research question three, “What is the
relationship between Opportunities to Learn
algebra and students’ achievement in algebra
across the three countries?” was examined using
a multi-level regression analysis. This analysis
Page 8
36 Global Education Review 5(3)
Table 1
Variables used in the study
Main Variable Variables Type Description
Opportunities to
Learn algebra
(Intended)
Intended grade
algebra topics
should be taught
Ordinal From the curriculum
questionnaire the respondent
selects when topic is intended
to be taught. The respondent
in this case is either the
curriculum director or the
principals in the selected
schools.
Opportunities to
Learn algebra
(Implemented)
Algebra topics
taught
Ordinal Teacher reports on whether
topics were taught before or
at eighth-grade.
Time spent teaching
algebra and other
topics
Ordinal The teacher reports what
percentage of time they will
have spent teaching algebra
and other topics by the end of
the school year†.
Student achievement Mathematics
achievement
Continuous Students’ achievement in
mathematics content of
algebra, data and chance,
geometry and numbers.
Gender Students’ gender Dichotomous Students gender used as a
control variable
Socio-economic
Status
Number of books in
the home
Continuous A proxy variable selected to
be used as a measure of the
students’ socio-economic
status.
Highest parental
level of education
Mother and fathers’ level of
education given using the
ISCED classification
† The categories answered are: mostly taught this year, taught before this year, and the topics not yet
taught or just introduced. In this study the responses are recoded such that mostly taught this year and
taught before this year were the percentages considered.
Page 9
Opportunities to learn algebra 37
technique is useful because it considers the
cluster sampling. In particular, the sampling
design, weighting, and the mathematics
achievement given in the form of five plausible
variables (Foy & Olson, 2008; Rutkowski,
Gonzalez, Joncas, & von Davier, 2010) was
considered using HLM2 software (Raudenbush &
Bryk, 2002).
The student level variables were set at level 1 and
the teacher variables at level 2.
Level 1 (Student level)
Algebra achievementij = β0j + β1j*(Genderij) +
β1j*(Number of books in the homeij) +
β1j*(Parents education level ij) + rij
β0j is average algebra score in institution j. The
variables represent the group- mean centered
independent variables that include the
covariates at the student level. The beta
coefficients represent the slope or the
corresponding change in algebra score for every
unit change in the covariates. The error of the
prediction of the equation is represented by rij.
Level 2 (Teacher level)
Model 1: β0j = γ00 + γ01*(OTL algebra before
eighth grade2-6j) + u0j
Model 2: β0j = γ00 + γ01*(OTL algebra at eighth
grade6-10j) + u0j
The OTL variables are the grand mean-centered
independent variables at the teacher level. γ00 is
the grand mean algebra score of the sample in
the country. u0j is the random error for deviation
of group intercept with the overall intercept.
This analysis was run separately for the two
cycles.
Results
Mathematics Achievement in 2011 and
2015
In the TIMSS study, each student answered a
few items from the more extensive pool for
mathematics assessment. The limited responses
of the students were used to generate an ability
distribution for each of the students, from which
five plausible values calculated (Rutkowski et al.,
2010). The analysis provided the combined
plausible values for each student found through
the use of the IDB analyzer. Figure 2 presents
the graph of the differences in mathematics
achievement scores in the content areas over the
two years.
Page 10
38 Global Education Review 5(3)
Figure 2. Mathematics achievement scores in 2011 and 2015 in the four topical areas (Mean plausible
values).
A descriptive analysis of the scores by average
math scores between the two TIMSS cycles,
content areas, and between countries indicated
that there were differences in the students’
scores worth mentioning. In 2015 the average
students’ mathematics scores was higher(
(M=512.19, SD 115.34) than in 2011(M=507.62,
SD =108.58), t(44, 103) =-4.284, p<0.001. That
is, a combination of the math scores in 2011 and
2015 were significantly different. A further
analysis of each content area for the three
countries combined also indicated there was
some significant differences. In particular , the
combined mathematics scores in numbers were
higher in 2015 (M=517.05, SD 118.79) than 2011
( M=509.19, SD 114.08), t(44,103)=-7.085,
p<.001). A comparison of the mean mathematics
scores for the three countries revealed that
Botswana had the lowest mean grade when
compared to the other two countries, whereas
Singapore had the highest scores in all the
mathematics topics among the three countries in
both cycles. Botswana had a significant lower
average score in all mathematics content areas
in 2015 when compared to the United States
(p<.001) and Singapore (p<.001).
Algebra was the content area in which the
eighth-grade students in Botswana and
Singapore had the highest mean scores in
2011(406.81 and 614.47 respectively) in all
content areas within the countries. In 2015 the
eighth-grade students in Botswana still had the
highest mean content score in Algebra (399.82),
but the eighth-grade Singaporean students had
their highest mean content score in Numbers
(628.95). In the United States, the highest mean
score was in Data and Chance in 2011(527.86)
to Algebra in 2015 (524.86). Finally, the
students in the United States and Singapore
maintained the lowest mean grade in geometry
content. Notably, in Botswana, the eighth-grade
students lowest mean score shifted from
Geometry in 2011 (380.68) to Data and Chance
in 2015 (373.56). Although algebra was the
0
100
200
300
400
500
600
700
Alg
ebra
Dat
a an
d C
han
ce
Geo
met
ry
Nu
mb
ers
Alg
ebra
Dat
a an
d C
han
ce
Geo
met
ry
Nu
mb
ers
Alg
ebra
Dat
a an
d C
han
ce
Geo
met
ry
Nu
mb
ers
Botswana Singapore United States
Sco
res
in M
ea
n P
lau
sib
le v
alu
es
2011
2015
Page 11
Opportunities to learn algebra 39
content area in which students performed
highest in Botswana, the general performance in
algebra was significantly lower (p<.001), when
compared to the other two countries.
OTL (Intended Curriculum)
The second research question was an
inquiry of the intended and implemented
curricula in 2011. In this section, the report
provides a descriptive summary of the intended
curriculum as analyzed from the TIMSS data
base, collected through the curriculum
questionnaire in which the principals or the
curriculum directors responded. The intended
curricula in Botswana, Singapore, and the
United States indicate the algebra topics were
taught at, and introduced at, different grade
levels. For instance, simultaneous equations
should be taught at the eighth-grade level in all
three countries. Simplifying and evaluating
expressions was to be taught from grade six
onwards in Botswana and Singapore, but to be
taught only at the sixth-grade level in the United
States and some sections of the topic to be
taught at the fourth-grade level in Botswana.
Notably, the Singaporean curriculum
expectations emphasized that patterns and
sequences were to be taught all eight years from
first grade, but to be taught from third grade in
Botswana and fourth grade in the United States.
The other algebra topics were taught in the
upper elementary grades and taught at
subsequent years, but the grade levels at which
the topics were first taught differed. A summary
table of the topics and the grade levels when
topics were to be taught is summarized in Table
2.
Table 2
Intended Algebra Curriculum Grades 1-8 in Botswana, Singapore, and the United States
Algebra Topics Country Grades
1 2 3 4 5 6 7 8
Simplifying and evaluating
algebraic expressions
Botswana X X X X
Singapore X X X
United States X
Simple linear equations and
inequalities
Botswana X X X X
Singapore X X
United States X X X
Simultaneous (two variables)
equations
Botswana X
Singapore X
United States X
Numeric, algebraic, and geometric
patterns or sequences (extension,
missing terms, generalization of
patterns)
Botswana X X X X X X
Singapore X X X X X X X X
United States X X X X X
Representation of functions as
ordered pairs, tables, graphs,
words, or equations
Botswana X X X
Singapore X X
United States X X X X
Properties of functions (slopes,
intercepts etc.)
Botswana X
Singapore X X
United States X X X
Page 12
40 Global Education Review 5(3)
Implemented Curriculum
Algebra Topics Taught Before Eighth
Grade
The percentage of teachers that reported
teaching various algebra topics before eighth
grade changed between 2011 and 2015. In all
three countries, the proportion of the students’
teachers who taught simple linear equations and
simplifying and evaluating algebraic
expressions before eighth grade increased
markedly between the years 2011 to 2015. In
particular, the percentage of teachers who taught
simple linear equations increased from 13.79%
to 18.85% in the United States, 31.62% to
40.39% in Singapore, and 16.09% to 19.49% in
Botswana. Similarly, the percentage of teachers
who reported that they taught simplifying and
evaluating algebraic expressions increased
from 18.75% to 29.87% in the United States, and
28.69% to 48.41% in Singapore. Also, there was
an increase in the number of Singaporean
(13.88% to 24.7%) and Botswana (15.37% to
18.72%) teachers who reported they taught
multiple representations of functions across the
two cycles. However, there was a decrease in the
percentage of teachers who taught patterns and
sequences in the United States (36.08% to
21.43%) and Botswana (50.46% to 40.38%).
Finally, there was an increase in the percentage
of teachers who reported teaching simple linear
equations from 2011 to 2015 in all three
countries. That is, there was an increase from
13.79% to 18.85% in the United States, 31.62% to
40.39% in Singapore, and 16.09% to 19.46% in
Botswana.
Algebra topics taught at the eighth-grade
level
Most of the algebra content was taught in the
eighth grade in the three countries but with
lower percentages of teachers teaching
particular topics in the three countries in 2015.
Specifically, a decreased percentage of teachers
across the three nations reported teaching
simplifying and evaluating algebraic
expressions at the eighth-grade level (76.91% to
68.75% in the United States, 71.31% to 51. 59 in
Singapore, and 52.16% to 46.16 % in Botswana).
Notably, there was a drop in the percentage of
teachers that reported having taught simple
linear equations and inequalities (55.22to
40.14%), numeric, algebraic, and geometric
patterns (44.04% to 32.18%), and simultaneous
equations (32.77% to 16.59%) at the eighth-
grade level in Botswana. However, in the United
States, there was an increase in the percentage of
teachers that reported having taught
representations of functions (80.74% to
88.42%) and simultaneous equations (58.45% to
79.73%) at the eighth-grade level. Finally, the
highest percentage of teachers that reported that
they taught properties of functions at the eighth-
grade level (89.53%) was in the United States,
whereas Botswana had the lowest percentage
(30.88%). These results indicate the OTL the
different algebra topics that represent the
implemented curriculum as reported by the
students’ teachers differed in the three
countries. Also, most of the algebra curriculum
seemed to have been implemented at the eighth-
grade level as shown by the higher percentage of
teachers who reported when they taught the
algebra topics. Figures 3-5 provide summaries of
the OTL various algebra topics before and at the
eighth-grade level.
Page 13
Opportunities to learn algebra 41
Figure 3. Percentage of teachers who reported having taught specific algebra topics before eighth
grade in 2011.
16.09
15.37
8.95
40.16
50.46
31.62
13.88
4.45
28.69
65.81
13.79
8.17
4.6
18.75
36.08
0 20 40 60 80 100
Simple linear equations andinequalities
Multiple Representation ofFunctions
Simultaneous Equations ( Twovariables)
Simplifying and EvaluatingExpressions
Numeric, algebraic, andgeomeric patterns
Properties of functions
Percentage of Teachers
United States
Singapore
Botswana
Page 14
42 Global Education Review 5(3)
Figure 4. Percentage of teachers who reported having taught specific algebra topics before eighth
grade in 2015.
16.09
15.37
8.95
40.16
50.46
31.62
13.88
4.45
28.69
65.81
13.79
8.17
4.6
18.75
36.08
0 20 40 60 80 100
Simple linear equations andinequalities
Multiple Representation ofFunctions
Simultaneous Equations ( Twovariables)
Simplifying and EvaluatingExpressions
Numeric, algebraic, andgeomeric patterns
Properties of functions
Percentage of Teachers
United States
Singapore
Botswana
Page 15
Opportunities to learn algebra 43
Figure 5. Percentage of teachers who reported teaching specific algebra topics at the eighth-grade level in
2011 and 2015.
55.22
40.14
40.74
36.11
32.77
16.59
52.16
46.16
44.04
32.18
30.88
63.41
58.29
77.71
69.75
84.77
86.19
71.31
51.59
29.77
26.07
66.76
75.93
78.33
80.74
88.42
58.45
79.73
76.91
68.75
54.28
56.41
89.53
0 20 40 60 80 100
Simple linear equationsand inequalities-2011
Simple linear equationsand inequalities-2015
Multiple Representationof Functions-2011
Multiple Representationof Functions-2015
Simultaneous Equations (Two variables)-2011
Simultaneous Equations (Two variables)-2015
Simplifying and EvaluatingExpressions-2011
Simplifying and EvaluatingExpressions-2015
Numeric, algebraic, andgeomeric patterns-2011
Numeric, algebraic, andgeomeric patterns--2015
Properties of functions-2011
Properties of functions-2015
Percentage of Teachers
United States
Singapore
Botswana
Page 16
44 Global Education Review 5(3)
Relationships between OTL Algebra
and Students’ Algebra Achievement in
2015?
The 2015 data contributes information on
the most recent relationships between OTL
algebra and algebra achievement in the
selected countries. A multi-level model of
the relationships between the OTL algebra
and students’ algebra achievement in 2015 is
presented in Tables 4 and 5. Table 4 is the
unconditional model of the algebra
achievement, and Table 5 provides the
multi-level models of the relationships
between the OTL algebra and algebra
achievement within the three selected
countries. The tables include the values of
the beta coefficients and the standard errors
in parenthesis. The Intra-class correlations
(ICC) is the ratio of the between-class
variation and the total variance in algebra
achievement (𝐼𝐶𝐶 = 𝜏00 /[𝜏00 + 𝜎2]). The
ICC values for algebra achievement in the
three countries are above 0.1(see Table 4)
and therefore it is permissible to use a multi-
level model (Raykov & Marcoulides, 2012).
The ICC values provide information about
the variation of algebra achievement scores
between the students’ teachers.
Table 4
Unconditional models of Eighth Grade Students’ Algebra achievement in 2015
Variables Botswana Singapore United States
Intercept 401.39***
(3.12)
619.95***
(4.43)
523.12***
(3.35)
Variance Components
Variance between students’ teachers 1023.34 5899.96 3859.75
Variance between students 5116.87 1948.86 3594.20
ICC 0.17 0.75 0.52
***p<.001
Page 17
Opportunities to learn algebra 45
Table 5
Relationships between OTL algebra and Eighth Grade Students’ Achievement in Algebra in 2015
Variables Botswana Singapore United States
Model 1 Model 2 Model 1 Model 2 Model 1 Model 2
Intercept
399.38***
(3.28)
399.60***
(3.25)
619.31***
(3.89)
619.62***
(3.73)
524.92***
(3.25)
524.38***
(3.20)
Female
23.08***
(3.58)
23.08***
(3.81)
-.53
(2.99)
-.53
(2.99)
3.79**
(1.85)
3.79**
(1.85)
Number of books in the
home
2.42
(2.07)
2.42
(2.07)
-.25
(1.23)
-.25
(1.22)
8.92***
(.89
8.93***
(.89)
Fathers educational
level
4.29***
(.85)
4.29***
(.93)
.51
(.32)
.51
(.32)
1.06
(0.78)
1.06
(.78)
Taught before
eighth grade
Numeric, algebraic and
geometric patterns
11.80
(6.80)
1.38
(8.74)
-14.69
(8.31)
Simplifying and
evaluating algebraic
expressions
7.47
(7.03)
-7.67
(8.92)
18.18**
(8.38)
Simple linear equations
and inequalities
-4.30
(11.40)
63.41***
(9.84)
15.71
(10.02)
Simultaneous equations
17.39
(16.33)
56.23**
(17.96)
-5.92
(18.52)
Representations of
functions
-1.82
(10.87)
22.24
(12.79)
-6.98
(16.09)
Properties of functions
-10.88
(13.41)
2.92
(12.68)
54.64**
(20.97)
Page 18
46 Global Education Review 5(3)
Taught at eighth
grade
Numeric, algebraic and
geometric patterns
-10.11
(6.54)
-3.07
(8.78)
15.81**
(6.97)
Simplifying and
evaluating algebraic
expressions
8.01
(5.61)
-1.32
(8.33)
23.86**
(7.50)
Simple linear equations
and inequalities
-5.95
(5.55)
-50.32***
(9.10)
-13.47
(8.74)
Simultaneous equations
16.60
(8.86)
74.45***
(10.14)
27.67**
(9.96)
Representations of
functions
8.39
(5.97)
-17.24
(9.94)
-.05
(12.19)
Properties of functions
6.77
(7.27)
-13.08
(9.63)
-22.13
(14.23)
Variance Components
and fit index
𝓧𝟐 909.89*** 876.48*** 14046.0*** 12.702.99*** 7561.04*** 7534.21***
*p<.05, **p<.01, ***p<.001
The findings from the multi-level
modeling of the relationship between the
OTL algebra and students’ algebra
achievement indicate that particular
relationships were context-specific, and the
relational patterns differed across the three
countries. The interpretation of the
relationships is reported by first considering
the associations between OTL algebra before
the eighth-grade and students’ algebra
achievement. Next, is a discussion of the
relationships between OTL algebra at eighth
grade and students’ algebra achievement. All
these relational findings are controlled for
gender and the students’ academic
resources(background) at home.
Teaching algebra topics before eighth
grade
The findings indicate there were differing
patterns in the relationships in all three
countries between OTL algebra before
eighth grade and the students’ algebra
achievement. Specifically, students in
Singapore whose teachers reported they
taught simple linear equations and
inequalities before eighth grade had
significantly higher scores (β=63.4, p<. 001)
when compared to those who did not learn
this algebraic topic or were taught the topic
at the eighth-grade level. Further, the
Singaporean students’ whose teachers
reported they were taught simultaneous
equations before eighth grade had
significantly higher scores (β=56.23, p<. 05)
Page 19
Opportunities to learn algebra 47
than those who had not been taught the
topic or had this OTL the eighth-grade level.
In Botswana, students whose teachers
reported that they had been taught numeric,
algebraic and geometric patterns,
simplifying and evaluating algebraic
expressions, and simultaneous equations
had higher scores than those who had not
been taught the topic or were taught in the
eighth grades. In contrast, students whose
teachers reported they had taught simple
linear equations and inequalities and
properties of functions had lower scores
when compared to those who had not been
taught the topics or had been taught at the
eighth-grade level. Notably, all the
relationships between the OTL algebra
before eighth grade and students’ algebra
achievements were not significant in
Botswana.
In the United States students whose
teachers reported having taught some
algebra topics before eighth grade had
significantly higher algebra scores. Mainly,
students whose teachers reported having
taught simplifying and evaluating algebraic
expressions and properties of functions at
the eighth-grade level had significantly
higher scores (β=18.18, p <. 05 and β=54.64,
p <. 05, respectively). These scores were
compared to students who had either not
been taught the topic or who experienced
this OTL at the eighth-grade level. However,
those students whose teachers reported they
taught numeric, algebraic, and linear
patterns and simultaneous equations before
eighth grade had lower scores in the United
States.
Teaching algebra topics at the eighth-
grade level
Across the three countries, the pattern of
relationships between OTL algebra topics
and students’ algebra achievement differed
but were similar for two algebra topics. The
relationships between OTL simultaneous
equations and students’ algebra
achievement were positive in all three
countries and significant in Singapore (β
=74.45, p<. 001) and the United States (β
=27.67, p<. 05). That is, students whose
teachers reported that they had been taught
these topics at the eighth-grade level had
significantly higher algebra scores when
compared to those who had not been taught
these topics. In contrast, the students whose
teachers reported that they had been taught
simple linear inequalities at the eighth-
grade level had significantly lower algebra
scores when compared to those who had not
been taught this topic or had been taught it
at an earlier grade, for the Singaporean
students (β=-50.32, p< .001). Notably, there
was a significant positive relationship
between OTL numeric, algebraic and
geometric patterns and students’ algebra
achievement in the United States (β=15.81,
p<. 05), but that relationship was negative
in Botswana and Singapore. Finally, there
was a significant positive relationship
between OTL simplifying and evaluating
algebraic expressions and students’ algebra
achievement in the United States (β=23.86,
p<. 05). In other words, the students whose
teachers reported that they had been taught
about patterns at the eighth-grade level in
the United States had significantly higher
algebra scores when compared to those who
had not been taught the topic at the eighth-
grade level, whereas in the other two
countries the students had significantly
lower algebra scores. The other relationships
between OTL representation of functions
and properties of functions had differing
patterns in the three countries and were not
significant.
Page 20
48 Global Education Review 5(3)
Discussion
The purpose of this study was to investigate
the changes in the OTL algebra in three
selected countries in 2011 and 2015.
Additionally, the study also focused on the
relationships between the OTL algebra
topics and eighth-grade students’ algebra
achievement in the most recent TIMSS cycle,
2015. The investigations were done using the
TIMSS (2011 and 2015) data. The findings
from the study suggest that over the two
cycles, there was an increase in the
percentage of the eighth-grade students’
teachers who reported that they had taught
particular algebra topics before and in
eighth grade. Further, across the three
selected countries relationships between
OTL various algebra topics and eighth-
grade students’ algebra achievement had
differing patterns within the selected
countries. Following is a discussion of the
findings considering the country policies
and earlier studies.
Opportunities to Learn Algebra
Botswana
There was a significant increase in the
percentage of the eighth-grade students’
teachers who reported that they had taught,
simple linear equations and inequalities
and simplifying and evaluating expressions
before eighth grade in 2011 and in 2015.
However, the proportion of teachers who
reported they taught numeric, algebraic,
and geometric patterns before eighth grade
was significantly lower in 2015. A
comparison of 2011 and 2015 data indicated
that the percentage of teachers who taught
the different algebra topics at the eighth-
grade level dropped. In particular, there was
a 6% drop in the percentage of students’
teachers who reported they had taught
simplifying and evaluating expressions at
the eighth-grade, a 15.08% drop who
reported they had taught simple linear
equations, a 11. 86% drop for those who
reported they had taught algebra topics on
patterns, a 16.18% drop in those who
reported they had taught simultaneous
equations, and 4.63% drop for those who
reported they had taught multiple
representations at the eighth-grade level.
The reduced percentage of the students’
teachers who reported teaching these
algebra topics at the eighth-grade level
suggests that some algebra topics may have
been introduced at earlier grades in the later
years. The Ministry of Education in
Botswana requires teachers to introduce
algebra to students through a gradual shift
from using numbers to using letters between
the fifth to seventh grades. Also, students
are expected to be able to simplify linear
equations and solve algebraic equations
using trial and error and substitution
methods at the seventh-grade level
(Kesamang, Mudongo, Keatimilwe &
Botaane, 2012). However, from the teachers’
reports, there is still a significant proportion
of teachers who had not taught the content
before eighth grade.
After the seventh grade, students take
a three-year junior certificate course during
which it is expected they expand their
algebra knowledge to include Gaussian
elimination and substitution to solve
simultaneous equations with two unknowns
(Kesamang, Mudongo, Keatimilwe &
Botaane, 2012). At the end of the three-year
period, the students should be able to
expand and factor linear equations. The
findings from this study indicate that more
than 50% of the teachers were meeting the
requirement of the ministry of education by
focusing more on the required algebraic
Page 21
Opportunities to learn algebra 49
topics by the time the students had
completed their eighth grade. However, it is
worth noting that a considerable proportion
of the teachers in Botswana had not taught
the students’ simultaneous equations and
multiple representations of functions by the
end of eighth-grade.
Singapore
Most of the algebra topics were taught in
eighth grade. However, between 2011 and
2015, more teachers taught simplifying and
evaluating algebraic expressions,
representations of functions, and simple
linear equations and inequalities before the
eighth grade. Notably, more than 60% of the
teachers reported they taught numeric,
algebraic and geometric patterns before
eighth grade. The expectations from the
Ministry of Education in Singapore stress
that more algebra should be taught in the
seventh and eighth grade. Between the
seventh and eighth grade students are
expected to be able to manipulate algebraic
expressions and formulae of linear and
quadratic expressions. Also, students should
have known linear and quadratic functions
and simultaneous equations at these levels.
Further, the teachers are expected to teach
linear inequalities with one unknown (Chin
et al., 2012). However, between first and
sixth grade the students should be taught
“algebraic expressions in one variable” (Chin
et al., 2012, p. 807). From the findings in
this study, it seems that more of the
students’ teachers taught content per the
expectations of the Ministry of Education in
the algebra topics they taught before and at
eighth grade.
The United States
Most of the algebra was taught at the eighth-
grade level. However, before eighth grade,
there was a significant drop in the
percentage of teachers who reported they
taught numeric algebraic and geometric
patterns and sequences before eighth grade
between 2011 and 2015. In contrast, there
was a significant increase in the percentage
of teachers who reported they taught
simplifying and evaluating expressions
before eighth grade between 2011 and 2015.
Also, there was a 5% increase in the
percentage of teachers who taught simple
linear equations and inequalities before
eighth grade. Over the two TIMSS cycles,
more than 75% of teachers reported they
taught properties of functions and
representations of functions at the eighth-
grade level. Sen, Malley, Hodson, and
Werwath (2012) documented that two of the
three critical focal areas in algebra for eighth
grade include, “formulating and reasoning
about expressions and equations, solving
linear equation…function concept and using
functions to describe quantitative
relationships” (p.983). Further, learning
patterns in algebra were expected between
the third and fifth grade, and in the seventh
grade (NGA & CCSSO, 2010). Although
some states have adopted the CCSSM since
2010, it seems that more of the students’
teachers taught numeric, algebraic and
geometric patterns at the eighth-grade level
even though the intended curriculum
indicated from fourth grade onwards.
In sum, in the three countries, the
teachers’ reports indicate a possibility of a
shift in the emphasis of particular algebra
topics across the grades over the years
between 2011 and 2015. In particular, there
seemed to be more emphasis on teaching
numeric, algebraic and geometric patterns
in Singapore and Botswana before eighth
grade. The difference in algebra achievement
may be attributed to the shift in the
Page 22
50 Global Education Review 5(3)
emphasis of the various topics in the grade
levels. A discussion of the relationships
between OTL algebra topics and the eighth-
grade students’ algebra achievement would
provide more information on the influence
of the OTL.
Relationships Between OTL Algebra
and Algebra Achievement
The findings from the multilevel model of
the relationships between OTL algebra and
eighth-grade students’ algebra achievement
suggest that the grade level for teaching
algebra topics mattered. Specifically, the
students whose teachers reported having
taught them simple linear equations and
inequalities and simultaneous equations in
the Singapore before eighth grade had
significantly higher scores than those who
had not been taught these topics or had
these OTL at a later grade. Similarly, in the
United States students who had been taught
properties of functions and simplifying and
evaluating algebraic expressions before
eighth grade, had significantly higher scores.
Particular topics taught at the eighth-
grade level could have positioned some
students at an advantage in their algebra
achievement. For instance, eighth-grade
students whose teachers had taught (i)
numeric, algebraic, and geometric patterns
(ii)simplifying and evaluating algebraic
expressions, and (iii) simultaneous
equations at eighth grade in the United
States, performed significantly higher. In
contrast, the eighth-grade students who had
been taught simple linear equations and
inequalities at eighth grade in Singapore had
lower scores, whereas those who were taught
simultaneous equations at the same level
had significantly higher algebra scores.
These findings support the notion that,
learning some algebra topics in the early
grades could be more advantageous for
students, such as the Singaporean case for
learning simple linear equations and
inequalities.
The higher scores in algebra
achievement in Singapore and the United
States could be attributed to the approaches
used to teach the algebra topics and the
systemic policies allowing for teaching the
topics earlier. For example, numeric,
algebraic, and geometric patterns were to be
taught from the fifth through eighth grade in
the United States and from the first through
eighth grade in Singapore. However, the
intended algebra curriculum indicated that
topics that incorporate patterns were to be
taught from the third grade through eighth
grade. Chan (2015) reported using
manipulatives such as pattern blocks
increased the understanding of algebraic
patterns in early grades. A sequential
development using representations from
concrete to visual and then to symbolic
supported students in identifying patterns
and making generalizations (Chan, 2015).
Although the data did not indicate the
approaches used to teach algebra, it is
probable that there could have been
particular approaches used to introduce this
topic in Singapore and the United States
that were different than those used to teach
the students in Botswana. Perhaps these
approaches to teaching could have made the
difference in students understanding of the
algebra topic.
These findings support previous
findings by Blanton and Kaput (2004) in
which they reported that students in early
grades could understand covariation and
functional thinking in algebra. From the
multi-level model, the findings show that in
the United States, students whose teachers
reported they had taught properties of
Page 23
Opportunities to learn algebra 51
functions before eighth-grade had
significantly higher scores. Although the
descriptive findings showed that only 6% of
the students’ teachers in the United States
reported teaching this topic before eighth-
grade, their students had significantly higher
algebra scores. Gardiner and Sawrey (2016)
found that with the intentional selection of
tasks, the promotion of functional thinking
is possible amongst first graders. Likewise,
the teacher moves that foster persistence
through effective questioning were found to
be effective in teaching the discovery of
patterns and the relationships between
variables (Whitin & Whitin, 2014). In sum,
the findings show that functional thinking in
the early grades can be of advantage for
students’ success in algebraic thinking.
Implications for Practice and
Research
These findings indicate that students enter
high school with different algebra
competencies within countries. Notably,
some of these gaps in their algebra
knowledge may or may not be filled during
high school. In Botswana, students are
taught less algebra in the elementary years
than in Singapore and the United States. As
indicated in this study, some of the algebra
topics can be taught at the lower grades.
Perhaps using particular instructional
practices and problem-solving strategies
make this possible. In the literature (e.g.
Gardiner & Sawrey,2016 ; Whitin & Whitin,
2014), algebraic thinking can be promoted
in lower elementary school grades. Perhaps
what would be beneficial is promoting
approaches to teaching algebraic thinking
amongst pre-service and in-service teachers.
In particular teaching simple linear
equations and inequalities, topics on
patterns, numeric, algebraic and geometric
patterns, simplifying and evaluating
algebraic expressions, and functional
reasoning are some topics that should be
discussed in pedagogy-related professional
development forums. Most important, is
selecting cognitively demanding tasks
(Smith & Stein, 2011) that allow for students
to develop conceptual understanding of
these algebra topics and developing
strategies that promote algebraic thinking.
Further studies that examine how
secondary teachers fill algebra knowledge
gaps in high school mathematics should be
investigated. Also, studies of the OTL
algebra based on student backgrounds might
provide insights on which students are not
learning the early algebra and the effects of
these gaps on their continual success
advanced mathematics. The findings point
to the need for further research on the
instructional strategies used in the
Singapore countries for teaching
simultaneous equations and simple linear
equations and inequalities in before eighth
grade that were related to a significant
higher algebraic score. Also, the pedagogy
related to the successful learning of
functional representation and simplifying
and evaluating algebraic expressions before
eighth grade in the United States is an
agenda for research.
Therefore, OTL various algebra topics
points out an important factor that should
be considered in educational policy. For
example, there is a need for more
discussions and research on (a) important
topics to be learned in algebra; (b)
investigations on the coherence of the
algebra curriculum at the elementary levels
in the schools across different countries; and
(c) the time needed to teach algebra in early
grades and middle school. Finally, the need
for professional development on approaches
Page 24
52 Global Education Review 5(3)
to teaching algebra in the earlier grades
using research-based methods of
instruction.
Notes
1. SPSS is a software package used for
statistical analysis that works on
windows and macintosh operating
systems. It is presently produced by
IBM.
2. HLM software is used for analysis of a
hierarchical linear model. These models
provide improved estimates for within
and between groups, cross level effects
and variance and covariance
components.
References
Bjuland, R. ( 2012). The mediating role of a
teacher’s use of semiotic resources in
pupils early algebraic reasoning. ZDM
Mathematics Education 22 (665-675).
Barungwi, S., Cele, C., Mudongo, C.,
Morake, D., & Hlomani, H. (2008).
Botswana. In I.V.S. Mullis, M.O.
Martin, J.F. Olson, D.R. Berger, D.
Milne, & G.M. Stanco. TIMSS 2007
Encyclopedia: A Guide to
Mathematics and Science Education
Around the World ;Vol. 1 (pp. 103–
109). Chestnut Hill, MA: TIMSS
International Study Center, Lynch
School of education, Boston College.
Retrieved from
http://timssandpirls.bc.edu/timss200
7/PDF/T07_Enc_V1.pdf
Blanton, M., & Kaput, J. (2004). Elementary
grades students’capacity for functional
thinking. Proceedings of the 28th
conference for the International
Group for the Psychology of
Mathematics Education: Vol.2 (pp
135-142).
Blanton, M., & Kaput, J. (2005).
Characterizing a classroom practice
that promotes algebraic reasoning.
Journal for Research in Mathematics
Education, 36(5), 412–446.
Blanton, M., Stephens, A., Knuth, E.,
Gardnier, A.M., Isler, I., & Kim, J.
(2015). The development of children’s
algebraic thinking: The impact of a
comprehensive early algebra
intervention in third grade. Journal
for Research in Mathematics
Education, 46(1)
Blömeke, S., & Delaney, S. (2014).
Assessment of Teacher Knowledge
Across Countries: A Review of the
State of Research. In S. Blömeke, F.-J.
Hsieh, G. Kaiser, & W. H. Schmidt
(Eds.), International Perspectives on
Teacher Knowledge, Beliefs and
Opportunities to Learn (pp. 541–585).
Springer Netherlands. Retrieved from
http://link.springer.com/chapter/10.1
007/978-94-007-6437-8_25
Carnoy, M. (2015). International test score
comparison and educational policy: A
review of the critiques. National
Education Policy Center. Retrieved
from
http://nepc.colorado.edu/publication
/international-test-scores
Chan, H. H. (2015). How do they grow?
Mathematics Teaching in the Middle
School, 20(9),548-555.
Chee et al. (2016). Singapore. In I. V. S,
Mullis, M.O. Martin, S. Goh &
K.Cotter, TIMSS 2015 Encyclopedia:
Education Policy and Curriculum in
Mathematics and Science. Retrieved
from Boston College, TIMSS & PIRLS
International Study Center website:
http://timssandpirls.bc.edu/timss201
5/encyclopedia/
Chin, T. Y., Chua, E. K.-Y., Chua, P. H., Foo,
S. F., Loh, M. Y., Poon, C. L., … Yen, Y.
Page 25
Opportunities to learn algebra 53
P. (2012). Singapore. In I.V.S. Mullis,
M.O. Martin, C. A. Minnich, G. M.
Stanco, A. Arora, V. A. S. Centrino, &
C. E. Castle. TIMSS 2011
Encyclopedia: Education Policy and
Curriculum in Mathematics and
Science. Chestnut Hill, MA: TIMSS
International Study Center, Lynch
School of education , Boston College.
Retrieve from
http://timssandpirls.bc.edu/timss201
1/downloads/TIMSS2011_Enc-v2.pdf
Common Core State Standards Initiative.
(2010). Common core state standards
for mathematics. Retrieved from
http://www.corestandards.org/
Desimone, L. M., Smith, T., Baker, D., &
Ueno, K. (2005). Assessing barriers to
the reform of U.S. mathematics
instruction from an international
perspective. American Educational
Research Journal, 42(3), 501–535.
Floden, R. E. (2002). The measurement of
opportunity to learn. In E. Porter. &
A. Gamoran, Methodological
advances in cross-national surveys of
educational achievement.
Washington, DC: National Academies
Press.
Foy, P., & Olson, J. (2008). TIMSS 2007
User guide for the international
database. Chestnut Hill, MA: TIMSS
& PIRLS International Study Center.
Boston College. Retrieved from
http://timssandpirls.bc.edu/timss200
7/idb_ug.html
Gardiner, M. & Sawrey, K. (2016) First
graders and functional thinking, Part
1 [Web log post]. Retrieved from
http://www.nctm.org/Publications/Te
aching-Children-
Mathematics/Blog/First-Graders-and-
Functional-Thinking,-Part-1/
Graham, M. J., Frederick, J., Byars-
Winston, A., Hunter, A.-B., &
Handelsman, J. (2013). Increasing
persistence of college students in
STEM. Science, 341(6153), 1455–1456.
doi: 10.1126/science.1240487
Guiton, G., & Oakes, J. (1995). Opportunity
to learn and conceptions of
educational equality. Educational
Evaluation and Policy Analysis, 17(3),
323–336.
IBM Corporation. (2012). IBM SPSS
statistics (version 20.0). Somers, NY:
Author.
Kaur, B. (2008, March). Developing
procedural fluency in algebraic
structures: A case study of
mathematics classrooms in Singapore.
In Cross-cultural comparisons in the
teaching of algebra. Symposium
conducted at the American
Educational Research Association,
New York.
Keene, L. (2008). USA. In I.V.S. Mullis,
M.O. Martin, J. F. Olson, D. R. Berger,
D. Milne, & G.M. Stanco. TIMSS 2007
Encyclopedia: A Guide to
Mathematics and Science Education
Around the World (pp. 621–634).
Chestnut Hill, MA: TIMSS
International Study Center, Lynch
School of education, Boston College.
Retrieved from
http://timssandpirls.bc.edu/timss201
1/downloads/TIMSS2011_Enc-v2.pdf
Kesamang, M., Mudongo, C., Keatimilwe, O.,
& Bolaane, T. (2012). Botswana. In
I.V.S. Mullis, M.O. Martin, C. A.
Minnich, G. M. Stanco, A. Arora, V. A.
S. Centrino, & C. E. Castle. TIMSS
Encyclopedia: A guide to
mathematics and science education
around the world (Vol. 1, pp. 177–
190). Chestnut Hill, MA: TIMSS &
PIRLS International Study Center,
Lynch School of Education, Boston
College. Retrieved from
Page 26
54 Global Education Review 5(3)
http://timssandpirls.bc.edu/timss201
1/downloads/TIMSS2011_Enc-v1.pdf
Kieran, C. (2007). Learning and teaching of
algebra at the middle school through
college levels: Building meaning for
symbols and their manipulation. In F.
K. Lester, Jr ( Eds). Second Handbook
of Research in Mathematics Teaching
and Learning (pp. 707–762).
Charlotte, NC: Information Age
Publishing.
Knuth, E., Stephens, A., Blanton, M., &
Gardiner, A. (2016). Build an early
foundation for algebra success. Phi
Delta Kappan, 97(6), 65–68.
Laroche, S. Joncas, M. & Foy, P. ( 2016).
Sample design in TIMSS 2015. In
M.O. Martin, I.V.S. Mullis &M.
Hooper Methods and Procedures in
TIMSS 2015(pp 3.1-3.26). Retrieved
from Boston College, TIMSS & PIRLS
International Study Center website:
http://timssandpirls.bc.edu/timss/20
15-methods.html
MacGregor, M., & Price, E. (2003). An
exploration of language proficiency
and algebra learning. Journal for
Research in Mathematics Education,
30(4), 449–467.
Malley, L.,Neidorf, T., Arora, A., Kroeger, T.
& American Institutes of Research
(2016). United States. In I. V. S,
Mullis, M.O. Martin, S. Goh &
K.Cotter, TIMSS 2015 Encyclopedia:
Education Policy and Curriculum in
Mathematics and Science. Retrieved
from Boston College, TIMSS & PIRLS
International Study Center website:
http://timssandpirls.bc.edu/timss201
5/encyclopedia/
Martínez, M., & Brizuela, B. M. (2006). A
third grader’s way of thinking about
linear function tables. The Journal of
Mathematical Behavior, 25(4), 285–
298.
Masole,T. M., Gabalebatse, M., Guga, T.,
Pharithi, M., Botswana Examination
Council, (2016). Botswana. In I. V. S,
Mullis, M.O. Martin, S. Goh &
K.Cotter, TIMSS 2015 Encyclopedia:
Education Policy and Curriculum in
Mathematics and Science. Retrieved
from Boston College, TIMSS & PIRLS
International Study Center website:
http://timssandpirls.bc.edu/timss201
5/encyclopedia/
Ministry of Education Botswana. (2010).
Botswana junior school syllabus.
Retrieved from www.moe.gov.bw
Ministry of Education Singapore. (2007).
Mathematics syllabus primary.
Retrieved from
https://www.moe.gov.sg/docs/default
-
source/document/education/syllabus
es/sciences/files/2007-mathematics-
(primary)-syllabus.pdf
Moses, R. P., Kamii, M., Swap, S. M., &
Howard, J. (1989). The algebra
project: Organizing in the spirit of
ella. Harvard Educational
Review, 59(4), 423. Retrieved from
https://search.proquest.com/docview
/212244244?accountid=10610
Mullis, I., Martin, M. O., & Foy, P. (2008).
TIMSS 2007 International
mathematics report : Findings from
IEA’s trends in international
mathematics and science study at the
fourth and eighth grades. Chestnut
Hill, MA: TIMSS & PIRLS
International Study Center. Boston
College. Retrieved from
http://timss.bc.edu/timss2007/mathr
eport.html
Mullis, I., Martin, M.O., Foy, P., & Arora, A.
(2012). TIMSS 2015 International
Results in Mathematics. Chestnut
Hill, MA: TIMSS & PIRLS
International Study Center. Boston
Page 27
Opportunities to learn algebra 55
College. Retrieved from
https://timssandpirls.bc.edu/timss20
11/international-results-
mathematics.html
Mullis, I., Martin, M.O., Foy, P., & Hooper,
M. (2016).TIMSS 2015 International
Results in Mathematics. Chestnut
Hill, MA: TIMSS & PIRLS
International Study Center. Boston
College. Retrieved from
http://timssandpirls.bc.edu/timss201
5/international-results/
Nofre, D., Priestley, M., & Alberts, G. (2014).
When technology became language:
The origins of the linguistic
conception of computer programming,
1950–1960. Technology and Culture,
55(1), 40–75.
Oakes, J. (1990). Multiplying inequalities:
The effects of race, social class, and
tracking on opportunities to learn
mathematics and science. Santa
Monica, CA: The RAND Corporation.
Olson, J., Martin, M., & Mullis, I. (2008).
TIMSS 2007 Technical report.
Chestnut Hill, MA: TIMSS & PIRLS
International Study Center. Boston
College. Retrieved from
http://timss.bc.edu/timss2007/techre
port.html
Organization for Economic Cooperation and
Development. (2010). Pisa 2009
Results: What students know and can
do: Student performance in reading,
mathematics and science. OECD
Publishing.
Quek, G., Goh, K. H., Yen, Y. P., Liu, Y. M.,
Tan, Q. L., Chin, T. Y., & Lau, C. Y.
(2008). Singapore. In I.V.S. Mullis,
M.O. Martin, J. F. Olson, D. R. Berger,
D. Milne, & G.M. Stanco. TIMSS 2007
Encyclopedia: A Guide to
Mathematics and Science Education
Around the World (pp. 537–550).
Chestnut Hill, MA: TIMSS
International Study Center, Lynch
School of education , Boston College.
Retrieved from
http://timss.bc.edu/timss2007/PDF/
T07_Enc_V2.pdf
Rakes, C. R., Valentine, J. C., McGatha, M.
B., & Ronau, R. N. (2010). Methods of
Instructional Improvement in Algebra
A Systematic Review and Meta-
Analysis. Review of Educational
Research, 80(3), 372–400.
Raudenbush, S. W., & Bryk, A. S.
(2002). Hierarchical linear models:
Applications and data analysis
methods (2nd ed.). Thousand Oaks:
Sage Publications.
Raykov, T., & Marcoulides, G. A. (2012). An
introduction to applied multivariate
analysis. New York: Routledge Press.
Rutkowski, L., Gonzalez, E., Joncas, M., &
von Davier, M. (2010). International
Large-Scale Assessment Data.
Educational Researcher, 39(2), 142 –
151.
http://doi.org/10.3102/0013189X103
63170
Schmidt, W. H., Blömeke, S., Tatto, M. T.,
Hsieh, F.-J., Cogan, L., & Houang, R.
T. (2011). Teacher education matters:
A study of middle school mathematics
teacher preparation in six countries.
Teachers College Press, Columbia
University New York, NY.
Schmidt, W. H., Cogan, L. S., & Houang, R.
T. (2011). The role of opportunity to
learn in teacher preparation: An
international context. Journal of
Teacher Education, 62(2), 138–153.
Schmidt, W. H., McKnight, C. C., Wang, H.
C., Cogan, L. S., Houang, R. T., Wiley,
D. E., & Wolfe, R. G. (2001). Why
schools matter: A cross national
national comparison of curriculum
and learning. San Francisco, CA:
Jossey-Bass.
Page 28
56 Global Education Review 5(3)
Sen, A., Malley, L., Hodson, C., & Werwath,
T. (2012). The United States. In I.V.S.
Mullis, M.O. Martin, C. A. Minnich, G.
M. Stanco, A. Arora, V. A. S. Centrino,
& C. E. Castle. Timss 2011
Encyclopedia: Education Policy and
Curriculum in Mathematics and
Science (Vol. 2, pp. 975–995). TIMSS
& PIRLS International Study Center,
Lynch School of Education, Boston
College. Retrieved from
http://timssandpirls.bc.edu/timss201
1/downloads/TIMSS2011_Enc-v2.pdf
Smith, M.S., & Stein, M.K. (2011). Five
practices for orchestrating productive
classrooms discussions. Reston, VA:
National Council of Teachers of
Mathematics.
Tanışlı, D. (2011). Functional thinking ways
in relation to linear function tables of
elementary school students. The
Journal of Mathematical Behavior,
30(3), 206–223.
Törnroos, J. (2005). Mathematics textbooks,
opportunity to learn and student
achievement. Studies in Educational
Evaluation, 31(4), 315–327.
http://doi.org/10.1016/j.stueduc.200
5.11.005
Wang-Iverson, P., Myers, P., & Lim, E.
(2010). Beyond Singapore’s
mathematics textbooks: Focused and
flexible supports for teaching and
learning. American Educator, 28-38.
Warren, E., Cooper, T., & Lamb, J. (2006).
Investigating functional thinking in
the elementary classroom:
Foundations of early algebra
reasoning. The Journal of
Mathematical Behavior, 25(3), 208–
223.
Whitin, D. J., & Whitin, P. (2014). Building
Squares and Discovering Patterns.
Teaching Children Mathematics,
21(4), 210–219.
About the Author
Rachel Ayieko, Phd, is an Assistant
professor in Mathematics Education in the
Department of Instruction and Leadership
in Education. Her research interests include
exploring the teaching practices that
promote conceptual understanding of
mathematics, algebra teaching and learning,
teacher quality, and the opportunities to
learn to teach and learn mathematics using
large-scale data sets and classroom
observation schemes. Her recent research
focuses on the relationships between the
opportunities that pre-service teachers have
to learn to teach elementary school
mathematics and their knowledge and
beliefs about teaching and learning
mathematics using the international Teacher
Education and Development Study of
Mathematics (TEDS-M).


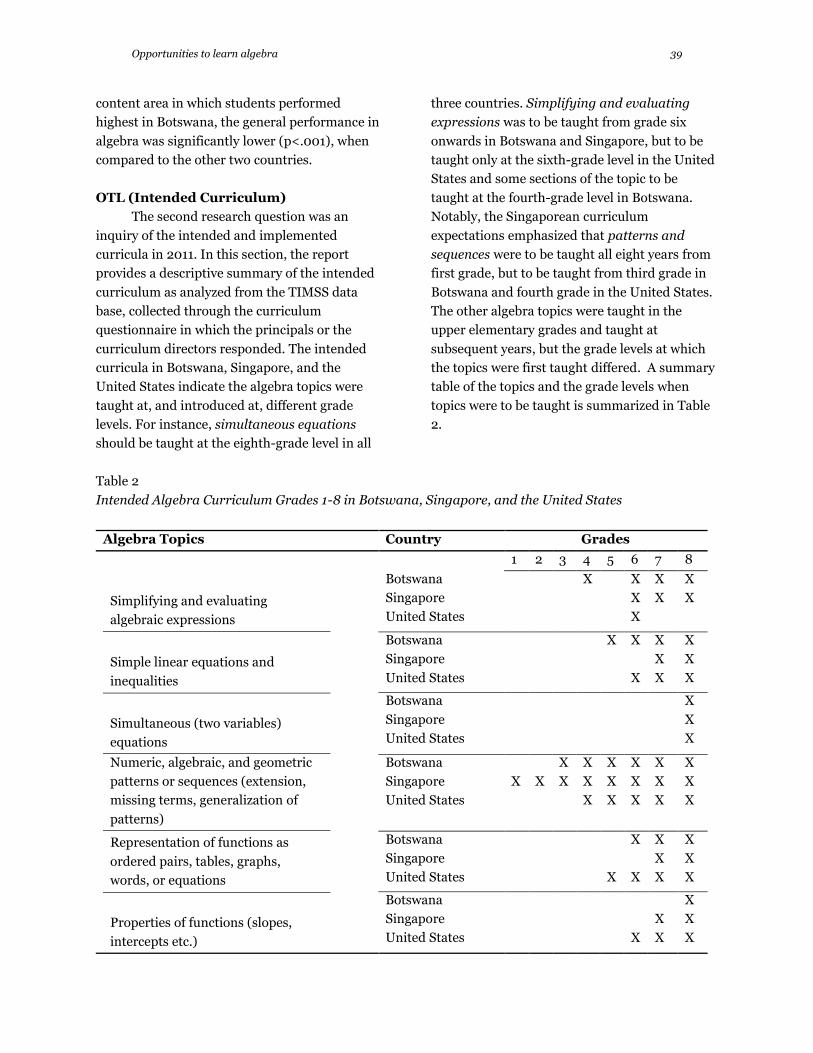


![ALGEBRA 2/TRIGONOMETRY - Plainvie · x (0,1) Algebra 2/Trigonometry – January ’13 [2] Use this space for 3 The relationship between , a student’s test scores, and t, computations.d](https://static.documents.pub/doc/80x56/5eda7772b3745412b57163c4/algebra-2trigonometry-x-01-algebra-2trigonometry-a-january-a13-2-use.jpg)


