THE RELATIONSHIP BETWEEN RESPIRATORY SINUS ARRHYTHMIA,
AFFECTIVE DECISION-MAKING AND PSYCHOPATHIC TRAITS
IN AGGRESSIVE YOUTH
by
HALEY LAVINDER FORD
JOHN E. LOCHMAN, COMMITTEE CHAIR ANSLEY GILPIN
JEFF PARKER MARTI RICE
MARTIN SELLBOM
A DISSERTATION
Submitted in partial fulfillment of the requirements for the degree of Doctor of Philosophy
in the Department of Psychology in the Graduate School of
The University of Alabama
TUSCALOOSA, ALABAMA
2012
ii
ABSTRACT
The current study, which is a secondary data analysis from a larger grant-funded
intervention research project, attempted to elucidate the relationship between psychopathic traits,
respiratory sinus arrhythmia, and performance on the Iowa Gambling Task. Approximately 120
10- and 11- year-old children were initially assessed at baseline, and 111 participants (67% male)
comprised the final sample. Parents reported on observed behaviors indicative of psychopathic
traits, as measured by the Antisocial Process Screening Device (i.e., impulsivity/conduct
problems, callous-unemotional traits, and boldness). Children also completed the computerized
version of the Iowa Gambling Task, an affective decision-making task with risky and
advantageous decks of cards. During the task, electrodes measured interbeat interval, from
which respiratory sinus arrhythmia was derived. While none of the analyses examining the
influence of RSA, psychopathic traits, and their interaction was significant, a developmental
trend was observed with regard to performance on the IGT and CU traits. Specifically, the
correlation between CU traits and IGT performance in block five was significant for the oldest
third of the sample, which suggests that affective decision-making is influenced by
developmental level. This finding suggests that examining the construct of affective decision-
making in young samples is valid, but perhaps only in older youth (i.e., at least 10.5 years old in
this sample).
iii
LIST OF ABBREVIATIONS AND SYMBOLS
ACC Anterior cingulate cortex
ADHD Attention Deficit/Hyperactivity Disorder
ANS Autonomic nervous system
APSD Antisocial Process Screening Device
BASC Behavioral Assessment System for Children
CBCL Child Behavior Checklist
CD Conduct Disorder
CNS Central nervous system
CU Callous unemotional
DBD Disruptive behavior disorders
DLPFC Dorsolateral prefrontal cortex
HR Heart rate
IBI Interbeat interval
IGT Iowa Gambling Task
IQ Intelligence quotient
IMP/CP Impulsivity/Conduct problems
M Mean
N Sample size
NPIC Narcissism Personality Inventory-Children
ODD Oppositional Defiant Disorder
OFC Orbitofrontal cortex
p Probability associated with the occurrence under the null hypothesis
iv
PCL:R Psychopathy Checklist-Revised
PCL:YV Psychopathy Checklist: Youth Version
PFC Prefrontal cortex
PNS Parasympathetic nervous system
PPI Psychopathic Personality Inventory
r Pearson product-moment correlation
RSA Respiratory sinus arrhythmia
RSA-R Respiratory sinus arrhythmia-reactivity
SC Skin conductance
SCR Skin conductance reactivity
SD Substance dependence
SD Standard deviation
SE Standard error
SNS Sympathetic nervous system
SRP-II Self-Report Psychopathy Scale-II
VPC Ventromedial prefrontal cortex
VT Vagal tone
α Cronbach’s index of internal consistency
< Less than
> Greater than
= Equal to
v
ACKNOWLEDGEMENTS
I would like to express my appreciation to everyone who helped me through the various
stages of completing this dissertation. First, thank you to my dissertation committee. To my
advisor, Dr. John Lochman, you supported my interest in working with physiological data by
funding my attendance at a workshop, helped me navigate the numerous challenges posed by the
physiological data, and provided guidance while also fostering my independence. To the other
members of my committee, Dr. Martin Sellbom, Dr. Ansley Gilpin, Dr. Jeff Parker, and Dr.
Marti Rice, you provided me with invaluable feedback at the different stages of my dissertation.
You helped me to think even more critically about the questions I was asking in my project and
how to better approach the analyses as well as the conceptualization of both the overall project
and specific constructs.
I would also like to thank Dr. Keri Heilman at the University of Illinois at Chicago for
providing guidance on editing the physiological data and giving advice on how to approach my
analyses using respiratory sinus arrhythmia in a meaningful manner. Finally, Dr. Heilman also
provided me with additional resources to answer some of the more technical questions that arose
while working on this project.
Dr. Jim Mintz of the STRONG STAR research consortium at the University of Texas
Health Science Center at San Antonio generously provided several hours of his time to help me
with the numerous challenges I faced with data analysis. He carved out time for me at a very
busy time in our office, and I am incredibly grateful for his advice and input. And, perhaps even
more importantly, Dr. Mintz was a source of much needed humor that helped me to maintain my
focus and determination.
vi
Finally, to my family and friends—To my mother and father, your constant support has
been much needed and appreciated throughout all of graduate school. I am finally done, and I
cannot wait to share graduation day with you. I would not have made it this far without both of
you. To my friends, there are too many of you to list everyone, but you know who you are. I
truly could not have done this without your support, which got me through the toughest phases of
my dissertation. Nonetheless, I do want to mention a few who were there for me at various times
during this process: Marie Moore Channell, Melissa Machac, Tiarney Ritchwood, Sarah Ryan,
Finis Nabors, and “Captain” Keith. In each of your own ways, you provided support and
encouragement that has been incredibly meaningful to me.
vii
CONTENTS
ABSTRACT ……………………………………………………………………….………………….ii
LIST OF ABBREVIATIONS AND SYMBOLS ………………………..……………………...........iii
ACKNOWLEDGEMENTS ……………………………………………………………………...........v
LIST OF TABLES ……………………………………………………………………………………iv
LIST OF FIGURES ……...……………………………………………………………………….....xiii
1. INTRODUCTION …...………………………………………………………………………..........1
a. Psychopathy……………………………………...………………………………………………….2
b. Neurobiology of Psychopathy……….………………………...…………………………………..11
c. Psychopathic Traits and Psychophysiology…...…………………………………………………...13
d. Affective Decision-making…………………………….……………………………………..........23
e. Hypotheses and Research Questions…………………………..……………………………..........31
2. METHODS...……………………………………...………………………………………….........33
a. Recruitment and Screening of Participants………………………………………………………...33
b. Procedure…………………………………………………………………………………………..35
c. Screening Measures………………………………………………………………………………..36
d. Time 1 Pre-intervention Measures……………………………………………………………..…..37
e. Missing Data……………………………………………………………………………………….41
f. Power Analysis………………………...………………………………………………………….. 44
3. DATA ANALYSIS AND RESULTS……………………………………………………………..45
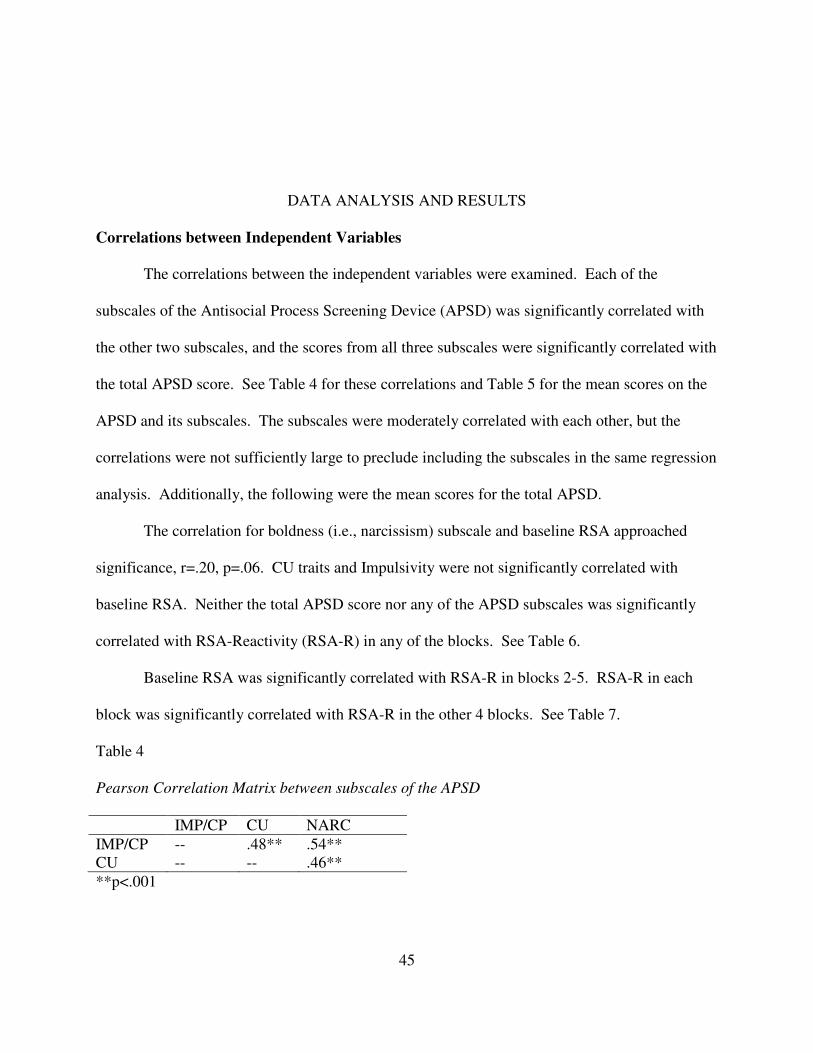
a. Correlations between Independent Variables……………………………………………………...45
b. Correlations between Independent and Dependent Variables………………………………..........46 c. IGT Performance and Correlations by Block……………………………………………………...48 d. Potential Covariates……...…………………………………………………………………...........49
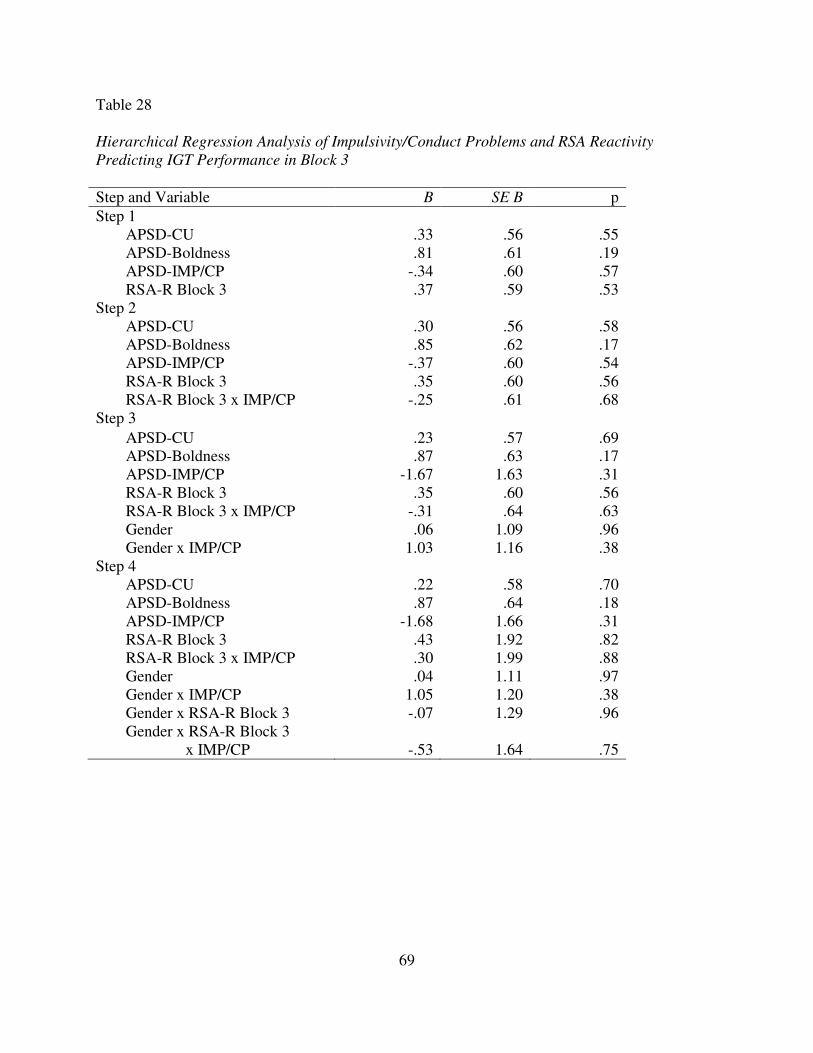
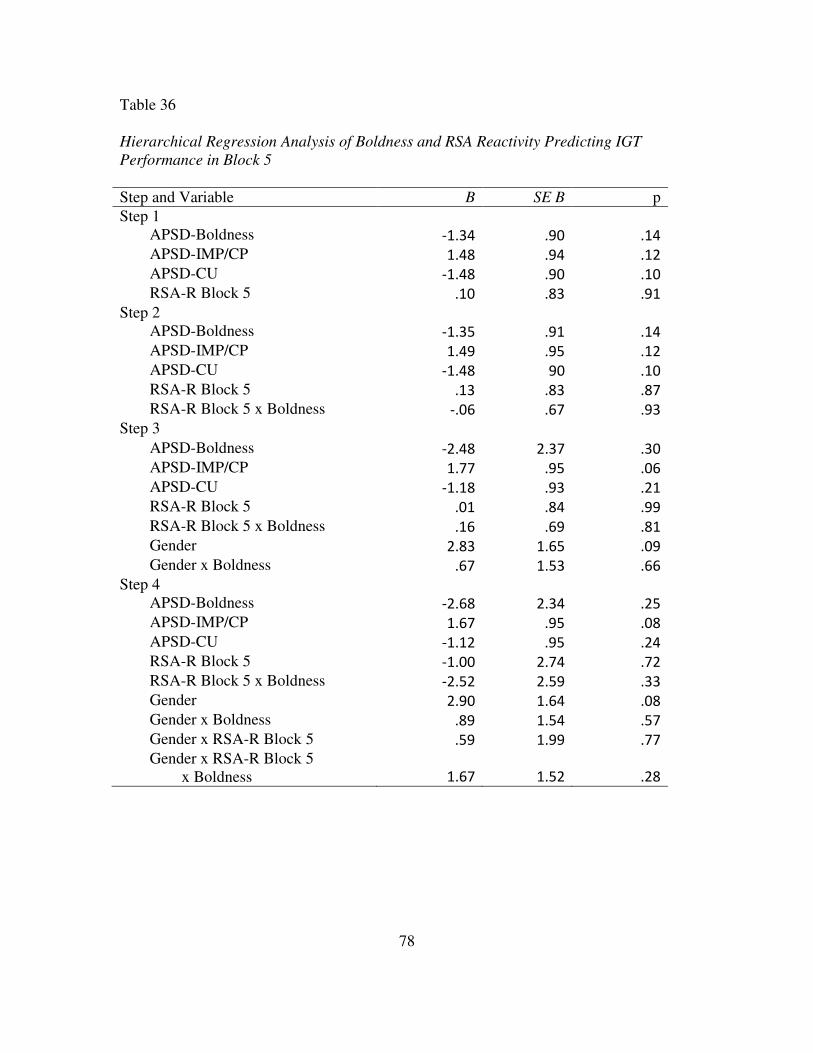
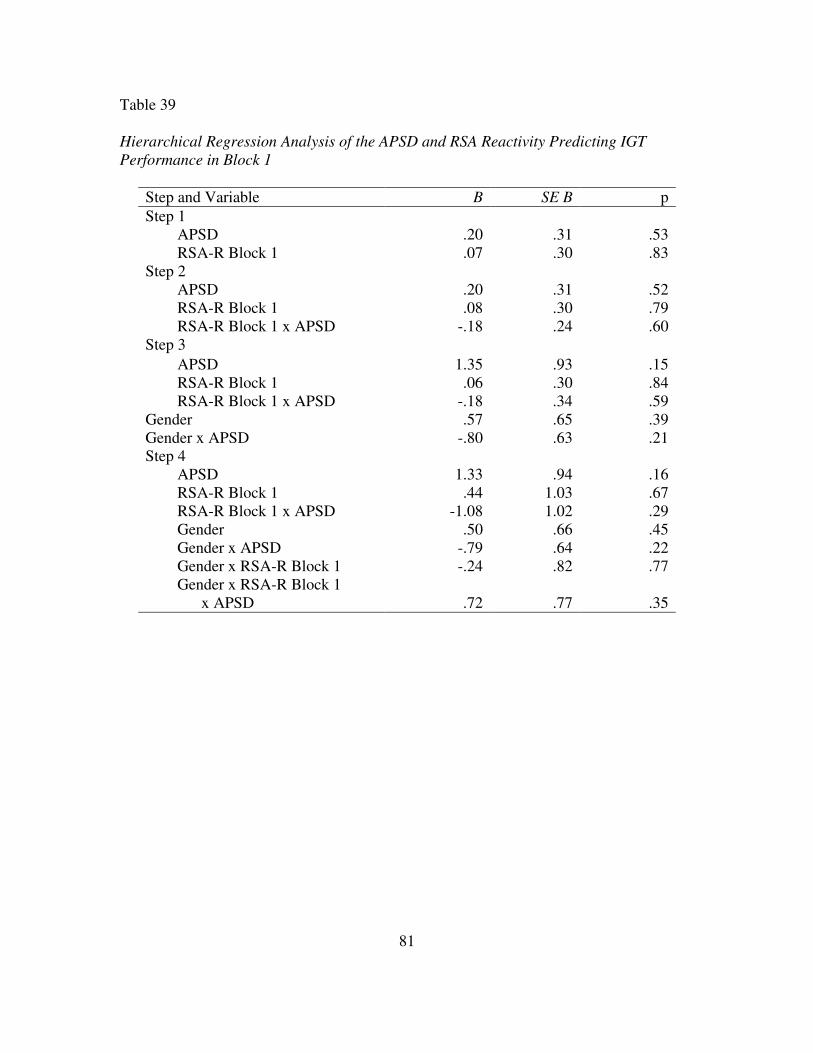
e. Primary Analyses……………………………...……………………………………………...........50
viii
f. Secondary Analyses…………………..………………………………………………………..…. 57
4. DISCUSSION…………………………………………………………………………………..… 95
a. Main Effects of Psychopathy and Respiratory Sinus Arrhythmia………………………….…….. 95
b. Physiological Activity and IGT Performance……………………...……………………….…….. 96
c. Psychopathic Traits, RSA, and IGT Performance……………...…………………………………..97
d. Developmental Differences………………………….………………………….…………….….. 99 e. Measurement Issues………………………….………………………….………………………..100
f. Limitations………………………….………………………….………………………….............103
g. Strengths and Future Directions………………………………………………………………….104
5. REFERENCES…………………………………………………………………………………...106
6. APPENDIX A……………………………………………………………………………………118
ix
LIST OF TABLES
1. Percent Missing Data in Entire Sample…………………...……………………………..43
2. Percent Missing Data for Boys and Girls………………………………………………..43
3. Pooled Skewness and Kurtosis…………………………………………………………..44
4. Pearson Correlation Matrix between subscales of the APSD………................................45
5. Mean scores on the APSD and it subscales……………………………………………...46
6. Pearson Correlation Matrix between Baseline RSA or RSA Reactivity and Psychopathy……………………………………………………………………………...46
7. Pearson Correlation Matrix between Baseline RSA and RSA Reactivity…………….....46
8. Pearson Correlation Matrix between the Iowa Gambling Task and RSA…………….....47
9. Pearson Correlation Matrix between the Iowa Gambling Task and the APSD……….....48
10. Mean Score by Block on the IGT………………………………………………………..48
11. Pearson Correlation Matrix between blocks on the Iowa Gambling Task………………49
12. Pearson Correlation Matrix between Baseline RSA or RSA Reactivity and Internalizing Problems……………..……………..……………..……………..………………………49
13. Hierarchical Regression Analysis of the APSD and Baseline RSA Predicting IGT Performance in Block 3……………..……………..……………..……………………...51
14. Hierarchical Regression Analysis of the APSD and Baseline RSA Predicting IGT
Performance in Block 4……………..……………..……………..……………………...52
15. Hierarchical Regression Analysis of the APSD and Baseline RSA Predicting IGT Performance in Block 5……………..……………….……………..……………………53
16. Hierarchical Regression Analysis of the APSD and RSA Reactivity Predicting IGT
Performance in Block 3……………..…………………………………………………...54
17. Hierarchical Regression Analysis of the APSD and RSA Reactivity Predicting IGT Performance in Block 4………………………………………………………………….55
x
18. Hierarchical Regression Analysis of the APSD and RSA Reactivity Predicting IGT Performance in Block 5………………………………………………………………….56
19. Hierarchical Regression Analysis of CU Traits and Baseline RSA Predicting IGT
Performance in Block 3……………………………………………………………….…59
20. Hierarchical Regression Analysis of CU Traits and Baseline RSA Predicting IGT Performance in Block 4……………………………………………………………….…60
21. Hierarchical Regression Analysis of CU Traits and Baseline RSA Predicting IGT Performance in Block 5……………………………………………………………….…61
22. Hierarchical Regression Analysis of CU Traits and RSA Reactivity Predicting IGT
Performance in Block 3……………………………………………………………….…62
23. Hierarchical Regression Analysis of CU Traits and RSA Reactivity Predicting IGT Performance in Block 4………………………………………………………………….63
24. Hierarchical Regression Analysis of CU Traits and RSA Reactivity Predicting IGT Performance in Block 5……………..…………………………………………………...64
25. Hierarchical Regression Analysis of Impulsivity/Conduct Problems and Baseline RSA Predicting IGT Performance in Block 3……………………………………………..…..66
26. Hierarchical Regression Analysis of Impulsivity/Conduct Problems and Baseline RSA Predicting IGT Performance in Block 4……………………………………………..……….67
27. Hierarchical Regression Analysis of Impulsivity/Conduct Problems and Baseline RSA Predicting IGT Performance in Block 5………….……………………………………...68
28. Hierarchical Regression Analysis of Impulsivity/Conduct Problems and RSA Reactivity Predicting IGT Performance in Block 3………………………………………...……………69
29. Hierarchical Regression Analysis of Impulsivity/Conduct Problems and RSA Reactivity Predicting IGT Performance in Block 4…………………………………………………….69
30. Hierarchical Regression Analysis of Impulsivity/Conduct Problems and RSA Reactivity
Predicting IGT Performance in Block 5……..……………………………………………70
31. Hierarchical Regression Analysis of Boldness and Baseline RSA Predicting IGT Performance in Block 3………………………………………………………………….…..72
32. Hierarchical Regression Analysis of Boldness and Baseline RSA Predicting IGT
Performance in Block 4…………………………………………………………………..….73
xi
33. Hierarchical Regression Analysis of Boldness and Baseline RSA Predicting IGT Performance in Block 5………………………..……………………………………………..74
34. Hierarchical Regression Analysis of Boldness and RSA Reactivity Predicting IGT
Performance in Block 3………………………………….…………………..………………75
35. Hierarchical Regression Analysis of Boldness and RSA Reactivity Predicting IGT Performance in Block 4…………………………………………………………………..…76
36. Hierarchical Regression Analysis of Boldness and RSA Reactivity Predicting IGT
Performance in Block 5………………………………………………………………….….77
37. Hierarchical Regression Analysis of the APSD and Baseline RSA Predicting IGT Performance in Block 1………………………………………………………………….78
38. Hierarchical Regression Analysis of the APSD and Baseline RSA Predicting IGT
Performance in Block 2………………………………………………………………….80
39. Hierarchical Regression Analysis of the APSD and RSA Reactivity Predicting IGT Performance in Block 1………………………………………………………………….81
40. Hierarchical Regression Analysis of the APSD and RSA Reactivity Predicting IGT
Performance in Block 2………………………………………………………………….82
41. Hierarchical Regression Analysis of CU Traits and Baseline RSA Predicting IGT Performance in Block 1……………………….……………..………………..…………….83
42. Hierarchical Regression Analysis of CU Traits and Baseline RSA Predicting IGT
Performance in Block 2…………………………………...………………..……………….84
43. Hierarchical Regression Analysis of CU Traits and RSA Reactivity Predicting IGT Performance in Block………………………..……………………………..………………..85
44. Hierarchical Regression Analysis of CU Traits and RSA Reactivity Predicting IGT
Performance in Block 2………………………………………………………………..……..86
45. Hierarchical Regression Analysis of Impulsivity/Conduct Problems and Baseline RSA Predicting IGT Performance in Block 1……………………………………………………87
46. Hierarchical Regression Analysis of Impulsivity/Conduct Problems and Baseline RSA
Predicting IGT Performance in Block 2…………………………………...…….…………88
47. Hierarchical Regression Analysis of Impulsivity/Conduct Problems and RSA Reactivity Predicting IGT Performance in Block 1………………………………...……………….…89
xii
48. Hierarchical Regression Analysis of Impulsivity/Conduct Problems and RSA Reactivity Predicting IGT Performance in Block 2………………………...……………………..…...90
49. Hierarchical Regression Analysis of Boldness and Baseline RSA Predicting IGT
Performance in Block 1……………………………………….……………………………..91
50. Hierarchical Regression Analysis of Boldness and Baseline RSA Predicting IGT Performance in Block 2……………………………………………..……………………….92
51. Hierarchical Regression Analysis of Boldness and RSA Reactivity Predicting IGT
Performance in Block 1……………………………………………………………...……….93
52. Hierarchical Regression Analysis of Boldness and RSA Reactivity Predicting IGT Performance in Block 2………………………………………………………..……………..94
1
INTRODUCTION
Research on psychopathy has proliferated over the past few decades, and more recently,
there has been increasing focus on youth who exhibit psychopathic traits. The heightened interest
in youth with psychopathic traits is largely due to the high cost society incurs (Cohen, 1998) as
well as the need for earlier and more accurate identification of such youth, since treatment
outcomes for many forms of psychopathology, including conduct problems, in youth are better
when intervention is started earlier (Webster-Stratton, Reid, & Hammond, 2004). With regard to
early and accurate identification, research has shown differences in physiological activity in
youth with conduct problems and psychopathic traits when compared to non-clinical youth,
which may be able to assist in enhancing identification of youth exhibiting these traits.
However, little physiological research has examined respiratory sinus arrhythmia and its
relationship to psychopathic traits. Finally, individually, psychopathic traits and respiratory
sinus arrhythmia have been shown to influence decision-making, but the joint influence of these
variables on decision-making has not been examined, which is the primary focus of this project.
Thus, these variables may also have implications for assessment and intervention (i.e., nature of
and response to treatment). For example, one possibility is that youth with psychopathic traits
and low baseline respiratory sinus arrhythmia (RSA) could be less responsive to treatment due to
their biological and psychological makeups.
This paper opens with a description of the construct of psychopathy and then discusses its
presentation in youth (i.e., interpersonal, affective, and behavioral deficits). The next section
addresses measurement of psychopathic traits in adults and youth, which is followed by a
2
discussion of the neurobiology of psychopathy. Then, the paper focuses on psychopathic traits
and psychophysiology (e.g., heart rate, and respiratory sinus arrhythmia). Additionally, the vagal
regulation of emotions, the relationship between RSA and psychopathology, and gender
differences in RSA are discussed. After describing the role of RSA in emotion regulation, the
relationship between the vagus nerve, brain dysfunction, and psychopathy is examined. Finally,
affective decision-making (e.g., the Iowa Gambling Task), and how psychopathic traits influence
it are discussed.
Psychopathy
Psychopathy is a personality disorder with affective (e.g., callousness), interpersonal
(e.g., manipulative), and behavioral (e.g., impulsivity) deficits (Dolan, 2008). Adults with
psychopathic traits are characterized as remorseless, irresponsible, arrogant, impulsive, and
callous (Marsee, Silverthorn, & Frick, 2005). Individuals with psychopathic traits are also
described as exploitive, cunning, fearless, thrill seeking, and lacking in the ability to share
affection or positive bonds with others (Vaughn & Howard, 2005).
Psychopathy and Criminal Behavior in Youth
Early research on psychopathy focused primarily on adults, but the construct was
extended downward to youth for two main reasons (Vaughn & Howard, 2005). First, research
has shown that psychopathic traits can be identified in youth (Vaughn & Howard, 2005), and
such youth begin engaging in criminal activity at younger ages than their non-psychopathic
counterparts (Falkenbach, Poythress, & Heide, 2003). Psychopathic youth are characterized by
not only their early involvement in delinquent and violent acts, they have school problems, such
as truancy or dropping out, problems with substance abuse, and mental health problems
(Vaughn, Howard, & DeLisi, 2008). Overall, youth with psychopathic traits are conceptualized
3
as impulsive, interpersonally exploitative, lacking guilt and fear, thrill seeking, callous, low
anxiety, aggressive, and lacking the ability to forge warm bonds with others (Vaughn et al.,
2008). As an example, a 4th grader with psychopathic traits likely exploits his peers to get what
he wants and exhibits little remorse or anxiety about doing so. While he may be superficially
charming, he has few close friends due to his exploitative nature and inability to form
meaningful emotional connections with others.
Similarly, Dolan and Rennie (2006) found that total Psychopathy Checklist: Youth
Version (PCL:YV) scores were negatively correlated with age of first arrest and age of first
committing undetected criminal behavior (i.e., criminal justice system not aware of the criminal
activity). Additionally, youth meeting criteria for psychopathy commit a wider variety of crimes,
continue offending for a longer period of time, and carry out more acts of physical aggression
(Vaughn & Howard, 2005), which underscores the importance of identifying these youth as early
as possible.
Moffitt, Caspi, Harrington, & Milne (2002) have identified two types of offenders,
adolescent-limited and life-course persistent. The latter type closely resembles psychopathic
individuals with regard to severity and stability of criminal offending. Additionally, early-onset
antisocial behavior typically worsens and persists into adulthood (Frick et al., 2003; Moffitt,
1993). In contrast, the adolescent-limited subgroup engages in developmentally normal levels of
delinquent behavior that starts later and then declines as these youth enter adulthood (Moffitt,
1993; Van Lier, Wanner, & Vitaro, 2007). For example, in a follow-up study of males at age 26,
Moffitt et al. (2002) found that the life-course persistent subtype had committed significantly
more crimes, regardless of offense type, as well as significantly more drug-related and violent
crimes than the adolescent-limited subgroup. Similarly, Marsee et al. (2005) found that
4
psychopathic traits in youth predict more severe and on-going conduct problems and delinquent
behavior at a 4-year follow-up. These findings suggest that early identification of youth with
psychopathic traits is important because they are at greater risk of chronic criminal activity and
violent offending (Falkenbach et al., 2003).
Psychopathic Traits in Juveniles
Given that the construct of psychopathy is associated with chronic and severe
delinquency and criminal activity, research, described below, has examined how the different
facets of psychopathy influence the behavior of youth. The three facets described below are
affective deficits, interpersonal deficits, and behavioral deficits (Vitacco, Rogers, & Neumann,
2003).
Affective deficits. Research on psychopathic traits in youth has suggested that affective
deficits, including callous-unemotional (CU) traits, are central to the construct of psychopathy
(Shirtcliff et al., 2009). Drawing from this research, affective deficits have differentiated
between adult offenders with and without psychopathic traits and between subtypes of conduct-
disordered children (Vincent, Vitacco, Grisso, & Corrado, 2003). Youth with high levels of CU
traits exhibit fearlessness, shallow emotions, a lack of empathy, remorselessness, and emotional
detachment (Herpetz & Sass, 2000). Specifically, children with conduct disorder who also have
high levels of CU traits engage in antisocial behavior with greater frequency and severity than do
conduct-disordered children without CU traits (Barry et al., 2000; Christian, Frick, Hill, Tyler, &
Frazer, 1997). Vincent et al.’s (2003) results highlight the importance of considering the role of
affective deficits, particularly CU traits, in identifying those youth who are likely to possess
many characteristics associated with psychopathy and who are more prone to engaging in very
severe antisocial behavior (Barry et al., 2000; Loeber, Burke, & Lahey, 2002; Vitacco et al.,
5
2003). Finally, such youth typically begin engaging in antisocial behavior at a younger age (i.e.,
under 10) than youth without CU traits (Silverthorn, Frick, & Reynolds, 2001).
Interpersonal deficits. The interpersonal features of psychopathy include being
manipulative, deceitful, superficially charming, glib, and grandiose (Pardini & Loeber, 2007).
Additionally, these individuals are irresponsible or unresponsive in their relationships, and they
form tenuous or short-lived bonds to others (Herpetz & Sass, 2000). Individuals with
interpersonal deficits tend to be generally unresponsive toward others, which frequently results
in unstable relationships (Andrade, 2008). Interpersonal deficits have also been linked to
narcissism, which is described as having a deceitful and arrogant interactional style (Marsee et
al., 2005). Individuals with interpersonal deficits often engage in pathological lying and
typically fail to accept responsibility for their actions (Andrade, 2008). Finally, egocentricity
and inflated views of oneself are also associated with this facet of psychopathy (Klopf, Kofler-
Westergren, & Mitterauer, 2007).
Behavioral deficits. Research has commonly suggested that impulsivity is another key
component of antisocial behavior (White et al., 1994). In support of this hypothesis, youth who
are behaviorally impulsive are significantly more likely to have a history of chronic, severe
delinquency. Additionally, according to Moffitt (1993), impulsivity contributes to persistent
antisocial behavior through indirect as well as direct mechanisms. For example, impulsive youth
are unable to consider the consequences of their antisocial behavior (i.e., poor self-monitoring).
Insufficient self-monitoring in impulsive individuals may explain their behavior in situations
where the immediate positive outcomes outweigh possible future adverse consequences
stemming from their delinquent actions (Moffitt). Indirectly, impulsivity is often associated with
poor performance in school, which often leads to early termination of education and, in turn,
6
fewer opportunities to amass socioeconomic advantages. These youth are more likely to
continue resorting to antisocial activities because of their limited prospects of achieving success
via traditional means (White et al., 1994).
Measurement of Psychopathic Traits in Youth
Once the psychopathy construct had been defined and characterized, researchers shifted
their focus to assessing psychopathic traits. Initial efforts focused on assessing psychopathic
traits in adults. The Psychopathy Checklist-Revised (PCL-R) has been the gold standard for
assessing psychopathy in adults (Cooke & Michie, 2001), and a version for children and
adolescents, the Psychopathy Checklist: Youth Version (PCL:YV) was developed by Hare and
colleagues (Forth, Kosson, & Hare, 2003). These measures are cumbersome due to a time-
consuming interview and review of mental health and criminal records (Vaughn & Howard,
2005). Because of these drawbacks, the direction in the field shifted toward self-assessment
measures of psychopathy. Furthermore, as the construct was extended developmentally
downward, researchers shifted their attention to measuring these traits in youth, as those with
early-onset delinquent behavior are at greater risk of engaging in more chronic and severe
antisocial behaviors (Moffitt, 1993; Poythress, Dembo, Wareham, & Greenbaum, 2006). While
several measures assessing psychopathic traits in youth have been developed (e.g., Youth
Psychopathic Inventory, Childhood Psychopathy Scale), one of the more commonly used
measures is the Antisocial Process Screening Device (APSD), which was developed by Frick and
Hare (2001).
Factor structure of the APSD. The APSD assesses three constellations of psychopathic
traits: impulsivity, narcissism, and CU traits (Lee, Vincent, Hart, & Corrado, 2003). However,
the factor structure of the APSD is not clear, as the data supported both a two-factor and a three-
7
factor solution. Specifically, a two-factor solution consisting of an impulsivity/narcissism factor
and a CU factor was initially found in a sample of clinic-referred children and in a community
sample of children (Frick, Bodin, & Barry, 2000). For the three-factor solution, the items
comprising the impulsive/narcissism factor loaded onto separate factors, and these three
dimensions are analogous to the factors in Cooke and Michie’s (2001) model of psychopathy.
Frick et al. (2000) used confirmatory factor analysis to test the overall fit of the three-factor
model from the community sample in the clinical sample, and they found that the two-factor
model, which combined the narcissism and impulsivity items into one factor, fit the data better
than the three-factor model. The three-factor model also demonstrated acceptable fit, but the
addition of the third factor did not significantly improve this model’s fit (Frick et al., 2000).
Psychometric properties. The construct validity of both the parent-rated and teacher-
rated versions of the APSD has been supported by several lines of research (e.g., Blair, Monson,
& Frederickson, 2001; O’Brien & Frick, 1996). For example, compared to normally developing
children and children with low APSD scores, children with higher scores on the APSD exhibited
decreased physiological responses to both threatening and distress cues, a finding that is
consistent with research on adult psychopaths (Blair, 1999) and on aggressive and oppositional
behavior (Christian et al., 1997). Research has also shown that children with higher scores on
the CU factor have had more interactions with police and both a wider array and larger number
of conduct disorder symptoms (Frick, 1995). Falkenbach et al.’s (2003) results indicated that the
APSD total score and both factor scores were significantly correlated with juveniles’ non-
compliance with sanctions imposed by a juvenile diversion program, and all three scores also
predicted recidivism. The internal consistency of the parent-rated APSD total score ranges from
.83-.84 (Falkenbach et al., 2003, Vaughn, Edens, Howard, & Smith, 2009). However, for the CU
8
and IMP/CP subscales the internal consistencies were .56 and .72, respectively (Falkenbach et
al., 2003). Limitations of the APSD include having only one item corresponding to each
Psychopathy Checklist Revised (PCL-R) trait and a greater likelihood of response biases due to
items directly assessing negative traits when used as a self-assessment (Andershed, Gustafson,
Kerr, & Stattin, 2002).
Research suggests that the APSD accurately identifies both children with particularly
severe antisocial behavior and conduct problems and juvenile offenders who are especially
predatory. Furthermore, children with high scores on the APSD, particularly on the CU factor,
possess traits similar to those seen in psychopathic adults (Barry et al., 2000). For example, high
scoring youth exhibit greater thrill seeking behaviors than children with lower scores (Frick,
O’Brien, Wootton, & McBurnett, 1994). Collectively, these findings indicate that the APSD
may be a useful tool in assessing psychopathic traits in children.
However, some unexpected results that deviate from findings in research on adult
psychopathy have been obtained. In adults with psychopathic traits, psychopathy has
demonstrated slight or negative relations with some personality traits, such as introversion, but
different patterns emerge from research in youth with psychopathic traits (Salekin, Neumann,
Leistico, DiCicco, & Duros, 2004). According to Salekin et al. (2004), in a sample of adolescent
offenders, introversion was significantly and positively correlated with the APSD (r=.33, p<.01)
and, while not significant, the PCL:YV demonstrated a similar correlation of .25. Overall, the
APSD had the highest convergent validity (.43), followed by the Self-Report Psychopathy scale-
II (SRP-II) (.42), and then by the PCL:YV (.36), but these coefficients did not differ significantly
from each other. In contrast, the APSD had higher discriminant validity coefficients (range=.39-
.42) for the clinical and psychosocial scales on the Adolescent Psychopathology Scale than the
9
PCL:YV (range .27-.28) and the SRP-II (.20-.27). Generally, across measures, psychopathy was
more strongly correlated with externalizing or disruptive behavior problems than with
internalizing problems (Salekin et al.).
Gender Differences. Additionally, most research on youth with aggressive behaviors
and psychopathic traits either has studied exclusively boys or substantially more boys than girls
(Marsee et al., 2005). However, studies with male and female children have found differences in
degrees of psychopathic traits. A common finding is that boys typically have higher scores on
the total APSD than girls (Dadds, Fraser, Frost, & Hawes, 2005; Marsee et al., 2005). Dadds et
al. (2005) also found that boys scored higher than girls on all three subscales. Additionally, for
girls only, psychopathic traits were significantly related to relational aggression, while the
relationship between overt aggression and psychopathic traits was similar for both boys and girls
(Marsee et al., 2005).
Conceptualization of Narcissism. Finally, another issue central to the APSD is its
conceptualization of narcissism, which does not completely map on to the more traditionally
accepted construct of narcissism. Common traits of narcissism include grandiosity, superiority,
and a need for validation (Thomaes, Bushman, Orobio De Castro, & Stegge, 2009). However,
individuals with narcissistic traits also care how they are viewed by others (Thomaes et al.,
2009), and they possess an excessive need for admiration (Ang & Raine, 2009). To enhance
their self-esteem, they affiliate themselves with those of high status, but they also attribute their
successes to their abilities (Campbell, Goodie, & Foster, 2004). Nonetheless, these individuals
are quite sensitive to any form of criticism, which often elicits rage (Ronningstam, 2010) or
aggressive reactions (Brown, Budzek, & Tamborski, 2009). Additionally, due to believing that
they are unique or special, narcissistic people possess a sense of entitlement, feel they are of
10
greater intelligence, and deserve a greater number of positive results or benefits than other
people (Campbell et al., 2004). Furthermore, despite seeking admiration from others, they are
exploitative (Ang & Raine, 2009) and place blame on others for their own failures (Campbell et
al., 2004). Other key characteristics that focus more on the behavioral aspect of narcissism
include impulsivity, aggression, and not learning from their mistakes (Foster & Trimm, 2008).
More specifically, aggression is positively correlated with narcissism in samples of both adults
and adolescents (Ang & Raine, 2009). Of all these traits, grandiosity is typically viewed as the
defining characteristic of narcissism (Ang & Raine, 2009; Brown et al., 2009).
Given the features of narcissism described above, concerns have been raised about
whether the items on the narcissism subscale assess this construct as traditionally defined. Barry
and Wallace (2010) suggest the items on the narcissism subscale may better reflect behaviors
associated with narcissism rather than the attitudes and personality traits commonly thought to
characterize narcissism. In support of this notion, research has shown that narcissism is related
to both Factor 1(i.e., personality) and Factor 2 (i.e., behavior) of psychopathy. Barry and
Wallace (2010) found significant correlations between the APSD narcissism scale and both the
Narcissism Personality Inventory-Child (NPIC; r=.28, p<.01) and the Childhood Narcissism
Scale (CNS; r=.24, p<.01). However, these correlations are of small magnitude, which supports
the concern that narcissism, as defined on the APSD, represents only certain features of this
construct.
Overall, the concern appears to be more rooted in nomenclature than in the scale’s
validity. The notion that the narcissism subscale’s name may be a misnomer is partially
supported by the low correlations between other scales that assess these traits in youth (e.g.,
NPIC, CNS). Visual examination indicates that items on the narcissism subscale focus more on
11
behaviors such as teasing and conning others (Poythress et al., 2006), while the items on the
CNS and NPIC are reflective of the more traditional construct of narcissism that tap into the core
trait of having inflated but fragile self esteem (Thomaes, Stegge, Bush, Olthof, & Denissen,
2008; Washburn, McMahon, King, Reinecke, & Silver, 2004).
In addition to the research that has shown the narcissism subscale of the APSD has small
correlations with other narcissism scales, another line of research has focused on boldness.
Boldness is characterized by “social dominance, emotional resiliency, and venturesomeness”
(Patrick, Fowles, & Krueger, 2009, p. 913). Boldness has also been linked to shallow emotions,
charm, deceitfulness, manipulativeness, persuasiveness and social dominance (Patrick et al.;
Patrick, 2008). Finally, when examining the relationship between boldness and the factors of the
Psychopathy Checklist Revised, boldness is captured mainly by items reflecting the interpersonal
facet of Factor 1 (e.g., charming, grandiose sense of self-worth). The narcissism subscale of the
APSD is also highly associated with the interpersonal facet of Factor 1 on the PCL-R, which, as
noted above, is the one that most closely reflects the construct of boldness (Patrick, 2008).
Boldness is also similar to the construct of fearless/dominance. In sum, it seems that the
subscale labeled narcissism actually measures boldness more so than it does the construct of
narcissism as it is traditionally operationalized (i.e., high but fragile self esteem). Therefore, for
the purpose of this project, the narcissism subscale on the APSD will be referred to as boldness.
Neurobiology of Psychopathy
Psychopathy clearly has behavioral repercussions that have been repeatedly found by
research. However, the scope of research efforts broadened to include neurobiological
underpinnings since earlier research on aggression had revealed biological connections, such as
differences in the way certain parts of the brain function in aggressive and violent individuals
12
(Volavka, 1999). The following section summarizes research on the neurobiological
underpinnings of psychopathy.
Amygdala
The amygdala is associated with psychopathy, as decreased levels of activity in the
amygdala are related to CU traits in adults (Shirtcliff et al., 2009). Additionally, reduced
amygdala activity has also been found in boys with CU traits as young as 11 years old (DeLisi,
Umphress, & Vaughn, 2009). Marsh, Beauchaine, & Williams (2008) replicated this finding in
another sample of youth with CU traits, and reduced activation was particularly noted in
response to fearful faces. Research has also shown that people with decreased amygdala activity
show evidence of deficient fear recognition in others (Blair, Jones, Clark, & Smith, 1997).
Furthermore, individuals with lesions in the amygdala do not generate autonomic responses, such
as skin conductance (SC), in response to fear conditioning, but they do elicit autonomic
responses to inherently negative stimuli (Critchley, Mathias, & Dolan, 2002). However, in
contrast to individuals with psychopathic traits, individuals with a normally functioning
amygdala experience increased activation when exposed to others in distress (Shirtcliff et al.,
2009). Furthermore, difficulty processing distress in others is associated with problems with
emotional decision-making due to lack of learning (i.e., conditioning), whereas normal levels of
amygdala activity are associated with learning, which includes exhibiting empathy for others.
Collectively, these results suggest that amygdala dysfunction is a core feature of psychopathy
(Blair, 2007).
Orbitofrontal Cortex and Ventromedial Prefrontal Cortex
The orbitofrontal cortex (OFC) is part of the prefrontal cortex, and it “primarily serves to
regulate emotion, control mood, monitor rewards and punishments, and generally be engaged
13
during planning and decision-making tasks” (Shirtcliff et al., 2009, p. 147). Other functions of
the OFC include instrumental learning, and, in a task where reward contingencies are suddenly
reversed, individuals with lesions in the OFC have difficulty changing their responses from
previously rewarded choices that become choices that are punished (Mitchell, Colledge,
Leonard, & Blair, 2002). The OFC has numerous connections to the amygdala, and amygdala
hypoactivity contributes to OFC dysfunction since low levels of activity in the amygdala result in
a failure of learning to occur. Finally, lesions in the OFC are associated with decreased
autonomic responses to stimuli that are emotionally arousing (Mitchell et al., 2002).
The ventromedial prefrontal cortex (VPC) is related to callousness. Its “role is to take the
emotional information from the amygdala during decision-making” (Shirtcliff et al., 2009, p.
147). Moreover, Marsh et al. (2008) found that the highest level of CU traits in youth was
associated with reduced connectivity between the VPC and the amygdala.
Psychopathic Traits and Psychophysiology
In addition to the neurobiological differences associated with psychopathy, psychopathic
traits, as well as antisocial behavior, have also been associated with differences in autonomic
arousal. Research has found reduced autonomic reactivity in response to stressors, but no
consistent findings with regard to baseline autonomic activity have emerged (Patrick, 2008).
This pattern has been attributed to the different facets of psychopathy. The following discussion
summarizes the findings of research on heart rate (HR), skin conductance (SC), and the three
dimensions of psychopathy assessed by the Antisocial Process Screening Device (APSD) in
children, adolescents, and young adults. Finally, this section concludes with a discussion of
respiratory sinus arrhythmia, a measure of parasympathetic activity that has been used minimally
in research on psychopathic traits in youth.
14
Psychopathic Traits and Skin Conductance.
With regard to the relationship between psychopathy and psychophysiology, there is a
negative relationship between externalizing symptoms and resting SC levels in a variety of
samples, including adult psychopaths and adolescent offenders (El-Sheikh, Keiley, & Hinnant,
2010). Additionally, there is less SC reactivity in response to stressors (Munoz, Frick, Kimonis,
& Aucoin, 2008). Similar results have been found in community samples of adults (Sylvers,
Brubaker, Alden, Brennan, & Lilienfeld, 2008), and the same trend of lower baseline SC and
reduced reactivity was found in a meta-analysis by Lorber (2004).
In regards to research on SC, the combination of high levels of CU traits and aggression
in adolescent males is associated with less skin conductance reactivity (SCR) (Anastassiou-
Hadjicharalambous & Warden, 2008). According to Lorber (2004), children with conduct
problems (e.g., acting out) and adolescents with psychopathic traits have low baseline SC and
less SCR.
Similar to the pattern observed with CU traits, low resting HR was found in college age
students with high levels of self reported impulsivity (Mathias & Stanford, 2003). Research on
SC has shown that children with externalizing disorders have reduced baseline SC (Wilson,
Lengua, Tininenko, Taylor, & Trancik, 2009). Impulsivity has also been linked with less SCR
(Crider, 2008).
Relative to research on impulsivity and CU traits, empirical work on the relationship
between physiological measures and narcissism is lacking. Another limitation of research in this
area is that different conceptualizations of narcissism have been used. Some of these
conceptualizations (e.g., Kelsey, Ornduff, Reiff, & Arthur, 2002) differ from the most widely
used conceptualization, which emphasizes inflated but fragile self-esteem, and the validity of
15
some of these conceptualizations has not been examined (e.g., Sylvers et al., 2008). Most
research on the relationship between psychophysiology and narcissism has focused on measures
of sympathetic activity in adult samples. Psychophysiological activity in youth with narcissistic
traits might differ from that of adults, which limits the relevance of the findings in the adult
literature. Finally, given that the narcissism scale on the APSD is being referred to the boldness
scale because it appears to measure behaviors related to teasing and conning others, it is possible
that the relationship between boldness and psychophysiological measures will differ from that of
narcissism and psychophysiological measures.
Psychopathic Traits and Heart Rate
Violent and antisocial behavior has repeatedly been linked to low autonomic arousal,
particularly low heart rate (HR), in both adults and children (Raine, 2002). Low resting HR is
characteristic of those youth who are considered to engage in life course persistent antisocial
behavior (Moffitt & Caspi, 2001). It also distinguishes between those adolescents who desist
from criminal behavior and those who continue to offend (Raine, 2002). Those who desist have a
higher resting HR and higher SC than those who continue to engage in criminal behavior. In
other words, high HR serves as a protective factor against criminal behavior.
In a sample of children 7.6-11 years old, Anastassiou-Hadjicharalambous and Warden
(2008) found that CU traits are associated with lower baseline HR. These researchers also found
that youth with conduct disorder (CD) and CU traits have lower resting HR and less HR
reactivity than children with CD only and control youth. As a result, youth with CU traits are
less sensitive to punishment (Dolan, 2004). It is well documented that this insensitivity to
punishment or low fearfulness leads to them engaging in thrill seeking behavior (Essau,
Sasagawa, & Frick, 2006; Frick & White, 2008).
16
Limitations of Heart Rate
While research on the relationship between resting HR and HR reactivity and aggression
in children and adolescents has yielded consistent findings, one of the main limitations of HR is
that it is influenced by both the sympathetic and parasympathetic nervous systems (Beauchaine,
2009). Initially, sympathetic nervous system (SNS) activation was thought to be accompanied
by a decrease in parasympathetic nervous system (PNS) activity. However, more recent research
has shown that this depiction of the relationship between the two branches of the autonomic
nervous system (ANS) is not complete. According to Beauchaine (2009, p. 81), “it is now
widely accepted that the SNS and PNS can activate and/or deactivate reciprocally,
independently, or coactively, depending on environmental conditions and both psychological
states and traits.”
Since research has shown that sympathetic and parasympathetic influences on HR can act
jointly, it has been suggested that empirical studies include more specific physiological measures
that independently capture the activity of the two branches of the ANS (Marsh et al., 2008). To
address this limitation, a pure measure of parasympathetic activity, respiratory sinus arrhythmia,
was used in this study to assess physiological activity.
Respiratory Sinus Arrhythmia
Respiratory sinus arrhythmia (RSA) or vagal tone (VT) is a measure of parasympathetic
activity, and it is defined as “the waxing and waning of heart rate across the respiratory cycle”
(Bubier & Drabick, 2008, p. 943). During inspiration, heart rate increases, which is due to
sympathetic nervous system functioning not being affected by the vagus nerve’s inhibitory
influence (Beauchaine, Katkin, Strassberg, & Snarr, 2001). Conversely, decreased HR and
increased cardiac VT are associated with expiration (Bubier & Drabick, 2008; Porges & Bohrer,
17
1990). Additionally, greater parasympathetic activity results in decreased HR, which in turn
results in increases in RSA (Sylvers, et al., 2008). Analysis of heart rate variability via RSA
measures only parasympathetic activity (i.e., independent from sympathetic activity) (Vasilev,
Crowell, Beauchaine, Mead, & Gatzke-Kopp, 2009).
The vagus nerve is called the ‘vagal brake’ because it impedes arousal of the sympathetic
nervous system when the environment is perceived to be safe (Hastings et al., 2008). When a
threat is perceived, the vagal brake is released, which serves to increase sympathetic arousal and
initiate the “fight or flight” response. This increase in sympathetic arousal is adaptive when a
true threat is present, but decreased VT in non-threatening environments is maladaptive because
individuals are prepared to engage defense mechanisms in response to the perceived but
unfounded danger.
Fight or flight behaviors are associated with vagal withdrawal or increased HR due to
sympathetic arousal. Vagal withdrawal during stressful times is considered adaptive as it allows
for adequate coping responses to real or perceived threats. Reduced VT has been found in
several types of samples, including antisocial adolescent males, hostile young adults, and people
with panic disorder. Higher basal RSA is positively associated with empathy toward distressed
individuals, social engagement, and helping others who are experiencing distress. Impulsivity
associated with conduct disorder is linked with reduced RSA and a reduced threshold for
responding aggressively (i.e., decreased fight or flight threshold) (Beauchaine et al., 2001).
Resting RSA and RSA reactivity. Resting RSA is an indicator of parasympathetic
activity. RSA reactivity is the deviation from baseline RSA when individuals are exposed to
stressors, engaged in cognitively demanding tasks that require them shift their attention, or when
their emotional states change (Gramzow, Willard, & Mendes, 2008). Low resting RSA is
18
associated with poor emotion regulation, and it also correlates with measures of anxiety and
hostility (Gramzow et al., 2008). Conversely, high resting RSA reflects adequate emotional
reactivity, and it also serves as a protective factor in the context of negative environmental
influences (Calkins, Blandon, Williford, & Keane, 2007), such as child maltreatment or marital
conflict (Gordis, Feres, Olezeski, Rabkin, & Trickett, 2010).
Early hypotheses suggested that low HR might be related to increased VT in antisocial
individuals (Raine, 2002). However, this theory has not been supported by research, as the
opposite pattern of reduced VT (i.e., decreased parasympathetic activity) in antisocial and
aggressive samples has been substantiated. For example, Pine, Shaffer, Schonfeld, & Davies
(1997) found that aggressive children had reduced VT. Similar results emerged from the work of
Mezzacapa et al. (1997), who found that 15-year-old boys with antisocial tendencies had both
low resting HR and decreased VT. These early findings have been substantiated by more recent
research that has also found reduced baseline RSA in samples of aggressive youth (Beauchaine,
Gatze-Kopp, & Mead, 2007; Beauchaine, Hong, & Marsh, 2008). Nonetheless, some recent
research has found no significant relationship between baseline RSA and externalizing
symptoms (Calkins, Graziano, & Keane, 2007) as well as a positive relationship (Dietrich et al.,
2007).
Similarly, conflicting results from empirical research on the relationship between RSA
reactivity during a challenging activity and externalizing symptoms in youth have also emerged.
Dietrich et al. (2007) reported there was no relationship between RSA reactivity and
externalizing symptoms, while Calkins, Graziano, et al., (2007) found that the group with
externalizing symptoms exhibited the least RSA reactivity. Perhaps of greater interest are the
findings of Beauchaine et al. (2007), who examined baseline RSA and RSA reactivity in youth in
19
three different developmental stages. First, in preschool children with and without ADHD/ODD,
no differences in baseline RSA or RSA reactivity were found. In contrast, children in middle
childhood (i.e., 8-12 years old) with conduct disorder (CD) or oppositional defiant disorder
(ODD) had significantly lower baseline RSA than did control participants. Both groups
experienced normal reductions in RSA while watching a video of a child getting increasingly
upset as his father died. However, Beauchaine et al. (2007) argued that decreases in RSA of
similar magnitude might be more detrimental to the CD/ODD youth with regard to emotion
regulation since their baseline RSA is already depressed. The findings from the adolescent
sample (ages 12-17 years) mimic those from the middle school sample, and Beauchaine et al.’s
(2007) results suggest that differences in RSA develop between the preschool and middle
childhood years.
Vagal regulation of emotion. The cortex stimulates the amygdala, which stimulates the
nucleus ambiguus. The nucleus ambiguus, in turn, stimulates the vagus nerve. Emotion
regulation may also follow a path originating in visceral organs, from which vagal afferent
nerves project to the nucleus tractus solitarius that then stimulates the cortex, amygdala, and
nucleus ambiguus. Any impedance or damage to this circuit may lead to affective disorders and
problems with emotion regulation. The vagal circuit is bidirectional and reflects both
neurophysiological deficits/damage. The bidirectional communication between cortical (e.g.,
prefrontal cortex (PFC)) and subcortical structures (e.g., amygdala, nucleus ambiguus) allows the
subcortical structures to influence cortical functions (i.e., cognitive processes).
The anterior cingulate cortex (ACC) and the prefrontal cortex (which consists of the
dorsolateral prefrontal cortex (DLPFC), dorsomedial prefrontal cortex, and the ventromedial
prefrontal cortex) are directly linked to structures involved in vagal activity. These cortical
20
structures have an inhibitory role on cardiovascular activity via the vagus. Decreased activity in
the left ACC, right DLPFC, and right parietal cortex leads to decreased RSA (Goetz, 2011).
Decreased cortical activity leads to decreases in RSA, which occurs via pathways connecting
cortical and subcortical structures that project to the vagus nerve (Goetz, 2011). Reduced
cortical activity translates into less inhibitory control of the amygdala, a structure whose function
includes generating autonomic responses in the presence of real or perceived threats and
uncertainty. Less inhibition of the amygdala results in an inhibition of vagal activity and also of
parasympathetic influence on the heart (i.e., decrease in RSA) (Goetz). Bidirectional
connections between cortical structures and subcortical structures associated with vagal activity,
which suggests that subcortical structures can influence cognitive processes, such as decision-
making.
RSA, internalizing symptoms, and comorbid internalizing and externalizing
symptoms. In addition to research on RSA and externalizing problems, including aggression,
the relationship between RSA and internalizing symptoms has also been examined. For
internalizing symptoms alone, the findings have been inconsistent. For example, Gentzler,
Santucci, Kovacs, & Fox (2009) found a negative relationship between RSA reactivity and
depressive symptoms in children 5-13 years of age, while Boyce et al. (2001) reported the
opposite finding of greater RSA reactivity in 6-7 year olds with more internalizing symptoms.
Gentzler et al. (2009) also found no relation between depressive symptoms and baseline RSA for
youth at risk for depression or for youth in the control group.
Given that the sample in the proposed study consists of youth with at-risk or clinically
significant levels of aggression, the relation between comorbid internalizing/externalizing
symptoms and RSA is of greater interest and relevance. Calkins, Graziano, et al. (2007)
21
compared a low behavior problem group to both an externalizing problems and a combined
internalizing/externalizing problems group. No differences in baseline RSA were found between
the three groups. However, the combined symptom group had significantly greater reductions in
RSA compared to the externalizing problems group during challenging tasks. Additionally,
youth in the externalizing only group had the smallest decrease in RSA while the combined
group had the largest decrease in RSA.
Gender differences in RSA. Most studies examining aggressive behavior in youth have
a substantially larger number of boys than girls, with the ratio reaching 10:1, respectively
(Moffitt & Caspi, 2001). However, some studies have examined whether differences in RSA in
boys and girls exist. For example, Beauchaine et al. (2008) found that highly aggressive males
had lower baseline RSA than males with low aggression (i.e., T-score < 60 on the aggression
subscale of the Child Behavior Checklist (CBCL)). Among females, there was no difference in
baseline RSA, regardless of level of aggression. Summing up their findings, Beauchaine et al.
(2008) concluded that the pattern of physiological responses among girls did not resemble the
pattern among boys, as there was no difference between control and aggressive girls.
Calkins and Dedmon (2000) also examined baseline RSA in 2-year old boys and girls at
risk for aggressive behavior. Their results did not reveal any effect of gender or level of risk
(high vs. low), but the risk level x gender interaction was significant. Specifically, boys at high
risk for aggression had lower baseline RSA levels than low-risk boys, and there was no
difference in baseline RSA for girls, regardless of risk level. In another study, Calkins,
Graziano, et al. (2007) found no difference in baseline RSA between boys and girls.
Additionally, there was no gender x behavior problem group (i.e., externalizing only,
internalizing and externalizing, and low behavior problems) interaction effect for baseline RSA.
22
Relationship between the vagus nerve, brain dysfunction, and psychopathy. College
aged males who scored high on the Psychopathic Personality Inventory (PPI) have decreased
amygdala activity (Gordon, Baird, & End, 2004), and amygdala hyporeactivity has also been
found in youth with CU traits (Frick, 2009) and with disruptive behavior disorders (Marsh,
Finger, Mitchell et al., 2008). These findings are consistent with work by Blair (2001) that
suggests decreased amygdala activity leads to a lack of fear conditioning, which, in turn, is
associated with impulsivity and risk taking. Similarly, decreased activity in the prefrontal cortex
is also related to behavioral and executive functioning deficits commonly seen in individuals
with psychopathic traits (Gordon et al., 2004). Given Figure 1 (Porges, Doussard-Roosevelt, &
Maiti, 1994) below, it is likely that the interaction between cortical and subcortical structures is
involved in the manifestation of psychopathy as well as the functioning of the vagus nerve.
Figure 1
The Vagal Circuit of Emotion Regulation
23
Affective Decision-Making
Decision-making is a process that is influenced by emotions, and Damasio developed the
somatic marker hypothesis, which describes the role of somatic markers or bodily cues in
decision-making (Anderson, Bechara, Damasio, Tranel, & Damasio, 1999; Bechara, Damasio,
Tranel, & Damasio, 1997). Damasio and colleagues found that individuals who sustained
damage to the ventromedial prefrontal cortex made poor decisions and were considered to have
“acquired sociopathy” (Damasio, 1994). Specifically, these individuals exhibited behaviors
characteristics of severely antisocial people (e.g., irresponsibility, failure to plan for the future,
inappropriate social behavior), and this finding promoted interest in examining the affective
decision-making impairments-antisocial behavior link in individuals without brain injuries
(Seguin, Pihl, Harden, Tremblay, & Boulerice, 1995).
Iowa Gambling Task
To further research on affective decision-making and somatic markers, Bechara and
colleagues developed the Iowa Gambling Task, which replicates real-world conditions of
uncertainty, risk, and reward, consists of 4 decks of cards from which participants choose
(Suzuki, Hirota, Takasawa, & Shigemasu, 2003). Participants begin the task with $2000 of
virtual money. With each card selection, participants win money, but they can also lose money.
Two decks, C and D, are advantageous because they are associated with small rewards but even
smaller losses. The remaining two decks, A and B, are disadvantageous because they are
associated with large rewards but even larger yet infrequent losses. On this task, healthy
participants initially pick cards from all of the decks. However, over time, they usually discover
that picking more cards from decks C and D results in net gain (Crone, Somsen, Van Beek,
&Van Der Molen, 2004; Suzuki et al., 2003).
24
Iowa Gambling Task and Skin Conductance. As described above, decision-making is
an affective process that is influenced by somatic markers, such as skin conductance, which
reflect activity of the autonomic nervous system. For example, prior to making risky decisions
during the IGT, healthy participants generate anticipatory SC responses (Crone et al., 2004;
Suzuki et al., 2003). In contrast to the performance of healthy individuals, patients who have
experienced damage to their ventral prefrontal cortex make selections from the disadvantageous
piles throughout the task, and this pattern may partially be due to the lack of anticipatory SC
responses (Crone et al., 2004; Suzuki et al., 2003). Because these patients have impaired
generation of somatic markers, they have deficient decision-making abilities. As a result, they
continue to make poor or risky decisions throughout the task because of the lack of anticipatory
SC responses.
Additionally, in healthy participants, no difference in anticipatory SC was observed in
poor performing participants for either advantageous or risky choices (Crone et al., 2004). The
authors posited that anticipatory somatic activity (i.e., skin conductance) indicating that a risky
decision was about to be made was absent. In contrast, both average and high-performing
participants displayed differences in SC prior to making risky or safe choices, with the latter
group exhibiting the largest difference. High performers benefitted from anticipatory somatic
activity, which alerted them to an impending bad choice.
Research by Bechara, Damasio, & Damasio (2000), however, demonstrated that some
healthy participants perform as poorly on the IGT as patients with ventromedial damage, which
suggests that anticipatory SC responses and strategies employed during the task develop
independently of each other. This group of poor performing, healthy participants generated
anticipatory SC responses that were intermediate in magnitude of those produced by high-
25
performing participants and by ventromedial patients. These subjects also had comparatively
diminished SC responses after incurring a loss, which may have contributed to their poor
performance because they did not modify their response strategy based on the outcome of
previous choices.
Bechara et al.’s (2000) proposed explanation for this finding was that individuals who
perform well have both normal levels of autonomic activity after making a choice and
anticipatory somatic responses, but they intentionally ignore the warning signs generated from
autonomic activity. This group was labeled as risk takers, which is consistent with the
participants’ descriptions of themselves as thrill seekers.
In a similar line of research, Suzuki et al. (2003), using a sample of 41 Japanese
undergraduate students (mean age=19.9 years), found that participants’ anticipatory SC
responses were larger for the risky decks than for the advantageous decks. Interestingly,
participants with low and high appraisal SC responses correctly labeled decks as advantageous or
disadvantageous, which implies that the physiological responses or somatic markers
unconsciously influence decision-making.
Developmental Differences in Iowa Gambling Task Performance. The majority of
research on the IGT reviewed thus far has focused on adults. However, there is a sizable and
growing body of research on youth’s performance on the IGT, and the findings suggest that
developmental differences in decision-making exist. For example, using a sample of healthy
adolescents, older adolescents typically perform better on the IGT than younger children
(Hooper, Luciana, Conklin, & Yarger, 2004). 9-10 year old children in their study performed the
worst of the three age groups (i.e., 9-10, 11-13, 14-17) in each block of the IGT, meaning they
picked fewer advantageous cards than any other group. The 11-13 year olds improved more
26
rapidly than the 9-10 year olds, as they made increasingly better decisions starting in block 2 of
the IGT. The 14-17 year olds performed the best on this task, and while their performance
trajectory was similar to that of the middle-aged group of children, they made more
advantageous decisions in each block, starting in block 2.
Similarly, Crone and Van der Molen (2004) found that older youth make more
advantageous choices on a decision-making task (i.e., Hungry Donkey) similar to the IGT than
their younger counterparts do. Specifically, adolescents (13-15 years) and adults (18-25 years)
did better on this decision-making task than did the two youngest groups (6-9 and 10-12 years).
These researchers concluded that the improved performance observed in older children reflects a
greater sensitivity to future consequences. Alternately phrased, younger, typically developing
children demonstrate myopia for the future that was seen in patients with ventromedial frontal
cortex damage.
Limited research on the performance of youth exhibiting aggressive and disruptive
behavior on the IGT has been conducted. The results of a study by Blair, Colledge, & Mitchell
(2001) found that boys with higher psychopathic traits, as measured by the teacher-rated APSD,
made more selections from the disadvantageous decks than did boys with lower APSD scores
(i.e., below 20). Additionally, the youth with more psychopathic traits also continued to pick
from the disadvantageous decks during the later trials on the IGT. A similar performance pattern
on the IGT was observed in a school-based intervention study for 4th and 5th children at risk for
aggression (Deming, 2009). Finally, Syngelaki, Moore, Savage, Fairchild, & Van Goozen
(2009) examined risky decision-making in adolescent male offenders. Relative to the control
sample, the adolescent offenders generally exhibited more risky decision-making, and this
27
tendency was even more pronounced after a small win. Syngelaki et al. concluded that the
adolescent offenders have altered sensitivity to reward and punishment.
More recent research by Schutter, Bokhoven, Vanderschuren, Lochman, & Matthys
(2011) examined risky decision-making in adolescent males with disruptive behavior disorders
(DBDs), such as conduct disorder and oppositional defiant disorder, both with and without
substance dependence (SD). To control for any role ADHD has in impaired decision-making,
youth with comorbid ADHD were excluded. Results indicated that youth with DBD and SD
made more disadvantageous choices than those with DBDs only (i.e., no SD) and healthy
controls. Additionally, there was no difference in disadvantageous decision-making between
healthy controls and the youth with DBD but not SD.
Finally, because participants must figure out which are the advantageous decks, learning
does not typically appear early in the task (i.e., in blocks 1-2). For example, Deming’s (2009)
results showed that IGT performance peaked in Block 3 and declined in the remaining two
blocks. Results of Bechara et al.’s (2001) research also suggest that differences in performance
between impaired (e.g., substance dependent, VPC lesions) and control (i.e., non-impaired)
samples typically emerge in Block 3. Based on the finding that learning begins to emerge in
Block 3 in several different types of samples, in this study, performance in the later blocks was
expected to be better than in the earlier blocks.
Iowa Gambling Task and the Brain. Much like research has demonstrated that
psychopathy is associated with parts of the brain, such as the amygdala, the IGT is also related to
specific parts of the brain. When these structures, which are discussed below, do not function
properly due to damage or disease, performance on the IGT becomes impaired. The second
28
portion of this section discusses the influence of psychopathic traits on affective decision-making
tasks and how these traits relate to reward sensitivity.
Role of the orbitofrontal cortex. As described above, damage to the orbitofrontal
cortex (OFC) impairs performance in a task where previously rewarded decisions become
punished (Mitchell et al., 2002). Individuals with damaged OFCs also do not demonstrate
learning on the IGT, as they continue to pick from the riskier piles throughout the task
(Schoenbaum & Roesch, 2005).
Role of the ventromedial prefrontal cortex. Individuals who have sustained damage to
the VPC typically fail to avoid the disadvantageous decks (i.e., A, B) in the IGT, while control
participants and participants with damage to the lateral occipital or lateral temporal cortex avoid
these decks (Bechara, 2004). Both control participants and patients with a damaged VPC
generated SC responses after making a choice in the IGT and being told the result (i.e., win or
lose money). In addition, control participants began to generate anticipatory SC responses as
they progressed through the task, and these responses were stronger prior to making a choice
from a risky deck. However, VPC patients never generated these anticipatory SC responses.
These findings suggest that decision-making is an affective process that is influenced by
anticipatory somatic signals as well as appraisal signals.
Role of the amygdala. The amygdala is vital to somatic marker activity and to making
advantageous decisions (Bechara, Damasio, Damasio, & Lee, 1999). These authors also found
support for the hypothesis that the amygdala and the VPC are responsible for different aspects of
decision-making because different performance profiles emerged for patients with VPC damage
and those with damage to the amygdala. Specifically, in contrast to patients with VPC damage
29
who generate SC responses after being told the result of their decision, individuals with
amygdala damage did not generate these post-decision appraisal SC responses.
Role of the vagus nerve. It has been proposed that the vagus nerve has a role in
decision-making (Bechara, 2004). The validity of this notion was examined in a sample of
patients with epilepsy who had vagus nerve stimulators implanted. The participants completed
the IGT twice, once under normal conditions and once while the vagus nerve was stimulated at a
low level during the task, and the two conditions were counterbalanced. While these patients
had IQs in the normal range, they performed poorly on the IGT under normal conditions.
However, their performance on the task improved when the vagal nerve was stimulated. These
results provide evidence for the role of the vagus nerve in decision-making.
Psychopathic traits and tasks assessing affective decision-making and reward sensitivity
Callous-unemotional traits. Children with high levels of CU traits have lower levels of
physiological arousal, which may explain their poor performance on tasks initially designed to
yield a reward-oriented response style. Because these youth are more sensitive to reward than to
punishment (Christian et al., 1997), they had difficulty modifying their response style to reflect
the increased rate of punishment as they progressed through a computerized task, whose goal
was accrue the maximum number of points possible (O'Brien & Frick, 1996). Additionally,
regardless of the presence or absence of conduct problems, youth with higher levels of CU traits
completed more trials during this task. Youth with CU traits also have reduced emotional
reactions to negative, threatening, or distressing stimuli (Pardini & Loeber, 2007).
Impulsivity. Impulsive youth are unable to consider the consequences of their antisocial
behavior because they have poor self-monitoring abilities (White et al., 1994). Insufficient self-
monitoring in impulsive individuals may explain their antisocial behavior in situations where
30
immediate positive outcomes outweigh possible future adverse consequences stemming from
their delinquent actions, as was found by Hinson, Jameson, & Whitney (2003) in a sample of
undergraduate students.
Specifically on the IGT, Franken, van Strien, Nijs, & Muris (2008), found that, in a
sample of healthy undergraduates, high levels of impulsivity were associated with poor
performance on this task. These researchers concluded that the highly impulsive participants did
not learn the “reward and punishment associations in order to make appropriate decisions”
(Franken et al, 2008, p.160). The primary finding from their study was that the IGT score is a
strong predictor of self-reported impulsivity, as it explained 27% of the variance.
31
Hypotheses and Research Questions
Based on the review of the literature presented, some gaps in previously conducted
research emerged. For example, no studies have specifically examined RSA in youth with
psychopathic traits. Additionally, the relationship between psychopathic traits in youth, RSA,
and performance on the IGT has not been researched. This relationship is important to examine
because both psychopathic traits and the psychophysiological differences associated with
psychopathy affect decision-making as well as responsivity to treatment. Thus, these two
variables, as well as their interaction, may be potential moderators to include in future treatment
studies. Additionally, the presence of these variables may generate clear implications for
intervention. For example, assessing RSA in addition to psychopathic traits and other risk
factors may improve the effectiveness of an intervention program because it would be
comprehensive in nature while also allowing it to be individually tailored to a given child’s
specific biopsychosocial makeup (Frick & White, 2008). The current study sought to fill these
gaps by examining the relationship among these variables.
Hypotheses
Based on previously conducted research, for hypothesis #1, it was predicted that baseline
RSA would be negatively correlated with the total APSD score. For hypothesis #2, it was
expected that poorer IGT performance on blocks 3-5 would be associated with higher levels of
psychopathy, low baseline RSA, and RSA reactivity (i.e., less vagal withdrawal). The rationale
for examining how psychopathy and RSA, both of which can be considered inherent features,
influence performance on the IGT is that, individually, each has been shown to affect behavior.
32
The IGT is also thought to be a behavioral manifestation reflecting underlying deficits associated
with psychopathology, (e.g., psychopathic traits), brain damage, (e.g., VPC lesions), and
psychophysiological deficits.
Research Questions
Research question #1 examined how the total APSD score, baseline RSA, RSA reactivity
(RSA-R, and gender interacted with each other. Specifically, this research question explored the
interactions between the total APSD score, baseline RSA, and gender in blocks 3 through 5 of
the IGT. The above analysis was then repeated with RSA-R in place of baseline RSA.
Research question #2 repeated the analyses conducted in research question #1 with the
subscales of the APSD in place of the total APSD score. Specifically, each analysis in this
section examines the interactions between one of the APSD subscales, RSA (baseline and
reactivity), and gender in blocks 3-5 of the IGT. In research question #2a, the two- and three-
way interactions between the callous/unemotional subscale, baseline RSA, and gender were
examined. The analysis was then repeated with RSA-R. Using the impulsivity/conduct
problems subscale, research question #2b examined the same relationships described above. The
same analysis was conducted in research question #2c with the narcissism subscale.
Research question #3 repeated the above analyses with blocks 1 and 2 of the IGT, which
is exploratory since the participants were not expected to demonstrate learning of the IGT at this
point. Specifically, research questions #3a, #3b, #3c, and #3d explored the relationships between
the total APSD, the callous/unemotional subscale, the impulsivity/conduct problems subscale,
and the narcissism subscale, respectively, and RSA (baseline and reactivity) and gender.
33
METHODS
Recruitment and Screening of Participants
Participants were 4th grade students attending participating schools in the Tuscaloosa
City, Tuscaloosa County, and Bessemer school districts. For this project, youth and their parents
were recruited from the first cohort, which resulted in an initial sample of 120 children. The
final sample size was 111. The mean age of participants at time 1 was 10.30 years (SD=.5), and
67% of the participants were male. The sample was predominantly African American (76.7%),
followed by 16.7% Caucasian, and 2.5% Latino. Three participants were biracial (African
American/Caucasian) and 3 indicated ‘other’ for their ethnicity. The median annual income
level was between $25,000 and $29,999. Approximately 1/3 of the participants lived with only
their mothers, 25% in mixed settings (i.e., mother and another family member, biological mother
and stepfather), and 22.5% lived with both biological parents. 37% receive some form of
government assistance (e.g., social security).
This project is a secondary data analysis from a larger, grant-funded intervention research
project. As part of the larger project, parents were informed of the study by a notification form
describing the screening process that was sent home with the students. Parents who did not want
to participate indicated this preference on the notification form and returned it to their child’s
school.
A two-gate screening method was used to determine eligibility of students, and this
approach was used because it is a valid predictor of future externalizing behaviors in youth. For
example, Lochman and the Conduct Problems Prevention Research Group (1995) found that this
34
screening method successfully identified kindergartners at risk for future externalizing behaviors.
Similarly, in a sample of youth with behavior problems, Loeber, Dishion, & Patterson (1984)
accurately identified 86% of the participants who were still engaged in delinquent behavior three
years after the initial screening.
One of the primary reasons an aggressive sample was selected for this project is that
youth who begin engaging in aggressive behavior at earlier ages are at greater risk of developing
a more persistent and severe pattern of antisocial behavior (Hill, Lochman, Coie, Greenberg, &
The Conduct Problems Prevention Research Group, 2004). Furthermore, such youth are more
likely to experience social, psychological, and academic problems. The goal of preventive
interventions is to disrupt this negative cycle before it becomes an entrenched pattern of behavior
that is more resistant to treatment, and interventions can be global or more targeted in nature.
For the proposed study, youth with low levels of aggressive behavior have been screened out by
the two-gate screening method, thus leaving a sample of youth at risk for aggressive behavior.
Early intervention has also been shown to reduce or prevent the occurrence of disruptive
behavior disorders. Additionally, differences in how these youth respond to treatment due to the
presence of specific risk factors (i.e., psychopathic traits, patterns of psychophysiological
activity) may influence the development or modification of an intervention (Poythress et al.,
2006). Finally, an aggressive sample was selected to increase the measure of central tendency
(i.e., mean) of psychopathy scores.
For those students whose parents agreed to participate, their teachers completed the
Teacher Report of Reactive and Proactive Behaviors (Dodge & Coie, 1987). Students who
received a minimum score of 13 on this measure were eligible, and the parents of these students
completed the Aggression subscale on the Behavior Assessment System (BASC) as the second
35
stage of the screening. After this second phase of screening, students whose T-scores on the
Aggression subscale of the Behavior Assessment System for Children (BASC) were at least 39
remained eligible to participate. On the BASC, the mean T-score is 50, with scores between 40
and 60 considered average. This approach allowed youth who scored below the average range to
be excluded from the study.
While the utility and validity of the two-gate method has been established, the
correlations between parent-teacher ratings are often limited (i.e., .2-.3) (Lochman & the
Conduct Problems Prevention Research Group, 1995). Reasons for low concordance include the
raters observing the child in different settings (i.e., home vs. school), which may lead to raters
not being fully aware of a child’s full range of behavior. In regard to observing the child in
different settings, teachers not only observe a whole range a behavior in their students, but they
also rate a child’s behavior in a more structured setting (i.e., the classroom). Hill et al. (2004)
found that while teacher-only ratings of children’s externalizing behavior were adequate,
teacher-parent ratings had better predictive value for future externalizing and delinquent
behavior.
Procedure
Pre-intervention (Time 1) data were collected in the homes of the participants, and data
were collected by trained interviewers. The child interviewer read and explained the assent form
to the child, while the parent interviewer read and explained the informed consent form to the
child’s primary caretaker. After obtaining consent and assent, each interviewer read the
questions to the participants and recorded their responses on the laptop computers. Additionally,
to ensure that the interviews were conducted under similar conditions, standard folding chairs
and tables were brought to the home and used during the interviews (e.g., during the IGT). More
36
details regarding data collection are described in the Measures section below. Finally, for
completing the pre-intervention assessments, children were given $10, and parents were given
$50.
Screening Measures
Reactive and Proactive Aggression Questionnaire. Participants’ proactive and reactive
aggression were rated by their teachers using the Reactive and Proactive Aggression
Questionnaire that developed by Dodge and Coie (1987). This measure consists of six items:
three assessing reactive aggression and three assessing proactive aggression. Teachers rated
each item on a five-point scale, and the response choices were: (1) Never True; (2) Rarely True,
(3) Sometimes True; (4) Usually True; (5) Almost Always True.
Results of factor analysis indicated that, as predicted, these items formed two distinct
subscales reflecting reactive and proactive aggression. Based on teacher ratings, the correlation
between these subscales ranged from r=.76 to r=.83 in community samples (Kempes, Matthys,
Maasen, van Goozen, & van Engeland, 2006). However, in a sample of aggressive boys rated by
teachers, the correlation between the two subscales dropped to r=.42.
According to Brown, Atkins, Osborne, & Milnamow (1996), flaws of this measure
include not incorporating items that assess instrumental aggression, which is viewed as a key
component of proactive aggression. Additionally, several items that had high loadings (i.e.,
>.40) on both factors were retained in the final version of the measure.
Since the high correlations between the subscales suggested a one-factor model might be
a better fit, Poulin and Boivin (2000) examined the fit of a one-factor model and found that the
two-factor model had a better fit. Additionally, their research also examined the patterns of
social adjustment as measured by peer nominations, victimization by peers, and leadership.
37
Specifically, Poulin and Boivin (2000) found that social preference, which was determined by
peer ratings of those students who were liked most and those who were liked least, was not
correlated with proactive aggression but was negatively correlated with reactive aggression.
Reactive aggression was also positively correlated with peer victimization and negatively with
leadership, while proactive aggression was not correlated with either variable. Overall, these
results supported the construct validity of Dodge and Coie’s (1987) reactive and proactive
aggression questionnaire.
Behavior Assessment System for Children (BASC). The BASC is a behavior rating
scale that assesses behavior across several domains (e.g., conduct problems, anxiety), and, in a
normative sample of youth reflective on the U.S. population based on ethnicity, socioeconomic
status, and geography, a T-score of 50 reflects average levels of the behavior being rated (Doyle,
Ostrander, Skare, Crosby, & August, 1997). A T-score of 60 signifies an at-risk level of
behavior, while a T-score of 70 denotes a clinically significant level of symptoms. Of particular
interest for this study is the Aggression subscale (e.g., acts in a verbally or physically aggressive
way toward others). According to Reynolds and Kamphaus (1992), Cronbach’s alpha for the
Aggression subscale is .83, and its correlation with the Aggressive Behavior subscale on the
Child Behavior Checklist (Achenbach, 1991) is .82. Test-retest reliability for the Aggression
subscale was r=.86 (Reynolds & Kamphaus, 1992).
Time 1 Pre-intervention Measures
Iowa Gambling Task (IGT). The IGT is a computerized measure that assesses affective
decision-making and consists of 5 blocks of 20 cards for a total of 100 cards. Participants chose
cards from four decks, with the goal of obtaining the largest net gain from an initial loan of
virtual money. Cards were selected one at a time from one of four decks, and participants could
38
switch from one deck to another at any time. Decision-making is primarily governed by
schedules of reward and punishment. On the IGT, these schedules were predetermined, and
research staff, but not participants, were aware of them. Two decks, C and D, were considered
advantageous because they were associated with small rewards but even smaller losses. The
remaining two decks, A and B, were disadvantageous because they were associated with large
rewards but even larger yet infrequent losses.
Overall performance was assessed by subtracting the number of cards selected from
disadvantageous decks (i.e., decks A and B) and from the number of cards selected from
advantageous decks (i.e., decks C and D). To assess learning throughout the tasks, scores for
each block were determined using the same procedure just described (see Bechara, Damasio,
Tranel, & Damasio, 1997). Following completion of the IGT, participants’ understanding of the
task and the strategy they employed were assessed by asking them an open-ended question (e.g.,
“Tell me everything you know about the game.”).
Psychophysiological measurements. Interbeat interval (IBI) was recorded using
Biolog, a portable physiological data recorder. To measure IBI, one electrode was placed just
above the collarbone on the participant’s right side, one electrode was placed behind the
participant’s left knee, and a reference electrode was placed on the right side of the participant’s
neck. IBI was assessed continuously throughout the IGT. To evaluate the influence of
medications or drugs on the child’s psychophysiological measurements, each child was asked
whether he/she had used alcohol, marijuana, or other substances in the past 24 hours.
After placement of the electrodes but prior to the start of the IGT, each child viewed a 2-
minute video that was neutral in content and unlikely to evoke an emotional reaction. This 2-
minute period allowed participants to acclimate to the Biolog so that any physiological response
39
resulting from the participants’ unfamiliarity with the device will not confound measurements.
RSA reactivity is the change in RSA that occurs during the IGT. To obtain the change in RSA,
the average RSA in each block of the IGT will be subtracted from the average RSA during the 2-
minute baseline period.
Respiratory sinus arrhythmia will be derived from IBI using the following method:
1. For each data file, RSA will be calculated using the software programs CardioEdit and
CardioBatch (Brain-Body Center, University of Illinois at Chicago, 2007). Specifically,
Porges’ (1985) method will be used to measure the amplitude of RSA.
2. The IBI data will be edited to reduce artifacts the may occur due to a child moving during
recording. First, each IBI file will be scanned for outlier data points relative to adjacent
data points, and, by adding or dividing, the outlier points will be replaced by data that is
more consistent with the surrounding data. Files in which more than 5% of data points
are edited will not be included in the analyses (Calkins & Keane, 2004).
3. A 51-point moving polynomial will be stepped through the IBI data to remove trends
(i.e., detrending), such as slow periods. The result is a smoothed template, which
includes slow periodic activity that is then subtracted from the original time series to
yield a detrended residual series.
4. A bandpass filter extracts the variance only within the frequency range of spontaneous
breathing in children (.12-1.0 Hz) (CardioBatch, 2007).
5. RSA, which is reported in ln(ms2), will be calculated by taking the natural log of this
variance.
Antisocial Process Screening Device (APSD). The parent version of the APSD has 20
items (e.g., “Feels bad or guilty when he/she does something wrong,” “Is concerned about the
40
feelings of others,” “Does not show feelings or emotions”) that are rated on a three point Likert
scale (0 = “not at all true” to 2 = “definitely true”) (Frick & Hare, 2001). The APSD consists of
three subscales, CU traits, IMP/CP, and narcissism. As described above, the narcissism subscale
appears to tap the construct of boldness, which is the term being used for the narcissism scale in
the results and discussion sections.
In both community and clinic-referred samples, items reflecting each of the three
subscales typically had the highest factor loadings on their respective factors (Frick et al., 2000).
While a few items loaded onto more than one factor, items were generally more strongly
associated with their respective subscales.
Additionally, the factor structure varied depending on the nature of the sample. For
example, using the parent and teacher versions of the APSD, Frick et al. (1994) identified two
dimensions, CU traits and IMP/CP, in a clinic-referred sample of 6-13 year olds. The two-factor
solution was also found in a community sample, but a three-factor solution also emerged (Frick
et al., 2000). However, the addition of this third factor, narcissism, did not significantly improve
the model’s fit.
The reliability of the subscales in a clinical sample ranged from inadequate for the
IMP/CP (α=.64) and CU (α=.65) subscales to good for the narcissism subscale (α=.85; Frick et
al., 2000). Similar results were found in the community sample, with reliability ranging from
below acceptable on the CU subscale (α=.65) to acceptable for the narcissism (α=.83) and
IMP/CP (α=.74) subscales. In this study, the reliabilities for the IMP/CP, CU, and Boldness
subscales were α=.66, α=.71, and α=.70, respectively. For the total parent APSD, α=.85.
The subscales are substantially intercorrelated, with the most highly intercorrelated being
narcissism and IMP/CP in both the community (r= .66, p<.001) and clinic (r=.61, p<.001)
41
samples (Frick et al., 2000). The correlations between the CU and the narcissism subscales were
r=.55 (p<.001) and r=.52 (p<.001) in the clinic and community samples, respectively. Frick et
al. (2000) also reported that the correlations between CU and IMP/CP were also significant at
p<.001 in both the community (r=.57) and clinic samples (r=.4). The high psychopathy cluster,
defined as having high scores on all subscales of the APSD, had the most diagnoses based on the
Children’s Symptoms Inventory-4. More specifically, 73% of the high psychopathy group met
diagnostic criteria for CD or ODD.
Missing Data
To account for missing data, multiple imputation was used. Multiple imputation is a
procedure in which each missing data point of a given variable is predicted from actual values of
that variable (Wayman, 2003). Missing data are replaced with m>1 plausible values to generate
multiple imputed data sets (Schafer & Olsen, 1998). This method is preferred to simply
replacing the missing data with the average of the observed data because it retains the natural
variation of the data since the values of the missing data are estimated (Wayman, 2003). As seen
in Table 1, the percentage of missing data ranged from 2.7% to 23.4%. One school of thought is
that fewer imputations are needed to produce accurate and reliable estimates of the missing data
(Graham and Schafer, 1999). However, more recent research has suggested that a greater
number of imputations be used to offset reductions in power. For example, Graham, Olchowski,
and Gilreach (2007) suggest using 20 imputations when the percentage of missing data ranges
between 10-30 percent. Thus, since the rate of missing data in the current study was generally
within this range, 20 imputations were used. The multiple imputation procedure was conducted
in SPSS version 20. In addition to the 20 imputed data sets created, SPSS also provides pooled
parameter estimates for the analyses conducted in this study. After using multiple imputation,
42
the final sample size was N=111. 9 participants were excluded from the data analysis because
they were missing data for each of the three main variables, the APSD, RSA, and the IGT.
As previously mentioned, Table 1 shows the percentage of data missing for each variable,
other than gender, for the overall sample, and Table 2 shows the percentage of missing data for
males and females. Males and females were generally missing similar percentages of data,
except on the IGT. More females than males were missing data on the IGT, particularly in the
last block, but none of these differences was significant.
Additionally, the skewness and kurtosis for the independent variables is reported in Table
3. Skewness was generally not problematic as the observed values were within the -1 to +1
range. The range of kurtosis values used to assess normality varies, particularly due to the level
of stringency employed by researchers. A stringent approach to the acceptable values of kurtosis
is when they fall between -1 and 1 (Garson, 2012), while other approaches have been more
lenient. For example, Curran, West, and Finch, (1996) began to find substantial problems when
kurtosis was above 7. Garson also noted that the range from -3 to 3 is also used as an indication
of normality. Examining kurtosis is one way to assess the normality of data, and regression is
robust to violations of normality. Given the absence of a firm range of acceptable kurtosis
values and the observed kurtosis values barely exceeding 4, along with regression being robust to
violations of normality, the variables with elevated kurtosis values were not transformed. It
should also be noted that the regression analyses were conducted with transformations of the
variables with elevated kurtosis, and the obtained results were very similar to those from the
analyses described in this paper.
43
Table 1
Percent Missing Data in Entire Sample
Variable Percent Missing
IGT Block 1 15.3% IGT Block 2 14.4% IGT Block 3 14.4% IGT Block 4 14.4% IGT Block 5 23.4% Baseline RSA 19.8% RSA Block 1 19.8% RSA Block 2 20.7% RSA Block 3 20.7% RSA Block 4 21.6% RSA Block 5 21.6% APSD Total 2.7% Boldness 2.7% Impulsivity/Conduct Problems 2.7% Callous/Unemotional 2.7%
Table 2 Percent Missing Data for Boys and Girls
Variable Percent Missing for Boys
Percent Missing for Girls
IGT Block 1 12.7% 16.2% IGT Block 2 11.3% 16.2% IGT Block 3 11.3% 16.2% IGT Block 4 11.3% 16.2% IGT Block 5 18.3% 29.7% Baseline RSA 18.3% 16.2% RSA Block 1 18.3% 16.2% RSA Block 2 18.3% 18.9% RSA Block 3 18.3% 18.9% RSA Block 4 19.7% 18.9% RSA Block 5 19.7% 18.9% APSD Total 2.8% 0% Boldness 2.8% 0% Impulsivity/Conduct Problems 2.8% 0% Callous/Unemotional 2.8% 0%
44
Table 3
Pooled Skewness and Kurtosis
Variable Skewness Kurtosis
IGT Block 1 -1.01 1.88 IGT Block 2 -.74 1.26 IGT Block 3 .33 1.76 IGT Block 4 .01 2.62 IGT Block 5 -.28 4.10 Baseline RSA -.54 .56 RSA Block 1 -.25 1.44 RSA Block 2 -.21 3.36 RSA Block 3 -.33 2.50 RSA Block 4 -.57 2.04 RSA Block 5 -.82 3.21 APSD Total .03 -.69 Boldness .25 -.09 Impulsivity/Conduct Problems .14 -.30 Callous/Unemotional .24 -.27
Power analysis
A post-hoc power analysis was conducted in G-Power (Faul, Erdfelder, Buchner, &
Lang, 2009) to determine the needed sample size to achieve a power of .80, using p=.05 and the
correlation (r=-.19) between the IGT in block 5 and CU traits. This approach provides an
estimate of the needed sample size to conduct hierarchical regression analyses, and the results of
the power analysis indicated that a sample size of 167 was needed.
45
DATA ANALYSIS AND RESULTS
Correlations between Independent Variables
The correlations between the independent variables were examined. Each of the
subscales of the Antisocial Process Screening Device (APSD) was significantly correlated with
the other two subscales, and the scores from all three subscales were significantly correlated with
the total APSD score. See Table 4 for these correlations and Table 5 for the mean scores on the
APSD and its subscales. The subscales were moderately correlated with each other, but the
correlations were not sufficiently large to preclude including the subscales in the same regression
analysis. Additionally, the following were the mean scores for the total APSD.
The correlation for boldness (i.e., narcissism) subscale and baseline RSA approached
significance, r=.20, p=.06. CU traits and Impulsivity were not significantly correlated with
baseline RSA. Neither the total APSD score nor any of the APSD subscales was significantly
correlated with RSA-Reactivity (RSA-R) in any of the blocks. See Table 6.
Baseline RSA was significantly correlated with RSA-R in blocks 2-5. RSA-R in each
block was significantly correlated with RSA-R in the other 4 blocks. See Table 7.
Table 4 Pearson Correlation Matrix between subscales of the APSD
IMP/CP CU NARC
IMP/CP -- .48** .54** CU -- -- .46**
**p<.001
46
Table 5 Mean scores on the APSD and it subscales
Mean of Entire Sample
SD Mean for
Boys SD
Mean for Girls
SD
APSD Total 14.74 5.97 15.52 5.80 13.19 6.09 IMP/CP 4.86 1.87 5.15 1.90 4.28 1.68 CU 3.80 2.29 4.16 2.25 3.07 2.23 Boldness 5.18 2.66 5.26 2.60 5.01 2.81
Table 6 Pearson Correlation Matrix between Baseline RSA or RSA Reactivity and Psychopathy
APSD Total IMP/CP CU Boldness
Baseline RSA .12 .02 .03 .20 RSA-R Block 1 .10 .00 .15 .11 RSA-R Block 2 .09 .02 .07 .13 RSA-R Block 3 .01 -.02 .02 .06 RSA-R Block 4 .01 .03 .07 -.03 RSA-R Block 5 -.01 .03 .04 -.04
Table 7 Pearson Correlation Matrix between Baseline RSA and RSA Reactivity
Baseline RSA
RSA-R Block 1
RSA-R Block 2
RSA-R Block 3
RSA-R Block 4
RSA-R Block 5
Baseline RSA -- .15 .29* .33* .36* 28* RSA-R Block 1 -- -- .67** .60** .48** .26* RSA-R Block 2 -- -- -- .74** .6588 .54** RSA-R Block 3 -- -- -- -- .82** .67** RSA-R Block 4 -- -- -- -- -- .78**
Correlations between Independent and Dependent Variables
Baseline RSA and RSA reactivity were not significantly correlated with performance on
the IGT. Neither the APSD total score nor any of the subscales were significantly correlated
IGT performance. There was a trend toward significance for the correlation between CU traits
47
and IGT performance in block 5 (r= -.19, p=.08). However, as discussed previously, the IGT
measures affective decision-making, which is influenced by developmental level, with older
children typically doing better on the task than younger children. More specifically, 11-13 year
olds did better than 9-10 year olds on the IGT children (Hooper et al., 2004). In the current
study, youth ranged in age from 9.34 to 11.70 years, which spans the two age ranges previously
mentioned. Based on these findings, it was possible that there may be differences in
performance on the IGT due to developmental level within the current sample. To assess for this
possibility, the correlations between psychopathy (APSD and each subscale) and the IGT were
obtained for the oldest third of the sample (i.e., those youth who were at least 10.46 years old).
The correlation between CU traits and IGT performance in block five was significant (r=-.36,
p=.04), which suggests that relationship between affective decision-making in the presence of
CU traits is influenced by developmental level. There was also a trend toward significance for
the boldness-IGT block 5 correlation (r=-.34, p= .08). See Tables 8 and 9 for the rest of the
correlations.
Table 8 Pearson Correlation Matrix between the Iowa Gambling Task and RSA
IGT Block 1 IGT Block 2 IGT Block 3 IGT Block 4 IGT Block 5
Baseline RSA -.09 .10 .13 -.00 .08 RSA-R Block 1 .03 .11 .03 -.12 -.07 RSA-R Block 2 .11 .01 .11 -.08 -.03 RSA-R Block 3 .07 .00 .09 .00 -.06 RSA-R Block 4 .09 .00 .11 .03 .02 RSA-R Block 5 .12 -.03 .07 -.02 .02
48
Table 9 Pearson Correlation Matrix between the Iowa Gambling Task and the APSD
APSD Total IMP/CP CU NARC
IGT Block 1 .07 .10 .07 .02 IGT Block 2 .02 -.08 .03 .04 IGT Block 3 .16 .06 .12 .17 IGT Block 4 .00 .00 .01 -.01 IGT Block 5 -.13 .01 -.19 -.17
IGT Performance and Correlations by Block
Another set of preliminary analyses focused on the IGT. The total score in each block
was determined to observe overall performance across the task. As discussed previously, since
learning typically begins to emerge in Block 3 of the IGT for several types of samples (e.g.,
patients with brain damage, control participants), so the performance in blocks 3-5 were used in
the primary analyses.
The mean score in each block of the IGT indicated that not only did the participants in
this study not perform well, they also did not demonstrate that learning of the task occurred. See
Table 10.
Table 10 Mean Score by Block on the IGT
Mean Score SD
IGT Block 1 -1.35 2.85 IGT Block 2 -.62 4.07 IGT Block 3 -.64 4.64 IGT Block 4 -1.06 6.05 IGT Block 5 -1.40 7.28
49
IGT performance in block 1 was significantly correlated with IGT performance in block
2. IGT performance in block 2 was significantly correlated with IGT performance in blocks 3
and 4. IGT performance in block 3 was also significantly correlated with performance in block
4. See Table 11.
Table 11 Pearson Correlation Matrix between blocks on the Iowa Gambling Task
IGT Block 1 IGT Block 2 IGT Block 3 IGT Block 4 IGT Block 5
IGT Block 1 -- .29** .08 .13 .06 IGT Block 2 -- -- .23* .27** .01 IGT Block 3 -- -- -- .36** -.04 IGT Block 4 -- -- -- -- .05
*p<.05, **p<.001
Potential Covariates
Because prior research has shown that RSA has been correlated with internalizing
behaviors, the correlations between both baseline RSA and RSA-R in each block and the BASC
internalizing composites were examined. Neither of these correlations was significant, as seen in
Table 12, and therefore, internalizing problems were not controlled for in the regression
analyses.
Table 12 Pearson Correlation Matrix between Baseline RSA or RSA Reactivity and Internalizing
Problems
Baseline RSA RSA-R Block 1
RSA-R Block 2
RSA-R Block 3
RSA-R Block 4
RSA-R Block 5
BASC Internalizing Composite
.03 .05 .10 .09 .10 .10
50
Primary Analyses
Hypothesis #1: Correlation between Baseline RSA and the total APSD
Baseline respiratory sinus arrhythmia (RSA) was expected to be negatively correlated
with the total APSD score. The hypothesis was not supported, as the correlation was not
significant, r= .12, p=. 26. Additionally, the two variables were positively correlated, which was
in the opposite direction of what was expected.
Hypothesis #2: APSD Total Score, Baseline RSA, and RSA Reactivity
To test the second hypothesis that psychopathic traits and respiratory sinus arrhythmia
predicted performance on the IGT, a hierarchical regression analysis was performed. In the
regression models examining the influence of the total APSD score and baseline RSA on IGT
performance, the APSD total score and baseline RSA were entered into Step 1. As stated earlier,
the rationale for examining the main effects of psychopathy and RSA (baseline or reactivity) is
that they can be considered inherent features that influence performance on the IGT. Given that
it was anticipated that the degree of psychopathy and relative levels of RSA would also jointly
influence IGT performance, the interaction of these variables, APSD total score x Baseline RSA,
was entered in step 2. Finally, because gender differences in psychopathy have been found,
gender and the gender x APSD total score interaction were entered in step 3, and, finally, in step
4, the gender x baseline RSA and gender x baseline RSA x APSD interactions were entered. The
dependent variable was IGT performance in blocks 3, 4, and 5. This hierarchical regression was
repeated with RSA-R in each block of the IGT as a predictor variable. To summarize, step 1 is
the same in each model (i.e., psychopathy variables and RSA), and steps 2-4 vary, depending on
the model.
51
No significant main effects were found when the total APSD score and baseline RSA or
RSA reactivity were entered as predictors of IGT performance in blocks 3 through 5. Tables 13-
18 display the results of the regression analyses of the APSD, baseline RSA, and RSA-R for all
five blocks of the IGT.
Table 13 Hierarchical Regression Analysis of the APSD and Baseline RSA Predicting IGT
Performance in Block 3
Step and Variable B SE B p
Step 1 APSD .68 .47 .15 Baseline RSA .54 .51 .29 Step 2 APSD .68 .48 .16 Baseline RSA .54 .53 .30 Baseline RSA x APSD -.01 .56 .99 Step 3 APSD -.37 1.48 .81 Baseline RSA .57 .54 .29 Baseline RSA x APSD .04 .58 .94 Gender .35 1.05 .74 Gender x APSD .79 1.04 .45 Step 4 APSD -.27 1.51 .86 Baseline RSA .27 1.54 .86 Baseline RSA x APSD .45 1.67 .79 Gender .37 1.06 .73 Gender x APSD .71 1.07 .51 Gender x Baseline RSA .24 1.09 .83 Gender x Baseline RSA
x APSD -.30 1.07 .78
52
Table 14 Hierarchical Regression Analysis of the APSD and Baseline RSA Predicting IGT
Performance in Block 4
Step and Variable B SE B p
Step 1 APSD .03 .63 .97 RSA-R Block 4 -.01 .62 .99 Step 2 APSD .10 .64 .87 Baseline RSA .09 .63 .14 Baseline RSA x APSD .74 .68 .28 Step 3 APSD -1.93 1.97 .33 Baseline RSA .12 .64 .85 Baseline RSA x APSD .82 .70 1.18 Gender .11 1.37 .94 Gender x APSD 1.50 1.38 .28 Step 4 APSD -.19 2.02 .35 Baseline RSA -1.90 1.93 .32 Baseline RSA x APSD -.56 2.08 .79 Gender .06 1.37 .97 Gender x APSD 1.50 1.43 .29 Gender x Baseline RSA 1.54 1.38 .26 Gender x Baseline RSA
x APSD .96 1.39 .49
53
Table 15 Hierarchical Regression Analysis of the APSD and Baseline RSA Predicting IGT
Performance in Block 5
Step and Variable B SE B p
Step 1 APSD -1.01 .82 .22 Baseline RSA .68 .75 .37 Step 2 APSD -.99 .83 .23 Baseline RSA .72 .76 .34 Baseline RSA x APSD .25 .87 .78 Step 3 APSD -1.58 2.37 .50 Baseline RSA .75 .75 .32 Baseline RSA x APSD .35 .89 .70 Gender 2.46 1.59 .12 Gender x APSD .60 1.62 .71 Step 4 APSD -1.32 2.40 .58 Baseline RSA -2.91 2.36 .22 Baseline RSA x APSD -.56 2.72 .84 Gender 2.44 1.59 .13 Gender x APSD .43 1.64 .79 Gender x Baseline RSA 2.83 1.71 .10 Gender x Baseline RSA
x APSD .60 1.75 .73
54
Table 16 Hierarchical Regression Analysis of the APSD and RSA Reactivity Predicting IGT
Performance in Block 3
Step and Variable B SE B p
Step 1 APSD .73 .47 .12 RSA-R Block 3 .43 .57 .46 Step 2 APSD .73 .47 .12 RSA-R Block 3 .43 .57 .43 RSA-R Block 3 x APSD -.15 .55 .78 Step 3 APSD -.38 1.49 .80 RSA-R Block 3 .46 .58 .43 RSA-R Block 3 x APSD -.15 .56 .80 Gender .19 1.06 .86 Gender x APSD .82 1.04 .43 Step 4 APSD -.30 1.51 .84 RSA-R Block 3 .39 1.84 .83 RSA-R Block 3 x APSD .80 1.71 .64 Gender .10 1.07 .93 Gender x APSD .76 1.05 .47 Gender x RSA-R Block 3 .09 1.24 .95 Gender x RSA-R Block 3
x APSD -.73 1.19 .54
55
Table 17
Hierarchical Regression Analysis of the APSD and RSA Reactivity Predicting IGT
Performance in Block 4
Step and Variable B SE B p
Step 1 APSD .02 .63 .97 RSA-R Block 4 .16 .68 .81 Step 2 APSD .10 .63 .88 RSA-R Block 4 .11 .71 .88 RSA-R Block 4 x APSD .88 .65 .18 Step 3 APSD -2.02 1.95 .30 RSA-R Block 4 .17 .72 .81 RSA-R Block 4 x APSD .96 .67 .15 Gender .26 1.40 .85 Gender x APSD 1.58 1.37 .25 Step 4 APSD -2.25 1.96 .25 RSA-R Block 4 -.26 1.93 .89 RSA-R Block 4 x APSD -1.22 2.10 .56 Gender .40 1.41 .78 Gender x APSD 1.81 1.38 .19 Gender x RSA-R Block 4 .26 1.31 .84 Gender x RSA-R Block 4
x APSD 1.58 1.41 .27
56
Table 18 Hierarchical Regression Analysis of the APSD and RSA Reactivity Predicting IGT
Performance in Block 5
Step and Variable B SE B p
Step 1 APSD -.94 .82 .25 RSA-R Block 5 .12 .84 .89 Step 2 APSD -.95 .81 .24 RSA-R Block 5 .13 .83 .87 RSA-R Block 5 x APSD -.04 .73 .96 Step 3 APSD -1.41 2.39 .56 RSA-R Block 5 .08 .84 .93 RSA-R Block 5 x APSD .16 .76 .84 Gender 2.47 1.63 .13 Gender x APSD .51 1.63 .75 Step 4 APSD -1.88 2.38 .43 RSA-R Block 5 -1.63 2.64 .54 RSA-R Block 5 x APSD -2.75 2.35 .24 Gender 2.65 1.61 .10 Gender x APSD .92 1.63 .58 Gender x RSA-R Block 5 1.15 1.89 .54 Gender x RSA-R Block 5 x APSD 1.98 1.53 .20
57
Secondary Analyses
Two sets of secondary analyses were conducted. The first set addressed the relationship
between each of the 3 APSD subscales, baseline RSA, gender, and IGT performance in blocks 3
through 5. The second set of analyses examined the relationship between the 3 APSD subscales,
RSA reactivity, and IGT performance in blocks 3 through 5. First, hierarchical regression was
conducted to examine the relationship between each of the three facets of psychopathy on the
APSD, baseline RSA, gender, and performance on blocks 3 through 5 of the IGT. This analysis
was repeated with RSA reactivity in place of baseline RSA. For example, the 3 APSD subscales
and RSA (baseline or reactivity) were entered in step 1, followed by the CU traits x baseline
RSA interaction in step 2. In step 3, gender and the gender x CU traits interaction were entered.
Finally, in step 4, the two-way interaction, gender x baseline RSA, and the three-way interaction,
Gender x baseline RSA x CU traits, were entered. Both main effects of the three APSD
subscales and interactions were examined in these analyses, while only the interactions involving
the total APSD score are addressed in this section, as the main effects were already examined
above. The dependent variables remained performance on blocks 3 through 5 of the IGT.
Research Questions
Research Question #1: Interaction of APSD total score, Baseline RSA or RSA-R, and
Gender for blocks 3-5 of the IGT.
None of the two-way interactions or the three-way interaction between the total APSD
score, baseline RSA or RSA-R, and gender was significant.
58
Research Question #2: Main Effects and Interactions of APSD subscales, Baseline
RSA or RSA-R, and gender for blocks 3-5 of the IGT
Research question #2a: CU traits, Baseline RSA or RSA-R, and Gender for blocks
3-5 of the IGT. There were no significant main effects for CU traits, baseline RSA or RSA-R,
or gender. None of the interactions in the regression analyses in which CU traits, baseline RSA
or RSA-R, and gender significantly predicted IGT performance in blocks 3 through 5. See
Tables 19-24.
59
Table 19 Hierarchical Regression Analysis of CU Traits and Baseline RSA Predicting IGT
Performance in Block 3
Step and Variable B SE B p
Step 1 APSD-Boldness .71 .64 .27 APSD-IMP/CP -.31 .60 .60 APSD-CU .35 .55 .52 Baseline RSA .47 .54 .38
Step 2 APSD-Boldness .84 .65 .20 APSD-IMP/CP -.36 .60 .55 APSD-CU .31 .56 .58 Baseline RSA .44 .54 .41 Baseline RSA x CU .55 .58 .35
Step 3
APSD-Boldness .86 .66 .19 APSD-IMP/CP -.41 .63 .52 APSD-CU -1.26 1.46 .39 Baseline RSA .42 .54 .43 Baseline RSA x CU .52 .58 .37 Gender .17 1.10 .88 Gender x CU 1.19 1.04 .25
Step 4 APSD-Boldness .86 .70 .22 APSD-IMP/CP -.42 .64 .51 APSD-CU -1.24 1.48 .40 Baseline RSA -.38 1.55 .80 Baseline RSA x CU 1.57 1.67 .35 Gender .21 1.11 .85 Gender x CU 1.18 1.05 .26 Gender x Baseline RSA .60 1.09 .58 Gender x Baseline RSA x CU
-.73 1.18 .54
60
Table 20
Hierarchical Regression Analysis of CU Traits and Baseline RSA Predicting IGT
Performance in Block 4
Step and Variable B SE B p
Step 1 APSD-Boldness -.06 .77 .94 APSD-IMP/CP -.05 .80 .95 APSD-CU .11 .73 .88 Baseline RSA .01 .64 .99
Step 2 APSD-Boldness .17 .78 .83 APSD-IMP/CP -.13 .80 .87 APSD-CU .03 .73 .97 Baseline RSA -.07 .64 .92 Baseline RSA x CU 1.01 .74 .17
Step 3
APSD-Boldness .22 .80 .78 APSD-IMP/CP -.21 .82 .80 APSD-CU -1.45 1.98 .47 Baseline RSA -.09 .65 .89 Baseline RSA x CU 1.00 .74 .18 Gender -.13 1.44 .93 Gender x CU 1.10 1.44 .45
Step 4 APSD-Boldness .51 .84 .54 APSD-IMP/CP -.38 .84 .65 APSD-CU -1.38 1.98 .48 Baseline RSA -2.86 2.01 .16 Baseline RSA x CU .58 2.15 .79 Gender -.23 1.44 .87 Gender x CU .98 1.43 .49 Gender x Baseline RSA 2.14 1.44 .14 Gender x Baseline RSA x CU
.47 1.56 .76
61
Table 21
Hierarchical Regression Analysis of CU Traits and Baseline RSA Predicting IGT
Performance in Block 5
Step and Variable B SE B p
Step 1 APSD-Boldness -1.58 .92 .09 APSD-IMP/CP 1.58 .94 .10 APSD-CU -1.43 .90 .11 Baseline RSA .88 .76 .25
Step 2 APSD-Boldness -1.62 .96 .09 APSD-IMP/CP 1.59 .95 .10 APSD-CU -1.41 .91 .12 Baseline RSA .89 .76 .24 Baseline RSA x CU -.17 .87 .85
Step 3
APSD-Boldness -1.87 .97 .06 APSD-IMP/CP 1.88 .95 .05 APSD-CU -1.66 2.28 .47 Baseline RSA .96 .75 .20 Baseline RSA x CU -.26 .87 .76 Gender 2.91 1.61 .07 Gender x CU .40 1.63 .81
Step 4 APSD-Boldness -1.73 1.01 .09 APSD-IMP/CP 1.76 .96 .07 APSD-CU -1.64 2.25 .47 Baseline RSA -2.03 2.33 .38 Baseline RSA x CU 1.44 2.62 .58 Gender 2.93 1.63 .07 Gender x CU .37 1.61 .82 Gender x Baseline RSA 2.26 1.68 .18 Gender x Baseline RSA x CU
-1.10 1.93 .57
62
Table 22
Hierarchical Regression Analysis of CU Traits and RSA Reactivity Predicting IGT
Performance in Block 3
Step and Variable B SE B p
Step 1 APSD-Boldness .81 .61 .19 APSD-IMP/CP -.34 .60 .57 APSD-CU .33 .56 .55 RSA-R Block 3 .37 .59 .53
Step 2 APSD-Boldness .80 .61 .19 APSD-IMP/CP -.35 .60 .56 APSD-CU .31 .56 .59 RSA-R Block 3 .35 .60 .56 RSA-R Block 3 x CU -.19 .57 .73
Step 3 APSD-Boldness .84 .62 .18 APSD-IMP/CP -.41 .62 .50 APSD-CU -1.53 1.49 .30 RSA-R Block 3 .42 .60 .48 RSA-R Block 3 x CU -.24 .57 .68 Gender .02 1.12 .99 Gender x CU 1.37 1.07 .20
Step 4 APSD-Boldness .79 .65 .23 APSD-IMP/CP -.37 .64 .56 APSD-CU -1.30 1.53 .40 RSA-R Block 3 .39 1.88 .84 RSA-R Block 3 x CU .80 1.93 .68 Gender -.10 1.14 .93 Gender x CU 1.19 1.10 .28 Gender x RSA-R Block 3 .03 1.26 .98 Gender x RSA-R Block 3 x CU -.86 1.52 .57
63
Table 23
Hierarchical Regression Analysis of CU Traits and RSA Reactivity Predicting IGT
Performance in Block 4
Step and Variable B SE B p
Step 1 APSD-Boldness -.05 .75 .95 APSD-IMP/CP -.06 .79 .94 APSD-CU .10 .74 .89 RSA-R Block 4 .16 .70 .82
Step 2 APSD-Boldness .01 .75 .99 APSD-IMP/CP -.05 .78 .95 APSD-CU .17 .75 .83 RSA-R Block 4 .15 .72 .84 RSA-R Block 4 x CU 1.00 .68 .15
Step 3 APSD-Boldness .04 .76 .96 APSD-IMP/CP -.10 .80 .91 APSD-CU -1.41 2.01 .48 RSA-R Block 4 .19 .73 .79 RSA-R Block 4 x CU 1.01 .69 .15 Gender .25 1.47 .87 Gender x CU 1.20 1.46 .41
Step 4 APSD-Boldness .22 .78 .77 APSD-IMP/CP -.24 .82 .57 APSD-CU -1.58 2.03 .44 RSA-R Block 4 -.81 2.00 .68 RSA-R Block 4 x CU -.83 2.29 .72 Gender .18 1.48 .90 Gender x CU 1.33 1.48 .37 Gender x RSA-R Block 4 .77 1.36 .57 Gender x RSA-R Block 4 x CU 1.44 1.67 .39
64
Table 24
Hierarchical Regression Analysis of CU Traits and RSA Reactivity Predicting IGT
Performance in Block 5
Step and Variable B SE B p
Step 1 APSD-Boldness -1.34 .90 .14 APSD-IMP/CP 1.48 .94 .12 APSD-CU -1.48 .90 .10 RSA-R Block 5 .10 .83 .91
Step 2 APSD-Boldness -1.36 .91 .14 APSD-IMP/CP 1.48 .95 .12 APSD-CU -1.48 .90 .10 RSA-R Block 5 .09 .82 .91 RSA-R Block 5 x CU -.14 .77 .85
Step 3 APSD-Boldness -1.55 .92 .09 APSD-IMP/CP 1.75 .95 .07 APSD-CU -1.80 2.31 .44 RSA-R Block 5 .01 .83 .99 RSA-R Block 5 x CU .09 .78 .91 Gender 2.84 1.64 .08 Gender x CU .46 1.65 .78
Step 4 APSD-Boldness -1.41 .93 .13 APSD-IMP/CP 1.59 .96 .10 APSD-CU -2.25 2.36 .34 RSA-R Block 5 -1.44 2.60 .58 RSA-R Block 5 x CU -2.01 2.40 .40 Gender 2.93 1.64 .08 Gender x CU .90 1.68 .59 Gender x RSA-R Block 5 1.05 1.79 .56 Gender x RSA-R Block 5 x CU 1.56 1.77 .38
65
Research question #2b: Impulsivity /Conduct Problems, Baseline RSA or RSA-R,
and Gender for blocks 3-5 of the IGT. There were no significant main effects for
impulsivity/conduct problems, baseline RSA or RSA-R, or gender. None of the interactions in
the regression model where impulsivity, baseline RSA or RSA-R, and gender predicted IGT
performance in block 3 through 5 was significant (see Tables 25-30).
66
Table 25
Hierarchical Regression Analysis of Impulsivity/Conduct Problems and Baseline RSA
Predicting IGT Performance in Block 3
Step and Variable B SE B p
Step 1 APSD-Boldness .71 .64 .27 APSD-IMP/CP -.31 .60 .60 APSD-CU .35 .55 .52 Baseline RSA .47 .54 .38
Step 2 APSD-Boldness .72 .63 .26 APSD-IMP/CP -.32 .60 .59 APSD-CU .35 .55 .53 Baseline RSA .50 .57 .38 Baseline RSA x IMP/CP .10 .61 .88
Step 3
APSD-Boldness .71 .65 .27 APSD-IMP/CP -1.44 1.55 .35 APSD-CU .30 .57 .60 Baseline RSA .48 .57 .40 Baseline RSA x IMP/CP .11 .61 .86 Gender .20 1.09 .86 Gender x IMP/CP .90 1.12 .42
Step 4 APSD-Boldness .86 .67 .20 APSD-IMP/CP -1.38 1.55 .37 APSD-CU .24 .57 .67 Baseline RSA -.60 1.63 .71 Baseline RSA x IMP/CP -1.47 1.92 .45 Gender .06 1.11 .96 Gender x IMP/CP .81 1.13 .48 Gender x Baseline RSA .88 1.17 .45 Gender x Baseline RSA x IMP/CP
1.33 1.49 .37
67
Table 26
Hierarchical Regression Analysis of Impulsivity/Conduct Problems and Baseline RSA Predicting
IGT Performance in Block 4
Step and Variable B SE B p
Step 1 APSD-Boldness -.06 .77 .94 APSD-IMP/CP -.05 .80 .95 APSD-CU .11 .73 .88 Baseline RSA .01 .64 .99
Step 2 APSD-Boldness -.06 .77 .94 APSD-IMP/CP -.08 .80 .92 APSD-CU .12 .74 .87 Baseline RSA .11 .67 .87 Baseline RSA x IMP/CP .49 .78 .53
Step 3
APSD-Boldness -.04 .79 .96 APSD-IMP/CP -1.24 2.10 .56 APSD-CU .04 .75 .95 Baseline RSA .08 .68 .90 Baseline RSA x IMP/CP .51 .78 .51 Gender -.09 1.43 .95 Gender x IMP/CP .91 1.49 .54
Step 4 APSD-Boldness .19 .81 .81 APSD-IMP/CP -1.16 2.10 .58 APSD-CU -.03 .75 .97 Baseline RSA -2.50 2.09 .23 Baseline RSA x IMP/CP -.61 2.46 .81 Gender -.23 1.43 .87 Gender x IMP/CP .74 1.50 .62 Gender x Baseline RSA 2.03 1.53 .19 Gender x Baseline RSA x IMP/CP
.98 1.94 .61
68
Table 27 Hierarchical Regression Analysis of Impulsivity/Conduct Problems and Baseline RSA
Predicting IGT Performance in Block 5
Step and Variable B SE B p
Step 1 APSD-Boldness -1.58 .92 .09 APSD-IMP/CP 1.58 .94 .10 APSD-CU -1.43 .90 .11 Baseline RSA .88 .76 .25
Step 2 APSD-Boldness -1.60 .92 .08 APSD-IMP/CP 1.58 .95 .10 APSD-CU -1.42 .90 .12 Baseline RSA .88 .79 26 Baseline RSA x IMP/CP -.04 .94 .97
Step 3
APSD-Boldness -1.84 .93 .05 APSD-IMP/CP 1.61 2.33 .49 APSD-CU -1.17 .92 .20 Baseline RSA .93 .77 .23 Baseline RSA x IMP/CP -.13 .95 .89 Gender 2.89 1.62 .07 Gender x IMP/CP .22 1.65 .89
Step 4 APSD-Boldness -1.65 .95 .08 APSD-IMP/CP 1.65 2.31 .48 APSD-CU -1.21 .93 .19 Baseline RSA -2.14 2.44 .38 Baseline RSA x IMP/CP .11 2.97 .97 Gender 2.85 1.63 .08 Gender x IMP/CP .08 1.64 .96 Gender x Baseline RSA 2.38 1.79 .18 Gender x Baseline RSA x IMP/CP
-.11 2.27 .96
69
Table 28
Hierarchical Regression Analysis of Impulsivity/Conduct Problems and RSA Reactivity
Predicting IGT Performance in Block 3
Step and Variable B SE B p
Step 1 APSD-CU .33 .56 .55 APSD-Boldness .81 .61 .19 APSD-IMP/CP -.34 .60 .57 RSA-R Block 3 .37 .59 .53
Step 2 APSD-CU .30 .56 .58 APSD-Boldness .85 .62 .17 APSD-IMP/CP -.37 .60 .54 RSA-R Block 3 .35 .60 .56 RSA-R Block 3 x IMP/CP -.25 .61 .68
Step 3 APSD-CU .23 .57 .69 APSD-Boldness .87 .63 .17 APSD-IMP/CP -1.67 1.63 .31 RSA-R Block 3 .35 .60 .56 RSA-R Block 3 x IMP/CP -.31 .64 .63 Gender .06 1.09 .96 Gender x IMP/CP 1.03 1.16 .38
Step 4 APSD-CU .22 .58 .70 APSD-Boldness .87 .64 .18 APSD-IMP/CP -1.68 1.66 .31 RSA-R Block 3 .43 1.92 .82 RSA-R Block 3 x IMP/CP .30 1.99 .88 Gender .04 1.11 .97 Gender x IMP/CP 1.05 1.20 .38 Gender x RSA-R Block 3 -.07 1.29 .96 Gender x RSA-R Block 3 x IMP/CP -.53 1.64 .75
70
Table 29 Hierarchical Regression Analysis of Impulsivity/Conduct Problems and RSA Reactivity
Predicting IGT Performance in Block 4
Step and Variable B SE B p
Step 1 APSD-CU .10 .74 .89 APSD-Boldness -.05 .75 .95 APSD-IMP/CP -.06 .79 .94 RSA-R Block 4 .16 .70 .82
Step 2 APSD-CU .09 .75 .90 APSD-Boldness -.04 .75 .96 APSD-IMP/CP -.06 .79 .94 RSA-R Block 4 .16 .72 .82 RSA-R Block 4 x IMP/CP -.02 .83 .98
Step 3 APSD-CU .02 .78 .98 APSD-Boldness -.03 .77 .97 APSD-IMP/CP -1.19 2.08 .57 RSA-R Block 4 .17 .73 .82 RSA-R Block 4 x IMP/CP -.04 .84 .97 Gender -.05 1.45 .97 Gender x IMP/CP .88 1.49 .55
Step 4 APSD-CU .03 .79 .97 APSD-Boldness .10 .79 .90 APSD-IMP/CP -1.04 2.11 .62 RSA-R Block 4 -.94 2.15 .66 RSA-R Block 4 x IMP/CP -1.57 3.03 .61 Gender -.26 1.49 .86 Gender x IMP/CP .68 1.54 .66 Gender x RSA-R Block 4 .87 1.47 .55 Gender x RSA-R Block 4 x IMP/CP 1.37 2.52 .59
71
Table 30
Hierarchical Regression Analysis of Impulsivity/Conduct Problems and RSA Reactivity
Predicting IGT Performance in Block 5
Step and Variable B SE B p
Step 1 APSD-CU -1.48 .90 .10 APSD-Boldness -1.34 .90 .14 APSD-IMP/CP 1.48 .94 .12 RSA-R Block 5 .10 .83 91
Step 2 APSD-CU -1.56 .92 .09 APSD-Boldness -1.33 .91 .14 APSD-IMP/CP 1.52 .95 .11 RSA-R Block 5 .03 .83 .97 RSA-R Block 5 x IMP/CP -.55 .90 .54
Step 3 APSD-CU -1.31 .95 .17 APSD-Boldness -1.55 .92 .10 APSD-IMP/CP 1.23 2.30 .59 RSA-R Block 5 -.07 .83 .93 RSA-R Block 5 x IMP/CP -.44 .92 .63 Gender 2.73 1.67 .10 Gender x IMP/CP .44 1.66 .79
Step 4 APSD-CU -1.20 .97 .22 APSD-Boldness -1.50 .93 .11 APSD-IMP/CP 1.34 2.36 .57 RSA-R Block 5 -1.58 2.57 .54 RSA-R Block 5 x IMP/CP -1.78 2.94 .55 Gender 2.73 1.66 .10 Gender x IMP/CP .29 1.72 .87 Gender x RSA-R Block 5 1.14 1.78 .52 Gender x RSA-R Block 5 x IMP/CP 1.17 2.40 .62
72
Research question #2c: Boldness, Baseline RSA or RSA-R, and Gender for
blocks 3-5 of the IGT. There were no significant main effects for boldness, baseline
RSA or RSA-R, or gender. None of the interactions in the regression analyses with
baseline RSA or RSA-R significantly predicted IGT performance in blocks 3-5 (see
tables 31-36).
73
Table 31
Hierarchical Regression Analysis of Boldness and Baseline RSA Predicting IGT
Performance in Block 3
Step and Variable B SE B p
Step 1 APSD-Boldness .71 .64 .27 APSD-IMP/CP -.31 .60 .60 APSD-CU .35 .55 .52 Baseline RSA .47 .54 .38
Step 2 APSD-Boldness .68 .63 .28 APSD-IMP/CP -.28 .60 .64 APSD-CU .32 .56 .56 Baseline RSA .45 .55 .42 Baseline RSA x Boldness -.21 .46 .65
Step 3
APSD-Boldness .65 1.59 .68 APSD-IMP/CP -.28 .62 .65 APSD-CU .32 .58 .58 Baseline RSA .45 .57 .43 Baseline RSA x Boldness -.20 .48 .67 Gender .01 1.13 .99 Gender x Boldness .02 .99 .98
Step 4 APSD-Boldness .90 1.63 .58 APSD-IMP/CP -.31 .64 .62 APSD-CU .29 .59 .63 Baseline RSA -.34 1.76 .85 Baseline RSA x Boldness .23 1.57 .88 Gender .03 1.16 .98 Gender x Boldness -.14 1.02 .89 Gender x Baseline RSA .64 1.18 .59 Gender x Baseline RSA x Boldness
-.34 .95 .72
74
Table 32 Hierarchical Regression Analysis of Boldness and Baseline RSA Predicting IGT
Performance in Block 4
Step and Variable B SE B P
Step 1 APSD-Boldness -.06 .77 .94 APSD-IMP/CP -.05 .80 .95 APSD-CU .11 .73 .88 Baseline RSA .01 .64 .99
Step 2 APSD-Boldness -.01 .78 .99 APSD-IMP/CP -.10 .80 .90 APSD-CU .17 .74 .82 Baseline RSA .07 .65 .91 Baseline RSA x Boldness .43 .58 .46
Step 3
APSD-Boldness -1.84 2.06 .37 APSD-IMP/CP -.05 .82 .95 APSD-CU .21 .77 .79 Baseline RSA .17 .67 .80 Baseline RSA x Boldness .52 .61 .39 Gender .06 1.46 .97 Gender x Boldness 1.31 1.33 .33
Step 4 APSD-Boldness -1.56 2.13 .47 APSD-IMP/CP -.17 .82 .83 APSD-CU .15 .77 .84 Baseline RSA -1.87 2.18 .39 Baseline RSA x Boldness -1.34 1.97 .49 Gender -.19 1.48 .90 Gender x Boldness 1.28 1.38 .35 Gender x Baseline RSA 1.40 1.50 .35 Gender x Baseline RSA x Boldness
1.17 1.22 .34
75
Table 33
Hierarchical Regression Analysis of Boldness and Baseline RSA Predicting IGT
Performance in Block 5
Step and Variable B SE B p
Step 1 APSD-Boldness -1.58 .92 .09 APSD-IMP/CP 1.58 .94 .10 APSD-CU -1.43 .90 .11 Baseline RSA .88 .76 .25
Step 2 APSD-Boldness -1.57 .93 .09 APSD-IMP/CP 1.55 .95 .10 APSD-CU -1.41 .90 .12 Baseline RSA .91 .77 .24 Baseline RSA x Boldness .12 .74 .87
Step 3
APSD-Boldness -3.23 2.40 .18 APSD-IMP/CP 1.88 .94 .05 APSD-CU -1.08 .93 .25 Baseline RSA 1.09 .78 .16 Baseline RSA x Boldness .34 .78 .66 Gender 2.99 1.63 .07 Gender x Boldness 1.02 1.52 .50
Step 4 APSD-Boldness -2.71 2.42 .26 APSD-IMP/CP 1.71 .96 .08 APSD-CU -1.16 .93 .22 Baseline RSA -2.06 2.58 .43 Baseline RSA x Boldness -1.29 2.48 .60 Gender 2.74 1.66 .10 Gender x Boldness .83 1.54 .59 Gender x Baseline RSA 2.27 1.79 .21 Gender x Baseline RSA x Boldness
.96 1.48 .52
76
Table 34
Hierarchical Regression Analysis of Boldness and RSA Reactivity Predicting IGT
Performance in Block 3
Step and Variable B SE B p
Step 1 APSD-Boldness .81 .61 .19
APSD-IMP/CP -.34 .60 .57 APSD-CU .33 .56 .55 RSA-R Block 3 .37 .59 .53
Step 2 APSD-Boldness .80 .62 .19
APSD-IMP/CP -.35 .60 .56 APSD-CU .34 .57 .55 RSA-R Block 3 .37 .59 .53 RSA-R Block 3 x Boldness .05 .49 .93
Step 3 APSD-Boldness .78 1.53 .61
APSD-IMP/CP -.35 .62 .57 APSD-CU .33 .59 .57 RSA-R Block 3 .38 .59 .53 RSA-R Block 3 x Boldness .04 .50 .93 Gender -.08 1.10 .94 Gender x Boldness .02 .97 .98
Step 4 APSD-Boldness .70 1.58 .66 APSD-IMP/CP -.34 .64 .60
APSD-CU .34 .59 .57 RSA-R Block 3 .27 1.97 .89 RSA-R Block 3 x Boldness .79 1.65 .63 Gender -.10 1.12 .93 Gender x Boldness .05 .99 .96 Gender x RSA-R Block 3 .13 1.35 .31 Gender x RSA-R Block 3 x Boldness -.52 1.06 .62
77
Table 35
Hierarchical Regression Analysis of Boldness and RSA Reactivity Predicting IGT
Performance in Block 4
Step and Variable B SE B p
Step 1 APSD-Boldness -.05 .75 95
APSD-IMP/CP -.06 .79 .94 APSD-CU .10 .74 .89 RSA-R Block 4 .16 .70 .82
Step 2 APSD-Boldness .08 .75 .92
APSD-IMP/CP -.20 .80 .80 APSD-CU .22 .74 .76 RSA-R Block 4 -.01 .72 .99 RSA-R Block 4 x Boldness .97 .63 .13
Step 3 APSD-Boldness -2.25 1.98 .26
APSD-IMP/CP -.16 .80 .85 APSD-CU .28 .77 .71 RSA-R Block 4 .04 .75 .96 RSA-R Block 4 x Boldness 1.14 .67 .09 Gender .24 1.48 .87 Gender x Boldness 1.68 1.32 .20
Step 4 APSD-Boldness -2.36 1.99 .24
APSD-IMP/CP -.18 .81 .83 APSD-CU .30 .77 .70 RSA-R Block 4 .07 2.05 .97 RSA-R Block 4 x Boldness -.59 2.19 .79 Gender .37 1.49 .81 Gender x Boldness 1.85 1.33 .17 Gender x RSA-R Block 4 -.11 1.43 .94 Gender x RSA-R Block 4 x Boldness 1.17 1.34 .38
78
Table 36
Hierarchical Regression Analysis of Boldness and RSA Reactivity Predicting IGT
Performance in Block 5
Step and Variable B SE B p
Step 1 APSD-Boldness -1.34 .90 .14 APSD-IMP/CP 1.48 .94 .12
APSD-CU -1.48 .90 .10 RSA-R Block 5 .10 .83 .91
Step 2 APSD-Boldness -1.35 .91 .14
APSD-IMP/CP 1.49 .95 .12 APSD-CU -1.48 90 .10 RSA-R Block 5 .13 .83 .87 RSA-R Block 5 x Boldness -.06 .67 .93
Step 3 APSD-Boldness -2.48 2.37 .30 APSD-IMP/CP 1.77 .95 .06
APSD-CU -1.18 .93 .21 RSA-R Block 5 .01 .84 .99 RSA-R Block 5 x Boldness .16 .69 .81 Gender 2.83 1.65 .09 Gender x Boldness .67 1.53 .66
Step 4 APSD-Boldness -2.68 2.34 .25
APSD-IMP/CP 1.67 .95 .08 APSD-CU -1.12 .95 .24 RSA-R Block 5 -1.00 2.74 .72 RSA-R Block 5 x Boldness -2.52 2.59 .33 Gender 2.90 1.64 .08 Gender x Boldness .89 1.54 .57 Gender x RSA-R Block 5 .59 1.99 .77 Gender x RSA-R Block 5 x Boldness 1.67 1.52 .28
79
Research Question #3: Interactions of APSD total score, APSD subscales, Baseline
RSA or RSA-R, and Gender predicting performance in blocks 1-2 of the IGT.
Research Question #3a: APSD Total Score, Baseline RSA or RSA-R, and
Gender predicting performance in blocks 1-2 of the IGT. None of the interactions in
the regression analyses with the total APSD score, baseline RSA or RSA-R, and gender
predicting IGT performance in blocks 1 and 2 was significant (see Tables 37-40).
Table 37
Hierarchical Regression Analysis of the APSD and Baseline RSA Predicting IGT
Performance in Block 1
Step and Variable B SE B p
Step 1 APSD .23 .31 .45 Baseline RSA -.28 .33 .39 Step 2 APSD .25 .32 .42 Baseline RSA -.26 .33 .44 Baseline RSA x APSD .19 .36 .60 Step 3 APSD 1.37 .93 .14 Baseline RSA -.27 .33 .42 Baseline RSA x APSD .16 .37 .67 Gender .59 .66 .37 Gender x APSD -.79 .65 .22 Step 4 APSD 1.32 .95 .16 Baseline RSA .35 .99 .73 Baseline RSA x APSD .25 1.04 .81 Gender .58 .66 .38 Gender x APSD -.75 .66 .26 Gender x Baseline RSA -.48 .70 .49 Gender x Baseline RSA x APSD -.06 .68 .93
80
Table 38 Hierarchical Regression Analysis of the APSD and Baseline RSA Predicting IGT
Performance in Block 2
Step and Variable B SE B p
Step 1 APSD .02 .44 .96 Baseline RSA .40 .46 .39 Step 2 APSD .06 .44 .89 Baseline RSA .44 .47 .35 Baseline RSA x APSD .34 .50 .50 Step 3 APSD -.85 1.34 .53 Baseline RSA .47 .46 .33 Baseline RSA x APSD .41 .50 .41 Gender 1.29 .92 .16 Gender x APSD .75 .93 .42 Step 4 APSD -.93 1.37 .50 Baseline RSA 1.19 1.35 .38 Baseline RSA x APSD .52 1.49 .73 Gender 1.29 .93 .17 Gender x APSD .80 .96 .40 Gender x Baseline RSA -.56 1.00 .58 Gender x Baseline RSA
x APSD -.07 .97 .95
81
Table 39 Hierarchical Regression Analysis of the APSD and RSA Reactivity Predicting IGT
Performance in Block 1
Step and Variable B SE B p
Step 1 APSD .20 .31 .53 RSA-R Block 1 .07 .30 .83 Step 2 APSD .20 .31 .52 RSA-R Block 1 .08 .30 .79 RSA-R Block 1 x APSD -.18 .24 .60 Step 3 APSD 1.35 .93 .15 RSA-R Block 1 .06 .30 .84 RSA-R Block 1 x APSD -.18 .34 .59 Gender .57 .65 .39 Gender x APSD -.80 .63 .21 Step 4 APSD 1.33 .94 .16 RSA-R Block 1 .44 1.03 .67 RSA-R Block 1 x APSD -1.08 1.02 .29 Gender .50 .66 .45 Gender x APSD -.79 .64 .22 Gender x RSA-R Block 1 -.24 .82 .77 Gender x RSA-R Block 1 x APSD .72 .77 .35
82
Table 40 Hierarchical Regression Analysis of the APSD and RSA Reactivity Predicting IGT
Performance in Block 2
Step and Variable B SE B p
Step 1 APSD .07 .44 .88 RSA-R Block 2 .04 .50 .93 Step 2 APSD .07 .44 .88 RSA-R Block 2 .06 .51 .90 RSA-R Block 2 x APSD .17 .51 .73 Step 3 APSD -.65 1.33 .62 RSA-R Block 2 .01 .51 .99 RSA-R Block 2 x APSD .16 .50 .76 Gender 1.23 .92 .18 Gender x APSD .61 .92 .51 Step 4 APSD -.77 1.40 .58 RSA-R Block 2 1.12 1.72 .52 RSA-R Block 2 x APSD -.52 1.57 .74 Gender 1.25 .97 .20 Gender x APSD .68 .99 .49 Gender x RSA-R Block 2 -.86 1.36 .53 Gender x RSA-R Block 2 x APSD .48 1.20 .69
83
Research Question #3b: CU traits, Baseline RSA or RSA-R, and Gender
predicting performance in blocks 1-2 of the IGT. None of the interactions in the
regression models where CU traits, baseline RSA or RSA-R, and gender predicted IGT
performance in blocks 1 and 2 was significant (see Tables 41-44).
Table 41
Hierarchical Regression Analysis of CU Traits and Baseline RSA Predicting IGT
Performance in Block 1
Step and Variable B SE B p
Step 1 APSD-Boldness -.13 .41 .75 APSD-IMP/CP .29 .39 .45 APSD-CU .15 .35 .68 Baseline RSA -.24 .34 .49
Step 2 APSD-Boldness -.05 .42 .90 APSD-IMP/CP .26 .38 .49 APSD-CU .12 .35 .73 Baseline RSA -.26 .34 .45 Baseline RSA x CU .37 .38 .34
Step 3
APSD-Boldness -.14 .41 .74 APSD-IMP/CP .38 .39 .32 APSD-CU 1.58 .90 .08 Baseline RSA -.23 .34 .50 Baseline RSA x CU .37 .37 .33 Gender .62 .66 .35 Gender x CU -1.05 .65 .11
Step 4 APSD-Boldness -.28 .44 .53 APSD-IMP/CP -.45 .39 .25 APSD-CU 1.56 .90 .08 Baseline RSA .52 1.02 .61 Baseline RSA x CU 1.19 1.11 .29 Gender .69 .66 .29 Gender x CU .99 .65 .12 Gender x Baseline RSA -.59 .70 .40 Gender x Baseline RSA x CU -.64 .81 .43
84
Table 42
Hierarchical Regression Analysis of CU Traits and Baseline RSA Predicting IGT
Performance in Block 2
Step and Variable B SE B p
Step 1 APSD-Boldness .30 .53 .58 APSD-IMP/CP -.62 .54 .25 APSD-CU .27 .50 .59 Baseline RSA .35 .48 .46
Step 2 APSD-Boldness .44 .54 .41 APSD-IMP/CP -.67 .54 .21 APSD-CU .22 .50 .66 Baseline RSA .31 .48 .52 Baseline RSA x CU .63 .49 .19
Step 3
APSD-Boldness .37 .54 .49 APSD-IMP/CP -.59 .54 .27 APSD-CU -.69 1.34 .61 Baseline RSA .32 .49 .51 Baseline RSA x CU .58 .49 .23 Gender 1.11 .93 .24 Gender x CU .76 .96 .42
Step 4 APSD-Boldness .27 .58 .64 APSD-IMP/CP -.55 .55 .32 APSD-CU -.71 1.34 .60 Baseline RSA .65 1.36 .64 Baseline RSA x CU 1.43 1.56 .36 Gender 1.17 .94 .21 Gender x CU .81 .95 .40 Gender x Baseline RSA -.27 1.00 .79 Gender x Baseline RSA x CU
-.65 1.14 .57
85
Table 43
Hierarchical Regression Analysis of CU Traits and RSA Reactivity Predicting IGT
Performance in Block
Step and Variable B SE B p
Step 1 APSD-Boldness -.21 .39 .60 APSD-IMP/CP .33 .39 .40 APSD-CU .14 .36 .70 RSA-R Block 1 .09 .31 .78
Step 2 APSD-Boldness -.21 .39 .60 APSD-IMP/CP .33 .39 .40 APSD-CU .12 .36 .74 RSA-R Block 1 .10 .31 .76 RSA-R Block 1 x CU -.19 .31 .55
Step 3
APSD-Boldness -.29 .39 .46 APSD-IMP/CP .44 .39 .26 APSD-CU 1.54 .92 .10 RSA-R Block 1 .05 .31 .88 RSA-R Block 1 x CU -.11 .31 .72 Gender .67 .69 .33 Gender x CU -1.01 .66 .13
Step 4 APSD-Boldness -.27 .39 .50 APSD-IMP/CP .44 .40 .27 APSD-CU 1.40 .96 .14 RSA-R Block 1 .36 1.18 .76 RSA-R Block 1 x CU -.82 1.17 .49 Gender .60 .70 .39 Gender x CU -.93 .69 .18 Gender x RSA-R Block 1 -.20 .98 .84 Gender x RSA-R Block 1 x CU .57 .98 .56
86
Table 44
Hierarchical Regression Analysis of CU Traits and RSA Reactivity Predicting IGT
Performance in Block 2
Step and Variable B SE B p
Step 1 APSD-Boldness .40 .52 .44 APSD-IMP/CP -.66 .54 .22 APSD-CU .25 .50 .62 RSA-R Block 2 -.01 .51 .99
Step 2 APSD-Boldness .40 .52 .45 APSD-IMP/CP -.66 .54 .23 APSD-CU .25 .50 .62 RSA-R Block 2 .01 .53 .99 RSA-R Block 2 x CU .03 .54 .95
Step 3 APSD-Boldness .34 .52 .51 APSD-IMP/CP -.59 .54 .28 APSD-CU -.77 1.37 .58 RSA-R Block 2 -.02 .54 .97 RSA-R Block 2 x CU .01 .54 .99 Gender 1.15 .95 .23 Gender x CU .84 .98 .40
Step 4 APSD-Boldness .40 .53 .45 APSD-IMP/CP -.59 .55 .28 APSD-CU -.98 1.41 .49 RSA-R Block 2 1.30 1.54 .40 RSA-R Block 2 x CU -.23 .70 .75 Gender 1.19 .97 .22 Gender x CU .97 1.01 .34 Gender x RSA-R Block 2 -1.09 1.19 .36 Gender x RSA-R Block 2 x CU .10 .54 .85
87
Research Question #3c: IMP/CP, Baseline RSA or RSA-R, and Gender
predicting performance in blocks 1-2 of the IGT. None of the interactions in the
regression model where impulsivity, baseline RSA or RSA-R, and gender predicted IGT
performance in blocks 1 and 2 was significant (see Tables 45-48).
Table 45
Hierarchical Regression Analysis of Impulsivity/Conduct Problems and Baseline RSA
Predicting IGT Performance in Block 1
Step and Variable B SE B p
Step 1 APSD-Boldness -.13 .41 .75 APSD-IMP/CP .29 .39 .45 APSD-CU .15 .35 .68 Baseline RSA -.24 .34 .49
Step 2 APSD-Boldness -.13 .41 .76 APSD-IMP/CP .29 .39 .46 APSD-CU .15 .35 .68 Baseline RSA -.24 .36 .51 Baseline RSA x IMP/CP .00 .39 .99
Step 3
APSD-Boldness -.20 .41 .63 APSD-IMP/CP 1.68 .93 .07 APSD-CU .28 .36 .43 Baseline RSA -.21 .36 .57 Baseline RSA x IMP/CP -.04 .39 .91 Gender .65 .67 .33 Gender x IMP/CP -1.04 .67 .12
Step 4 APSD-Boldness -.28 .42 .51 APSD-IMP/CP 1.66 .93 .07 APSD-CU .31 .36 .39 Baseline RSA .71 1.05 .50 Baseline RSA x IMP/CP .37 1.19 .76 Gender .69 .67 .30 Gender x IMP/CP -.99 .68 .14 Gender x Baseline RSA -.72 .75 .34 Gender x Baseline RSA x IMP/CP
-.36 .97 .71
88
Table 46
Hierarchical Regression Analysis of Impulsivity/Conduct Problems and Baseline RSA
Predicting IGT Performance in Block 2
Step and Variable B SE B p
Step 1 APSD-Boldness .30 .53 .58 APSD-IMP/CP -.62 .54 .25 APSD-CU .27 .50 .59 Baseline RSA .35 .48 .46
Step 2 APSD-Boldness .29 .54 .59 APSD-IMP/CP -.64 .55 .24 APSD-CU .28 .50 .57 Baseline RSA .46 .50 .36 Baseline RSA x IMP/CP .51 .56 .37
Step 3
APSD-Boldness .21 .54 .67 APSD-IMP/CP -.53 1.32 .69 APSD-CU .38 .50 .45 Baseline RSA .48 .50 .35 Baseline RSA x IMP/CP .47 .56 .40 Gender 1.00 .93 .29 Gender x IMP/CP -.10 .98 .99
Step 4 APSD-Boldness .19 .56 .73 APSD-IMP/CP -.53 1.33 .69 APSD-CU .38 .50 .45 Baseline RSA .82 1.42 .56 Baseline RSA x IMP/CP .30 1.75 .86 Gender 1.00 .94 .29 Gender x IMP/CP .01 .99 .99 Gender x Baseline RSA -.27 1.06 .80 Gender x Baseline RSA x IMP/CP
.13 1.35 .92
89
Table 47
Hierarchical Regression Analysis of Impulsivity/Conduct Problems and RSA Reactivity
Predicting IGT Performance in Block 1
Step and Variable B SE B p
Step 1 APSD-CU .14 .36 .70
APSD-Boldness -.21 .39 .60 APSD-IMP/CP .33 .39 .40 RSA-R Block 1 .09 .31 .78
Step 2 APSD-CU .10 .36 .79 APSD-Boldness -.13 .40 .75 APSD-IMP/CP .29 .39 .45 RSA-R Block 1 .14 .31 .67 RSA-R Block 1 x IMP/CP -.27 .32 .40
Step 3 APSD-CU .24 .37 .52 APSD-Boldness -.19 .39 .63 APSD-IMP/CP 1.68 .94 .08 RSA-R Block 1 .13 .31 .67 RSA-R Block 1 x IMP/CP -.26 .32 .42 Gender .66 .67 .32 Gender x IMP/CP -1.04 .68 .12
Step 4 APSD-CU .20 .37 .60 APSD-Boldness -.17 .40 .68 APSD-IMP/CP 1.66 .95 .08 RSA-R Block 1 .67 1.02 .51 RSA-R Block 1 x IMP/CP -.99 1.03 .34 Gender .61 .68 .37 Gender x IMP/CP -1.03 .68 .13 Gender x RSA-R Block 1 -.39 .79 .62 Gender x RSA-R Block 1 x IMP/CP .61 .83 .47
90
Table 48
Hierarchical Regression Analysis of Impulsivity/Conduct Problems and RSA Reactivity
Predicting IGT Performance in Block 2
Step and Variable B SE B p
Step 1 APSD-CU .24 .50 .62 APSD-Boldness .40 .52 .44 APSD-IMP/CP -.66 .54 .22 RSA-R Block 2 -.10 .51 .99
Step 2 APSD-CU .26 .50 .61 APSD-Boldness .38 .53 .47 APSD-IMP/CP -.64 .54 .23 RSA-R Block 2 -.02 .51 .97 RSA-R Block 2 x IMP/CP .09 .54 .87
Step 3 APSD-CU .36 .51 .48 APSD-Boldness .31 .53 .56 APSD-IMP/CP -.52 1.33 .70 RSA-R Block 2 -.06 .51 .90 RSA-R Block 2 x IMP/CP .09 .54 .87 Gender 1.03 .94 .28 Gender x IMP/CP -.02 .99 .98
Step 4 APSD-CU .29 .52 .58 APSD-Boldness .37 .54 .50 APSD-IMP/CP -.57 1.36 .67 RSA-R Block 2 .95 1.64 .56 RSA-R Block 2 x IMP/CP -.53 1.67 .75 Gender 1.06 .98 .28 Gender x IMP/CP .02 1.03 .98 Gender x RSA-R Block 2 -.78 1.30 .55 Gender x RSA-R Block 2 x IMP/CP .47 1.31 .72
91
Research Question #3d: Boldness, Baseline RSA or RSA-R, and Gender
predicting performance in blocks 1-2 of the IGT. None of the regression analyses
with baseline RSA or RSA-R (tables 49-52) significantly predicted IGT performance in
block 1 or block 2.
Table 49
Hierarchical Regression Analysis of Boldness and Baseline RSA Predicting IGT
Performance in Block 1
Step and Variable B SE B p
Step 1 APSD-Boldness -.13 .41 .75 APSD-IMP/CP .29 .39 .45 APSD-CU .15 .35 .68 Baseline RSA -.24 .34 .49
Step 2 APSD-Boldness -.13 .41 .76 APSD-IMP/CP .29 .39 .46 APSD-CU .15 .35 .67 Baseline RSA -.23 .34 .51 Baseline RSA x Boldness -.06 .29 .84
Step 3
APSD-Boldness .04 1.00 .97 APSD-IMP/CP .36 .40 .36 APSD-CU .23 .37 .52 Baseline RSA -.21 .35 .55 Baseline RSA x Boldness .09 .30 .77 Gender .83 .68 .22 Gender x Boldness -.16 .63 .80
Step 4 APSD-Boldness -.23 1.03 .82 APSD-IMP/CP .40 .40 .32 APSD-CU .27 .37 .47 Baseline RSA .72 1.14 .53 Baseline RSA x Boldness -.35 1.01 .73 Gender .82 .70 .25 Gender x Boldness .01 .65 .99 Gender x Baseline RSA -.74 .76 .33 Gender x Baseline RSA x Boldness
.35 .61 .57
92
Table 50 Hierarchical Regression Analysis of Boldness and Baseline RSA Predicting IGT
Performance in Block 2
Step and Variable B SE B p
Step 1 APSD-Boldness .30 .53 .58 APSD-IMP/CP -.62 .54 .25 APSD-CU .27 .50 .59 Baseline RSA .35 .48 .46
Step 2 APSD-Boldness .31 .53 .57 APSD-IMP/CP -.62 .54 .25 APSD-CU .28 .50 .58 Baseline RSA .36 .49 .46 Baseline RSA x Boldness .08 .41 .85
Step 3
APSD-Boldness -.56 1.39 .69 APSD-IMP/CP -.50 .54 .36 APSD-CU .41 .51 .43 Baseline RSA .44 .50 .38 Baseline RSA x Boldness .17 .42 .68 Gender 1.14 .94 .22 Gender x Boldness .56 .89 .53
Step 4 APSD-Boldness -.79 1.45 .59 APSD-IMP/CP -.46 .55 .39 APSD-CU .43 .51 .40 Baseline RSA 1.18 1.48 .43 Baseline RSA x Boldness -.13 1.37 .93 Gender 1.14 .97 .24 Gender x Boldness .70 .92 .45 Gender x Baseline RSA -.58 1.05 .58 Gender x Baseline RSA x Boldness
.25 .86 .77
93
Table 51
Hierarchical Regression Analysis of Boldness and RSA Reactivity Predicting IGT
Performance in Block 1
Step and Variable B SE B P
Step 1 APSD-Boldness -.21 .39 .60 APSD-IMP/CP .33 .39 .40 APSD-CU .14 .36 .70 RSA-R Block 1 .09 .31 .78
Step 2 APSD-Boldness -.20 .39 .61 APSD-IMP/CP .34 .39 .39 APSD-CU .13 .36 .72 RSA-R Block 1 .08 .31 .80 RSA-R Block 1 x Boldness -.04 .40 .93
Step 3 APSD-Boldness -.08 .95 .94 APSD-IMP/CP .41 .40 .30 APSD-CU .21 .37 .57 RSA-R Block 1 .06 .31 .85 RSA-R Block 1 x Boldness -.04 .41 .93 Gender .83 .67 .22 Gender x Boldness -.13 .61 .83
Step 4 APSD-Boldness -.03 .97 .97
APSD-IMP/CP .46 .40 .26 APSD-CU .19 .37 .62 RSA-R Block 1 .56 1.01 .58 RSA-R Block 1 x Boldness -.84 1.16 .47 Gender .78 .68 .25 Gender x Boldness -.16 .63 .80 Gender x RSA-R Block 1 -.39 .80 .63 Gender x RSA-R Block 1 x Boldness .59 .78 .45
94
Table 52
Hierarchical Regression Analysis of Boldness and RSA Reactivity Predicting IGT
Performance in Block 2
Step and Variable B SE B p
Step 1 APSD-Boldness .40 .52 .44 APSD-IMP/CP -.66 .54 .22 APSD-CU .25 .50 .62 RSA-R Block 2 -.01 .51 .99
Step 2 APSD-Boldness .37 .52 .60
APSD-IMP/CP -.67 .54 .21 APSD-CU .27 .50 .59 RSA-R Block 2 .01 .50 .99 RSA-R Block 2 x Boldness .27 .52 .60
Step 3 APSD-Boldness -.19 1.33 .89
APSD-IMP/CP -.56 .54 .31 APSD-CU .37 .50 .46 RSA-R Block 2 -.04 .51 .94 RSA-R Block 2 x Boldness .26 .52 .63 Gender 1.04 .93 .27 Gender x Boldness .35 .87 .68
Step 4 APSD-Boldness -.34 1.41 .81
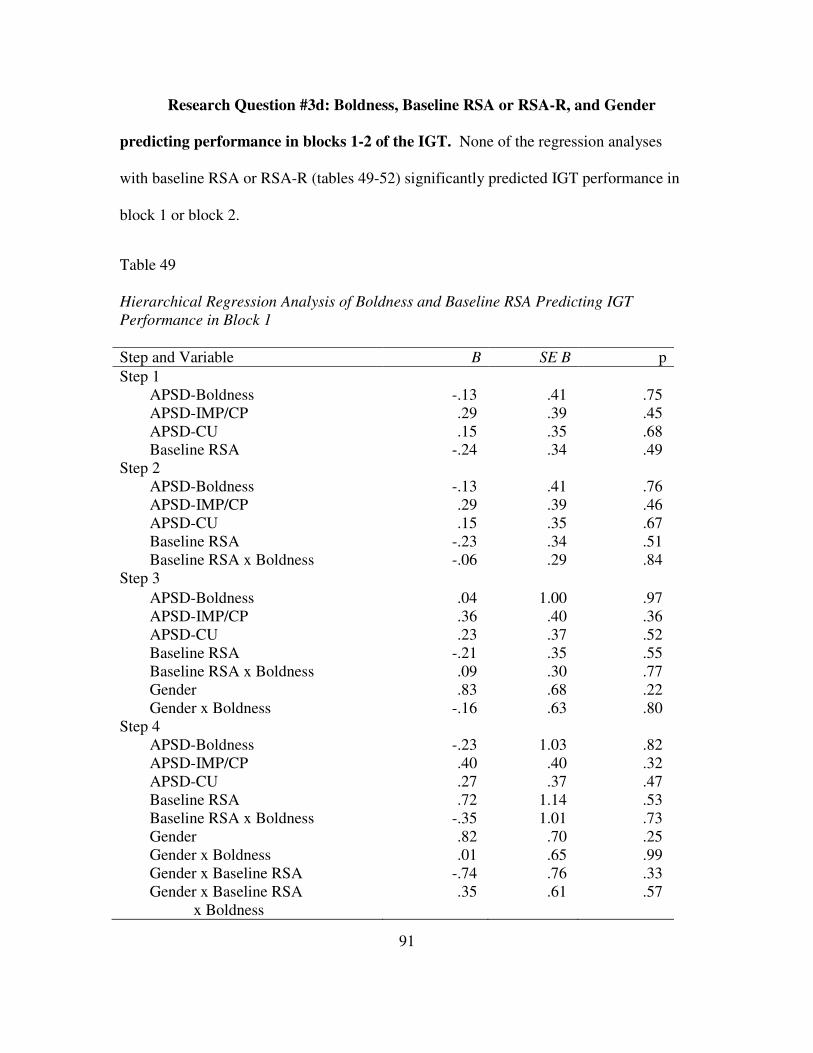
APSD-IMP/CP -.54 .54 .33 APSD-CU .30 .51 .59 RSA-R Block 2 1.19 1.72 .49 RSA-R Block 2 x Boldness -.24 1.75 .89 Gender 1.06 1.00 .29 Gender x Boldness .50 .95 .60 Gender x RSA-R Block 2 -.97 1.32 .47 Gender x RSA-R Block 2 x Boldness .34 1.27 .79
95
DISCUSSION
This section will discuss the findings for psychopathic traits and RSA, physiological
activity and IGT performance, and then psychopathic traits, RSA, and IGT performance. Next,
the themes of developmental and measurement issues (e.g., respirations measurement in
quantifying RSA) is addressed, followed by a discussion on power. The discussion section
concludes with limitations and future directions.
Main Effects of Psychopathy and Respiratory Sinus Arrhythmia
Neither of the hypotheses was supported. No main effects were found for psychopathy
(i.e., total APSD score), baseline RSA, or RSA reactivity when predicting performance in blocks
3-5 of the IGT. Hypothesis 1, which predicted that baseline RSA and the total APSD score
would be negatively correlated, was not supported. The rationale for this hypothesis stemmed
from research that has shown that decreased baseline RSA is associated with several symptoms
of psychopathology, including aggression. It is also possible that the multifaceted nature of the
construct of psychopathy may account for the observed result since the different components
(i.e., boldness, callous unemotional traits, and impulsivity/conduct problems) are associated with
different patterns of physiological activity.
Similarly, hypothesis #2, which examined the influence of psychopathy and RSA (both
baseline and reactivity) on IGT performance, failed to yield significant results. While it was
predicted that psychopathic traits would predict IGT performance, there are a few possibilities
why this hypothesis was not supported. First, the range of scores on the APSD was 2-26 in
96
sample of fourth grade males and females attending mainstream public schools. In a study by
Blair et al. (2001) that found boys with high levels of psychopathic traits as measured by the
APSD performed poorly on the IGT, the range of scores for youth with psychopathic traits was
26-37, while the comparison group’s scores ranged from 0-18. In Blair et al.’s study, a score
greater than 25 on the APSD was considered the cutoff for the psychopathic group, which is
already at the top end of the range in the current study. Additionally, the age range was wider
(9-17 year olds), and older youth simply have had more time to exhibit the behaviors and
personality traits indicative of psychopathy than the youth, with a mean age of 10.3 years, in this
study did. Finally, their sample was drawn from schools for boys with emotional and behavioral
problems, while this study used a community sample, in which the degree of emotional and
behavioral problems associated with psychopathy are typically less severe. In other words, it is
possible that the lack of significant results could be true findings since the degree of psychopathy
was not very severe.
Physiological activity and IGT Performance
Research has shown that low-performing normal individuals (i.e., without brain damage)
did not have anticipatory slowing of heart rate (Drucaroff et al., 2011). Extrapolating this
finding of the absence of heart rate deceleration and poor IGT performance to the current study,
a lack of heart rate deceleration could be reflected by vagal withdrawal, which could be
indicative of greater sympathetic activity that, in turn, is associated with poorer performance on
the IGT. However, this conjecture is speculative, and further research needs to be conducted on
the relationship between parasympathetic activity, sympathetic activity, and IGT performance.
Specifically, the joint activity of the two branches of the autonomic nervous system should be
evaluated simultaneously because there are several possible patterns of activity, including
97
coactivation (e.g., reciprocal activity), coinhibition (e.g., reduced activity in both branches), or
independent activity (Beauchaine, 2009).
Psychopathic traits, RSA, and IGT Performance
As mentioned above, no significant main effects were found for the hypotheses or
secondary analyses examining the effects of baseline RSA and psychopathic traits on IGT
performance. Previous research has found positive, negative, and null findings in studies
examining the relationship between externalizing behaviors and baseline RSA. While no study
to date has specifically addressed the relationship between baseline RSA and psychopathic traits,
such traits are more commonly observed in youth with externalizing difficulties (i.e., aggression,
symptoms of ADHD). The sample in this study was selected based on elevated levels of
aggression, which is more common in non-clinical samples than are psychopathic traits. This
pattern of lower levels of psychopathy was evident in this sample, as the scores obtained on the
APSD were more heavily concentrated at the lower end of the range of possible scores.
Additionally, the lack of a relationship between psychopathy, respiratory sinus arrhythmia, and
the IGT that was found in this study appears to mirror the null findings that have been found in
studies examining RSA in aggressive youth. One possibility is that these youth already have
depressed levels of RSA due to being aggressive, which may explain the non-significant results
for psychopathy and baseline RSA found in this study. Finally, breaking down the APSD to its
three subscales, the scores obtained on the CU subscale had a similar pattern with a small
number of participants scoring in the higher range. Overall, the same pattern held true for the
other two subscales, impulsivity/conduct problems and boldness. Given that the scores on these
subscales are more heavily weighted at the lower end of the possible ranges, the true nature of
the relationships between baseline RSA and psychopathic traits may have been obscured.
98
Research has also found no consistent findings with regard to baseline autonomic activity
(Patrick, 2008), which has been attributed to the different facets of psychopathy. With regard to
CU traits, youth with CU traits have depressed physiological activity. For example, it has been
found that they have lower resting heart rates and less heart rate and skin conductance reactivity
than non-CU youth (Anastassiou-Hadjicharalambous & Warden, 2008). It is possible that the
youth with CU traits in this study experienced less RSA reactivity, which could explain the lack
of significant findings.
Little research has been done on impulsivity alone. Rather, studies have examined
impulsivity in the context of externalizing disorders, which makes discerning the relationship
between impulsivity and baseline RSA difficult. For example, Boyce, Quas, Alkon, Smider, &
Essex’s (2001) externalizing disorders category was comprised of conduct disordered and
oppositional defiant behaviors, impulsivity, hostility, and attention problems. They found that
the externalizing group had low sympathetic and parasympathetic reactivity. Beauchaine et al.
(2001) found that a sample of impulsive youth with conduct disorder also had reduced RSA
activity. These findings suggest that impulsivity alone would also be associated with reduced
RSA reactivity, which, similar to the discussion for CU traits, could be a reason for the absence
of significant results.
Finally, as mentioned in the introduction, comparatively little research has been done on
boldness (i.e., the subscale labeled narcissism on the APSD) and RSA in youth. Narcissism and
boldness are distinct constructs, with the former being traditionally operationalized as having
high but fragile self-esteem and the latter characterized by fearless dominance. Boldness is also
linked with an ability to stay calm in the presence of stressors as well as having tolerance for
uncertainty (Patrick, 2008). Physiologically, these traits may be associated with less
99
physiological reactivity, which may be one reason for the lack of significant findings in this
study.
Developmental Differences
RSA and Developmental Differences. Studies examining RSA have been conducted
with aggressive children as young as two years of age (e.g., Calkins & Dedmon, 2000), 2-5 year
old children at risk for developing externalizing behavioral problems (Calkins, Blandon, et al.,
2007), early school-age children (mean age 7.79 years) with low SES who were from the inner
city (Bubier & Drabick, 2008), 6-7 year old in a community sample (Boyce et al., 2001), as well
as 12-17 year olds males with ADHD or aggressive conduct disorder (Beauchaine et al., 2007).
Significant findings regarding differences in RSA were obtained in these studies, which suggests
that using RSA in this sample was appropriate.
Additionally, research has also shown that depressed sympathetic and parasympathetic
nervous system activity are related to externalizing behavior, but the nature of the relationship is
dependent upon the type of behavior (e.g., ADHD vs. CD) and the age of the participants (Bubier
& Drabick, 2008). For example, only SNS activity is depressed in preschool children with
ADHD and ODD diagnoses while both SNS and PNS activity are depressed in older youth (i.e.,
mid-childhood and adolescence). This pattern of depressed ANS activity has been found in both
middle class and inner-city at risk samples, and it remained significant even after controlling for
race and SES. In summary, the lack of findings regarding RSA is likely not attributable to the
developmental level of the youth in this study, but perhaps could be linked to the nature of
psychopathology examined. While psychopathy shares some similarities with externalizing
behaviors (e.g., conduct problems), it is a distinct cluster of behaviors that has different patterns
100
of physiological activity (i.e., less skin conductance). This study was the first to attempt to
elucidate the relationship between RSA and psychopathic traits in youth.
IGT and Developmental Differences. The IGT measures affective decision-making,
which is influenced by developmental level. As previously discussed, older children typically do
better on the IGT than younger children (Crone & Van der Molen, 2004). The correlation
between CU traits and IGT performance in block five was significant, which suggests that
affective decision-making is influenced by developmental level. In other words, examining the
construct of affective decision-making in young samples is valid, but perhaps only in older youth
(i.e., at least 10.5 years old in this sample).
One possible reason for the differences in performance on the IGT by younger and older
youth is related to brain development. A key task during adolescence is development of parts of
the brain responsible for assessment of risk and reward (Steinberg, 2005). Specifically, the
prefrontal cortex does not fully mature until later in adolescence (Crone & Van der Molen,
2004). Better performance on the IGT depends on the ability to make decisions that are
advantageous in the long-term, which is dependent on the ventromedial prefrontal cortex. In
other words, in younger children, the ventromedial prefrontal cortex is still developing, so their
ability to make advantageous decisions is less developed than that of older children. The
performance of younger children has been likened to that of patients with ventromedial
prefrontal damage, who demonstrate myopia for the future by making more disadvantageous
choices (Crone & van der Molen, 2004).
Measurement Issues
RSA and measurement of respiration. To obtain accurate values of RSA, a minimum
of 30 seconds of data is needed. Given this limitation, it was not possible to measure RSA for
101
the immediate period of time after a decision was made. As a result, RSA was measured over
the average duration of each block on the IGT. Other physiological measures, such as skin
conductance, can be accurately measured in shorter time periods (e.g., Deming, 2009). Because
RSA was measured during each block of the IGT, it is possible that any changes in physiological
activity were not captured due to the participants returning to their baseline levels during the
period of time RSA was measured. In other words, any changes in RSA may have been washed
out or obscured in the 30 seconds of data used to quantify RSA. Future research may benefit
from examining two different forms of physiological activity simultaneously to more accurately
ascertain the influence psychophysiology has on decision-making in the context of psychopathic
traits.
Different methods of quantifying RSA exist, and these approaches sometimes differ on
whether or not respiration frequency needs to be measured (Denver, Reed, & Porges, 2007).
Some methods assume there is a causal relationship between respiration and RSA, and these
approaches make adjustments when quantifying RSA. For example, respiratory parameters can
be included as covariates when quantifying RSA (Denver et al.). In contrast, other approaches
assume there is a parallel relationship between RSA and breathing. These approaches either do
not incorporate respiration frequency at all, or they use a frequency band associated with
respiratory rates for the population of interest (e.g., adolescents).
The method used to measure RSA in this study, a time domain method which was
described earlier, measures heart rate variability within a frequency range of spontaneous
breathing associated with the population of interest (i.e., children in this study). Respiration is
not specifically measured in this approach.
102
Another procedure, spectral analysis, collects respiration (i.e., frequency of breathing)
and heart period data that is then decomposed to identify the peak frequencies, which are
“obtained by locating the frequency at which the maximum spectral density occurred” (Denver,
p. 290). RSA obtained by a time domain method (i.e., using a moving polynomial filter (MPF))
and respiration frequency obtained by the same method were highly correlated, r=.99,
p<.01(Denver et al.). Additionally, to ascertain whether depth of breathing affected this
relationship, Denver and colleagues transformed the respiration data into a binary time series to
remove the influence of respiration depth and then conducted spectral analysis. The correlation
between the frequency of the binary transformed respiration data and the frequency of RSA from
the time domain method remained very high (r=.99, p<.01). Finally, to ensure that the time
domain method did not artificially limit the respiration frequency through the use of filter that
removes variance associated with frequencies lower than those of spontaneous breathing, the
respiration data were detrended with a linear function rather than the moving polynomial
function. Again, results suggested that the correlation between the frequency of RSA obtained
using the MPF and linearly detrended respiration frequency was r= .99, p<.01.
Finally, the RSA amplitudes obtained from spectral analysis were correlated with the amplitudes
obtained from the time domain method. The amplitudes from each method were highly
correlated with each other, r=.99.
Based on these findings, it was concluded that measuring respiration is not a requirement
when quantifying RSA. In further support of this conclusion, Denver et al. summarized research
published in Biological Psychology and Journal of Psychophysiology between 2000-2004 that
included unadjusted and adjusted RSA amplitudes. The results indicated that using correction
procedures (i.e., using respiration frequency, tidal volume, or both as covariates) was not
103
supported, as no differences were found. Thus, in summary, research has shown that there is no
relationship between RSA amplitude and the frequency of respiration, and this pattern remained
even when the respiration data was transformed (e.g., linear, binary) (Denver et al.). This
finding suggests that it is not statistically necessary to include the latter variable as a covariate to
generate an accurate measure of RSA amplitude.
Limitations
This study has a few limitations. First, power was a little low due to IGT data not being
available for a cohort and missing data within the available dataset. Even after multiple
imputation, the sample size remained below the needed sample size of 167 to achieve acceptable
power (i.e., power = .80). However, despite being smaller than needed, the sample used was
sufficient for examining the general direction of relationships as several trends were observed.
Overall, having more participants may not have made a substantial difference for several of the
analyses, as many of the obtained results were clearly not significant.
Second, only parasympathetic nervous system activity was examined. Examining the
activity of both the parasympathetic and sympathetic nervous systems may result in a more
accurate characterization of the psychophysiological activity associated with psychopathic traits
and the influence of these two physiological variables on IGT performance. For example,
Crowell, Beauchaine, Gatzke-Kopp, Sylvers, Mead, & Chipman-Chacon (2006) have used skin
conductance and Keller & El-Sheikh (2009) used salivary alpha-amylase, both of which reflect
sympathetic activity and could be examined in conjunction with RSA.
Additionally, low autonomic nervous system (ANS) arousal is associated with antisocial
behaviors in children and adults. Low ANS arousal can be arrived at by different combinations
of sympathetic and parasympathetic nervous system activity. For example, low sympathetic
104
activity (e.g., sympathetic inhibition) and high PNS activity (e.g., high baseline RSA or RSA
augmentation (higher RSA)) result in less ANS arousal. Raine (2002) proposed that youth with
this profile of ANS activity (i.e., lower sympathetic and higher parasympathetic activity) might
be similar to those who are antisocial and exhibit less fear of punishment or of negative
consequences. Finally, Keller and El-Sheikh (2009) suggest that children with SNS underarousal
alone are not necessarily at risk for externalizing problems and that it is the combination of
sympathetic nervous system underarousal and higher baseline RSA or greater RSA augmentation
that is associated with externalizing symptoms.
Another issue related to study design is that there was no control group of non-aggressive
children. Prior research has shown that low resting heart rate distinguishes between adolescents
who desist from criminal behavior and those who continue to offend (Raine, 2002). This is a
community sample, which is probably more homogeneous in its degree of criminal activity (i.e.,
relatively low level), and thus it likely is substantively different from one characterized by on-
going criminal behavior. Having a control group would allow for examination of differences in
baseline RSA and RSA reactivity between the aggressive and non-aggressive youth. Finally, this
sample is also largely male and African-American. Different findings may emerge in samples
with different demographic characteristics.
Strengths and Future Directions
This study sought to delineate the nature of the relationship between psychopathic traits,
psychophysiological activity, and affective decision-making. One of the primary strengths of
this study is that both behavioral and psychophysiological measures were used to examine
performance on the IGT. According to Boyce et al. (2001), greater understanding of
psychopathology depends on using assessments drawing from different domains, such as
105
physiology and behavior.
A second strength is that this is one of the first studies that has specifically examined the
relationship between psychopathic traits and RSA. The relationship between RSA and
psychopathy should be explored in future studies that use both community and clinical samples,
the latter of which will have greater degrees of psychopathic traits. Additionally, sympathetic
nervous system activity should be examined in conjunction with vagal activity in future research
in an effort to delineate the true relationship between autonomic nervous system activity,
psychopathic traits, and decision-making.
With regard to the constructs of narcissism and boldness, because it appears that these
constructs tap different traits, it is reasonable to suggest that they may be associated with
different patterns of psychophysiological activity. Thus, using a measure that assesses
narcissism may yield different results than were observed in this study, which measured
boldness. There has been some research conducted on the construct of narcissism as
traditionally operationalized (i.e., high but fragile self esteem) in adults and with physiological
measures reflecting sympathetic nervous system activity. Even less research on narcissism and
psychophysiological activity has been carried out with younger samples. Future research should
examine the relationship between RSA and narcissism, as traditionally conceptualized, and
boldness to further characterize these constructs.
Finally, given the developmental differences observed in IGT performance in this study,
future studies should be conducted with older adolescents. It is possible that some of the
relationships examined in this study might differ in an older sample of adolescents, whose brains,
particularly the ventromedial prefrontal cortex, will be more developed.
106
REFERENCES
Achenbach T.M. Integrative guide for the 1991 CBCL/4-18, YSR & TRF profiles. Burlington,
VT: University of Vermont Department of Psychiatry; 1991. Anastassiou-Hadjicharalambous, X. & Warden, D. (2008). Physiologically-indexed and self-
perceived affective empathy in conduct-disordered children high and low on callous-unemotional traits. Child Psychiatry and Human Development, 39, 503-517. doi:10.1007/s10578-008-0104-y
Andershed, H., Gustafson, S.B., Kerr, M., & Stattin, H. (2002). The usefulness of self-reported
psychopathy-like traits in the study of antisocial behavior among non-referred adolescents. European Journal of Personality, 16, 383-402. doi:10.1002/per.455
Andrade, J.T. (2008). The inclusion of antisocial behavior in the construct of psychopathy: A
review of the research. Aggression and Violent Behavior, 13, 328-335. doi:10.1016/j.avb.2008.05.001
Ang, R.P. & Raine, A. (2009). Reliability, validity, and invariance of the narcissistic personality
questionnaire for children-revised (NPQC-R). Journal of Psychopathology and
Behavioral Assessment, 31, 143-151. doi:10.1007/s10862-008-9112-2
Barry, C.T., Frick, P.J., DeShazo, T.M., McCoy, M.G., Ellis, M. and Loney, B.R. (2000). The
importance of callous-unemotional traits for extending the concept of psychopathy to children. Journal of Abnormal Psychology, 109(2), 335-340. doi:10.1037/0021-843X.109.2.335
Barry, C. T., & Wallace, M. T. (2010). Current considerations in the assessment of youth
narcissism: Indicators of pathological and normative development. Journal of
Psychopathology and Behavioral Assessment, 32, 479-489. doi:10.1007/s10862-010- 9188-3
Beauchaine, T. P. (2009). Some difficulties in interpreting psychophysiological research with children. Monographs of the Society for Research in Child Development, 74(1), 80-88. doi:10.1111/j.1540-5834.2009.00509.x
Beauchaine, T.P., Gatzke-Kopp, L., & Mead, H.K. (2007). Polyvagal theory and developmental
psychopathology: Emotion dysregulation and conduct problems from preschool to adolescence. Biological Psychology, 74(2), 174-184. doi: 10.1016/j.biopsycho.2005.08.008.
107
Beauchaine, T.P., Hong, J., & Marsh, P. (2008). Sex differences in autonomic correlates of conduct problems and aggression. Journal of the American Academy of Child and
Adolescent Psychiatry, 47(7), 788-796. doi:10.1097/CHI.0b013e318172ef4b Beauchaine, T.P., Katkin, E.S., Strassberg, Z., & Snarr, J. (2001). Disinhibitory
psychopathology in male adolescent: Discriminating conduct disorder from attention-deficit/hyperactivity disorder through concurrent assessment of multiple autonomic states. Journal of Abnormal Psychology, 110(4), 610-624. doi:10.1037/0021-843X.110.4.610
Bechara, A. (2004). The role of emotion in decision-making: Evidence from neurological
patients with orbitofrontal damage. Brain and Cognition, 55, 30-40. doi:10.1016/j.bandc.2003.04.001
Bechara, A., Damasio, H., & Damasio, A. R. (2000). Emotion, Decision-making and the
Orbitofrontal Cortex. Cereb. Cortex, 10, 295-307. doi:10.1093/cercor/10.3.295 Bechara, A., Damasio, H., Damasio, A.R., & Lee, G.P. (1999). Different contributions of the
human amygdala and ventromedial prefrontal cortex to decision-making. The Journal of
Neuroscience, 19(13), 5473-5481. Bechara, A., Damasio, H., Tranel, D., & Damasio, A.R. (1997). Deciding advantageously before knowing the advantageous strategy. Science, 275(5304), 1293-1295.
doi:10.1126/science.275.5304.1293 Bechara, A., Dolan, S., Denburg, N., Hindes, A., Anderson, S.W., & Nathan, P.E. (2001).
Decision-making deficits, linked to a dysfunctional ventromedial prefrontal cortex, revealed in alcohol and stimulant abusers. Neuropsychologia, 39, 376-389. doi:10.1016/S0028-3932(00)00136-6
Blair, R. J. R., (1999). Responsiveness to distress cues in the child with psychopathic
tendencies. Personality and Individual Differences, 27, 135-145. doi:10.1016/S0191-8869(98)00231-1
Blair, R.J.R. (2007). The amygdala and ventromedial prefrontal cortex in morality and
psychopathy. Trends in Cognitive Science, 11, 387-392. doi:10.1016/j.neuron.2007.07.022
Blair, R.J.R., Colledge, E., & Mitchell, D.G.V. (2001). Somatic Markers and Response Reversal: Is there orbitofrontal cortex dysfunction in boys with psychopathic tendencies? Journal
of Abnormal Child Psychology, 29, 499-511. doi:10.1023/A:1012277125119 Blair, R.J.R., Jones, L., Clark, F., & Smith, M. (1997). The psychopathic individual: A lack of
responsiveness to distress cues? Psychophysiology, 34, 192-198. doi:10.1111/j.1469-8986.1997.tb02131.x
108
Blair, R.J.R., Monson, J., & Frederickson, N. (2001). Moral reasoning and conduct problems in children with emotional and behavioural difficulties. Personality and Individual
Differences, 31, 799-811. doi:10.1016/S0191-8869(00)00181-1 Boyce, W. T., Quas, J., Alkon, A., Smider, N. A., Essex, M. J., & Kupfer, D. J. (2001).
Autonomic reactivity and psychopathology in middle childhood. British Journal of
Psychiatry, 179,144-150. doi:10.1192/bjp.179.2.144 Brown, K., Atkins, M. S., Osborne, M. L., & Milnamow, M. (1996). A revised teacher rating
scale for Reactive and Proactive Aggression. Journal of Abnormal Child Psychology,
24(4), 473-480. doi:10.1007/BF01441569 Brown, R.P., Budzek, K., & Tamborski, M. (2009). On the meaning and measure of narcissism.
Personality and Social Psychology Bulletin, 35(7), 951-964. doi:10.1177/0146167209335461
Bubier, J. L., & Drabick, D.A.G. (2008). Affective decision-making and externalizing behaviors:
The role of autonomic activity. Journal of Abnormal Child Psychology, 36, 941-953. doi:10.1007/s10802-008-9225-9
Calkins, S. D., Blandon, A. Y., Williford, A. P., & Keane, S. P. (2007). Biological, behavioral,
and relational levels of resilience in the context of risk for early childhood behavior problems. Development and Psychopathology, 19, 675-700. doi:10.1017/S095457940700034X
Calkins, S.D. & Dedmon, S.E. (2000). Physiological and behavioral regulation in two-year-
old children with aggressive/destructive behavior problems. Journal of Abnormal
Child Psychology, 28(2), 103-118. doi:10.1023/A:1005112912906
Calkins, S.D., Graziano, P.A., & Keane, S.P. (2007a). Cardiac vagal regulation differentiates among children at risk for behavior problems. Biological Psychology, 74, 144-153. doi:10.1016/j.biopsycho.2006.09.005
Calkins, S.D. & Keane, S.P. (2004). Cardiac vagal regulation across the preschool period:
Stability, continuity, and implications for childhood adjustment. Developmental
Psychobiology, 45, 101-112. doi:10.1002/dev.20020 Campbell, W.K., Goodie, A.S., & Foster, J.D. (2004). Narcissism, confidence, and risk attitude.
Journal of Behavioral Decision-making, 17, 297-311. doi:10.1002/bdm.475
CardioBatch software. Brain-Body Center, University of Illinois at Chicago. 2007. Christian, R. E., Frick, P. J., Hill, N. L., Tyler, L., & Frazer, D. R. (1997). Psychopathy and
conduct problems in children: II. Implications for subtyping children with conduct problems. Journal of the American Academy of Child & Adolescent Psychiatry, 36(2), 233-241. doi:10.1097/00004583-199702000-00014
109
Cohen, M. A. (1998). The monetary value of saving a high-risk youth. Journal of
Quantitative Criminology, 14, 5-33. Cooke, D.J. & Michie, C. (2001). Refining the construct of psychopathy: Towards a hierarchical model. Psychological Assessment, 13(2), 171-188. doi:10.1037/1040-3590.13.2.171 Crider, A. (2008). Personality and electrodermal response lability: An interpretation. Applied
Psychophysiology and Biofeedback, 33, 141-148. doi:10.1007/s10484-008-9057-y Critchley, H.D., Mathias, C.J., & Dolan, R.J. (2002). Fear conditioning in humans: The influence
of awareness and autonomic arousal on functional neuroanatomy. Neuron, 33, 653-663. doi:10.1016/S0896-6273(02)00588-3
Crone, E. A., Somsen, R. J. M., Van Beek, B., & Van Der Molen, M. W. (2004). Heart rate and
skin conductance analysis of antecendents and consequences of decision-making. Psychophysiology, 41, 531-540. doi:10.1111/j.1469-8986.2004.00197.x
Crone, E.A. & van der Molen, M. W. (2004). Developmental changes in real life decision making: Performance on a gambling task previously shown to depend on the
ventromedial prefrontal cortex. Developmental Neuropsychology, 25, 251-279. doi:10.1207/s15326942dn2503_2
Curran, P.J., West, S.G., & Finch, J.F. (1996). The robustness of test statistics to nonnormality
and specification error in confirmatory factor analysis. Psychological Methods, 1, 16-29. doi:10.1037/1082-989X.1.1.16
DeLisi, M., Umphress, Z.R., & Vaughn, M.G. (2009). The criminology of the amygdala.
Criminal Justice and Behavior, 36, 1241-1252. doi:10.1177/0093854809343119 Deming, A.M. (2009). Anxiety, affective decision-making, and callous-unemotional traits:
Possible predictors and/or moderators of conduct problems over time (Doctoral dissertation). Retrieved from Dissertations and Theses database. (AAT 3385347)
Dietrich, A., Riese, H, Sondeijker, F.E.P.L., Greaves-Lord, K., van Roon, A.M., Ormel, J.,
Neeleman, J., & Rosmalen, J.G.M. (2007). Externalizing and internalizing problems in relation to autonomic function: A population-based study in preadolescents. Journal of
the American Academy of Child and Adolescent Psychiatry, 46(3), 378-386. doi: 10.1097/chi.0b013e31802b91ea
Dodge, K. A., & Coie, J. D. (1987). Social-information-processing factors in reactive and proactive aggression in children's peer groups. Journal of Personality and Social
Psychology, 53(6), 1146-1158. doi:10.1037/0022-3514.53.6.1146 Dolan, M. (2004). Psychopathic personality in young people. Advances in Psychiatric Treatment,
10(6), 466-473. doi:10.1192/apt.10.6.466
110
Dolan, M. (2008). Neurobiological disturbances in callous-unemotional youths. The American
Journal of Psychiatry, 165(6), 668-670. doi:10.1176/appi.ajp.2008.08030393 Dolan, M.C. & Rennie, C.E. (2006). Reliability and validity of the psychopathy checklist: youth version in a UK sample of conduct disordered boys. Personality and Individual
Differences, 40(1), 65-75. doi:10.1016/j.paid.2005.07.001 Doyle, A., Ostrander, R., Skare, S., Crosby, R.D., & August, G.J. (1997). Convergent and
criterion-related validity of the Behavior Assessment System for Children-Parent Rating Scale. Journal of Clinical Child Psychology, 26(3), 276-284. doi:10.1207/s15374424jccp2603_6
Drucaroff, L.J., Kievit, R., Guinjoan, S.M., Gerschcovich, E.R., Cerquetti, D., Leiguarda,
R.,…Vigo, D.E. (2011). Higher autonomic activation predicts better performance in Iowa gambling task. Cognitive Behavioral Neurology, 24, 93-98. doi: 10.1097/WNN.0b013e3182239308
El-Sheikh, M., Keiley, M., & Hinnant, J.B. (2010). Developmental trajectories of skin conductance level in middle childhood: Sex, race, and externalizing behavior problems as predictors of growth. Biological Psychology, 83(2),116-124. doi:10.1016/j.biopsycho.2009.11.009
Essau, C.A., Sasagawa, S., & Frick, P.J. (2006). Callous-unemotional traits in a community sample of adolescents. Assessment, 13(4), 454-469. doi:10.1177/1073191106287354
Falkenbach, D.M., Poythress, N.G., & Heide, K.M., (2003). Psychopathic features in a juvenile
diversion population: reliability and predictive validity of two self-report measures. Behavioral Sciences and The Law, 21(6), 787-805. doi:10.1002/bsl.562
Faul, F., Erdfelder, E., Buchner, A., & Lang, A.G. (2009). Statistical power analyses using
G*Power 3.1: Tests for correlation and regression analyses. Behavior Research Methods,
41, 1149-1160. Forth, A. E., Kosson, D. S., & Hare, R. D. (2003). The Hare Psychopathy Checklist: Youth
Version. North Tonawanda, NY: Multi-Health Systems. Foster, J.D. & Trimm, IV, R.F. (2008). On being eager and uninhibited: Narcissism and
approach-avoidance motivation. Personality and Social Psychology Bulletin, 34(7),1004-1017. doi:10.1177/0146167208316688
Franken, I. H. A., van Strien, J. W., Nijs, I., & Muris, P. (2008). Impulsivity is associated with
behavioral decision-making deficits. Psychiatry Research, 158(2), 155-163. doi:10.1016/j.psychres.2007.06.002
111
Frick, P. J. (1995) Callous-unemotional traits and conduct problems: A two-factor model of psychopathy in children. Issues in Criminological and Legal Psychology, 24, 47-51. doi:10.1007/978-94-011-3965-6_8
Frick, P.J. (2009). Extending the construct of psychopathy to youth: implications for
understanding, diagnosing, and treating antisocial children and adolescents. Canadian
Journal of Psychiatry, 54, 803-812. Frick, P. J., Bodin, S. D., & Barry, C. T. (2000). Psychopathic traits and conduct problems in
community and clinic-referred samples of children: Further development of the Psychopathy Screening Device. Psychological Assessment, 12(4), 382-393. doi:10.1037/1040-3590.12.4.382
Frick, P.J., Cornell, A.H., Bodin, S.D., Dane, H.E., Barry, C.T., & Loney, B. R. (2003). Callous-
unemotional traits and developmental pathways to severe conduct problems. Developmental Psychology 39(2), 246-260. doi:10.1037/0012-1649.39.2.246
Frick, P. J., & Hare, R. D. (2001). The psychopathy screening device. Toronto: Multi-Health
Systems. Frick, P. J., O’Brien, Wootton, & McBurnett. (1994). Psychopathy and conduct problems in
children. Journal of Abnormal Psychology, 103(4), 700-707. doi:10.1037/0021-843X.103.4.700
Frick, P.J. & White, S.F. (2008). Research Review: The importance of callous-unemotional
traits for developmental models of aggressive and antisocial behavior. The Journal of
Child Psychology and Psychiatry, 49(4), 359-375. doi:10.1111/j.1469- 7610.2007.01862.x
Garson, G.D. (2012). Testing statistical assumptions. North Carolina: Statistical Associates
Publishing. Gentzler, A. L., Santucci, A. K., Kovacs, M., & Fox, N. A. (2009). Respiratory sinus arrhythmia
reactivity predicts emotion regulation and depressive symptoms in at-risk and control children. Biological Psychiatry 82(2), 156-163. doi:10.1016/j.biopsycho.2009.07.002
Gordis, E.B., Feres, N., Olezeski, C.L., Rabkin, A.N. & Trickett, P.K. (2010). Skin conductance
reactivity and respiratory sinus arrhythmia among maltreated and comparison youth: Relations with aggressive behavior. Journal of Pediatric Psychology, 35(5), 547-558. doi:10.1093/jpepsy/jsp113
Gramzow, R. H., Willard, G., & Mendes, W. B. (2008). Big tales and cool heads: Academic
exaggeration is related to cardiac vagal reactivity. Emotion, 8(1), 138-144. doi:10.1037/1528-3542.8.1.138
112
Hastings, P.D., Nuselovici, J.N., Utendale, W.T., Coutya, J. McShane, K.E., & Sullivan, C. (2008). Applying the polyvagal theory to children's emotion regulation: Social context, socialization, and adjustment. Biological Psychology, 79(3), 299-306. doi:10.1016/j.biopsycho.2008.07.005 Herpetz, S. & Sass, H. (2000). Emotional deficiency and psychopathy. Behavioral Sciences and
the Law, 18(5), 567-580. doi:10.1002/1099-0798(200010)18:5<567::AID- BSL410>3.0.CO;2-8
Hill, L.G., Lochman, J.E., Coie, J.D., Greenberg, M.T., & The Conduct Problems Prevention Research Group. (2004). Effectiveness of Early Screening for Externalizing Problems: Issues of Screening Accuracy and Utility. Journal of Consulting and Clinical
Psychology, 72(5), 809-820. doi:10.1037/0022-006X.72.5.809
Hinson, J. M., Jameson, T. L., & Whitney, P. (2003). Impulsive decision-making and working memory. Journal of Experimental Psychology: Learning, Memory and Cognition 29(2), 298-306. doi:10.1037/0278-7393.29.2.298
Kelsey, R. M., Ornduff, S. R., Reiff, S., & Arthur, C. M. (2002). Psychophysiological correlates
of narcissistic traits in women during active coping. Psychophysiology, 39(3), 322-332. doi:10.1017/S004857720139306X
Keller, P. S. & El-Sheikh, M. (2009). Salivary alpha-amylase as a longitudinal predictor of
children’s externalizing symptoms: Respiratory sinus arrhythmia as a moderator of effects. Psychoneuroendocrinology, 34, 633-643. doi:10.1016/j.psyneuen.2008.12.016
Kempes, M., Matthys, W., Maassen, G., van Goozen, S., & van Engeland, H. (2006). A parent
questionnaire for distinguishing between reactive and proactive aggression in children. European Child & Adolescent Psychiatry, 15(1), 38-45. doi:10.1007/s00787-006-0502-2
Klopf, J., Kofler-Westergren, B., & Mitterauer, B. (2007). Towards action-oriented criteria in
risk assessment. International Journal of Forensic Mental Health., 6(1), 47-56. doi:10.1080/14999013.2007.10471248
Lee, Z., Vincent, G. M., Hart, S. D., & Corrado, R. R. (2003). The validity of the
Antisocial Process Screen Device as a self-report measure of psychopathy in adolescent offenders. Behavioral Sciences and the Law, 21(6), 771-786. doi:10.1002/bsl.561
Lochman, J.E. & The Conduct Problems Prevention Research Group. (1995). Screening of child
behavior problems for prevention programs at school entry. Journal of Consulting and
Clinical Psychology, 63(4), 549-559. doi:10.1037/0022-006X.63.4.549 Loeber, R., Burke, J.D., & Lahey, B.B. (2002). What are the adolescent antecedents to antisocial
personality disorder? Criminal Behaviour and Mental Health, 12(1), 24-36. doi:10.1002/cbm.484
113
Loeber, R., Dishion, T. J., & Patterson, G. R. (1984). Multiple gating: A multistage assessment procedure for identifying youths at risk for delinquency. Journal of Research in Crime
and Delinquency, 21(1), 7-32. doi:10.1177/0022427884021001002 Lorber, M. F. (2004). Psychophysiology of aggression, psychopathy, and conduct problems: A
meta-analysis. Psychological Bulletin, 130(4), 531-552. doi:10.1037/0033-2909.130.4.531
Marsee, M.A., Silverthorn, P., & Frick, P.J. (2005). The association of psychopathic traits with
aggression and delinquency in non-referred boys and girls. Behavioral Sciences and the
Law, 23(6), 803-817. doi:10.1002/bsl.662
Marsh, P., Beauchaine, T. P., & Williams, B. (2008). Dissociation of sad facial expressions and autonomic nervous system responding in boys with disruptive behavior disorders. Psychophysiology, 45(1), 100-110. doi:10.1111/j.1469-8986.2007.00603.x
Marsh, A.A., Finger, E.C., Mitchell, D.G.V., Reid, M.E., Sims, C., Kosson, D.S.,…Blair, R.J.R.
(2008). Reduced amygdala response to fearful expressions in children and adolescents with callous-unemotional traits and Disruptive behavior disorders. American Journal of
Psychiatry, 165, 712-720. doi: 10.1176/appi.ajp.2007.07071145 Mathias, C. W., & Stanford, M. S. (2003). Impulsiveness and arousal: Heart rate under
conditions of rest and challenge in healthy males. Personality and Individual Differences,
35(2), 355-371. doi:10.1016/S0191-8869(02)00195-2 Mezzacappa, E., Tremblay, R.E., Kindlon, D., Saul, J.P., Arseneault, L., Seguin, J., Phil, R.O., &
Earls, F. (1997). Anxiety, antisocial behavior, and heart rate regulation in adolescent males. Journal of Child Psychology and Psychiatry, 38(4), 457-469. doi:10.1111/j.1469-7610.1997.tb01531.x
Mitchell, D.G.V., Colledge, E., Leonard, A., & Blair, R.J.R. (2002). Risky decisions and
response reversal: is there evidence of orbitofrontal cortex dysfunction in psychopathic individuals? Neuropsychologia, 40(12), 2013-2022. doi:10.1016/S0028-3932(02)00056-8
Moffitt, T. E. (1993). “Life-course-persistent” and “adolescence-limited” antisocial behavior: A developmental taxonomy. Psychological Review, 100(4), 674– 701. doi:10.1037/0033-295X.100.4.674
Moffitt, T.E & Caspi, A. (2001). Childhood predictors differentiate life-course persistent and
adolescence-limited antisocial pathways among males and females. Developmental
Psychopathology, 13(2), 355-375. doi:10.1017/S0954579401002097
Moffitt, T.E., Caspi, A., Harrington, H., & Milne, B. (2002). Males on the life-course-persistent
and adolescence-limited antisocial pathways: Follow-up at age 26. Development and Psychopathology, 14(1), 179-206. doi:10.1017/S0954579402001104
114
Munoz, L.C., Frick, P.J., Kimonis, E.R., & Aucoin, K.J. (2008). Types of aggression, responsiveness to provocation, and callous-unemotional traits in detained adolescents. Journal of Abnormal Child Psychology 36(1), 15–28. doi:10.1007/s10802-007-9137-0
O'Brien, B. S. & Frick, P. J. (1996). Reward dominance: Associations with anxiety, conduct problems, and psychopathy in children. Journal of Abnormal Child Psychology, 24(2), 223-240. doi:10.1007/BF01441486
Pardini, D. A. & Loeber, R. (2007). Interpersonal and affective features of psychopathy in
children and adolescents: Advancing a developmental perspective. Journal of Clinical
Child & Adolescent Psychology, 36(3), 269-275. doi: 10.1080/15374410701441575 Patrick, C.J. (2008). Psychophysiological correlates of aggression and violence: An integrative
review. Philosophical Transactions of the Royal Society Biological Sciences, 363(1503), 2543-2555. doi:10.1098/rstb.2008.0028
Patrick, C.J., Fowles, D.C., & Krueger, R.F. (2009). Triarchic conceptualization of psychopathy:
Developmental origins of disinhibition, boldness, and meanness. Development and
Psychopathology, 21, 913-938. doi: http://dx.doi.org/10.1017/S0954579409000492 Pine, D.S., Shaffer, D., Schonfeld, I.S., & Davies, M. (1997). Minor physical anomalies:
Modifiers of environmental risks for psychiatric impairment? Journal of the American
Academy of Child and Adolescent Psychiatry, 36(3), 395-403. doi:10.1097/00004583-199703000-00019
Porges, S.W. (1985). U.S. Patent No. 4,510,944. Washington, DC: U.S. Patent and Trademark
Office. Porges, S.W. & Bohrer, R.E. (1990). Analyses of periodic processes in psychophysiological research. In J.T. Cacioppo and L.G. Tassinary (Eds.), Principles of Psychophysiology:
Physical, Social, and Inferential Elements. 708-753.New York: Cambridge University Press.
Porges, S.W., Doussard-Roosevelt, & Maiti (1994). Vagal tone and the physiological regulation
of emotion. Monographs of the Society for Research in Child Development, 59, 167-186. doi: 10.1111/j.1540-5834.1994.tb01283.x
Poulin, F. & Boivin, M. (2000). Reactive and proactive aggression: Evidence of a two-factor
model. Psychological Assessment, 12(2), 115-122. doi:10.1037/1040-3590.12.2.115 Poythress, N.G., Dembo, R., Wareham, J., & Greenbaum, P.E. (2006). Construct Validity of the
Youth Psychopathic Traits Inventory (YPI) and the Antisocial Process Screening Device (APSD) With Justice-Involved Adolescents. Criminal Justice and Behavior, 33(1), 26- 55. doi:10.1177/0093854805282518
115
Raine, A. (2002). Annotation: The role of prefontal deficits, low autonomic arousal, and early health factors in the development of antisocial and aggressive behavior in children. Journal of Child Psychology and Psychiatry, 43(4), 417-434. doi:10.1111/1469- 7610.00034
Reynolds, C.R. & Kamphaus, R.W. (1992). Behavior Assessment System for Children Manual.
United States: American Guidance Service, Inc. Ronningstam, E. (2010). Narcissistic personality disorder: A current review. Current Psychiatry
Reports, 12(1), 68-75. doi:10.1007/s11920-009-0084-z
Salekin, R.T., Neumann, C.S., Leistico, A.M.R., DiCicco, T.M., & Duros, R.L. (2004). Psychopathy and comorbidity in a young offender sample: Taking a closer look at psychopathy's potential importance over disruptive behavior disorders. Journal of
Abnormal Psychology, 113(3), 416-427. doi:10.1037/0021-843X.113.3.416 Shirtcliff, E.A., Vitacco, M.J., Graf, A.R., Gotisha, A.J., Merz, J.L., & Zahn-Waxler, C.
(2009). Neurobiology of empathy and callousness: Implications for the development of antisocial behavior. Behavioral Sciences & the Law, 27(2), 137-171. doi:10.1002/bsl.862
Silverthorn, P., Frick, P.J,. & Reynolds, R. (2001). Timing of onset and correlates of severe conduct problems in adjudicated girls and boys. Journal of Psychopathology and
Behavioral Assessment, 23(3), 171-181. doi:10.1023/A:1010917304587 Suzuki, A., Hirota, A., Takasawa, N., & Shigemasu, K. (2003). Application of the somatic
marker hypothesis to individual differences in decision-making. Biological Psychology,
65(1), 81-88. doi:10.1016/S0301-0511(03)00093-0 Sylvers, P., Brubaker, N., Alden, S. A., Brennan, P. A., & Lilienfeld, S. O. (2008). Differential
endophenotypic markers of narcissistic and antisocial personality features: A psychophysiological investigation. Journal of Research in Personality, 42(5), 1260-1270. doi:10.1016/j.jrp.2008.03.010
Thomaes, S., Bushman, B.J., De Castro, O., & Stegge, H. (2009). What makes narcissists
bloom? A framework for research on the etiology and development of narcissism. Development and Psychopathology, 21, 1233-1247. doi:10.1017/S0954579409990137
Thomaes, S., Stegge, H., Bush, B.J., Olthof, T., & Denissen, J. (2008). Development and
Validation of the Childhood Narcissism Scale. Journal of Personality Assessment, 90(4), 382–391. doi:10.1080/00223890802108162
Van Lier, P.A.C., Wanner, B., & Vitaro, F. (2007). Onset of antisocial behavior, affiliation with
deviant friends, and childhood maladjustment: A test of the childhood-and adolescent-onset models. Development and Psychopathology, 19(1), 167-185. doi:10.1017/S0954579407070095
116
Vasilev, C.A., Crowell, S.E., Beauchaine, T.P. Mead, H.K., & Gatzke-Kopp, L.M. (2009). Correspondence between physiological and self-report measures of emotion dysregulation: A longitudinal investigation of youth with and without psychopathology. The Journal of Child Psychology and Psychiatry, 50(11), 1357-1364. doi:10.1111/j.1469-7610.2009.02172.x
Vaughn, M.G., Edens, J.F., Howard, M.O., & Smith, S.T. (2009). An investigation of primary
and secondary psychopathy in a statewide sample of incarcerated youth. Youth Violence
and Juvenile Justice, 7(3), 172-188. doi: 10.1177/1541204009333792 Vaughn, M. G. & Howard, M.O. (2005). The construct of psychopathy and its potential
contribution to the study of serious, violent, and chronic youth offending, Youth Violence
and Juvenile Justice, 3(3), 235-252. doi:10.1177/1541204005276320
Vaughn, M.G., Howard, M.O., & DeLisi, M. (2008). Psychopathic personality traits and delinquent careers: An empirical examination. International Journal of Law and
Psychiatry, 31, 407-416. doi:10.1016/j.ijlp.2008.08.001 Vincent, G.M., Vitacco, M.J., Grisso, T., & Corrado, R.R. (2003). Subtype of adolescent
offenders: Affective traits and antisocial behavior patterns. Behavioral Sciences and the
Law, 21(6), 695-712. doi:10.1002/bsl.556 Vitacco, M.J., Rogers, R., & Neumann, C.S. (2003). The Antisocial Process Screening Device:
An examination of its construct and criterion-related validity. Assessment, 10(2), 143-150. doi:10.1177/1073191103010002005
Volavka, J. (1999). The neurobiology of violence: An update. The Journal of Neuropsychiatry
and Clinical Neurosciences, 11(3), 307-314. Washburn, J.J., McMahon, S.D., King, C.A., Reinecke, M.A., & Silver, C. (2004). Narcissistic
Features in Young Adolescents: Relations to Aggression and Internalizing Symptoms. Journal of Youth and Adolescence, 33(3), 247–260. doi:10.1023/B:JOYO.0000025323.94929.d9
Webster-Stratton, C., Reid, M.J., & Hammond, M. (2004). Treating children with early-onset
conduct problems: Intervention outcomes for parent, child, and teacher training. Journal
of Clinical Child and Adolescent Psychology, 33, 105-124. doi:10.1207/S15374424JCCP3301_11
White, J. L., Moffitt, T. E., Caspi, A., Bartusch, D. J., Needles, D. J., & Stouthamer-Loeber, M.
(1994). Measuring impulsivity and examining its relationship to delinquency. Journal of
Abnormal Psychology, 103(2), 192-205. doi:10.1037/0021-843X.103.2.192
117
Wilson, A. C., Lengua, L. J., Tininenko, J., Taylor, A., & Trancik, A. (2009). Physiological profiles during delay of gratification: Associations with emotionality, self-regulation, and adjustment problems. Journal of Applied Developmental Psychology, 30(6), 780-790. doi:10.1016/j.appdev.2009.05.002