Page 1
8/3/2019 The Relationship Between Serum and Salivary Corti
http://slidepdf.com/reader/full/the-relationship-between-serum-and-salivary-corti 1/81
The Relationship between Plasma and Salivary CortisolLevels in Response to Different Exercise Intensities
Mitch D. VanBruggen
A thesis submitted to the faculty of the University of North Carolina at Chapel Hill in partialfulfillment of the requirement for the degree of Master of Arts in the Department of Exercise
and Sport Science (Exercise Physiology).
Chapel Hill
Spring 2010
Approved by:
A.C. Hackney, Ph.D., D.Sc.
R.G. McMurray, Ph.D.
K.S. Ondrak, Ph.D.
Page 2
8/3/2019 The Relationship Between Serum and Salivary Corti
http://slidepdf.com/reader/full/the-relationship-between-serum-and-salivary-corti 2/81
ii
©2010
Mitch D. VanBruggen
ALL RIGHTS RESERVED
Page 3
8/3/2019 The Relationship Between Serum and Salivary Corti
http://slidepdf.com/reader/full/the-relationship-between-serum-and-salivary-corti 3/81
iii
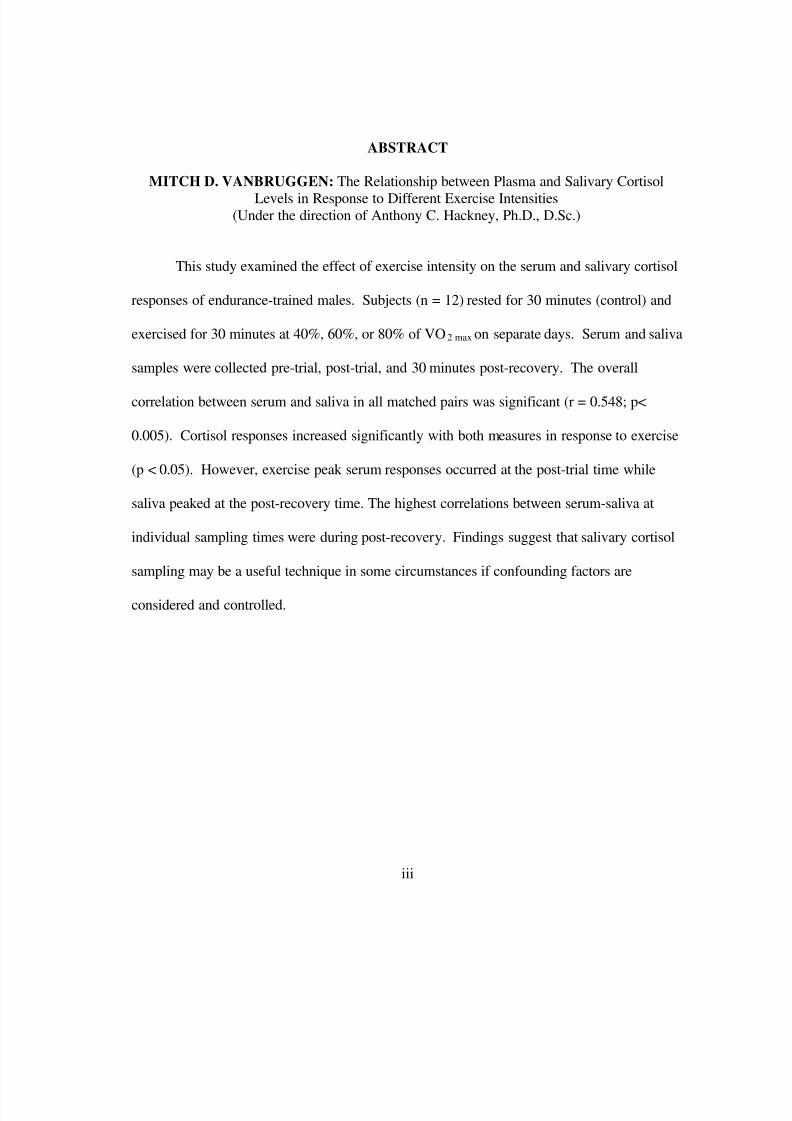
ABSTRACT
MITCH D. VANBRUGGEN: The Relationship between Plasma and Salivary CortisolLevels in Response to Different Exercise Intensities
(Under the direction of Anthony C. Hackney, Ph.D., D.Sc.)
This study examined the effect of exercise intensity on the serum and salivary cortisol
responses of endurance-trained males. Subjects (n = 12) rested for 30 minutes (control) and
exercised for 30 minutes at 40%, 60%, or 80% of VO2 max on separate days. Serum and saliva
samples were collected pre-trial, post-trial, and 30 minutes post-recovery. The overall
correlation between serum and saliva in all matched pairs was significant (r = 0.548; p<
0.005). Cortisol responses increased significantly with both measures in response to exercise
(p < 0.05). However, exercise peak serum responses occurred at the post-trial time while
saliva peaked at the post-recovery time. The highest correlations between serum-saliva at
individual sampling times were during post-recovery. Findings suggest that salivary cortisol
sampling may be a useful technique in some circumstances if confounding factors are
considered and controlled.
Page 4
8/3/2019 The Relationship Between Serum and Salivary Corti
http://slidepdf.com/reader/full/the-relationship-between-serum-and-salivary-corti 4/81
iv
ACKNOWLEDGEMENTS
Throughout the entire process of completing this project, I had the help and support
of many people, and without them, I would not have been able to finish. First and foremost, I
would like to express my gratitude to my advisor, Dr. Anthony C. Hackney, for his expertise,
the numerous hours of his assistance in data collection, the invaluable guidance and
organization he provided throughout the research process, and his friendship and motivation
along the way. I would also like to thank my committee members, Dr. Robert McMurray
and Dr. Kristin Ondrak for their direction and assistance. Often overlooked in projects like
this are the subjects — without their time commitment and effort I would not have been able
to get the necessary data to proceed with the investigation. Finally, I am grateful for the
assistance of my fellow classmates who aided in the data collection process and who
provided me with encouragement at every step along the path to completion.
Page 5
8/3/2019 The Relationship Between Serum and Salivary Corti
http://slidepdf.com/reader/full/the-relationship-between-serum-and-salivary-corti 5/81
TABLE OF CONTENTS
Page
LIST OF TABLES………………………………………………………………… .………..vii
LIST OF FIGURES………………………….……………………………………………….ix
Chapter
I. BASIS FOR STUDY………………………………………………………….1
Introduction…………………………………………………… .……………...1
Purpose………………………………………………………………...………4
Research hypotheses………………………………………………………..…4
Definition of terms……………………………………………………………. 4
Delimitations………………………………………………………..…………5
Limitations……………………………………………………………………. 6
Significance of study…………………………………………….……….……6
II. REVIEW OF LITERATURE…………………………………………………7
Introduction……………………………………………………………………7
Physiological mechanisms of cortisol release…………………………………7
Theory and overview …………………………………………………7
Factors influencing variability of responses…………………..………8
Serum cortisol sampling with exercise……....………………………………10
Salivary cortisol methodology…………………………………………….…11
Page 6
8/3/2019 The Relationship Between Serum and Salivary Corti
http://slidepdf.com/reader/full/the-relationship-between-serum-and-salivary-corti 6/81
vi
Diffusive properties, sampling, and analysis...………………………11
Salivary cortisol sampling with exercise…………………….………12
Comparison of serum and saliva sampling……………………..……………14
Comparisons of methods in response to exercise……………………15
Need for additional research on salivary cortisol
in response to exercise...……………………………………………………..17
III. METHODOLOGY…………………………..………………………………19
Subjects……………………………………………………………………… 19
Protocol……………………………………………………………………… 19
Orientation/maximal oxygen consumption testing trial….………..…………21
Exercise-control trials….……………………………………….……………22
Instrumentation………………………………………………………………24
Specimen procedures……………………………………….……..…………24
Collection and storage………………………………………………..24
Biochemical Analysis……………………………………………………..…26
Data analysis…………………………………………………………………26
IV. RESULTS……………………………………………………………………28
Subject characteristics………………………………………………………..28
VO2 max testing data……………………………..……………………………29
Experimental trial testing data…..…….……….………….…………………29
Plasma volume changes...……………………………………………………30
Cortisol analysis……..……………………………….………………………31
Serum Cortisol………….……………………………………………31
Page 7
8/3/2019 The Relationship Between Serum and Salivary Corti
http://slidepdf.com/reader/full/the-relationship-between-serum-and-salivary-corti 7/81
vii
Salivary Cortisol………………………………………..……………32
Cumulative serum versus salivary cortisol responses…………..……………33
Serum versus salivary responses within trials……………………………….34
V. DISCUSSION………………………………………………..………………36
Introduction…………………………………………………………………..36
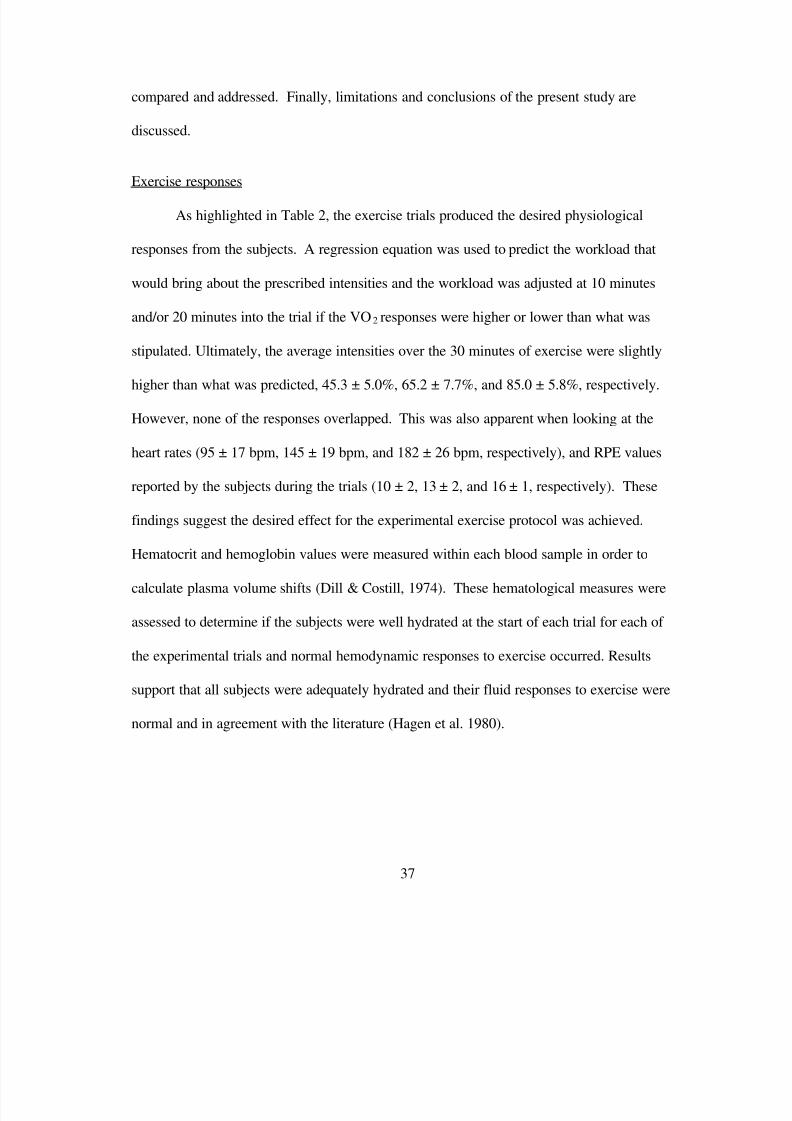
Exercise res ponses…………………………………………………………...37
Cortisol responses……………………………………………………………38
Serum………………………………………………………………...38
Saliva……………………………………………………………........39
Comparison of serum to salivary cortisol…………………………....41
Comparison of serum to saliva during exercise……………………………...42
Peak res ponses……………………………………………………….44
Limitations of study…………………………………………………….……45
Summary…………………………………………………………..…………47
VI. SUMMARY, CONCLUSIONS AND RECOMMENDATIONS……...……48
Conclusions……………………………………………………………..……49
APPENDICES……………………………………………………………………….………50
A. Medical and training history………………………………..……………………51
B. Physical screening………………………………………………………..………55
C. Informed consent f orm……………………………………………...……………56
D. Data collection sheets……………………………………..………………………62
E. Assay information…………………………………………..…………………….67
REFERENCES……………………………………………………………………………… 69
Page 8
8/3/2019 The Relationship Between Serum and Salivary Corti
http://slidepdf.com/reader/full/the-relationship-between-serum-and-salivary-corti 8/81
viii
LIST OF TABLES
Table
1. VO2 max test results (mean ± SD) of subjects…………………………………29
2. Results of select variables (mean ± SD) during exercise trials….……...……30
3. Hct, Hb values and plasma volume shifts forexperimental trials….…………………………………..…………………….30
4. Serum cortisol concentrations (µg/dL) for each
experimental trials………………………………………………………....…31
5. Salivary cortisol concentrations (µg/dL) each
experimental trials………………………………………………….…...……32
6. Pearson Product Moment correlations for serum versus saliva………...........35
Page 9
8/3/2019 The Relationship Between Serum and Salivary Corti
http://slidepdf.com/reader/full/the-relationship-between-serum-and-salivary-corti 9/81
ix
LIST OF FIGURES
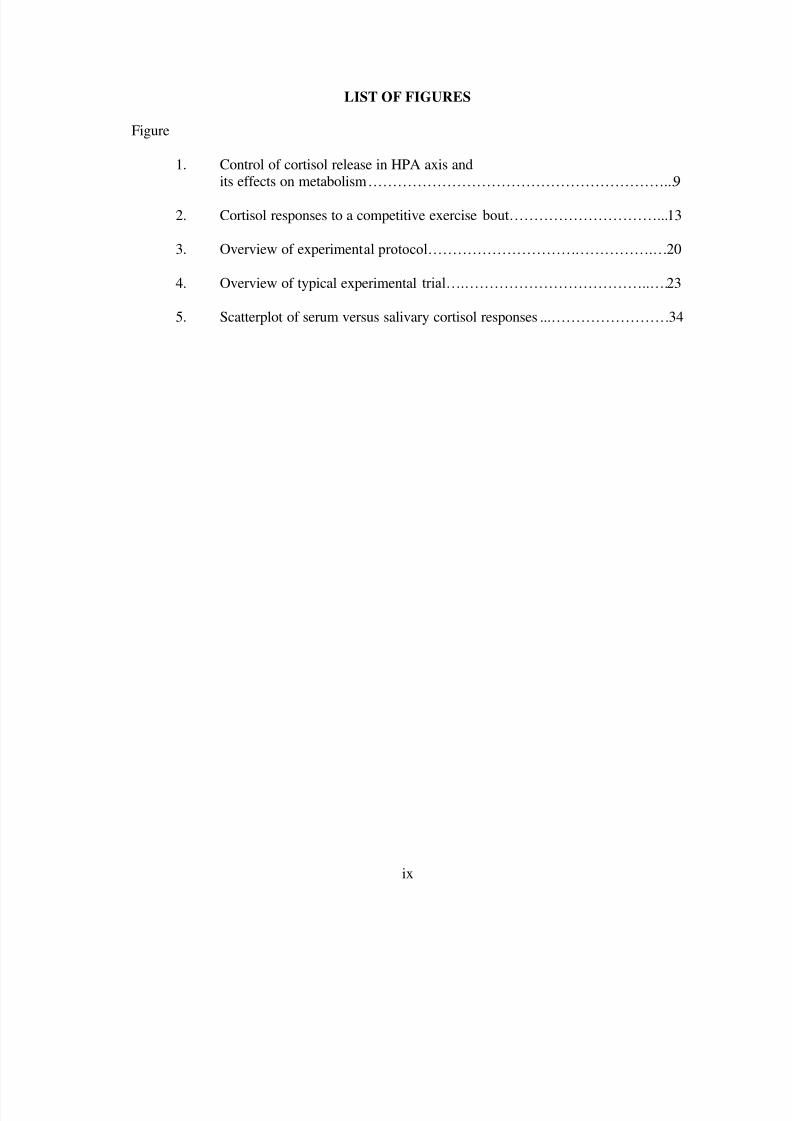
Figure
1. Control of cortisol release in HPA axis and
its effects on metabolism……………………………………………………...9
2. Cortisol responses to a competitive exercise bout…………………………...13
3. Overview of experimental protocol……………………………………….…20
4. Overview of typical experimental trial….………………………………..….23
5. Scatterplot of serum versus salivary cortisol responses...……………………34
Page 10
8/3/2019 The Relationship Between Serum and Salivary Corti
http://slidepdf.com/reader/full/the-relationship-between-serum-and-salivary-corti 10/81
CHAPTER I
BASIS FOR STUDY
Introduction
Cortisol levels increase in response to psychological and physical stressors such as
life changes, extreme temperatures, negative energy balance, and physical exercise
(McMurray & Hackney, 2000; Viru et al., 2004). In response to the stress of exercise,
cortisol has many specific functions helping the body modify and adapt to the stress,
including: the mobilization of free fatty acids (FFA) from adipose tissue, protein catabolism,
stimulation of gluconeogenesis at the liver, and inhibition of glucose uptake by the working
skeletal muscle (Brooks et al., 2000). These responses act to increase exercise capacity and
aid in recovery and adaptation (Viru et al., 2007).
When stressed, the hypothalamus secretes corticotrophin releasing hormone (CRH),
which activates the anterior pituitary and stimulates the release of adrenocorticotropin
hormone (ACTH). The presence of ACTH stimulates the adrenal cortex to release cortisol
(Neal, 2001). Cortisol secretion is controlled through a negative feedback process, where
high levels inhibit the secretion of ACTH from the anterior pituitary. In contrast, high levels
of ACTH and cortisol can signal the hypothalamus to reduce the secretion of CRH. This
entire interconnected process is referred to as the hypothalamic-pituitary-adrenocortical
(HPA) axis (Hill et al., 2008).
Page 11
8/3/2019 The Relationship Between Serum and Salivary Corti
http://slidepdf.com/reader/full/the-relationship-between-serum-and-salivary-corti 11/81
2
Most previous exercise studies investing cortisol responses to exercise are in
agreement that there is a ―threshold intensity‖ that results in significant elevations in
circulating cortisol. For example, Davies and colleagues (1973) found that an exercise
intensity of 50-60% of VO2max must be reached for cortisol to be increased and the absolute
levels attained during exercise are dependent on the total duration of the exercise bout. In
another example, Hill and colleagues (2008) examined the effect of exercise intensity upon
the cortisol response of the HPA axis in moderately trained men. Moderate to high intensity
(60% and 80% of maximal oxygen consumption [VO2 max]) exercise augmented circulating
cortisol levels. These increases were a result of a combination of hemoconcentration and
HPA axis stimulus (ACTH). Conversely, low intensity exercise (40% of VO2 max) did not
result in significant increases in cortisol levels, actually reducing cortisol concentrations
when accounting for plasma volume changes (Hill et al., 2008).
While there are similar findings in previous research assessing cortisol release and
circulation during exercise, many of these studies measured the cortisol response by
assessing concentrations in the serum of the blood. While this method is accurate and
consistent, collection of blood samples is invasive, difficult to obtain during the exercise
process, and can also augment the stress response of the subject due to the collection
procedure (Kirschbaum et al., 1994).
Cortisol concentrations measured in saliva may provide a feasible, accurate, and
practical alternative to serum determinations. In fact, some laboratories, clinicians, and
neuroendocrine researchers already use this technique (Hellhammer et al., 2009). Since
cortisol is a lipophilic steroid with low molecular weight, the cortisol that is unbound to
Page 12
8/3/2019 The Relationship Between Serum and Salivary Corti
http://slidepdf.com/reader/full/the-relationship-between-serum-and-salivary-corti 12/81
3
carrier proteins (e.g. cortisol binding globulin [CBG]) can enter the cells through passive
diffusion. In this way, it is possible to measure these free cortisol levels in all bodily fluids,
including saliva. Since only a small, unbound fraction of the hormone is available to diffuse
into the saliva, concentrations are consistently lower than in serum. However, it has been
demonstrated that salivary cortisol levels have a steady and predictable relation to the free,
unbound cortisol levels in serum and salivary levels accurately reflect serum levels regardless
of the degree of stimulation of the saliva glands (Vining et al., 1983). Previous studies have
found correlation coefficients between cortisol in saliva and cortisol in serum ranging from r
= 0.71 to r = 0.96 (Kirschbaum et al., 1994). However, these cross-sectional correlations
reflect associations between the two methods when subjects were at rest — exercise studies
were not included in the review.
Though many studies consider salivary cortisol concentrations a reliable and accurate
measure of this hormone, there is still some controversy surrounding this technique. Due to
the passive movement of cortisol from the serum into the saliva, there may be a delayed
response in salivary concentrations accurately reflecting the response in the blood (Umeda et
al., 1981). Additionally, because the response of the HPA axis is controlled through many
processes and factors, cortisol levels in the saliva may be partly disassociated from the other
processes regulating the HPA feedback loop, including ACTH and CRH. Moreover,
previous studies comparing methodologies have not used exercise as the stressor to stimulate
the HPA axis (Hellhammer et al., 2009). The acute stress of short exercise bouts (compared
to prolonged exercise) may not allow for sufficient time for cortisol to diffuse into saliva.
Thus, this methodology needed to be further explored, particularly in response to extreme
stressors, such as physical exercise.
Page 13
8/3/2019 The Relationship Between Serum and Salivary Corti
http://slidepdf.com/reader/full/the-relationship-between-serum-and-salivary-corti 13/81
4
Purpose
This purpose of this study was to investigate the associations between serum and
salivary cortisol levels pre-trial, immediate post-trial and after recovery (30 minutes; post-
recovery) at three different intensities (40%, 60%, and 80% of VO2 max) and a control trial to
determine if salivary concentrations could be an accurate method to assess the bod y‘s stress
response to exercise. It also aimed to determine if there was a similar temporal relationship
for peak responses to exercise.
Research hypotheses
1. There will be significant correlations between serum and salivary cortisol concentrations at
the pre-trial, post-trial and post-recovery sampling time within each of the experimental trials
(control, 40%, 60% and 80% VO2 max exercise).
2. The peak saliva cortisol response when compared to the peak serum response within the
60% and 80% exercise trials will occur at a later sampling time.
Definition of terms
Adrenocorticotropic hormone (ACTH) – a polypeptide tropic hormone produced and secreted
by the anterior pituitary gland (Neal, 2001).
Cortisol – A glucocorticoid hormone secreted from the zona fasciculata of the adrenal cortex.
Cortisol release is stimulated by adrenocorticotropin hormone (ACTH) from the anterior
pituitary (Neal, 2001).
Cortisol binding globulin (CBG) – a large plasma protein that the majority of cortisol is
bound to as it travels in the blood (Kirschbaum et al., 1994).
Page 14
8/3/2019 The Relationship Between Serum and Salivary Corti
http://slidepdf.com/reader/full/the-relationship-between-serum-and-salivary-corti 14/81
5
Corticotropin releasing hormone (CRH) – a hormone secreted by the paraventricular nucleus
(PVN) of the hypothalmus in response to stress (Neal, 2001).
Hypothalamic-pituitary-adrenocortical (HPA) axis – an interconnected feedback loop which
is a major part of the neuroendocrine system that controls reactions to stress and regulates
many of the body‘s processes.
Maximal oxygen uptake (VO2 max) – the maximum capacity to transport and utilize oxygen
during whole-body exercise (Brooks et al., 2000).
Radioimmunoassay (RIA) – a highly sensitive laboratory technique that analyzes of the
binding between an antigen and its homologous antibody in order to identify and quantify a
substance (e.g. hormone) in a biological fluid (Chard, 1990).
Salivary cortisol enzyme immunoassay (EIA) – a highly sensitive immunochemical test in
which cortisol in standards and unknowns compete with cortisol linked to horseradish
peroxidase for the antibody binding sites. The amount of cortisol peroxidase detected is
inversely proportional to the amount of cortisol present (Chard, 1990).
Delimitations
1. Subjects were healthy, endurance-trained males between 18 and 30 years of age.
2. Subjects reported to each trial 4 hours post-prandial, and maintained and controlled their
diet preceding each of the experimental trials.
3. Experimental trials were completed in random order, separated by at least 72 hours.
4. Each of the experimental trials were conducted at the same time of day (within each
subject) to account for circadian rhythms.
Page 15
8/3/2019 The Relationship Between Serum and Salivary Corti
http://slidepdf.com/reader/full/the-relationship-between-serum-and-salivary-corti 15/81
6
5. Psychological stress was controlled for as each subject demonstrated normal scores on the
Recovery-Stress Questionnaire (REST-Q) before proceeding with each of the separate
experimental trials.
Limitations
1. The results can only be generalized to the sample studied: healthy, moderately to highly
endurance trained adult males between 18 and 30 years of age.
2. The sample size in this study was relatively small (n = 12) due to limitations in recruiting
moderate to highly trained males.
Significance of study
This study attempted to validate salivary cortisol as a reliable method to assess levels
of this hormone in response to exercise. Collection of saliva (as opposed to blood) facilities
more frequent sampling, is less invasive, and allows subjects to obtain samples without the
assistance of a phlebotomy technician. This permits sampling outside of a laboratory
environment such as during a training session or competitive event. This study is novel
because it involved assessing each of these methods in response to different exercise
intensities and determined if there was a delay in the peak responses of saliva compared to
serum, which has not been extensively studied in previous research. If this relationship
between these two methods is better understood, it may facilitate saliva sampling as a more
readily acceptable measurement in sports physiology.
Page 16
8/3/2019 The Relationship Between Serum and Salivary Corti
http://slidepdf.com/reader/full/the-relationship-between-serum-and-salivary-corti 16/81
CHAPTER II
REVIEW OF LITERATURE
Introduction
It is important to note that there are few previous research studies which have
specifically used salivary cortisol sampling techniques, especially in response to exercise
protocols utilizing multiple intensities and in comparison to serum sampling techniques. This
makes the purpose of this research study somewhat novel; however, it was also a limitation
in that that there are few studies which provided an extensive groundwork and foundation to
build upon and compare to in this project.
Physiological mechanisms of cortisol release
Theory and overview
Cortisol secretion is controlled through the mechanisms of the hypothalamus,
pituitary gland, and adrenal cortex (HPA axis). In response to physiological and
psychological stressors, the hypothalamus secretes corticotrophin-releasing hormone (CRH)
which causes the anterior pituitary gland to secrete adrenocorticotropin releasing hormone
(ACTH) into circulation. This hormone then causes the adrenal cortex to release cortisol. As
the cortisol level is augmented, CRH and ACTH are inhibited through negative feedback
(Brooks et al., 2000; McMurray & Hackney, 2000).
Cortisol release is stimulated by a wide array of stress-inducing stimuli, including
exercise, which results in a wide array of mechanisms which help the body adapt to the stress
Page 17
8/3/2019 The Relationship Between Serum and Salivary Corti
http://slidepdf.com/reader/full/the-relationship-between-serum-and-salivary-corti 17/81
8
and return to homeostasis (Neal, 2001). The primary roles of cortisol include: proteolysis,
stimulation of lipolysis, and promoting gluconeogenesis at the liver (Hackney, 2006;
McMurray & Hackney, 2000). Cortisol also prevents the uptake of glucose by the active
skeletal muscle and has an inhibitory affect on protein synthesis during exercise and into the
recovery period following an exercise bout. Inhibition of protein synthesis in recovery
functions to free amino acids into the blood which are used for muscle remodeling, to build
new proteins, or to be shunted to the hepatic tissue to be used for substrate in
gluconeogenesis. This is why cortisol levels often remain elevated for up to 120 minutes into
recovery from the exercise bout (Viru et al., 2004). Figure 1 displays the control of the HPA
axis and the effect of cortisol on the body‘s metabolic processes.
Factors influencing variability of responses
Acute exercise can result in increased cortisol levels, but the response of the hormone
is largely dependent on the intensity of the exercise bout being completed. The cortisol
response during an acute exercise session is dependent on many other factors, including:
circadian rhythms, environmental conditions, competitive nature of exercise bout, age,
gender, genetics, anaerobiosis of the exercise, and nutritional considerations (Hackney, 2006;
Thuma et al., 1995).
Training status is also a key component in cortisol responses- levels in trained
subjects are generally more attenuated than those who are untrained or sedentary, even when
the physically fit subjects work at the same percentage of their maximal capacity as the unfit
subjects. Additionally, trained athletes typically have lesser responses as the duration of the
exercise becomes longer and the effort becomes more difficult (Bloom et al., 1976). This
may be due to a higher number of receptors as well as an increased sensitivity to cortisol,
Page 18
8/3/2019 The Relationship Between Serum and Salivary Corti
http://slidepdf.com/reader/full/the-relationship-between-serum-and-salivary-corti 18/81
9
meaning that less of the hormone is needed to produce the responses required to adapt to the
stress of the exercise (Powers & Howley, 2004).
+ +
+ +
(-)
Corticotropin Releasing Hormone (CRH)
+ +
(-)
Adrenocorticotropic Hormone (ACTH)
+ +
Cortisol
Figure 1. Control of cortisol release in the hypothalamic-pituitary-adrenal (HPA) axis,
highlighting the positive and negative feedback to the hypothalamus and cortisol‘s effects on
the body‘s metabolic processes (adapted from Powers & Howley, 2004).
Hypothalamus
Higher Brain
Centers
Anterior
Pituitar Gland
Adrenal Cortex
Mobilizes tissue
amino acids
Stimulates
gluconeogenesis
Mobilizes free
fatty acids
Blocks entry of
glucose into cell
Stress(i.e. exercise)
Page 19
8/3/2019 The Relationship Between Serum and Salivary Corti
http://slidepdf.com/reader/full/the-relationship-between-serum-and-salivary-corti 19/81
10
Serum cortisol sampling with exercise
Previous research studies which have analyzed subjects‘ cortisol responses to exercise
have primarily utilized serum sampling to assess this hormone. Daly and colleagues
examined the cortisol responses to exhausting, prolonged exercise. Thirty-four healthy male
subjects ran on a treadmill until volitional exhaustion. Blood specimens were analyzed for
cortisol levels immediately at the end of exercise and at 30, 60, and 90 minutes into
recovery. A significantly greater number of the peak cortisol responses occurred during the
recovery period, indicating the importance of analyzing the cortisol responses into the
recovery period and not simply before, during or immediately after the exercise session.
(Daly et al., 2004).
Viru and colleagues also utilized serum sampling to assess cortisol responses to
maximal exercise and how this was affected by adrenergic factors. They had ten subjects run
to exhaustion on a treadmill, and obtained blood samples pre-exercise and post exercise to be
used to determine how the cortisol responses were affected by beta-adrenergic blockage as
well as a competitive condition. They found that both of these factors significantly
augmented cortisol responses (n = 10; p < 0.05), but were not additive, suggesting that that
there may be an upper limit on the magnitude of the of HPA response to intense exercise
(Viru et al., 2007).
Davies and Few (1973) investigated the cortisol response of ten subjects to a light
load (<50% VO2max) and a heavy load (60-90% VO2max). They determined that there needed
to be a threshold intensity of approximately 60% VO2max in order for cortisol levels to
increase. Hill and colleagues (2008) also verified that a workload of at least 60% VO2max will
Page 20
8/3/2019 The Relationship Between Serum and Salivary Corti
http://slidepdf.com/reader/full/the-relationship-between-serum-and-salivary-corti 20/81
11
augment cortisol responses. In this study, twelve moderately trained males exercised at 40%,
60%, and 80% of VO2max. Both the 60% and 80% trials resulted in significantly higher
cortisol responses than during the resting (control) and 40% trial. In fact, during the 40%
exercise bout, there was a decrease in cortisol (Hill et al., 2008). This is consistent with the
explanation of Galbo (1983). Cortisol responses may appear to be decreasing in a subjects‘
serum, but this is just a turnover effect. Cortisol is being released during the low intensity
exercise, but the clearance rate is simply greater than what is being secreted, resulting in a
lower concentration in the serum (Galbo, 1983). Other studies cited in review articles and
textbook chapters have corroborated the intensity/threshold effect of cortisol, noting that
approximately 60% of maximal aerobic capacity must be reached in order for cortisol levels
to respond to the exercise (Brooks et al., 2000; McMurray & Hackney, 2000).
Salivary cortisol methodology
Diffusive properties, sampling, and analysis
Control over saliva production is shared by the sympathetic and parasympathetic
branches of the autonomic nervous system, which work together in an intricate, complex
relationship. The parasympathetic system is largely responsible for enhancing fluid secretion
by the salivary glands, with the sympathetic system playing a smaller role. However, both of
these systems can signal the myoepithelial cells in the salivary glands to contract, increasing
the flow of saliva (Garrett, 1987).
Some compounds in the body can pass into the saliva from the blood, making saliva a
viable and safe diagnostic fluid in many areas of scientific research, especially when
compared to blood and urine (Kaufman et al., 2002). Specifically, cortisol has a steady and
Page 21
8/3/2019 The Relationship Between Serum and Salivary Corti
http://slidepdf.com/reader/full/the-relationship-between-serum-and-salivary-corti 21/81
12
predictable relation to the free, unbound levels in serum. Salivary cortisol is a useful
biomarker in stress research, as long as the researcher is aware of possible sources of
variation, which may affect this measure. Several factors, including adrenal sensitivity and
cortisol binding affect total and free cortisol levels in blood, translating to what
concentrations are measured in the saliva (Hellhammer et al., 2009).
In a series of studies, Schwartz and colleagues evaluated the reliability of
radioimmunoassay (RIA) for salivary cortisol. They concluded that associations between
serum and salivary cortisol were reliable and valid as long as contaminants were not
introduced into the sampling process (Schwartz et al., 1998). Umeda and colleagues (1981)
also examined the viability of salivary cortisol measurement, stating that it is an
exceptionally accurate index of plasma free cortisol concentration, independently of salivary
flow rate. Additionally, Umeda maintained that this method may be preferable to other
methods for many reasons: saliva is obtained by noninvasive stress-free procedures, is stable
at room temperatures, is easier to collect, does not require skilled personnel for collection,
and can be sample numerous times during a session in the laboratory or throughout the day at
home or in the field (Levine et al., 2007).
Salivary cortisol sampling with exercise
Kivlighan and colleagues used saliva as the sampling method for obtaining cortisol
responses to the anticipation of exercise as well as during the recovery period after the
exercise. Though this study did not specifically focus on the methodology of the saliva
sampling technique, it was unique in that the cortisol responses of the subjects were highly
consistent with previous responses measured using serum concentrations. That is, the
Page 22
8/3/2019 The Relationship Between Serum and Salivary Corti
http://slidepdf.com/reader/full/the-relationship-between-serum-and-salivary-corti 22/81
13
responses to the particular protocol of exercise and recovery mirrored cortisol concentrations
measured via serum (Kivlighan et al., 2005). However, this protocol utilized only one bout
of exercise (2000 m rowing ergometer sprint) and did not measure responses to various
exercise intensities, thus resulting in only one level of stress.
Figure 2. Saliva cortisol responses in trained and untrained men and women beforecompetition, 20 minutes into recovery, and 40 minutes into recovery from the competitive
exercise bout (adapted from Kivlighan et al., 2005).
Jacks and colleagues also used saliva as a sampling technique in a study involving
exercise and cortisol responses — however, this study measured responses to differences in
exercise intensities. Ten males were assigned to random, 1 hour-cycle ergometer bouts of
exercise at approximately 40%, 60%, and 80% of their VO2 peak as well as a resting control
session. The saliva samples were collected before exercise and then at 10, 20, 40, and 59
minutes of exercise and at 20 minutes of recovery. They found that with the 80% exercise
Page 23
8/3/2019 The Relationship Between Serum and Salivary Corti
http://slidepdf.com/reader/full/the-relationship-between-serum-and-salivary-corti 23/81
14
intensity, cortisol was significantly higher at 59 minutes of exercise than at those same time
points during the resting control session. No significant differences in cortisol concentration
were found in the other exercise intensities (Jacks et al., 2002). This study was very similar
in methodology to the present study, but utilized salivary sampling exclusively to determine
the subjects‘ response to different exercise intensities and did not compare serum and
sampling techniques and concentrations.
Comparison of serum and saliva sampling
Previous studies have found strong relationships between the two sampling methods,
evidenced by strong correlation coefficients between cortisol in saliva and cortisol in serum
at rest ranging from r = 0.71 to r = 0.96 (Kirschbaum et al., 1994). For instance, Vining and
colleagues found that salivary cortisol concentrations were directly proportional (p < 0.05) to
the serum unbound cortisol concentration both in normal men and women and that the rate of
equilibrium of cortisol between blood and saliva was very fast (less than 5 minutes).
However, this investigation did not use exercise as the stressor to the HPA axis, which may
have caused a slower equilibrium between free levels of the hormone in blood and saliva.
Still, the researchers concluded that salivary cortisol is the more appropriate measure of the
response of the HPA axis to stress than serum cortisol since it is more simple, stress free, and
non-invasive (Vining et al., 1983). Associations between the methods also remained high (r
= 0.86; p < 0.05) when measuring cortisol with both methods throughout the circadian cycle
of the hormone (Levine et al., 2007)
Page 24
8/3/2019 The Relationship Between Serum and Salivary Corti
http://slidepdf.com/reader/full/the-relationship-between-serum-and-salivary-corti 24/81
15
Comparisons of methods in response to exercise
Few studies have directly compared the two sampling techniques in response to
exercise. Ben-Aryeh and colleagues examined the effect of exercise on cortisol levels in
serum and saliva in young, healthy males. The subjects performed graded submaximal cycle
exercise for nine min at up to 85% of their age-predicted maximal heart rate. Surprisingly,
they found a non-significant increase in saliva and serum cortisol levels; however, the lack of
significance was attributed to a decrease in blood flow in the salivary glands, dry mouth due
to dehydration, and a decrease in measured salivary flow. They also postulated that
collection of the saliva samples later on during the recovery period would have yielded
significant increases in cortisol concentrations as opposed to what was found immediately
after the exercise session (Ben-Aryeh et al., 1989). This study highlighted the importance of
the timing of the serum and saliva sampling to limit other confounding variables that can
affect the results of the cortisol responses in each of these fluids.
Thomasson and colleagues directly compared plasma and saliva hormones in
res ponse to exercise; however, the investigation focused on the hormones‘ response to a long
exercise session (120 minutes) rather than a shorter, more intense bout. Nine, healthy
subjects exercised for the 120 minutes period at 50-55% of their VO2max. Blood and saliva
samples were taken at rest and every 30 minutes during the exercise bout and found there
was a significant relationship (r = 0.35; p <0.02) between the concentrations of cortisol in
each of these biological fluids averaged over the exercise sessions. They concluded that the
non-invasive saliva sampling offers a realistic and practical approach in the measurement of
Page 25
8/3/2019 The Relationship Between Serum and Salivary Corti
http://slidepdf.com/reader/full/the-relationship-between-serum-and-salivary-corti 25/81
16
the response of the HPA axis to exercise and can be used as an alternative to serum sampling
(Thomasson et al., 2009).
Research involving comparisons between serum and saliva using high intensity
exercise have yielded mixed results immediately after exercise. Gonzansky and colleagues
designed a study to determine whether salivary cortisol could be used instead of serum
cortisol in across a broad range of concentrations. They found that the salivary cortisol
responses to brief, intense exercise (90% of maximal heart rate for 10 minutes) paralleled
serum cortisol (r = 0.60; p < 0.001). The authors asserted that the salivary measures actually
are advantageous compared to serum during intense exercise because serum concentrations
are affected by the saturation point of cortisol binding globulin (CBG). Therefore, using
salivary cortisol as opposed to total serum cortisol eliminates the requirement to account for
within-subject changes or between-subject differences in CBG (Gonzansky et al., 2005).
Stupnicki and Obminski assessed serum and salivary cortisol concentrations in 78 elite
athletes engaged in different sports, by subjecting them to high-intensity laboratory exercise.
The mean difference in the pre-exercise cortisol concentrations in the seven groups studied
were more marked in serum than in saliva. The correlations between the pre-exercise values
were 0.47 for serum and 0.58 for saliva. This led the researchers to suggest that the salivary
cortisol concentration might be a more suitable variable for assessing glucocorticoid activity
before exercise and in response to exercise compared to serum cortisol concentrations since it
is likely less sensitive to pre-exercise emotional state (Stupnicki & Obminski, 2002).
While concentrations measured immediately after exercise are useful when making
comparisons between serum and saliva, there is limited research assessing responses into
recovery from exercise. Neary and colleagues investigated the relationship among resting
Page 26
8/3/2019 The Relationship Between Serum and Salivary Corti
http://slidepdf.com/reader/full/the-relationship-between-serum-and-salivary-corti 26/81
17
cortisol levels measured in serum and saliva samples to determine which method would be
the most appropriate and preferable to observe and monitor the physiological stress of
exercise training. Serum and saliva samples were collected from eight subjects following one
day of recovery from intense training. They found a significantly high correlation between
serum and salivary cortisol (r = 0.99) and concluded that either sampling technique can be
used to monitor cortisol during a recovery period from exercise training. However, since the
saliva collection is much less invasive, they maintained that it was the preferable method
(Neary et al., 2002). Finally, del Corral and colleagues assessed serum and salivary cortisol
responses of young males during and after a 70% exercise session. There were significant
increases in cortisol responses to the exercise session with both methods. Additionally, the
two methods were correlated (p < 0.05) after 30minutes of exercise (r = 0.90), and 15 min
post-exercise (r = 0.84). However, the levels were not correlated at rest (r = 0.46). This is
one of the few studies which used both methods and assessed levels during recovery from
exercise rather than simply immediately after exercise (del Corral et al., 1994). However,
responses were not assessed using multiple intensities as is design of the present study.
Need for additional research on salivary cortisol in response to exercise
This study aimed to validate salivary cortisol sampling as a way to assess this stress
related hormone in response to exercise intensity. While some previous studies have
investigated salivary cortisol response to exercise, there is minimal research which has
attempted to validate salivary cortisol responses to exercise using multiple intensities. The
goal and unique aspect of this study was to examine if there is still a similar response in
salivary concentrations to the established response in serum concentrations. With multiple
Page 27
8/3/2019 The Relationship Between Serum and Salivary Corti
http://slidepdf.com/reader/full/the-relationship-between-serum-and-salivary-corti 27/81
18
exercise intensities, it was necessary to investigate whether the relationships between these
two methods are disassociated from one another, or if there was a mirrored relationship when
comparing responses in serum and saliva. Determining when the peak responses of cortisol
occur in response to different exercise intensities using both methods may significantly
contribute to the field of sports physiology. Since salivary methods are more practical and
less invasive, future research may be possible in field settings, during training sessions, or
before and after a competitive event.
Page 28
8/3/2019 The Relationship Between Serum and Salivary Corti
http://slidepdf.com/reader/full/the-relationship-between-serum-and-salivary-corti 28/81
CHAPTER III
METHODOLOGY
Subjects
Moderate to highly aerobically-trained male subjects (ages 18-30) were recruited
from the campus of the University of North Carolina-Chapel Hill and surrounding areas for
this study. Subjects must have trained consistently for a minimum of 3 days per week for 60
minutes per day in the previous six months prior to the study. Each of the subjects were
informed of the risks of the protocol, signed statement of informed consent, passed a medical
and physical examination, and demonstrated normal scores on the Recovery Stress
Questionnaire (REST-Q) prior to each experimental trial. If the subjects scored above the
average of the midpoints of the stress scales, they were not allowed to proceed on that
particular trial. Exclusion criteria included: a diet chronically low (<50% of daily caloric
consumption) in carbohydrates, a prior history of hormonal disorders, mental illness, or
chronic non-steroidal anti-inflammatory (NSAID) drug use.
Protocol
Each subject was asked to report to the Applied Physiology Laboratory at the
University of North Carolina-Chapel Hill on five separate occasions. Subjects were
instructed to maintain and control their diet (eucaloric and at least 50% of calories from
carbohydrates) over the duration of the study. Prior to when the subjects reported to the
laboratory for the orientation session, they completed a 3-day diet record which they brought
Page 29
8/3/2019 The Relationship Between Serum and Salivary Corti
http://slidepdf.com/reader/full/the-relationship-between-serum-and-salivary-corti 29/81
20
with them to the laboratory. In between the orientation session and the first experimental
trial, the diet was analyzed using the nutrition database on the website of the United States
Department of Agriculture to determine the macronutrient breakdown of their daily caloric
intake. If the subjects‘ diet did not meet the required average daily carbohydrate
consumption to proceed, they were given guidance on how to healthily incorporate additional
sources of this macronutrient into their diet. After they completed another 3 day diet record
and verified that their diet contained at least 50% of calories from carbohydrates, the subjects
were allowed to continue with the experimental trials. Furthermore, subjects were asked to
come to laboratory 4 hours post-prandial, having consumed no caffeine or alcohol for 8 hours
prior to the session.
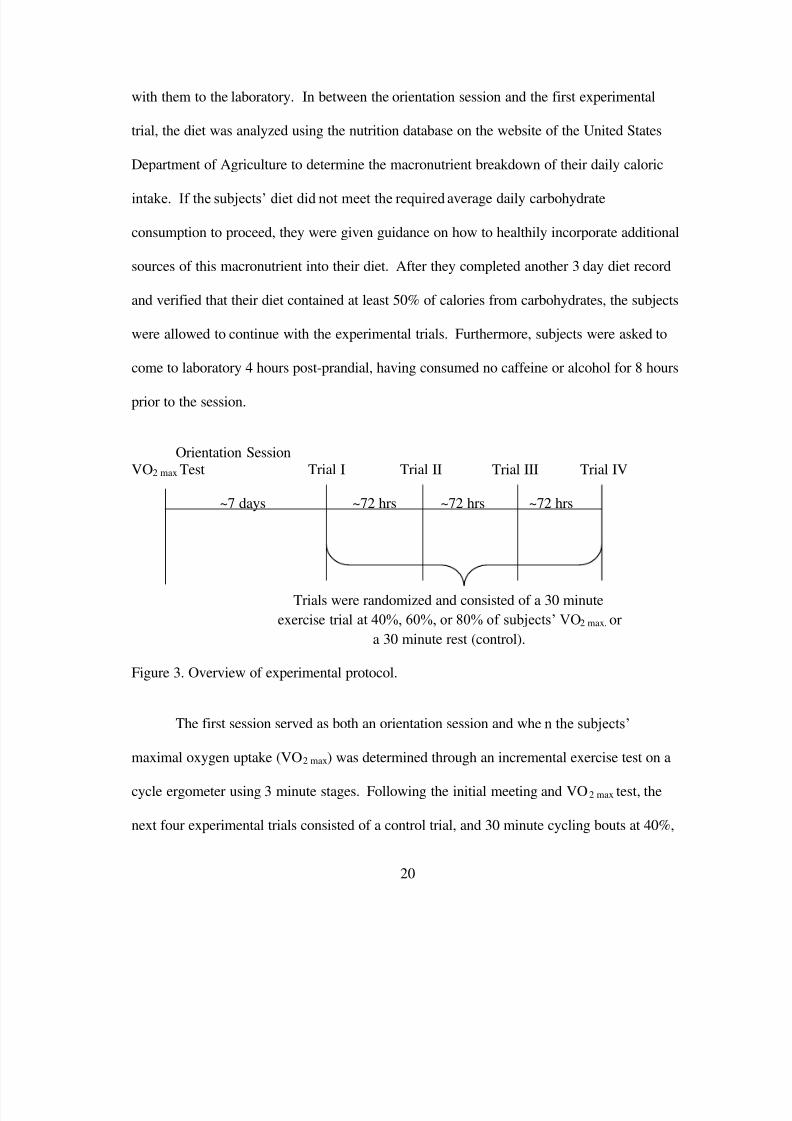
Orientation Session
VO2 max Test Trial I Trial II Trial III Trial IV
~7 days ~72 hrs ~72 hrs ~72 hrs
Figure 3. Overview of experimental protocol.
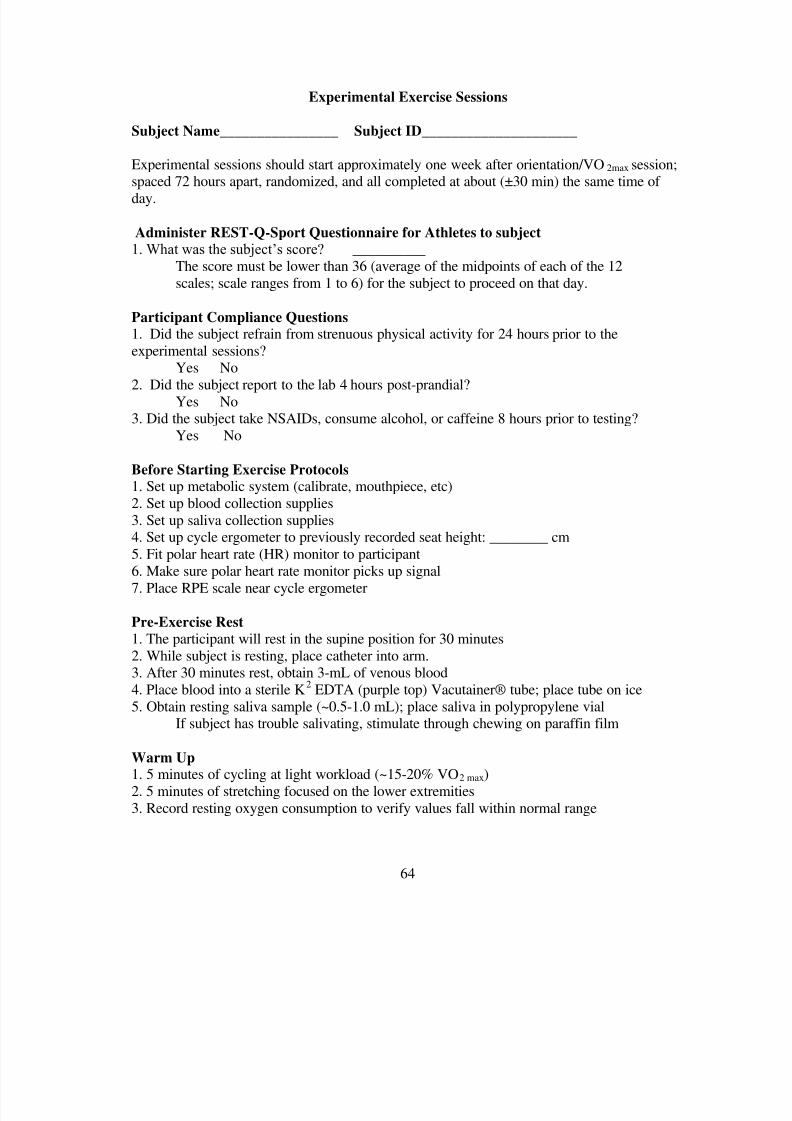
The first session served as both an orientation session and when the subjects‘
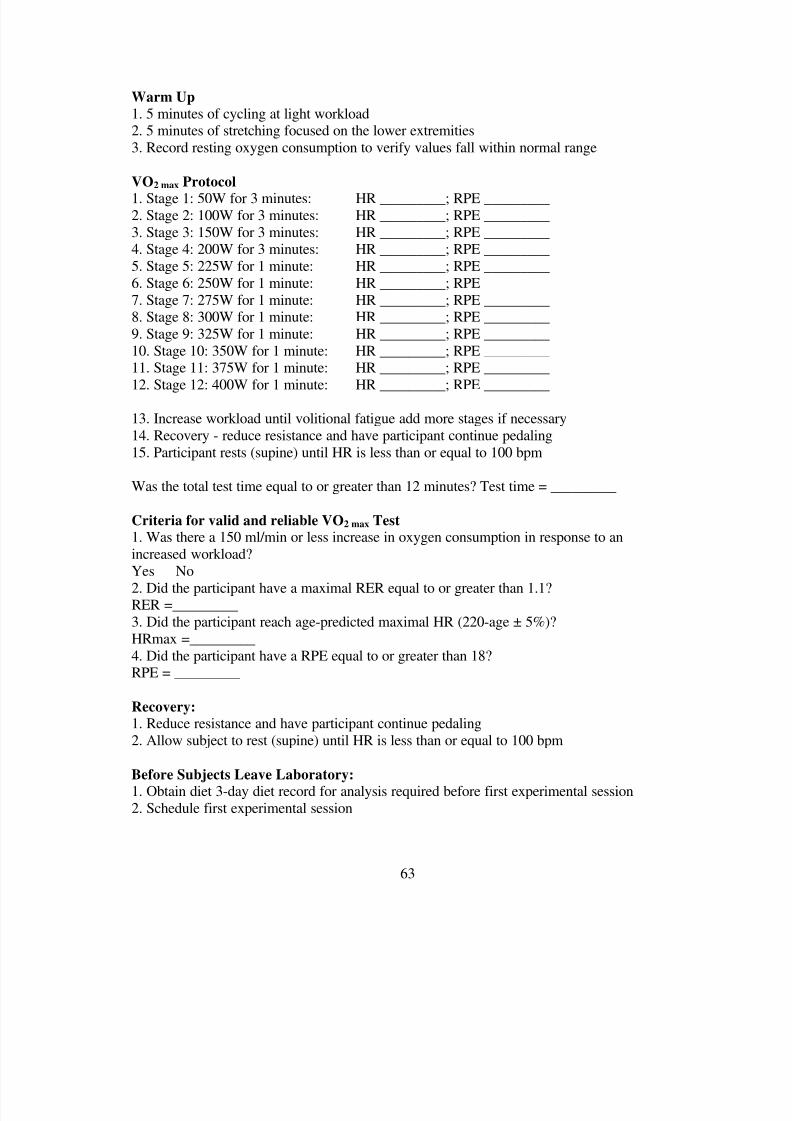
maximal oxygen uptake (VO2 max) was determined through an incremental exercise test on a
cycle ergometer using 3 minute stages. Following the initial meeting and VO2 max test, the
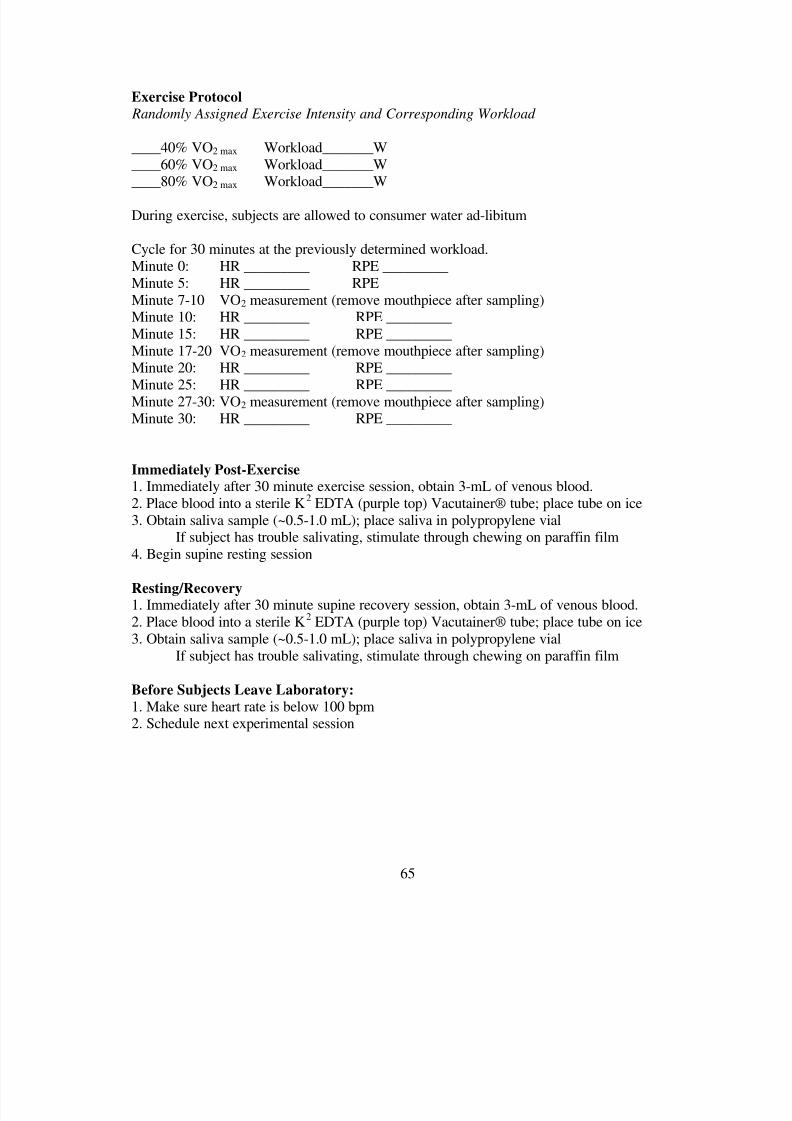
next four experimental trials consisted of a control trial, and 30 minute cycling bouts at 40%,
Trials were randomized and consisted of a 30 minute
exercise trial at 40%, 60%, or 80% of subjects‘ VO2 max, or
a 30 minute rest (control).
Page 30
8/3/2019 The Relationship Between Serum and Salivary Corti
http://slidepdf.com/reader/full/the-relationship-between-serum-and-salivary-corti 30/81
21
60%, and 80% of the subjects‘ VO2 max. All of these trials were completed at the same time of
day within each su bjects‘ trials (± 30 minutes), were in a randomized order, and each trial
was separated by a minimum of 72 hours.
Orientation/maximal oxygen consumption (VO2 max) testing session
Subjects were instructed to refrain from any physical exercise for 24 hours before
their VO2 max test. Once subjects came to the laboratory, they were briefed on the protocol
(exercise, blood collection procedures, metabolic monitoring) and were allowed to ask any
questions about the procedure before signing the informed consent form. Next, the subjects
underwent a screening process, including a blood pressure reading, a 12-lead
electrocardiogram, and a brief discussion on previous illnesses and family history of potential
problems to ensure that they could safely participate in the study. After approval for
participation, anthropometric data (age, height, weight, body fat percentage via skinfolds)
were determined for each subject.
After subject characteristics were assessed, they were instructed to warm-up on the
cycle ergometer for 5 minutes at a very light workload. At this time, the seat height was
adjusted to the optimal height and comfort. The light warm up was followed up by 5 minutes
of stretching, primarily emphasizing the torso and the lower extremities. The subject was
subsequently properly fit with a mouthpiece and oxygen uptake which was used to make sure
that the values were normal and the metabolic system was functioning properly.
The incremental exercise test began at a workload previously determined by the
sub jects‘ training history and any previous VO2 max data results reported by the subject. The
workload increased at the end of the 3 minute intervals (stages) until volitional fatigue.
Page 31
8/3/2019 The Relationship Between Serum and Salivary Corti
http://slidepdf.com/reader/full/the-relationship-between-serum-and-salivary-corti 31/81
22
Metabolic data was averaged over 15 second intervals, heart rate data was recorded every
minute, and ratings of perceived exertion (RPE) were assessed at the end of each exercise
stage. The test was considered valid and reliable if the subjects met three out of the four
criteria: a 150 ml/min or less increase in VO2 in response to an increased workload; HR at
the age predicted maximum (within 5%); a respiratory exchange ratio (RER) of 1.1 or
greater, and an RPE rating of 18 or greater (ACSM, 2000).
Exercise-control trials
Subjects reported to the laboratory on a separate day, at least 72 hours but no more
than 7 days following their initial visit. They reported to the laboratory for these tests at the
same time of day (±30 minutes) for each trial. During these testing trials, the subjects had
three blood draws performed and concurrently three saliva samples collected.
First, the subjects filled out the REST-Q questionnaire and if normal scores were
demonstrated, they began their supine resting period. After 30 minutes, pre-exercise blood
and saliva samples were taken. Next, the subject began a 5-minute warm up on the cycle
ergometer at very low intensity (approximately 15-20 % of VO2 max). Subjects were then
instructed to stretch for 5 minutes after which they mounted the cycle and began the exercise
trial. The predetermined workload was to elicit 40%, 60%, or 80% of subjects‘ VO2 max,
calculated using from the initial visit using a regression analysis predicting oxygen utilization
responses based on workload. The 20% differences in the intensities of each of the exercise
trials were chosen to prevent any potential overlap in workloads within each subjects‘
exercise trials. The workload was set beforehand, but was occasionally adjusted after the
protocol was initiated based on the subjects‘ metabolic responses. The reported workloads
Page 32
8/3/2019 The Relationship Between Serum and Salivary Corti
http://slidepdf.com/reader/full/the-relationship-between-serum-and-salivary-corti 32/81
23
were mean values calculated over the duration of the 30 minutes of exercise. The 20%
differences in the intensities of each of the exercise trials were chosen to prevent any
potential overlap in workloads within each subjects‘ exercise trials.
Heart rate was monitored every five minutes, and metabolic data was collected for
three minutes at three points (minutes 7-10, 17-20, and 27-30) during the test to verify the
workload met the prescribed intensity. After the 30 minutes of exercise at the prescribed
workload was completed, the immediate post-exercise blood and saliva samples were
collected (See Figure 4). After the blood sample was taken, subjects were allowed to
actively cool down on the cycle ergometer, followed by a resting period. After 30 minutes
recovery post-exercise, the last blood and saliva samples were collected. The subject was
allowed to leave the laboratory after their heart rate reached approximately 100 bpm. This
process was replicated for each of the exercise trials. For the resting control trial, the above
procedures were repeated, but a 30-minute rest period was substituted for the exercise. These
four trials were randomized and separated by a minimum of 72 hours.
Subject Blood Sample Blood Sample Blood Sample
Arrived Saliva Sample Saliva Sample Saliva Sample
30 min. rest 30 min. exercise 30 min. rest(supine) 5 min or rest (supine)
Warm-up Subject Left
Figure 4. Overview of typical experimental trial.
Page 33
8/3/2019 The Relationship Between Serum and Salivary Corti
http://slidepdf.com/reader/full/the-relationship-between-serum-and-salivary-corti 33/81
24
Instrumentation
The height (cm) and body mass (kg) of each of the subjects were determined using a
stadiometer (Perspectives Enterprises, Portage, MI) and a mechanical scale (Detecto, Webb
City, MO). Body fat percentage was measured in triplicate at select sites (abdomen, chest,
and thigh) using Cambridge Lange skinfold calipers (Cambridge Scientific, Cambridge, MA)
and calculated using Jackson-Pollock method (Jackson et al., 1978). Respiratory gases were
measured using a Parvo Medics TrueMax 2400 Metabolic System (Parvo Medics, Salt Lake
City, UT, USA) and all exercise (maximal and submaximal) was completed on a Lode
electronically braked ergometer (Lode, Groningen, The Netherlands). Heart rate was
monitored during the exercise using a Polar HR monitor (Polar Model F1, Finland). Ratings
of perceived exertion (RPE) were determined using Borg‘s 6-20 scale rate of perceived
exercise scale (Borg, 1970).
Specimen procedures
Collection and storage
After placement of a catheter, blood samples (3 ml) were collected using a 3-cc
syringe (Vanishpoint) and a 25 gauge needle (Retractable Technologies, Inc., TX, USA). All
samples were immediately transferred into a sterile K2
EDTA (purple top) tube (Vaccutainer)
and were kept cool by being put on ice. For each exercise intensity, pre-trial, post-trial, and
post-recovery hematocrit (Hct) were assessed in triplicate, using 75 mm microcapillary tubes
(Fisher Scientific, PA, USA) sealed with Critoseal (Krakeler Scientific, Inc., Albany, NY).
Samples were spun using the Adams MHCT II microhematocrit centrifuge (Becton
Page 34
8/3/2019 The Relationship Between Serum and Salivary Corti
http://slidepdf.com/reader/full/the-relationship-between-serum-and-salivary-corti 34/81
25
Dickinson, Franklin Lakes, NJ) for three minutes and subsequently read with a micro-
hemoatocrit reader (International Equipment Company, Needham Heights, MA).
Resting (pre-trial), post-trial, and post-recovery hemoglobin (Hb) levels were also
assessed in triplicate fashion from whole blood using the Stat-Site, WT-9‖ Hemoglobin
Meter (Stanbio Laboratory, Boerne, TX). Using the mean Hct and Hb values, the changes in
plasma volume were calculated for each trial using the Dill and Costill method (Dill &
Costill, 1974). These changes indicated the effect of exercise induced fluid shifts on cortisol
concentrations. Ultimately, the data analysis assessing serum cortisol concentrations were
uncorrected for fluid shifts were used when comparing salivary and serum collection
methods. After the initial whole blood analysis, the blood samples were spun at 3000 rpm
and 4 degrees Celsius using a refrigerated centrifuge (IEC Cenra-8R, International
Equipment Company, Needham Heights, MA) to separate plasma from erythrocytes. The
plasma was pipetted into cryo-freeze tubes and stored at -80 degrees Celsius in an ultra-
freezer (Revco Scientific, Inc., NC, USA).
Prior to collection of saliva samples, subjects were asked to rinse their mouths with
water, spit, and then allow saliva to accumulate in the pool of their mouth. If saliva
secretion needed to be stimulated, subjects were asked to chew on paraffin film.
Accumulated saliva samples (minimum of 0.5 ml necessary) were collected from the
subjects‘ mouths directly into a polypropylene cup. No more than 5 minutes past the desired
time point was allowed to pass before saliva was collected. Collected samples were stored
at -80 degrees Celsius.
Page 35
8/3/2019 The Relationship Between Serum and Salivary Corti
http://slidepdf.com/reader/full/the-relationship-between-serum-and-salivary-corti 35/81
Page 36
8/3/2019 The Relationship Between Serum and Salivary Corti
http://slidepdf.com/reader/full/the-relationship-between-serum-and-salivary-corti 36/81
27
Pearson product-moment correlations were used to assess the relationships between
serum and salivary cortisol concentrations. The ―r‖ values of the correlational analyses were
used to compare pre-trial, post-trial, and post-recovery levels at each exercise intensity (40%,
60%, and 80%) and the control trial to determine how well the two methodologies compared
at each respective time interval within subjects.
Page 37
8/3/2019 The Relationship Between Serum and Salivary Corti
http://slidepdf.com/reader/full/the-relationship-between-serum-and-salivary-corti 37/81
CHAPTER IV
RESULTS
Subject characteristics
Twelve moderate to high endurance-trained athletes participated in this investigation.
Eleven of the twelve subjects completed all aspects of the study and one subject resigned
from participation after completing two of the trials. The physical characteristics of the
subjects (n = 12), expressed as mean ± standard deviation (SD) were as follows: age (years)
= 22.0 ± 4.6; height (cm) = 174.9 ± 7.1; mass (kg) = 66.5 ± 9.5; BMI (kg/m2) = 21.6 ± 1.9;
and body fat (%) = 8.4 ± 2.1. All subjects were training for a minimum of three days per
week for 60 minutes or more in the previous six months before they began the protocol. The
subjects in the study had various backgrounds of training and sport participation, but
primarily were experienced in endurance events, including cycling and running. To be
included in the study, each of the subjects had to have a daily dietary intake consisting of at
least 50% of calories (kcal) from carbohydrates (CHO). The subjects‘ mean CHO intake was
57.9% ± 3.7%. All of the subjects reported they had adhered to the experimental guidelines
(see Methods) before the VO2max session and experimental exercise and control trials (Trials
I-IV).
Page 38
8/3/2019 The Relationship Between Serum and Salivary Corti
http://slidepdf.com/reader/full/the-relationship-between-serum-and-salivary-corti 38/81
29
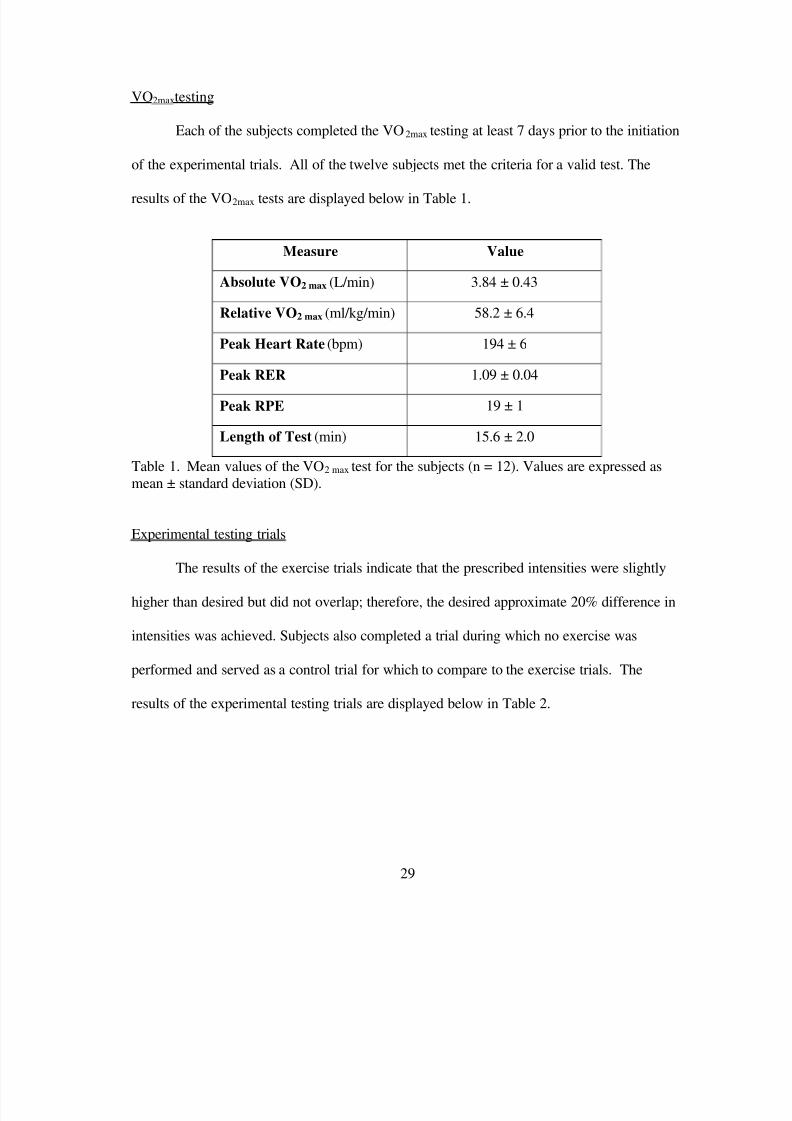
VO2maxtesting
Each of the subjects completed the VO2max testing at least 7 days prior to the initiation
of the experimental trials. All of the twelve subjects met the criteria for a valid test. The
results of the VO2max tests are displayed below in Table 1.
Measure Value
Absolute VO2 max (L/min) 3.84 ± 0.43
Relative VO2 max (ml/kg/min) 58.2 ± 6.4
Peak Heart Rate (bpm) 194 ± 6
Peak RER 1.09 ± 0.04
Peak RPE 19 ± 1
Length of Test (min) 15.6 ± 2.0
Table 1. Mean values of the VO2 max test for the subjects (n = 12). Values are expressed as
mean ± standard deviation (SD).
Experimental testing trials
The results of the exercise trials indicate that the prescribed intensities were slightly
higher than desired but did not overlap; therefore, the desired approximate 20% difference in
intensities was achieved. Subjects also completed a trial during which no exercise was
performed and served as a control trial for which to compare to the exercise trials. The
results of the experimental testing trials are displayed below in Table 2.
Page 39
8/3/2019 The Relationship Between Serum and Salivary Corti
http://slidepdf.com/reader/full/the-relationship-between-serum-and-salivary-corti 39/81
30
Measure 40% VO2 max 60% VO2 max 80% VO2 max
Workload (W) 95.0 ± 17.0 145.4 ± 18.8 181.9 ± 26.1
Heart Rate (bpm) 127 ± 14 156 ± 14 180 ± 8
VO2 (ml/kg/min) 26.3 ± 3.3 37.8 ± 4.3 49.4 ± 4.6
% VO2 max 45.3 ± 5.0 65.2 ± 7.7 85.0 ± 5.8
RPE 10 ± 2 13 ± 2 16 ± 1
Table 2. Results (average over 30 min. of exercise) of select variables measured during eachrespective exercise trial (n = 12). Values are expressed as mean ± standard deviation (SD).
Plasma volume changes
Plasma volume (PV) changes as a result of the experimental trials were calculated
from mean Hb and Hct values collected pre-trial, post-trial, and post-recovery. The greatest
mean PV shifts from pre-trial to post-trial as well as from pre-trial to post-recovery occurred
during the 80% experimental trial. Table 3 displays these changes.
Table 3. Mean Hct, Hb values for pre-trial, post-trial and post-recovery with correspondingplasma volume changes (% changes) from pre-trial to post-trial and from pre-trial to post-
recovery (n = 12). All values are expressed as mean ± standard deviation (SD).
Trial
Hct (%) Hb (g/dL) Δ Pre-
Trial toPost-Trial
Δ Pre-
Trial to
Post-
RecoveryPre Post Rec Pre Post Rec
Control 38.9 ± 0.6 39.8 ± 0.4 39.3 ± 0.4 14.1 ± 1.2 14.8 ± 1.0 14.6 ± 1.0 -6.1 ± 3.3 -4.2 ± 2.0
40% 37.7 ± 0.3 40.4 ± 0.4 39.3 ± 0.4 14.2 ± 0.9 15.3 ± 0.9 14.5 ± 0.9 -11.1 ± 4.2 -5.1 ± 4.4
60% 38.2 ± 0.3 41.0 ± 0.3 39.8 ± 0.4 14.0 ± 1.0 14.8 ± 0.7 14.5 ± 0.8 -10.4 ± 4.4 -6.1 ± 5.0
80% 38.1 ± 0.4 41.2 ± 0.4 39.9 ± 0.4 14.1 ± 0.9 15.5 ± 1.5 14.8 ± 0.9 -14.2 ± 5.6 -8.0 ± 4.0
Page 40
8/3/2019 The Relationship Between Serum and Salivary Corti
http://slidepdf.com/reader/full/the-relationship-between-serum-and-salivary-corti 40/81
31
Cortisol analysis
The mean (± SD) serum and salivary cortisol responses to the different experimental
trials analyzed at the three respective sampling time points are highlighted in Tables 4 and 5.
These hormonal values were not corrected for PV changes.
Serum cortisol
Table 4. Mean serum cortisol concentrations for each respective experimental trial (n=12).Values are expressed as mean ± standard deviation (SD).
*Significant difference from respective pre-trial (p < 0.05).
**Significant difference from respective post-trial (p < 0.05).
Control/resting trial: For the control/resting trial, serum cortisol concentrations
decreased slightly during the first 30 minutes of rest and then increased slightly during the
last 30 minutes of rest. However, these changes were not significant.
40% VO2 max exercise trial: The cortisol concentrations decreased from pre-trial to
post-trial and also decreased from post-trial to post-recovery. However, these changes were
not significant.
60% VO2 max exercise trial: Cortisol concentrations increased slightly from pre-trial to
post-trial, but these changes were not significant. However, from post-trial to post-recovery,
Trial Serum Cortisol Concentrations (µg/dL)
Pre-Trial Post-Trial Post-Recovery
Control 12.2 ± 5.4 9.8 ± 4.3 10.5 ± 4.9
40% VO2 max 14.3 ± 7.0 13.8 ± 6.0 10.9 ± 4.3
60% VO2 max 14.0 ± 4.5 16.2 ± 5.1 11.1 ± 5.1**
80% VO2 max 12.2 ± 4.4 20.5 ± 6.7* 20.5 ± 7.8*
Page 41
8/3/2019 The Relationship Between Serum and Salivary Corti
http://slidepdf.com/reader/full/the-relationship-between-serum-and-salivary-corti 41/81
32
cortisol responses decreased by 31.2% (p = 0.006). The peak cortisol response in this trial
occurred at the post-trial sampling time.
80% VO2 max exercise trial: Cortisol responses increased significantly from pre-trial to
post-trial (p ≤ 0.001) as well from pre-trial to post-recovery (p ≤ 0.001). These significant
increases represented identical 40.4% elevations from pre-trial concentrations at each of the
respective time intervals (post-trial and post-recovery). The peak cortisol response in this
trial was at the post-trial sampling time (i.e. when concentrations were expressed to the
second decimal place); although there was no difference between mean values at post-trial
and post-recovery sampling times.
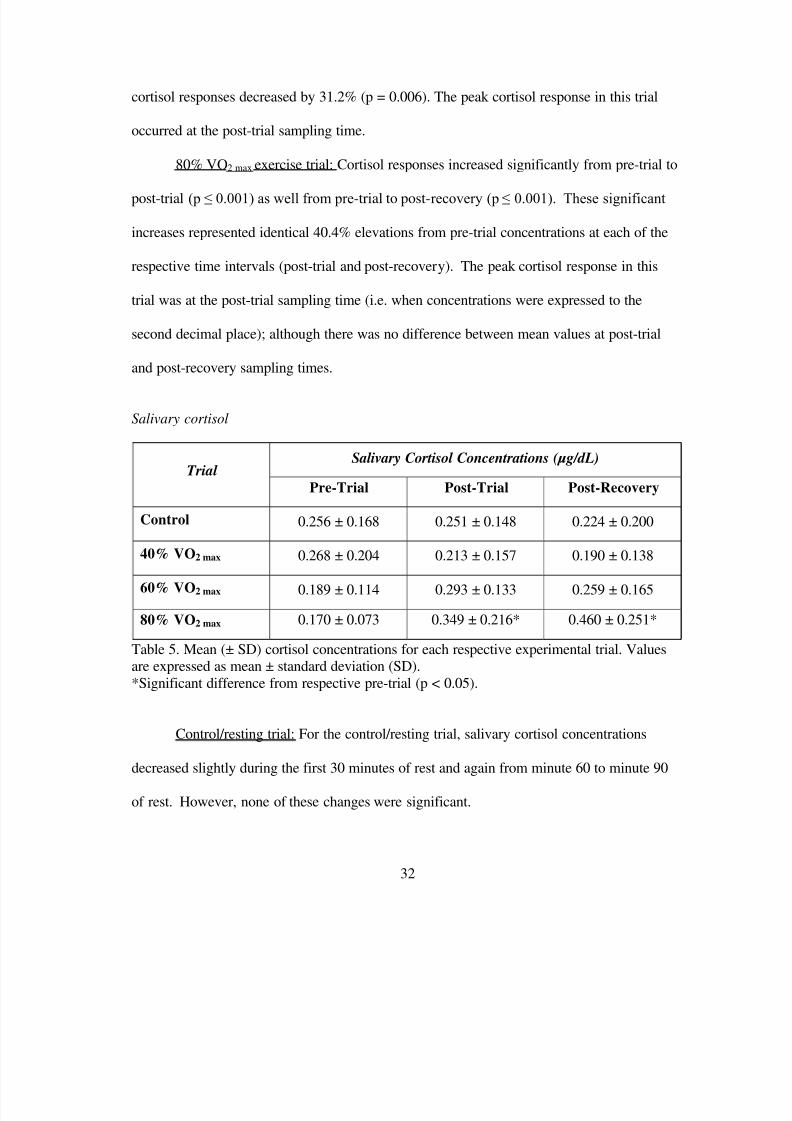
Salivary cortisol
Table 5. Mean (± SD) cortisol concentrations for each respective experimental trial. Valuesare expressed as mean ± standard deviation (SD).
*Significant difference from respective pre-trial (p < 0.05).
Control/resting trial: For the control/resting trial, salivary cortisol concentrations
decreased slightly during the first 30 minutes of rest and again from minute 60 to minute 90
of rest. However, none of these changes were significant.
Trial Salivary Cortisol Concentrations (µg/dL)
Pre-Trial Post-Trial Post-Recovery
Control 0.256 ± 0.168 0.251 ± 0.148 0.224 ± 0.200
40% VO2 max 0.268 ± 0.204 0.213 ± 0.157 0.190 ± 0.138
60% VO2 max 0.189 ± 0.114 0.293 ± 0.133 0.259 ± 0.165
80% VO2 max 0.170 ± 0.073 0.349 ± 0.216* 0.460 ± 0.251*
Page 42
8/3/2019 The Relationship Between Serum and Salivary Corti
http://slidepdf.com/reader/full/the-relationship-between-serum-and-salivary-corti 42/81
33
40% VO2 max exercise trial: The cortisol concentrations in the saliva in this trial were
very similar to the responses during the control trial. Levels decreased slightly immediately
post-trial and again dropped slightly from post-trial to post-recovery. Once again, none of
these changes in salivary cortisol levels were significant.
60% VO2 max exercise trial: Cortisol concentrations in the saliva in this trial mirrored
the responses of those in the serum during the same experimental trial, but were not as
robust. Responses increased slightly from pre-trial to post-trial and again from post-trial to
post-recovery. However, none of these salivary changes were significant. The peak cortisol
response in this trial occurred at the post-trial sampling time.
80% VO2 max exercise trial: During the 80% trial, salivary cortisol responses increased
significantly from pre-trial to post-trial (p = 0.01) and also from pre-trial to post-recovery (p
≤ 0.001). No other significant changes were noted. The peak cortisol response in this trial
occurred at the post-recovery sampling time.
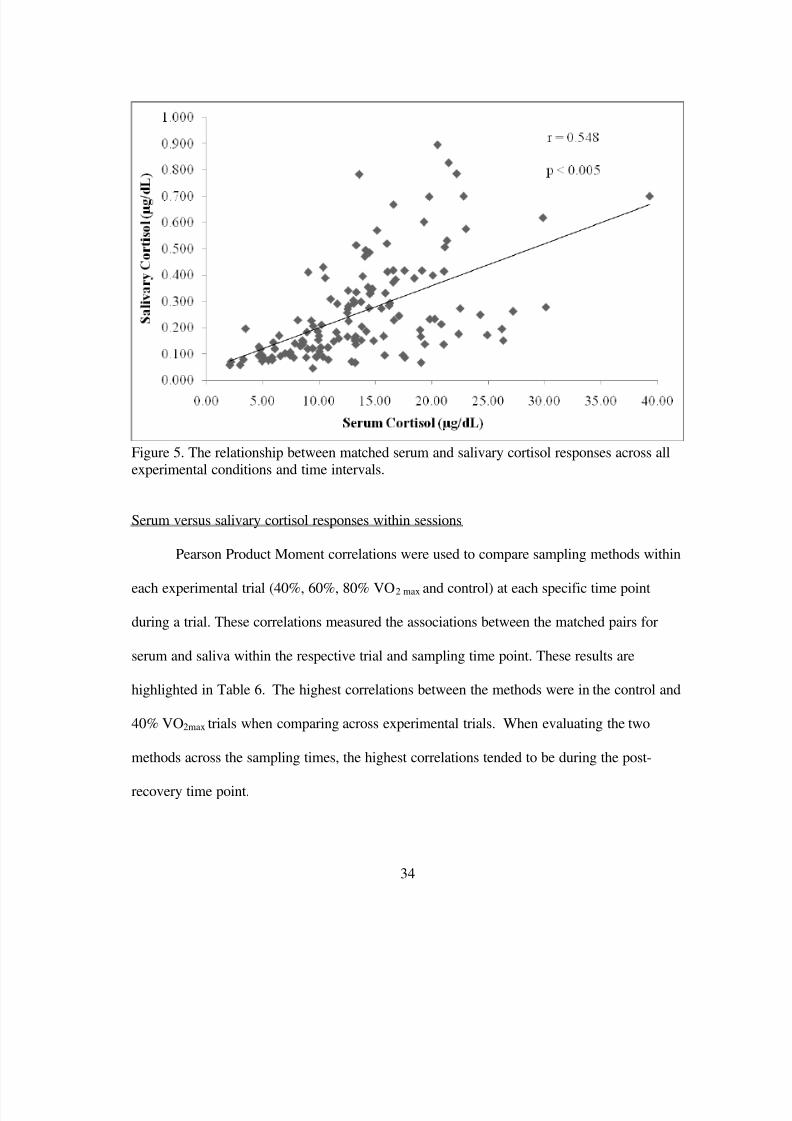
Cumulative serum versus salivary cortisol responses
To determine how well serum-saliva concentrations tracked, a composite correlation
analysis (Pearson Product Moment) was used to assess the aggregate relationship between
the two sampling methodologies. Figure 5 displays this relationship, where the correlation
coefficient for the two methods was r = 0.548, which was significant (p < 0.005).
Page 43
8/3/2019 The Relationship Between Serum and Salivary Corti
http://slidepdf.com/reader/full/the-relationship-between-serum-and-salivary-corti 43/81
34
Figure 5. The relationship between matched serum and salivary cortisol responses across all
experimental conditions and time intervals.
Serum versus salivary cortisol responses within sessions
Pearson Product Moment correlations were used to compare sampling methods within
each experimental trial (40%, 60%, 80% VO2 max and control) at each specific time point
during a trial. These correlations measured the associations between the matched pairs for
serum and saliva within the respective trial and sampling time point. These results are
highlighted in Table 6. The highest correlations between the methods were in the control and
40% VO2max trials when comparing across experimental trials. When evaluating the two
methods across the sampling times, the highest correlations tended to be during the post-
recovery time point.
Page 44
8/3/2019 The Relationship Between Serum and Salivary Corti
http://slidepdf.com/reader/full/the-relationship-between-serum-and-salivary-corti 44/81
35
Table 6. Pearson Product Moment correlation coefficients for serum vs. salivary cortisolconcentrations for each respective experimental trial.
*Indicates significant correlations (p < 0.05)
Trial Pearson Product Moment Correlation Coefficients
Pre-Trial Post-Trial Post-Recovery
Control r = 0.627* r = 0.797* r = 0.476
40% VO2 max r = 0.826* r = 0.591* r = 0.706*
60% VO2 max r = 0.103 r = 0.351 r = 0.644*
80% VO2 max r = 0.047 r = 0.053 r = 0.426
Page 45
8/3/2019 The Relationship Between Serum and Salivary Corti
http://slidepdf.com/reader/full/the-relationship-between-serum-and-salivary-corti 45/81
CHAPTER V
DISCUSSION
Introduction
The primary purpose of this study was to investigate the associations between serum
and salivary cortisol responses at three different exercise intensities (40%, 60%, and 80% of
VO2 max), to determine if salivary concentrations could be an accurate method to assess the
body‘s response to exercise. The hypothesized outcome was that there would be significant
correlations between the serum and salivary cortisol levels at all sampling times. It was also
expected that the peak salivary cortisol response when compared to the peak serum response
within the 60% and 80% exercise trials would occur at a later sampling time. This was
predicted since the movement of free cortisol from the capillaries into the saliva is passive;
thus, the peak response of the hormone due to the exercise was expected to be delayed
compared to the peak responses in serum concentrations.
The discussion in this chapter is organized into several sections. First, there is a
discussion about the subjects‘ physiological responses to the exercise trials, focusing on the
how close the subjects were to the desired exercise intensities. Second, both the subjects‘
serum and salivary cortisol responses are discussed, analyzing how they compared to other
related exercise studies. Third, there is a discussion of how the associations between the
methods compared to previous studies which evaluated the relationship between these
methods. Fourth, the peak responses of cortisol in the moderate and high intensity trials are
Page 46
8/3/2019 The Relationship Between Serum and Salivary Corti
http://slidepdf.com/reader/full/the-relationship-between-serum-and-salivary-corti 46/81
37
compared and addressed. Finally, limitations and conclusions of the present study are
discussed.
Exercise responses
As highlighted in Table 2, the exercise trials produced the desired physiological
responses from the subjects. A regression equation was used to predict the workload that
would bring about the prescribed intensities and the workload was adjusted at 10 minutes
and/or 20 minutes into the trial if the VO2 responses were higher or lower than what was
stipulated. Ultimately, the average intensities over the 30 minutes of exercise were slightly
higher than what was predicted, 45.3 ± 5.0%, 65.2 ± 7.7%, and 85.0 ± 5.8%, respectively.
However, none of the responses overlapped. This was also apparent when looking at the
heart rates (95 ± 17 bpm, 145 ± 19 bpm, and 182 ± 26 bpm, respectively), and RPE values
reported by the subjects during the trials (10 ± 2, 13 ± 2, and 16 ± 1, respectively). These
findings suggest the desired effect for the experimental exercise protocol was achieved.
Hematocrit and hemoglobin values were measured within each blood sample in order to
calculate plasma volume shifts (Dill & Costill, 1974). These hematological measures were
assessed to determine if the subjects were well hydrated at the start of each trial for each of
the experimental trials and normal hemodynamic responses to exercise occurred. Results
support that all subjects were adequately hydrated and their fluid responses to exercise were
normal and in agreement with the literature (Hagen et al. 1980).
Page 47
8/3/2019 The Relationship Between Serum and Salivary Corti
http://slidepdf.com/reader/full/the-relationship-between-serum-and-salivary-corti 47/81
38
Cortisol responses
Serum
All serum values were within the normal expected range of values for the all the
respective measurement times and experimental trials (Siemens Health Care, USA). During
the control and the 40% exercise trials, serum cortisol responses decreased from pre-trial
levels both immediately after rest or exercise as well as at the post-recovery from rest or
exercise. The decrease in cortisol during the rest of the control trial is reflective of the
normal circadian pattern for cortisol (Kerrigan et al., 1993). The 40% exercise trial results
are consistent with previous studies analyzing the threshold-intensity effect. That is, while
there are some divergent findings, most literature has supports a ~60% exercise intensity
threshold is necessary to elicit a significant increase in blood cortisol (Davies & Few, 1973;
Hill et al., 2008).
During the 60% exercise trial, cortisol responses did not significantly increase as was
expected (Davies & Few, 1973). While levels were elevated by 16% compared to pre-trial
levels, the increase was not significant at this intensity. This may be explained by the high
aerobic fitness level (>50 ml/kg/min) of the subjects. Persons who are highly trained tend to
have a higher intensity threshold to provoke an increase in cortisol (Bloom et al., 1973; Viru
& Viru, 2004).
Another unexpected finding during the 60% trial was that the cortisol responses
significantly decreased from post-trial to post-recovery. Levels were expected to decrease in
the serum during recovery, but it was projected that the levels would not significantly drop to
below those measured before the exercise. Why this change occurred is unclear, but it could
Page 48
8/3/2019 The Relationship Between Serum and Salivary Corti
http://slidepdf.com/reader/full/the-relationship-between-serum-and-salivary-corti 48/81
39
reflect the circadian pattern of cortisol secretion and/or a natural decline in the hormonal
levels as a function of feedback regulation (Few et al., 1970; Kerrigan et al., 1993).
During the 80% trial, cortisol responses significantly increased from rest (pre-trial)
and remained elevated during the 30 minute recovery from the exercise trial. This finding
concurs with several studies which used similar designs to the present study (Bloom et al.,
1973; Davies & Few, 1973; Hill et al., 2008). This prolonged elevation in cortisol during the
recovery period has been previously found following intensive, stressful exercise and
demonstrates hormonal changes can last well past the cessation of exercise (Daly et al.,
2004).
Saliva
All saliva values were within the normal expected range of values for the all the
respective measurement times and experimental trials (Salimetrics, USA). For the control
session and the 40% exercise trial, salivary cortisol responses followed the same trend as
serum cortisol; that is, levels decreased from pre-trial to post-trial and remained depressed
after the 30 minute recovery trial. However, these changes were not significant. For the
60% trial, levels did not significantly increase from that of the pre-trial measurement.
Despite an average increase of 35% in the 60% trial, the increase was not significant due to
the high variability of responses within the subjects. Levels still remained elevated (23%) at
post-recovery compared to pre-trial unlike the significant decrease evident in the serum
concentrations within this trial.
The intensity-threshold effect was clear in the 80% exercise trial as levels
significantly increased from pre-trial to post-trial. This is in agreement with previous studies
Page 49
8/3/2019 The Relationship Between Serum and Salivary Corti
http://slidepdf.com/reader/full/the-relationship-between-serum-and-salivary-corti 49/81
40
using saliva sampling assessing cortisol responses to varying exercise intensities. For
example, Jacks and colleagues demonstrated the threshold-intensity effect in salivary cortisol
utilizing 3 different exercise intensities (mean intensities of 44.5 %, 62.3, and 76.0 %).
During the highest-intensity exercise session, cortisol was significantly higher after the
exercise session (p = 0.004) compared to baseline (Jacks et al., 2002). Kivlighan and
colleagues also used saliva as the sampling specimen for obtaining cortisol responses to the
anticipation of a competitive (high intensity) exercise session as well as during the recovery
period after the exercise. Levels significantly increased from baseline in all groups
(competitive and non-competitive males and females) after the exercise session (Kivlighan et
al., 2005).
Some studies employing resistance exercise have also demonstrated significant
increases in cortisol responses measured in the saliva. For example, McGuigan and
colleagues found that high intensity (75%) resistance exercise resulted in significant (p <
0.05) increases in salivary cortisol compared to resting levels. Low intensity resistance
exercise (30%) did not result in any significant increases (McGuigan et al., 2003). Also,
Paccotti and colleagues found that there was a significant increase (p < 0.05) in salivary
cortisol levels in competitive athletes immediately after an acute bout of high intensity
resistance training. Cortisol levels also remained significantly elevated at 90 and 120
minutes after termination of the exercise (Paccotti et al., 2005).
The unique response in the present study was salivary concentrations were highest
(and possibility still increasing) after 30 minutes of recovery from the 80% trial. This was
evidenced by 31% higher average concentrations comparing post-trial to post-recovery. This
finding is divergent from that of Jacks et al. who also used recovery sampling as part of their
Page 50
8/3/2019 The Relationship Between Serum and Salivary Corti
http://slidepdf.com/reader/full/the-relationship-between-serum-and-salivary-corti 50/81
41
experimental design in measuring cortisol in saliva and found cortisol levels remained
elevated from rest after 20 minutes of recovery from a 60 minute exercise bout on a cycle
ergometer, but were still slightly lower than levels measured immediately post-exercise
(Jacks et al., 2002). The relatively long exercise duration of 60 minutes of this latter study
may have allowed sufficient time for the diffusion of the free cortisol levels into the saliva
during the recovery. Thus, there was not as great a potential for a temporal lag between
responses. The present study utilized a shorter exercise duration which may have been an
inadequate amount of time for saliva levels to completely reflect the blood levels (Ben-Aryeh
et al., 1989).
Comparison of serum to salivary cortisol
The composite correlation coefficient between serum and saliva cortisol was 0.548,
which was significant (p < 0.005). This relationship is displayed in Figure 7. The high level
of significance can be partially attributed to the large sample size (n = 135). While this is a
moderate correlation and it appears the two methods track well, this correlation coefficient
was lower than what was expected based on previous literature. Kirschbaum and colleagues‘
reported correlation coefficients between cortisol in saliva and cortisol in serum ranging from
r = 0.71 to r = 0.96 (Kirschbaum et al., 1994). Umeda and Iwaoka‘s investigation also
reported a strong correlation coefficient of r = 0.893 (n = 10; p < 0.001) between serum and
saliva, which was significant considering the small sample size Umeda & Iwaoka, 1981).
Goodyer and colleagues also found correlations that were significant (r = 0.81; p < 0.005) but
had a large sample size (n =284) which may have contributed to the relationship (Goodyer et
al., 2001). However, Gonzansky and colleagues yielded results with less robust correlations,
Page 51
8/3/2019 The Relationship Between Serum and Salivary Corti
http://slidepdf.com/reader/full/the-relationship-between-serum-and-salivary-corti 51/81
42
with a coefficient between serum and saliva cortisol of r = 0.60, which was significant
(Gonzansky et al., 2005).
The primary difference between the present study and these previous studies are the
means of stimulation of the HPA axis. Many of the above studies measured cortisol levels in
a resting state and not using exercise as a stressor. For example, in Umeda and Iwaoka‘s
(1981) investigation, instead of using exercise as a stimulus to the HPA axis, they used
ACTH stimulation to elevate levels of cortisol (Umeda & Iwaoka, 1981). Since there is more
variance using exercise as a stressor to the HPA axis compared to synthetic augmentation
(Paccotti et al., 2007), this may partially explain the difference in the strength of the
associations between this study and the present study.
Comparison of serum and salivary cortisol during exercise
A major aim of this study was to evaluate the relationship between serum and salivary
cortisol responses to 30 minutes of exercise of different intensities at different sampling
times. To assess this outcome, correlations for each of the respective trials (control, 40%,
60%, 80%) and sampling times (pre-trial, post-trial, and post-recovery) were used to gauge
how well the methods were associated with one another. Table 6 lists each of the
correlations and indicates which correlations are significant within a particular experimental
trial.
Pre-trial concentrations were highly correlated before the control trial as well as the
40% trial. However, correlations were very weak at the same time point for the 60% and
80% trial, which was unexpected. All pre-trial resting cortisol levels were expected to be
correlated based upon the studies discussed in the section above. This finding of low
Page 52
8/3/2019 The Relationship Between Serum and Salivary Corti
http://slidepdf.com/reader/full/the-relationship-between-serum-and-salivary-corti 52/81
43
correlations for the 60% and 80% trials at rest is difficult to explain. Methodological flaws
in the assay procedures are not a likely factor. All assay coefficients of variation (CV) were
at less than 10% for serum and saliva determinations. Also, all assay quality control
standards were within acceptable ranges of variance (5-10%). At this time, no explanation
for the lack of significant correlations at rest in the 60% and 80% trial can be given.
Post-trial hormone levels were significantly correlated within the control, 40% and
60% trials but not in the 80% trial. The lack of association between the serum-saliva
specimens after highest intensity exercise trial was anticipated, and may be due to the
proposed diffusion rate differences between the blood-saliva at higher hormonal
concentrations (Ben-Aryeh et al., 1989; Vining et al., 1983). The significant correlations
immediately after exercise agree with some previous studies. For example, Thomasson and
colleagues compared plasma and saliva hormones in response to exercise, but only measured
cortisol response to an exercise intensity of 50-55% VO2 max. There were significant
correlations (p < 0.05) at rest; but the correlations measured throughout the steady-state
exercise bout were low to moderate (r = 0.35), although still significant (p < 0.02)
(Thomasson et al., 2009). Also, Cadore and colleagues found that correlation between serum
and salivary cortisol responses after resistance exercise were somewhat stronger (r = 0.62, p
= 0.001) than reported here. However, this resistance exercise was of an undefined intensity;
therefore, it is difficult to make valid comparisons to the present study (Cadore et al., 2008).
In the present study, the post-recovery levels tended to have higher correlations
across all of the experimental trials when compared to the other sampling time points.
However, only the 40% (r = 0.706) and 60% (r = 0.644) trials were at a significant level,
whereas after the 30 minute recovery, the control and 80% correlations only approached
Page 53
8/3/2019 The Relationship Between Serum and Salivary Corti
http://slidepdf.com/reader/full/the-relationship-between-serum-and-salivary-corti 53/81
44
significance (p = 0.10-0.15). Few studies have examined the relationship between serum-
saliva cortisol concentrations during the recovery from exercise. Neary and colleagues
compared serum and saliva concentrations one day into the recovery from an exercise
training session and found that serum and saliva concentrations were highly associated, r =
0.99 (Neary et al., 2002). However, the long recovery period (1 day) was significantly more
time than the present study (30 minutes), which make comparisons between the two studies
somewhat problematic. The lack of significance between the serum-saliva measurements
after the 30 minute recovery from the 80% trial is likely due to the fact that salivary
concentrations were still increasing compared to the leveling off seen in the serum. The lack
of a significant correlation in the recovery from the 80% trial may be evidence for the
hypothesized diffusion rate differences between salivary cortisol responses compared to
serum responses.
Peak responses
When comparing peak responses in serum and saliva in the 60% trial, both occurred
immediately after the exercise, meaning that the mean responses mirrored each other even
though the concentrations were not significantly correlated at this sampling time. This was
different than what was hypothesized because it was predicted that concentrations in the
saliva would peak at a later time point (post-recovery) in this trial compared to serum. This
may be explained by the fact that since cortisol responses were not significantly augmented
with either sampling technique during the 60% trial, the magnitude of increase was not large
enough to elicit a delay in the response of the saliva compared to serum.
In the 80% trial, the peak response occurred at a later time point (post-recovery) when
saliva was compared to serum (post-trial). This is in agreement with the second research
Page 54
8/3/2019 The Relationship Between Serum and Salivary Corti
http://slidepdf.com/reader/full/the-relationship-between-serum-and-salivary-corti 54/81
45
hypothesis and supports that salivary cortisol responses may be delayed due to the passive
movement of the hormone from the blood into the saliva (Ben-Aryeh et al., 1989). This
delayed response may be due to the lack of blood flow during exercise to the mouth area (i.e.
salivary glands) where saliva is produced. Blood is shunted to the working skeletal muscle
during exercise. The reduced blood flow at the mouth could decrease the cortisol available to
cross from the capillaries to the saliva through the passive diffusion process. However, once
the exercise is complete, the blood is steadily redistributed from the muscle to the rest of the
body (Brooks et al., 2000). During recovery from exercise the amount of blood flow to the
mouth would slowly return to normal, thereby increasing the amount of free cortisol
available to diffuse from the blood into the saliva. This delayed response accentuates the
need to include sampling during the recovery from intense exercise when assessing salivary
cortisol responses since peak salivary levels occur at a later time point than in serum for the
80% high intensity exercise.
Limitations of study
There are potential limitations and confounding factors in this investigation which
may have impacted the results and potentially limit the reliability and validity of the findings.
First, both small sample size (n = 12) and the demographics of the subjects (trained male
athletes 18-30 years of age) make it difficult to generalize the findings to other populations.
Second, some subjects completed their trials in the morning while others completed their
trials in the afternoon, potentially causing differing responses between subjects; although,
each respective subject did consistently replicate the time of day for each of their trials.
Third, the researchers relied on the truthfulness of the subjects in providing background
Page 55
8/3/2019 The Relationship Between Serum and Salivary Corti
http://slidepdf.com/reader/full/the-relationship-between-serum-and-salivary-corti 55/81
46
information and adhering to experimental compliance procedures, including: medical
information, training history, dietary records, acute training (no strenuous exercise in the 24
hours prior to the trials), diet (4 hours post prandial, and no alcohol, NSAIDs, or caffeine in
the previous 8 hours) and stress states (forthright answers in the REST-Q questionnaire).
Inaccuracies in the information and/or procedures may have introduced systematic error into
the study and confounded outcomes.
The collection of samples of serum and saliva may have also introduced error into
study. The drawback of blood sampling is that venipuncture can elicit stressful responses
that could lead to rapidly elevated blood cortisol levels. This ‗white-coat‘ effect cannot be
disregarded if testing is carried out where both the testing situation and personnel are
unfamiliar and in situations where subjects remain in anticipation of the venipuncture
(Levine et al. 2007). Although in the present study, subjects rested for 30 minutes before the
first blood sample was taken as well as experienced the procedure on four separate occasions,
which might have mitigated some of this effect. Finally, the sampling procedure for saliva
can be problematic. Saliva which is provided after eating or drinking substances with low
pH interferes with assay results; although, the current subjects were supposed to have been 4
hours post-prandial as noted above. Also, the presence of blood in saliva due to oral lesions
can affect salivary assay results (Schwartz & Granger, 2004). The current subjects did not
have their mouths inspected prior to saliva collections to determine if this could have been a
problem. The researcher tried to control all of these factors through sufficient planning,
dialogue with the subjects, and collection in controlled environment; nonetheless, errors and
oversights may still have occurred.
Page 56
8/3/2019 The Relationship Between Serum and Salivary Corti
http://slidepdf.com/reader/full/the-relationship-between-serum-and-salivary-corti 56/81
47
Summary
The present study is one of the only studies comparing serum and saliva cortisol
levels at varying exercise intensities and recovery from exercise. Collectively, the results
suggest salivary measurements of cortisol can, in some circumstances mirror those in serum
in response to exercise. However, the present data do not support that salivary cortisol and
serum cortisol perfectly track one another at different intensities of exercise.
As the saliva cortisol measurement method becomes more established, it may prove
to be very beneficial to the field of sports physiology. Assessing cortisol allows for the
opportunity to collect the samples without medical personnel, it minimizes stress in the
collection process, permits frequent and rapid sampling, and facilitates sampling in a variety
of environments. These advantages are specifically relevant for athletes, since practice and
competitions take place outside of the laboratory environment.
Page 57
8/3/2019 The Relationship Between Serum and Salivary Corti
http://slidepdf.com/reader/full/the-relationship-between-serum-and-salivary-corti 57/81
CHAPTER VI
SUMMARY, CONCLUSIONS AND RECOMMENDATIONS
Despite the limitations of this study, there are many insights that can be gained from
the findings. When analyzing specific intensities and time points, correlations between the
serum-saliva sampling techniques were significant after recovery from exercise at 40% and
60% of VO2 max. The intensity threshold effect was evident in both sampling methods during
the 80% intensity, suggesting that salivary concentrations are similar to serum comparing
across subjects. Finally, there was evidence for a hypothesized delay in the peak levels
measured in the saliva after recovery from the high intensity (80%) trial. However, there
needs to be more research completed on this topic, utilizing more subjects and perhaps
introducing a longer period of recovery into the experimental protocol, especially during high
intensity exercise. Nonetheless, the findings of this study suggest that salivary measurement
of cortisol may be a viable option for assessing this hormone as long as research personnel
are aware of sources of variance and differences from serum sampling.
Salivary cortisol sampling may be preferable to serum. Since cortisol is a stress
hormone, measuring this hormone from blood sampling introduces stress in the sampling
process itself, which is potentially a major confounding factor (Levine et al., 2007).
Collection of saliva, on the other hand, is less invasive, is much easier than setting up the
blood draws and requiring a phlebotomist to be present. However, particularly when using
this sampling technique in exercise studies, being aware of confounding factors and sources
Page 58
8/3/2019 The Relationship Between Serum and Salivary Corti
http://slidepdf.com/reader/full/the-relationship-between-serum-and-salivary-corti 58/81
49
of variance is crucial when drawing conclusions. Monitoring levels of this hormone
throughout and between training cycles may lend insight into the stress that an exercise
program provides and may enlighten coaches, athletes, and research personnel to the optimal
stimuli to promote adaptation to training.
Conclusions
Research hypothesis #1: There will be significant correlations between serum and
salivary cortisol concentrations at the pre-trial, post-trial, and post-recovery sampling time
within each of the experimental trials (control, 40%, 60% and 80% VO2 max exercise). This
hypothesis was rejected since only 6 of the 12 correlations were significant.
Research hypothesis #2: The peak saliva cortisol response when compared to the
peak serum response within the 60% and 80% exercise trials will occur at a later sampling
time. This hypothesis was rejected for the 60% exercise, but accepted for the 80% exercise .
Both the serum and saliva peak responses occurred immediately post-trial in the 60%
exercise trial, which did not support the research hypothesis. However, in the 80% exercise,
trial, the peak response for salivary cortisol occurred during a later sampling time (30
minutes; post-recovery) than with serum (post-trial), which agreed with the research
hypothesis.
Page 59
8/3/2019 The Relationship Between Serum and Salivary Corti
http://slidepdf.com/reader/full/the-relationship-between-serum-and-salivary-corti 59/81
50
APPENDICES
A. Medical and training history
B. Physical screening
C. Informed consent form
D. Data collection sheets
E. Assay information
The forms and information in Appendix A and Appendix B are a copyright of the University
of North Carolina-Chapel Hill Department of Exercise and Sport Science (EXSS).
Page 60
8/3/2019 The Relationship Between Serum and Salivary Corti
http://slidepdf.com/reader/full/the-relationship-between-serum-and-salivary-corti 60/81
51
APPENDIX A
MEDICAL HISTORY
Department of Exercise and Sport Science
Medical History
Subject: __________________________ ID: ___________ Telephone:______________
Address:________________________________________________________________
Occupation:___________________________________ Age:______________________
YES NOPatient History
1. How would you describe your general health at present?
Excellent______ Good_______ Fair______ Poor______2. Do you have any health problems at the present time? _____ _____
3. If yes, please describe:
4. Have you ever been told you have heart trouble? _____ _____5. If yes, please describe:
6. Do you ever get pain in your chest? _____ _____7. Do you ever feel light-headed or have you ever fainted? _____ _____
8. If yes, please describe:
9. Have you ever been told that your blood pressure has been elevated? _____ _____10. If yes, please describe:
11. Have you ever had difficulty breathing either at rest or with exertion? _____ _____
12. If yes, please describe:
13. Are you now, or have you been in the past 5 years, under a doctor‘s care for any reason?
_____ _____14. If yes for what reason?
15. Have you been in the hospital in the past 5 years? _____ _____
16. If yes, for what reason?
17. Have you ever experienced an epileptic seizure or been informed that you have epilepsy?
_____ _____18. Have you ever been treated for infectious mononucleosis, hepatitis, pneumonia, or
another infectious disease during the past year? _____ _____
19. If yes, name the disease:
Page 61
8/3/2019 The Relationship Between Serum and Salivary Corti
http://slidepdf.com/reader/full/the-relationship-between-serum-and-salivary-corti 61/81
52
20. Have you ever been treated for or told you might have diabetes? _____ _____
21. Have you ever been treated for or told you might or low blood sugar? _____ _____22. Do you have any known allergies to drugs? _____ _____
23. If so, what?
24. Have you ever been ―knocked-out‖ or experienced a concussion? _____ _____25. If yes, have you been ―knocked-out‖ more than once? _____ _____
26. Have you ever experienced heat stroke or heat exhaustion? _____ _____
27. If yes, when?
28. Have you ever had any additional illnesses or operations? (Other than childhood
diseases) _____ _____
29. If yes, please indicate specific illness or operations:
30. Are you now taking any pills or medications? _____ _____
31. If yes, please list:
32. Have you had any recent (within 1 year) difficulties with your:
a. Feet _____ _____b. Legs _____ _____
c. Back _____ _____
Family History
33. Has anyone in your family (grandparent, father, mother, and/or sibling) experienced any
of the following?a. Sudden death _____ _____
b. Cardiac disease _____ _____
c. Marfan‘s syndrome _____ _____
Mental History
34. Have you ever experienced depression? _____ _____
35. If yes, did you seek the advice of a doctor? _____ _____
36. Have you ever been told you have or has a doctor diagnosed you with panic disorder,obsessive-compulsive disorder, clinical depression, bipolar disorder, or any other
psychological disease? _____ _____
37. If yes, please list condition and if you are currently taking any medication.Condition Medication
Bone and Joint History
34. Have you ever been treated for Osgood-Schlatter‘s disease? _____ _____
35. Have you ever had any injury to your neck involving nerves orvertebrae? _____ _____
Page 62
8/3/2019 The Relationship Between Serum and Salivary Corti
http://slidepdf.com/reader/full/the-relationship-between-serum-and-salivary-corti 62/81
53
36. Have you ever had a shoulder dislocation, separation, or other injury of the shoulder that
incapacitated you for a week or longer? _____ _____37. Have you ever been advised to or have you had surgery to correct a shoulder condition?
_____ _____
38. Have you ever experienced any injury to your arms, elbows, or wrists?_____ _____
39. If yes, indicate location and type of injury:
40. Do you experience pain in your back? _____ _____
41. Have you ever had an injury to your back? _____ _____42. If yes, did you seek the advice of a doctor? _____ _____
43. Have you ever been told that you injured the ligaments or cartilage of either knee joint?
_____ _____
44. Do you think you have a trick knee? _____ _____45. Do you have a pin, screw, or plate somewhere in your body as the result of bone or joint
surgery that presently limits your physical capacity? _____ ____
46. If yes, indicate where:
47. Have you ever had a bone graft or spinal fusion? _____ _____
Activity History
48. During your early childhood (to age 12) would you say you were:
Very active ____ Quite active____ Moderately active____ Seldom active____
49. During your adolescent years (age 13-18) would you say you were:Very active ____ Quite active____ Moderately active____ Seldom active____
50. Did you participate in:
a. Intramural school sports? _____ _____b. Community sponsored sports? _____ _____
c. Varsity school sports? _____ _____
d. Active family recreation? _____ _____
51. Since leaving high school, how active have you been?Very active ____ Quite active____ Active____ Inactive____
52. Do you participate in any vigorous activity at present? _____ _____
53. If yes, please list:
Activity Frequency Duration Intensity
54. How would you describe your present state of fitness?
Excellent_____ Good_____ Fair_____ Poor_____55. Please list the type(s) of work you have been doing for the previous ten years:
Year Work Indoor/Outdoor Location (city/state)
Page 63
8/3/2019 The Relationship Between Serum and Salivary Corti
http://slidepdf.com/reader/full/the-relationship-between-serum-and-salivary-corti 63/81
54
56. Whom shall we notify in case of emergency?
Name:Phone: (Home) (Work)
Address:
57. Name and address of personal physician:
All of the above questions have been answered completely and truthfully to the best of myknowledge.
Signature: Date:
Page 64
8/3/2019 The Relationship Between Serum and Salivary Corti
http://slidepdf.com/reader/full/the-relationship-between-serum-and-salivary-corti 64/81
Page 65
8/3/2019 The Relationship Between Serum and Salivary Corti
http://slidepdf.com/reader/full/the-relationship-between-serum-and-salivary-corti 65/81
56
APPENDIX C
Informed Consent
University of North Carolina-Chapel Hill
Consent to Participate in a Research StudyAdult Participants
Social Behavioral Form
IRB Study #__ 09-1704__________________
Consent Form Version Date: 9/28/2009
Title of Study: The Relationship between Plasma and Salivary Cortisol Levels in Responseto Different Exercise Intensities
Principal Investigator: Mitch D. VanBruggen
UNC-Chapel Hill Department: Exercise and Sport Science (EXSS)UNC-Chapel Hill Phone number: 763-670-7878
Email Address: [email protected]
Faculty Advisor: Dr. Anthony C. Hackney
Study Contact telephone number: 919-962-0334
Study Contact email: [email protected] _________________________________________________________________
What are some general things you should know about research studies?You are being asked to take part in a research study. To join the study is voluntary.
You may refuse to join, or you may withdraw your consent to be in the study, for any reason,
without penalty.
Research studies are designed to obtain new knowledge. This new information may help
people in the future. You may not receive any direct benefit from being in the research
study. There also may be risks to being in research studies.
Details about this study are discussed below. It is important that you understand this
information so that you can make an informed choice about being in this research study.
You will be given a copy of this consent form. You should ask the researchers named above,or staff members who may assist them, any questions you have about this study at any time.
What is the purpose of this study?The purpose of this research study is to learn about the relationship between blood and saliva
cortisol levels at rest and in response to different exercise intensities to determine if salivary
concentrations can be an accurate method to assess the body‘s stress response to exercise.
You are being asked to be in the study because you are an endurance-trained male athlete.
Page 66
8/3/2019 The Relationship Between Serum and Salivary Corti
http://slidepdf.com/reader/full/the-relationship-between-serum-and-salivary-corti 66/81
57
Are there any reasons you should not be in this study? You should not be in this study if you do not exercise regularly; consume a diet chronically
low in carbohydrates; have a prior history of hormonal disorders; have a mental illness;
or engage in chronic non-steroidal anti-inflammatory (i.e. ibuprofen) drug use.
How many people will take part in this study? If you decide to be in this study, you will be one of approximately twelve people in this
research study.
How long will your part in this study last?You will be asked to come to the Applied Physiology Laboratory (APL) in Fetzer
Gymnasium for approximately 90-120 minutes on 5 separate occasions. These testing
sessions will be separated by a minimum of 72 hours. More specific scheduling will bedone after you agree to participate in the study, although each session will occur at the
same time of day (within 30 minutes). After your final exercise session, your
participation in the study will be completed.
What will happen if you take part in the study?
You will be asked to report to the Applied Physiology Laboratory (APL) in FetzerGymnasium at the University of North Carolina-Chapel Hill on five separate occasions.
You should maintain a consistent food intake throughout the duration of your
participation. Also, you are asked to come to the laboratory having not exercised for 24
hours, not eaten for the previous 4 hours, and having consumed no caffeine or alcohol for8 hours prior to the session. You must wear athletic clothing and shoes, or appropriate
cycling gear to each exercise session. A locker room will be provided should you need to
change clothes.
First visit to the laboratory:1. During the first visit, you will learn specific details about the study, read and sign the
informed consent form, and have a brief discussion on dietary intake and training history.You will also complete a questionnaire to measure your stress levels. You will then
undergo a familiarization process with the bike apparatus, blood and saliva collection
procedures, and have your height, and body weight recorded. You will also have your
body fat percentage measured using skinfold calipers.2. Next, your blood pressure will be taken, and then you will have 10 electrodes placed on
your chest in order to acquire a 12-lead resting electrocardiogram to determine if
cardiovascular problems exist.3. If the ECG recording is normal, you will be properly fit with a mouthpiece (used to
measure your respiratory gases), and a heart rate monitor. A resting oxygen uptake will
be assessed to make sure that the values are normal and the metabolic system isfunctioning properly. If everything is normal, you will be instructed to warm up on the
bike for 5 minutes at a very light workload. This light warm-up will be followed by 5
minutes of stretching.
4. After the warm-up, you will perform a bicycling graded exercise test, to determine yourmaximal aerobic capacity (VO2 max). During the test, your heart rate, respiratory gases,
Page 67
8/3/2019 The Relationship Between Serum and Salivary Corti
http://slidepdf.com/reader/full/the-relationship-between-serum-and-salivary-corti 67/81
58
and perceived exertion will be monitored continuously. The incremental exercise test will
begin at a workload previously determined by your training history. The workload willincrease at the end of 3 minute intervals (stages) until you feel you can no longer
continue.
5. After successful completion of the aerobic capacity test, you will cool down and be
allowed to leave the laboratory after your heart rate is less than 100 beats per minute(bpm).
6. Your initial visit to the laboratory will last approximately 90-120 minutes.
Second, Third, Fourth, and Fifth Visits to the Laboratory: 7. On a separate day, at least 72 hours but no more than approximately 7 days, following
your previous visit, you will again report to the laboratory for either a resting session
(control) or to perform your first 30 minute exercise session at one of the randomlyselected intensities. You will report to the laboratory for this test at the same time of day
as your first visit (±30 minutes). During this testing session, you will have 3 blood draws
performed and 3 saliva samples taken. All of the blood draws will be performed by a
certified and experienced professional. The blood and saliva samples will be temporarilykept cool and then stored until the study is complete. After completion of this study, all
of the samples will be destroyed.8. First, you will rest in a supine (lying down, face-up) position (to control for posture) for
30 minutes, after which the pre-exercise saliva and blood samples will be taken.
Approximately 1 teaspoon (3cc) of blood and saliva will be collected with each
respective sample (3 total samples during each exercise session).9. After the 30 minute resting period, the first blood and saliva sample will be taken. Next,
you will be asked to put on the heart rate monitor around your chest in order to measure
your HR throughout the trial. Finally, your resting heart rate and blood pressure will betaken.
10. During each of the separate exercise trials, you will be asked to warm-up for 5 minutes
on the bike and stretch. You will then cycle at one of the randomly selected intensities, at
approximately either 40%, 60%, or 80% of your maximal aerobic capacity. Your heartrate will be monitored every 5 minutes. You will also have wear the mouthpiece and
nose-clip (as with the first session) to monitor your respiratory gases every 10 minutes.
You will be able to drink water as needed. The duration of the exercise will be 30
minutes.11. Immediately after exercise, a second blood and saliva sample will be collected. After the
samples are collected, you will be allowed to actively cool down on the bike and then
rest.12. Thirty minutes after the post-exercise blood and saliva samples are taken (Step 9 above),
the final blood and saliva samples will be collected, after which you will be allowed to
leave the laboratory.13. During the resting, control session, you will have 3 blood draws performed and 3 saliva
samples taken, just as with the exercise sessions. However, instead of the exercise
session, you will simply rest. This session serves as a control.
12. Each of these sessions should take approximately 90-120 minutes.
Page 68
8/3/2019 The Relationship Between Serum and Salivary Corti
http://slidepdf.com/reader/full/the-relationship-between-serum-and-salivary-corti 68/81
59
13. This process will be replicated for each of the sessions (40%, 60%, 80% intensity or
control resting session), which will be separated by a minimum of 72 hours.
What are the possible benefits from being in this study?
Research is designed to benefit society by gaining new knowledge.
You may also expect to benefit by participating in this study by receiving a free physicalexam, and resting ECG. You will also get to measure your aerobic capacity (maximaloxygen uptake) that can be used to aid you in any future training. The study will also
provide you with your ventilatory threshold, which can also be a tool to be used in
training. The serum and saliva cortisol values will also be made available to you after the
study.
This study may help to provide a better understanding of associations between serum andsalivary cortisol levels in response to exercise. Both athletes and researchers could
benefit from this method‘s non-invasive, more feasible, and practical alternative to blood
sampling if the relationship between these two methodologies are understood and can beproperly applied to research design and methodology
What are the possible risks or discomforts involved from being in this study?
There is a possibility that you will experience some light-headedness, dizziness, or
fainting due to maximal and exhaustive exercise. Additionally, there is a rare possibility
that you will experience a heart attack or even death. However, due to your physically
active status, the risk of catastrophic events is minimized. ECG and blood pressuremeasurements will be taken before tests to ensure proper heart functioning. The pre-
screening physical exam that includes basic measurements of pulmonary, circulatory, and
orthopedic function will help detect any abnormalities that may result in termination of
your participation in the study. At least two individuals certified in CPR, AED, and first-aid will be present during the entire test, and a proper emergency protocol is established
if there is an emergency situation. There is risk of bruising or infection with all blood draws. These blood draws will be
administered by an experienced professional, certified in phlebotomy. Proper first-aid
procedures after the blood draws will also be followed in order to minimize infection and
risk of bruising.
There is a likelihood that you will experience muscle soreness and general fatiguefollowing exercise sessions. This discomfort will be minimized allowing at least 72hours to pass in between sessions. Also, a proper warm-up and stretch period prior to
exercise bouts will help to minimize soreness. No soreness that inhibits daily activities is
likely to occur
There is also a rare possibility that any latent illness may become evident from the
exercise or blood work. There may be uncommon or previously unknown risks. You should report any problems
to the researcher.
Page 69
8/3/2019 The Relationship Between Serum and Salivary Corti
http://slidepdf.com/reader/full/the-relationship-between-serum-and-salivary-corti 69/81
Page 70
8/3/2019 The Relationship Between Serum and Salivary Corti
http://slidepdf.com/reader/full/the-relationship-between-serum-and-salivary-corti 70/81
61
What if you have questions about this study?You have the right to ask, and have answered, any questions you may have about this
research. If you have questions, complaints, concerns, or if a research-related injury occurs,
you should contact the researchers listed on the first page of this form.
What if you have questions about your rights as a research participant?
All research on human volunteers is reviewed by a committee that works to protect your
rights and welfare. If you have questions or concerns about your rights as a research subject,or if you would like to obtain information or offer input, you may contact the Institutional
Review Board at 919-966-3113 or by email to [email protected] .
- - - - - - - - - - - - - - - - - - - - - - - - - - - - - - - - - - - - - - - - - - - - - - - - - - - - - - - - - - - - - -
Title of Study: The Relationship Between Plasma and Salivary Cortisol Levels in Responseto Different Exercise Intensities
Principal Investigator: Mitch D. VanBruggen
Participant’s Agreement:
I have read the information provided above. I have asked all the questions I have at this time.
I voluntarily agree to participate in this research study.
_________________________________________________ _________________
Signature of Research Participant Date
_________________________________________________Printed Name of Research Participant
_________________________________________________ _________________Signature of Research Team Member Obtaining Consent Date
_________________________________________________Printed Name of Research Team Member Obtaining Consent
Page 71
8/3/2019 The Relationship Between Serum and Salivary Corti
http://slidepdf.com/reader/full/the-relationship-between-serum-and-salivary-corti 71/81
62
APPENDIX D
DATA COLLECTION SHEETS
Orientation/VO2max Session
Subject Name________________ Subject ID_____________________
Informed Consent1. Inform participant of the experimental protocol
2. Make certain that the subject is aware of the possible risks
3. Sign informed consent
Participant Compliance Questions1. Did subject refrain from strenuous physical activity for 24h prior to VO2 max testing?
Yes No
2. Did the subject report to the lab 4 hours post-prandial?Yes No
3. Did the subject take NSAIDs, consume alcohol, or caffeine 8 hours prior to testing?Yes No
Examinations _______
1. Medical History2. 12 Lead ECG
3. Physical Examination
Physical Characteristics1. Age _______ yrs
2. Height _______ cm
3. Mass _______ kg
4. Percent Body Fat _______%
Skinfolds:
a. Chest (diagonal fold midway between upper armpit & nipple) ______mmb. Abdominal (vertical fold; 1 inch to right of navel) ______mm
c. Thigh (vertical fold midway between kneecap and top of thigh) ______mm
Before VO2max Testing Protocol1. Set up metabolic system (gas calibration & mouthpiece)
2. Fit electronically-braked cycle ergometer to the participant - record seat position usingSeat height: _______ cm
3. Fit polar heart rate (HR) monitor to participant
4. Make sure polar heart rate monitor picks up signal
5. Place RPE scale near cycle ergometer/explain RPE to participant
Page 72
8/3/2019 The Relationship Between Serum and Salivary Corti
http://slidepdf.com/reader/full/the-relationship-between-serum-and-salivary-corti 72/81
63
Warm Up
1. 5 minutes of cycling at light workload2. 5 minutes of stretching focused on the lower extremities
3. Record resting oxygen consumption to verify values fall within normal range
VO2 max Protocol1. Stage 1: 50W for 3 minutes: HR _________; RPE _________
2. Stage 2: 100W for 3 minutes: HR _________; RPE _________
3. Stage 3: 150W for 3 minutes: HR _________; RPE _________4. Stage 4: 200W for 3 minutes: HR _________; RPE _________
5. Stage 5: 225W for 1 minute: HR _________; RPE _________
6. Stage 6: 250W for 1 minute: HR _________; RPE _________
7. Stage 7: 275W for 1 minute: HR _________; RPE _________8. Stage 8: 300W for 1 minute: HR _________; RPE _________
9. Stage 9: 325W for 1 minute: HR _________; RPE _________
10. Stage 10: 350W for 1 minute: HR _________; RPE _________
11. Stage 11: 375W for 1 minute: HR _________; RPE _________12. Stage 12: 400W for 1 minute: HR _________; RPE _________
13. Increase workload until volitional fatigue add more stages if necessary
14. Recovery - reduce resistance and have participant continue pedaling
15. Participant rests (supine) until HR is less than or equal to 100 bpm
Was the total test time equal to or greater than 12 minutes? Test time = _________
Criteria for valid and reliable VO2 max Test1. Was there a 150 ml/min or less increase in oxygen consumption in response to an
increased workload?
Yes No
2. Did the participant have a maximal RER equal to or greater than 1.1?RER =_________
3. Did the participant reach age-predicted maximal HR (220-age ± 5%)?
HRmax =_________
4. Did the participant have a RPE equal to or greater than 18?RPE = _________
Recovery:1. Reduce resistance and have participant continue pedaling
2. Allow subject to rest (supine) until HR is less than or equal to 100 bpm
Before Subjects Leave Laboratory:1. Obtain diet 3-day diet record for analysis required before first experimental session
2. Schedule first experimental session
Page 73
8/3/2019 The Relationship Between Serum and Salivary Corti
http://slidepdf.com/reader/full/the-relationship-between-serum-and-salivary-corti 73/81
64
Experimental Exercise Sessions
Subject Name________________ Subject ID_____________________
Experimental sessions should start approximately one week after orientation/VO2max session;
spaced 72 hours apart, randomized, and all completed at about (±30 min) the same time of day.
Administer REST-Q-Sport Questionnaire for Athletes to subject
1. What was the subject‘s score? __________
The score must be lower than 36 (average of the midpoints of each of the 12
scales; scale ranges from 1 to 6) for the subject to proceed on that day.
Participant Compliance Questions1. Did the subject refrain from strenuous physical activity for 24 hours prior to the
experimental sessions?
Yes No2. Did the subject report to the lab 4 hours post-prandial?
Yes No3. Did the subject take NSAIDs, consume alcohol, or caffeine 8 hours prior to testing?
Yes No
Before Starting Exercise Protocols1. Set up metabolic system (calibrate, mouthpiece, etc)
2. Set up blood collection supplies
3. Set up saliva collection supplies4. Set up cycle ergometer to previously recorded seat height: ________ cm
5. Fit polar heart rate (HR) monitor to participant
6. Make sure polar heart rate monitor picks up signal
7. Place RPE scale near cycle ergometer
Pre-Exercise Rest
1. The participant will rest in the supine position for 30 minutes
2. While subject is resting, place catheter into arm.3. After 30 minutes rest, obtain 3-mL of venous blood
4. Place blood into a sterile K2
EDTA (purple top) Vacutainer® tube; place tube on ice
5. Obtain resting saliva sample (~0.5-1.0 mL); place saliva in polypropylene vialIf subject has trouble salivating, stimulate through chewing on paraffin film
Warm Up1. 5 minutes of cycling at light workload (~15-20% VO2 max)
2. 5 minutes of stretching focused on the lower extremities
3. Record resting oxygen consumption to verify values fall within normal range
Page 74
8/3/2019 The Relationship Between Serum and Salivary Corti
http://slidepdf.com/reader/full/the-relationship-between-serum-and-salivary-corti 74/81
65
Exercise Protocol
Randomly Assigned Exercise Intensity and Corresponding Workload
____40% VO2 max Workload_______W
____60% VO2 max Workload_______W
____80% VO2 max Workload_______W
During exercise, subjects are allowed to consumer water ad-libitum
Cycle for 30 minutes at the previously determined workload.
Minute 0: HR _________ RPE _________
Minute 5: HR _________ RPE _________
Minute 7-10 VO2 measurement (remove mouthpiece after sampling)Minute 10: HR _________ RPE _________
Minute 15: HR _________ RPE _________
Minute 17-20 VO2 measurement (remove mouthpiece after sampling)
Minute 20: HR _________ RPE _________Minute 25: HR _________ RPE _________
Minute 27-30: VO2 measurement (remove mouthpiece after sampling)Minute 30: HR _________ RPE _________
Immediately Post-Exercise1. Immediately after 30 minute exercise session, obtain 3-mL of venous blood.
2. Place blood into a sterile K2
EDTA (purple top) Vacutainer® tube; place tube on ice
3. Obtain saliva sample (~0.5-1.0 mL); place saliva in polypropylene vialIf subject has trouble salivating, stimulate through chewing on paraffin film
4. Begin supine resting session
Resting/Recovery1. Immediately after 30 minute supine recovery session, obtain 3-mL of venous blood.
2. Place blood into a sterile K2 EDTA (purple top) Vacutainer® tube; place tube on ice
3. Obtain saliva sample (~0.5-1.0 mL); place saliva in polypropylene vial
If subject has trouble salivating, stimulate through chewing on paraffin film
Before Subjects Leave Laboratory:
1. Make sure heart rate is below 100 bpm2. Schedule next experimental session
Page 75
8/3/2019 The Relationship Between Serum and Salivary Corti
http://slidepdf.com/reader/full/the-relationship-between-serum-and-salivary-corti 75/81
66
Experimental Control (Resting) Session
Subject Name________________ Subject ID_____________________
Control/Resting session will be randomly assigned and may occur at any point in the timeline
of the 4 separate experimental sessions. As with the exercise sessions, this session should bespaced 72 hours apart from other sessions and all completed at the same time of day (±30
min) as the other sessions
Administer REST-Q-Sport Questionnaire for Athletes to subject
1. What was the subject‘s score? __________
The score must be lower than 36 (average of the midpoints of each of the 12
scales; scale ranges from 1 to 6) for the subject to proceed on that day.
Before Starting Control Session
1. Set up blood collection supplies
2. Set up saliva collection supplies
Pre-Rest Procedures1. The participant will rest in the supine position for 30 minutes
2. While subject is resting, place catheter into arm.
3. After 30 minutes rest, obtain 3-mL of venous blood
4. Place blood into a sterile K2
EDTA (purple top) Vacutainer® tube; place tube on ice5. Obtain resting saliva sample (~0.5-1.0 mL); place saliva in polypropylene vial
If subject has trouble salivating, stimulate through chewing on paraffin film
Resting Protocol Instead of exercise, subject will rest in supine position for 30 minutes
Immediately Post-Rest1. Immediately after 30 minute resting/control session, obtain 3-mL of venous blood.
2. Place blood into a sterile K2 EDTA (purple top) Vacutainer® tube; place tube on ice
3. Obtain saliva sample (~0.5-1.0 mL); place saliva in polypropylene vial
If subject has trouble salivating, stimulate through chewing on paraffin film4. Begin supine resting position
Post-Rest Procedures1. Immediately after 30 minute supine resting session, obtain 3-mL of venous blood.
2. Place blood into a sterile K2
EDTA (purple top) Vacutainer® tube; place tube on ice
3. Obtain saliva sample (~0.5-1.0 mL); place saliva in polypropylene vialIf subject has trouble salivating, stimulate through chewing on paraffin film
Before Subjects Leave Laboratory:
1. Schedule next experimental session
Page 76
8/3/2019 The Relationship Between Serum and Salivary Corti
http://slidepdf.com/reader/full/the-relationship-between-serum-and-salivary-corti 76/81
67
APPENDIX E
ASSAY INFORMATION
Serum Cortisol Assay Procedures
All components must be at room temperature (15-28º C) before use.
1. Plain Tubes: Label four plain (uncoated) 12 x 75 mm polypropylene tubes T (totalcounts) and NSB (non-specific binding) in duplicate. Because non-specific binding in
the Coat-A-Count procedure is low, the NSB tubes can be omitted without
compromising accuracy or quality control.
Coated Tubes: Label twelve Cortisol Ab-Coated Tubes A (maximum binding) and Bthrough F in duplicate. Label additional Cortisol Ab-Coated Tubes, in duplicate, for
controls and patient samples.
Calibrators μg/dL nmol/LA (MB) 0 0
B 1 27.6C 5 138
D 10 276
E 20 552
F 50 1380
2. Pipet 25 μL of the zero calibrator A into the NSB and A tubes. Pipet 25 μL of each
remaining calibrator, control, and patient samples into the tubes prepared. Pipetdirectly to the bottom. It is good practice to use a disposable-tip micropipette,
changing the tip between samples, in order to avoid carryover contamination.
3. Add 1.0 mL of 125I Cortisol into every tube. Vortex. Laboratories equipped with areliable pipettor-diluter may handle steps 2 and 3 simultaneously. No more than 10
minutes should elapse during the dispensing of the tracer. Set the T tubes aside for
counting at step 6; they require no further processing.
4. Incubate for 45 minutes at 37º C. Use a water bath; neither an oven nor a heat block is
suitable. Longer incubation periods will not significantly affect the assay.
5. Decant thoroughly. Removing all visible moisture will greatly enhance precision.
Decant the contents of all tubes (except the T tubes) using a foam decanting rack, and
allow them to drain for 2 or 3 minutes. Then strike the tubes sharply on absorbentpaper to shake off all residual droplets.
6. Count for 1 minute in a gamma counter.
Page 77
8/3/2019 The Relationship Between Serum and Salivary Corti
http://slidepdf.com/reader/full/the-relationship-between-serum-and-salivary-corti 77/81
68
Salivary Cortisol Assay Procedures
1. Bring all reagents to room temperature and mix before use.
2. Prepare 1X wash buffer (and reconstitute stop solution, if appropriate).
3. Bring plate to room temperature and prepare for use with NSB wells.
4. Prepare tube with 24 mL of assay diluent for conjugate dilution, which will be madelater.
5. Pipette 25 μL of standards, controls, and unknowns into appropriate wells.
6. Pipette 25 μL of assay diluent into zero and NSB wells.
7. Make final 1:1600 dilution of conjugate (15 μL into 24 mL assay diluent), mix, and
immediately pipette 200 μL into each well.
8. Mix plate for 5 minutes at 500 rpm. Incubate for an additional 55 minutes at roomtemperature.
9. Wash plate 4 times with 1X wash buffer. Blot.
10. Add 200 μL TMB solution to each well.
11. Mix plate for 5 minutes at 500 rpm. Incubate in dark at room temperature for 25additional minutes.
12. Add 50 μL stop solution to each well. Mix for 3 minutes at 500 rpm.
13. Wipe plate bottom clean and read within 10 minutes of adding stop.
Calculations
1. Compute the average optical density (OD) for all duplicate wells.
2. Subtract the average OD for the NSB wells from the average OD of the zero,
standards, controls, and unknowns.
3. Calculate the percent bound (B/Bo) for each standard, control, and unknown by
dividing the average OD (B) by the average OD for the zero (Bo).
4. Determine the concentrations of the controls and unknowns by interpolation.
Page 78
8/3/2019 The Relationship Between Serum and Salivary Corti
http://slidepdf.com/reader/full/the-relationship-between-serum-and-salivary-corti 78/81
69
REFERENCES
American College of Sports Medicine (2000). Guidelines for Exercise Testing and
Prescription, 6 th
edition. Baltimore, MD: Williams and Wilkins, pp. 16-23; 43-47; 56-66.
Ben-Aryeh, H., Roll, N., Lahav, M., Dlin, R., Hanne-Paparo, N., Szargel, R., Shein-Orr, C.,Laufer, D. (1989). Effect of exercise on salivary composition and cortisol in serum and
saliva in man. Journal of Dental Research, 68, 1495-1497.
Bloom, S.R, Johnson, R.H., Park, D.M, Rennie, M.J., Sulaiman, W.R. (1976). Differences in
the metabolic and hormonal response to exercise between racing cyclist and untrained
individuals. Journal of Physiology, 258, 1-18.
Borg, G. (1970). Perceived exertion as an indicator of somatic stress. Scandinavian Journal
of Rehabilitative Medicine, 23, 92-98.
Brooks, G.A., Fahey, T.D., White, T.P., Baldwin, K.M. (2000). Exercise Physiology: Human Bioenergetics and Its Applications. Mountain View: Mayfield Publishing Company, pp 186-
199.
Brownlee, K.K., Moore, A.W., and Hackney, A.C. (2005). Relationship between circulating
cortisol and testosterone: influence of physical exercise. Journal of Sports Science and
Medicine, 4, 76-83.
Cadore, E., Lhullier, F., Brentano, M., Silva, E., Ambrosini, M., Spinelli, R., Silva, R., Krue,
L. (2008). Correlations between serum and salivary hormonal concentrations in response toresistance exercise. Journal of Sports Sciences, 26 , 1067-1072.
Chard, T. (1990). An Introduction to Radioimmunoassay and Related Techniques.
Amsterdam: Elsevier.
Daly, W., Seegers, C., Timmeran, S., Hackney, A.C. (2004). Peak cortisol response to
exhausting exercise: effects of blood sampling schedule. Medicina Sportiva, 8, 17-20.
Davies, C.T.M. and Few, J.D. (1973). Effects of exercise on adrenocortical function. Journal
of Applied Physiology, 35, 887-891.
del Corral, P., Mahon, A.D., Duncan, G.E., Howe, C.A., Craig, B.W. (1994). The effect of
exercise on serum and salivary cortisol in male children. Medicine and Science in Sports and
Exercise, 26 , 1297-1301.
Dill, D.B. and Costill, D.L. (1974). Calculation of percentage changes in volumes of blood,
plasma, and red cells in dehydration. Journal of Applied Physiology, 37 , 247-248.
Page 79
8/3/2019 The Relationship Between Serum and Salivary Corti
http://slidepdf.com/reader/full/the-relationship-between-serum-and-salivary-corti 79/81
70
Duclos, M., Corcuff, J.B., Rashedi, M., Fougere, V., Manier, G. (1997). Trained versus
untrained men: different immediate post-exercise responses of pituitary-adrenal axis.
European Journal of Applied Physiology, 75, 343-350.
Few, J.D., Frenkl, R., Csalay, L (1970). Endocrine adaptation to regular muscular activity.
Journal of Sports Medicine and Physical Fitness, 10, 1-7.
Galbo, H. (1983). Hormonal and Metabolic Adaptation to Exercise. G. Thieme Stuttgart,
New York.
Garrett, J.R. (1987). The proper role of nerves in salivary secretion: a review. Journal of
Dental Research, 66 , 387-397
Goodyer, Park, R.J., Netherton, C.M., Herbert, J. (2001). Possible role of cortisol and
dehydroepiandrosterone in human development and psychopathology. British Journal of
Psychiatry, 179, 243-249.
Gonzansky, W.S., Lynn, J.S., Laudenslager, M.L., Kohrt, W.M. (2005). Salivary cortisol
determined by enzyme immunoassay is preferable to serum total cortisol for assessment of dynamic hypothalamic-pituitary-adrenal axis activity. Clinical Endocrinology, 63, 336-341.
Hackney, A.C. (2006). Stress and the neuroendocrine system: the role of exercise as a
stressor and modifier of stress. Expert Reviews in Endocrinology and Metabolism, 1, 783-792.
Hagen , R.D., Diaz, F.J., McMurray, R.G., Horvath, S.M. (1980). Plasma volume changesrelated to posture and exercise. Proceedings for the Society of Experimental Biology and
Medicine, 165, 155-160.
Hellhammer, D.H., Wust, F., Kudielka, B.M. (2009). Salivary cortisol as a biomarker instress research. Psychoneuroendocrinology, 32, 163-171.
Hill, E.E., Zack, E., Battaglini, C., Viru, M., Viru, A., Hackney, A.C. (2008). Exercise and
circulation cortisol levels: the intensity threshold effect. Journal of Endocrinological.
Investigation, 31, 587-591.
Jacks, D.E., Sowash, J., Anning, J., Mcgloughlin, T., Andres, F. (2002). Effect of exercise atthree exercise intensities on salivary cortisol. Journal of Strength and Conditioning
Research, 16 , 286-289.
Jackson, A.S., Pollock, M.L. (1978). Generalized equations for predicting body density of
men. British Journal of Nutrition, 40, 497-504.
Kaufman , E., Lamster, I.B. (2002). The diagnostic applications of saliva – a review. Critical
Reviews in Oral Biology & Medicine, 13, 197-212.
Page 80
8/3/2019 The Relationship Between Serum and Salivary Corti
http://slidepdf.com/reader/full/the-relationship-between-serum-and-salivary-corti 80/81
71
Kellmann, M., Kallus, K.W. (2001). Recovery Stress Questionnaire for Athletes. Champaign,
IL: Human Kinetics, pp. 1-41.
Kerrigan, J.R., Veldhuis, J.D., Leyo, S.A., Iranmanesh, A., Rogol, A.D. (1993). Estimation
of daily cortisol production and clearance rates in normal pubertal males by deconvolution
analysis. Journal of Clinical Endocrinology and Metabolism, 76 , 1505-1510.
Kirschbaum, C., Hellhammer, D. (1994). Salivary cortisol in psychoneuroendocrine research:
recent developments and applications. Psychoneuroendocrinology, 19, 313-331.
Kivlighan, K., Granger, D., Booth, A. (2005). Gender differences in testosterone and cortisol
response to competition. Psychoneuroendocrinology, 30, 58-71.
Levine, A., Zagoory-Sharon, O., Feldman, R., Lewis, J., Weller, A., (2007). Measuring
cortisol in human psychobiological studies. Physiology and Behavior , 90, 43-53.
Mastorakos, G., Pavlatou, M., Dimanti-Kandarakis, E., Chrousos, G. (2005). Exercise andthe stress system. Hormones, 4, 73-89
McGuigan, M.R., Egan, A.D., Foster, C. (2003). Salivary cortisol responses and perceived
exertion during high intensity and low intensity bout of resistance exercise. Journal of Sports
Science and Medicine, 3, 8-15.
McMurray, R.G., and Hackney, A.C. (2000). Exercise and Sport Science: Endocrine
responses to exercise and training. Philadelphia: Lippincott Williams & Wilkins, pp. 135-
161.
Neal, J.M. (2001). How the Endocrine System Works. Malden: Blackwell Publishing, pp. 34-
39.
Neary, J.P., Malbon, L. McKenzie, D.C. (2002). Relationship between serum, saliva and
urinary cortisol and its implication during recovery from training. Journal of Science and
Medicine in Sport, 5, 108-114.
Paccotti, P., Minetto, M., Terzolo, M. (2005). Effects of high-intensity isokinetic exercise on
salivary cortisol in athletes with different training schedules: relationships to serum cortisol
and lactate. International Journal of Sports Medicine, 26, 747-755.
Powers, S.K., Howley, E.T. (2004). Exercise Physiology: Theory and Application to Fitness
and Performance. New York: McGraw-Hill, pp. 81-83.
Rudolph, D.L., McAuley, E. (1998). Cortisol and affective response to exercise. Journal of
Sports Sciences, 16 , 121-128.
Page 81
8/3/2019 The Relationship Between Serum and Salivary Corti
http://slidepdf.com/reader/full/the-relationship-between-serum-and-salivary-corti 81/81