Page 1
The relationship between sustained and divided attentional abilities and Autistic
Spectrum Disorder traits
200534890
2013
A PSYC3520 Major Project supervised by Prof. Mark Mon-Williams
Word count - 9195
A dissertation submitted in partial fulfilment of the requirements for the degree of
Psychology
and in agreement with the University of Leeds’
Declaration of Academic Integrity
Zoe Warner
Page 2
ii
Acknowledgements
I would like to thank my supervisor Prof. Mark Mon-Williams and Liam Hill for their
consistent support and guidance during the running of this project. Furthermore I would like
to thank the rest of the undergraduate research team for their collaborative effort during
data collection. I would also like to acknowledge the school in Bradford for their
participation and engagement in the study.
Page 3
iii
Contents Page
Abstract v
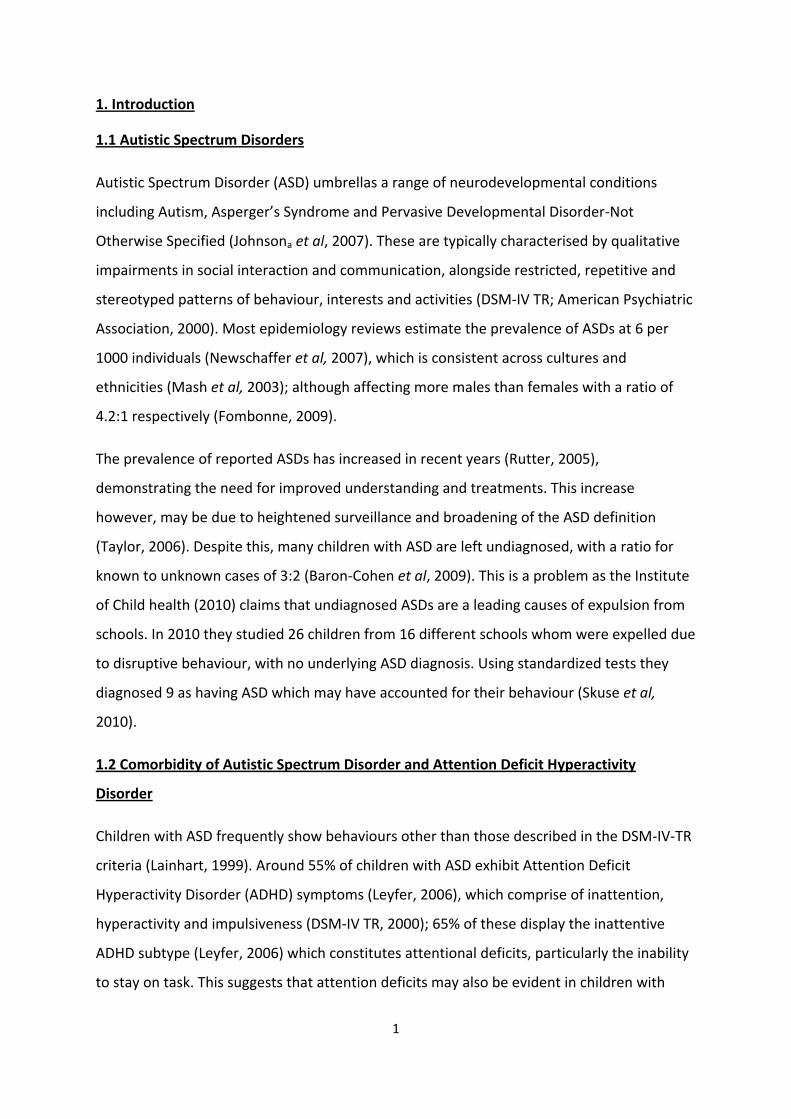
1. Introduction 1
1.1 Autistic Spectrum Disorders 1
1.2 Comorbidity of Autistic Spectrum Disorder and Attention
Deficit Hyperactivity Disorder 1
1.3 Sustained Attention in Autistic Spectrum Disorders 2
1.4 Divided Attention in Autistic Spectrum Disorders 4
1.5 The Present Study 6
1.5.1 Sustained and Divided Attention Measures 7
1.5.2 Strengths and Difficulties Questionnaire 8
1.6 Aims and Research Question 9
2. Method 10
2.1 Participants 10
2.2 Ethics 10
2.3 Design 10
2.4 Apparatus/Materials 11
2.4.1 Attention Measure 11
2.4.2 Strengths and Difficulties Questionnaire 11
2.5 Procedure 11
2.6 Analyses 14
2.6.1 Measures 14
2.6.2 Statistics 16
3. Results 17
3.1 Correlations 17
3.2 Linear Regressions 18
3.2.1 Divided Attention, Sustained Attention and Composite ASD
traits 18
3.2.2 Semi-partial correlation controlling for age 18
3.2.3 Tracking, Cue-Detection and Composite ASD traits 19
3.2.4 Divided Attention, Sustained Attention and ASD trait
subscales 19
3.2.5 Tracking, Cue-detection and ASD trait subscales 20
4. Discussion 22
4.1 Summary of Findings 22
Page 4
iv
4.2 Implications 23
4.3 Strategy adoption during dual-tasking in children displaying
higher ASD traits 26
4.4 The Relationship between attentional abilities and ASD traits 26
4.5 Limitations 28
4.6 Future Directions 28
4.7 Conclusions 30
References vi
Appendices xv
Page 5
v
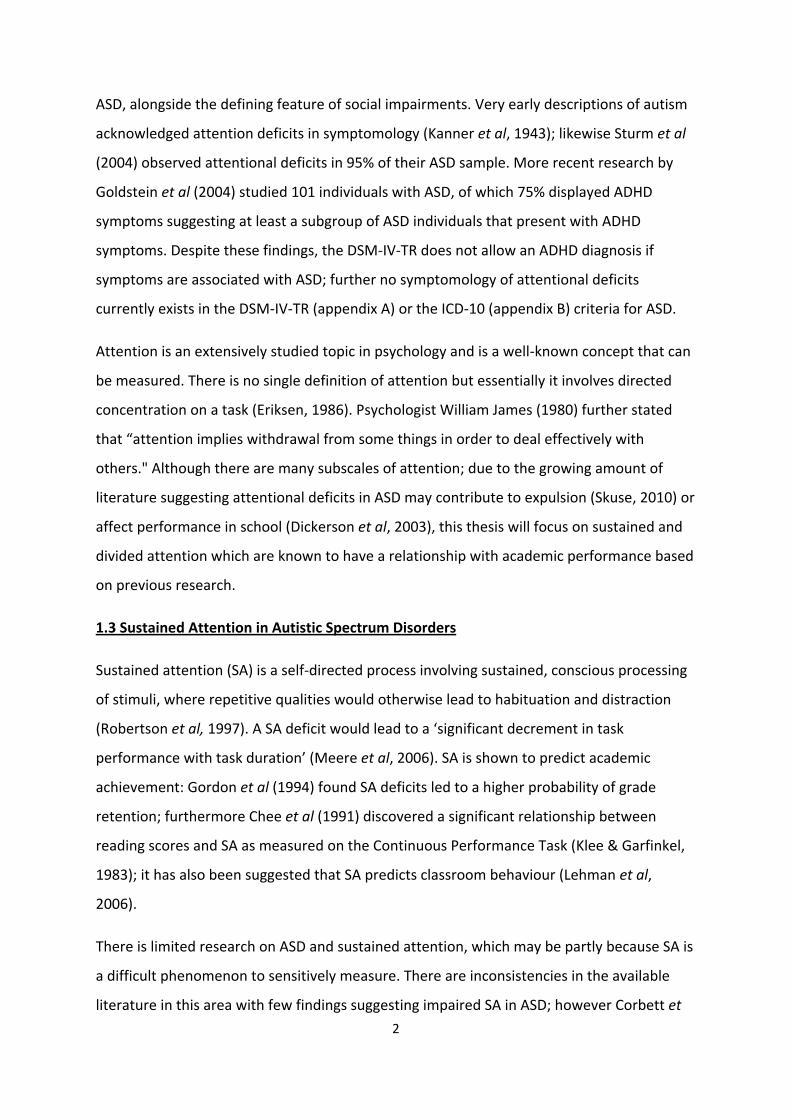
Abstract
Whilst social and communication impairments represent the defining features of Autistic
Spectrum Disorders (ASDs), the proposed comorbidity between ASD and Attention Deficit
Hyperactivity Disorder (ADHD; Leyfer, 2006) suggests attentional deficits may also be an
underlying feature of ASD. The DSM-IV-TR precludes a dual-diagnosis of ASD with ADHD and
symptoms of attention deficits are not included in the DSM-IV-TR or the ICD-10 diagnosis for
ASD. There is currently inconsistent literature surrounding what types of attentional
difficulties exist in ASD, if any. As undiagnosed ASDs are suspected to be a leading cause of
expulsion from schools (Skuse et al, 2010), the present study aims to explore sustained and
divided attentional abilities as they are known to have a relationship with academic
performance (Gordon et al, 1994), in children across a continuum of autistic spectrum
disorder traits, using a novel objective measure of attention. 80 children (M=40, F=40, aged
7-11) were recruited from a primary school in the ‘Born in Bradford’ cohort. Sustained
attention was measured on tracking and cue-detection tasks on a tablet laptop, and divided
attention was measured by performing both tasks together under dual-task conditions.
Information was gathered for each child from their main teacher using the Strengths and
Difficulties Questionnaire (Goodman et al, 2001); three subscales of which have previously
been found to represent ASD traits (Iizuka et al, 2010; Russell et al, 2012). Results revealed
that sustained and divided attention capacity does appear to be poorer in children who
display greater ASD traits. Linear regressions suggest that sustained and divided attention
explains more variance in certain ASD traits than others in particular pro-social behaviour,
reasons for this are discussed. Further analysis with regression investigates the relationship
between constituent components of the attention measures and each ASD trait measured.
Page 6
1
1. Introduction
1.1 Autistic Spectrum Disorders
Autistic Spectrum Disorder (ASD) umbrellas a range of neurodevelopmental conditions
including Autism, Asperger’s Syndrome and Pervasive Developmental Disorder-Not
Otherwise Specified (Johnsona et al, 2007). These are typically characterised by qualitative
impairments in social interaction and communication, alongside restricted, repetitive and
stereotyped patterns of behaviour, interests and activities (DSM-IV TR; American Psychiatric
Association, 2000). Most epidemiology reviews estimate the prevalence of ASDs at 6 per
1000 individuals (Newschaffer et al, 2007), which is consistent across cultures and
ethnicities (Mash et al, 2003); although affecting more males than females with a ratio of
4.2:1 respectively (Fombonne, 2009).
The prevalence of reported ASDs has increased in recent years (Rutter, 2005),
demonstrating the need for improved understanding and treatments. This increase
however, may be due to heightened surveillance and broadening of the ASD definition
(Taylor, 2006). Despite this, many children with ASD are left undiagnosed, with a ratio for
known to unknown cases of 3:2 (Baron-Cohen et al, 2009). This is a problem as the Institute
of Child health (2010) claims that undiagnosed ASDs are a leading causes of expulsion from
schools. In 2010 they studied 26 children from 16 different schools whom were expelled due
to disruptive behaviour, with no underlying ASD diagnosis. Using standardized tests they
diagnosed 9 as having ASD which may have accounted for their behaviour (Skuse et al,
2010).
1.2 Comorbidity of Autistic Spectrum Disorder and Attention Deficit Hyperactivity
Disorder
Children with ASD frequently show behaviours other than those described in the DSM-IV-TR
criteria (Lainhart, 1999). Around 55% of children with ASD exhibit Attention Deficit
Hyperactivity Disorder (ADHD) symptoms (Leyfer, 2006), which comprise of inattention,
hyperactivity and impulsiveness (DSM-IV TR, 2000); 65% of these display the inattentive
ADHD subtype (Leyfer, 2006) which constitutes attentional deficits, particularly the inability
to stay on task. This suggests that attention deficits may also be evident in children with
Page 7
2
ASD, alongside the defining feature of social impairments. Very early descriptions of autism
acknowledged attention deficits in symptomology (Kanner et al, 1943); likewise Sturm et al
(2004) observed attentional deficits in 95% of their ASD sample. More recent research by
Goldstein et al (2004) studied 101 individuals with ASD, of which 75% displayed ADHD
symptoms suggesting at least a subgroup of ASD individuals that present with ADHD
symptoms. Despite these findings, the DSM-IV-TR does not allow an ADHD diagnosis if
symptoms are associated with ASD; further no symptomology of attentional deficits
currently exists in the DSM-IV-TR (appendix A) or the ICD-10 (appendix B) criteria for ASD.
Attention is an extensively studied topic in psychology and is a well-known concept that can
be measured. There is no single definition of attention but essentially it involves directed
concentration on a task (Eriksen, 1986). Psychologist William James (1980) further stated
that “attention implies withdrawal from some things in order to deal effectively with
others." Although there are many subscales of attention; due to the growing amount of
literature suggesting attentional deficits in ASD may contribute to expulsion (Skuse, 2010) or
affect performance in school (Dickerson et al, 2003), this thesis will focus on sustained and
divided attention which are known to have a relationship with academic performance based
on previous research.
1.3 Sustained Attention in Autistic Spectrum Disorders
Sustained attention (SA) is a self-directed process involving sustained, conscious processing
of stimuli, where repetitive qualities would otherwise lead to habituation and distraction
(Robertson et al, 1997). A SA deficit would lead to a ‘significant decrement in task
performance with task duration’ (Meere et al, 2006). SA is shown to predict academic
achievement: Gordon et al (1994) found SA deficits led to a higher probability of grade
retention; furthermore Chee et al (1991) discovered a significant relationship between
reading scores and SA as measured on the Continuous Performance Task (Klee & Garfinkel,
1983); it has also been suggested that SA predicts classroom behaviour (Lehman et al,
2006).
There is limited research on ASD and sustained attention, which may be partly because SA is
a difficult phenomenon to sensitively measure. There are inconsistencies in the available
literature in this area with few findings suggesting impaired SA in ASD; however Corbett et
Page 8
3
al (2006) used the Integrated Visual and Auditory (IVA) Continuous Performance Test (CPT;
(Sandford & Turner, 2000), to examine SA in 15 children with ASD, 15 with ADHD and 15
typically developing controls matched for age and gender. Both ASD and ADHD children
showed significant undistinguishable deficits in performance compared to controls,
suggesting that individuals with ASD may also display sustained attention deficits. More
recently Christakou et al (2013) conducted a neuroimaging study using FMRI to compare
brain activity in boys with ASD, ADHD and age matched controls whilst performing a SA task.
Results confirmed previous findings by Corbett (2006) and suggest ASD and ADHD boys
share the same neurofunctional abnormalities during tasks of sustained attention.
Most studies examining ASD have however, reported no deficits of sustained attention
(Buchsbaum et al, 1992; Casey et al, 1993; Noterdaeme et al, 2001). For example Minshew
et al (1999) tested autistic children on attention tasks and observed no difference in SA
performance compared to typically developing children. Similarly Courchesne et al (1989)
found children with ASD did not display difficulties maintaining attention on a single source.
Furthermore Garretson (1990) examined performance of autistic children on a Continuous
Performance Task of sustained attention compared to age matched controls. Their results
demonstrated impaired SA in autistic children, but only during the social motivation
condition (when praised after every fifth target was hit), suggesting the findings are more
likely attributable to social motivators being less effective in ASD, than to a primary SA
deficit. Johnsonb et al (2007) claimed that variability in response time (RT) is an important
measure in SA tasks which was not measured by Buchsbaum or Garretson; thus Johnsonb
(2007) measured RT but still observed intact sustained attention in children with ASD
compared to controls.
More recently it’s been suggested that individuals with ASD may have superior abilities to
sustain attention, particularly on topics or objects that interest them (Plaisted et al, 2009).
This may explain repetitive behaviours such as lining up toy cars or counting matchsticks.
This has been demonstrated by individuals with ASD displaying superior performance on
embedded figures tasks which require focused attention for a period of time (Jolliffe et al,
1997). A narrow focus of attention has been acknowledged as a deficit of attention in ASD
Page 9
4
(Lovaas et al, 1979), however research on the extent to which this can be applied to
sustaining attention over time is limited. Thus, the nature of sustained attention deficits in
autism remains to be fully determined (Johnsonb, 2007).
1.4 Divided Attention in Autistic Spectrum Disorders
Dividing attention (DA) involves concentrating on two things at once, however Herings’
(1977) law of equal innervation states it’s impossible to look in two places at once as both
eyes are controlled as a single organ; thus with regards to visual DA one must essentially
move their eyes in order to meet dual task requirements. A DA deficit ‘implies a reduced
ability to process high levels of cognitive load simultaneously’ (Althaus et al, 1996). Like SA,
DA is also associated with academic achievement: Mizuno et al (2012) observed
relationships between poor divided attention, fatigue, and low academic motivation in
junior high school children, which affected educational performance. Furthermore Warshaw
(1979) demonstrated that improved DA lead to improved academic performance. This may
be due to the importance of being able to divide attention in a classroom setting between
the teacher and the work; thus DA is an essential skill required in order to learn new things
and rehearse new skills in everyday scenarios (Huang, 2001), and difficulties here may affect
learning.
Most research on ASD and DA has focused on dividing attention across different modalities
(e.g. visual and auditory). This may be because being able to DA between simultaneously
perceived perceptual signals is argued to be crucial for social behaviour (Magnee et al,
2011), which is seen as a defining deficit in ASD. A number of studies show support for a
cross-modal divided attention deficit in ASD. Allen et al (2001) found an impaired ability in
autistic participants to divide attention between visual and auditory sources of information.
Likewise Courchesne et al (1994) hypothesized a deficit in ability to disengage attention in
ASD; which was demonstrated in the increased reaction time when required to shift
attention between modalities in autistic participants compared to controls. Similar findings
were demonstrated by Magnee (2011), Ciesielski et al (1995) and Casey et al (1993),
although Bogte et al (2009) argued that the sample size was too small in the latter two
studies (n=8, n=10). Furthermore Casey (1993) did not screen for psychotropic medication
Page 10
5
known to have an effect on reaction time (Scheepers et al, 2001), which may have
confounded results.
There is inconsistent evidence surrounding whether DA is governed across or within
modalities (i.e. both visual tasks), although Navon and Gopher (1979) suggest it’s harder to
divide attentional resources when tasks are from the same modality due to interference;
which is consistently agreed upon (Alais et al, 2006); and what is essentially required in a
classroom setting when paying attention to the teacher and the work. Some studies have
shown a deficit of DA in ASD children at a modality specific level (Pierce et al, 1997;
Koldewyn et al, 2012; Landry et al, 2004, Swaab-Barneverd, 1998). For example Althaus
(1996) tested 19 children aged 8 to 12 with a diagnosis of Pervasive Developmental Disorder
(PDD) using the Shiffrin and Schneider (1977) paradigm, which involved only a visual
stimulus modality to be triggered. The results demonstrated a significant impairment in
reaction time when PDD children were required to divide attention, compared to
intelligence and age-matched controls. Similarly, Wainwright-Sharp and Bryson (1993)
found deficits in autistic individuals ability to shift attention within the visual modality
throughout Posner's (1978) visual orienting task, demonstrated by their failure to display
the normal reaction time advantage which is expected for correctly cued targets. Moreover
children with ASD have self-reported difficulties on tasks that require DA, and often adapt
different strategies compared to controls on these tasks (O’Neill et al, 1997).
Despite the wealth of literature that proposes a DA deficit in ASD, a handful of studies
oppose these findings and propose typical or improved DA in ASDs. Bogte et al (2009)
observed a DA deficit in a visual search paradigm, but only in ASD participants that were
taking psychotropic medication; it has already been established that this medicine affects
reaction time. Although this study suggests no DA deficit in ASD participants not taking
medication, discrepancies with past research may be due to an adult sample, as it not fully
understood how DA develops with age (Hill, 2004), although it has been suggested that the
extent of secondary task interference during childhood declines with age (Guttentag, 1989).
Furthermore Rutherford et al (2007) found subjects with autism performed better on a
visual search paradigm under DA conditions than controls, suggesting a DA advantage in
ASD. In this study participants were not required to expand attentional focus, or integrate
Page 11
6
information across different parts of the visual field, thus the differences in results may be
accounted for by different stimuli.
It’s difficult to understand attention deficits in ASD independent of their association with
social difficulties. It’s long established that children with ASD have problems attaining to
social stimuli, for example poor eye contact with parents (Kope et al, 2001). Recent research
by Shic et al (2011) suggests young children with ASD pay more attention to non-social
objects and less attention to social aspects of the environment than typically developing
children, which may affect learning in school if the child struggles to pay attention to the
teacher (Dawson et al, 2012), as the teacher is a social aspect of the environment.
1.5 The Present Study
The present study was a constituent part of ‘Born in Bradford’ (BIB) research. The born in
Bradford study is following 13,500 children in Bradford from birth to adulthood to track
their health, and identify those at increased risk of health problems. The rationale behind
BIB study stems from the fact that Bradford is one of the most deprived areas in the UK,
with infant mortality being consistently above national averages, thus the need for new
health and social interventions to assist children more effectively with disorders such as ASD
is essential. A large focus is also being placed on improving academic achievement as the
children begin education. The present study explores the relationship between sustained
and divided attentional abilities across a continuum of ASD traits in a stratified random
sample of 80 children from a primary school in Bradford.
Past studies have focused on measuring attention in individuals diagnosed with ASD
compared to typically developing individuals. There are disadvantages of using a ‘between-
group’ approach in studies of this nature, as it’s well established that ASDs are not definite
single disorders, but rather they exist along a continuum with different levels of severity.
Disadvantages of between-group studies include: an overrepresentation of severe ASD as
participants must have had significant symptoms to acquire a clinical diagnosis; small
sample size as it’s hard to recruit a large group of diagnosed autistic children (Corbett et al,
2006); risk of a false diagnosis of ASD from clinician which may lead to false conclusions;
difficulty generalizing results to the general population; and an overrepresentation of males
as it’s well established that ASD affects significantly more males than females (Fombonne,
Page 12
7
2009) . Thus a ‘population’ based study, involving a normally developing population of
children was deemed more appropriate for this study, as such a sample is more likely to
contain a normal distribution of children displaying different levels of ASD traits on a
continuum that is representative of the general population.
1.5.1 Sustained and Divided Attention Measures
One of the most common ‘gold standard’ tools used to measure SA in ASD children is the
Continuous Performance Task (CPT) which requires participants to concentrate on repetitive
tasks in order to correctly respond to targets, or inhibit responses to non-target stimuli
(Shalev et al, 2011). There are a range of CPT’s including Connor’s CPT, IVA, GDS and
T.O.V.A., which measure correct responses, reaction time, and commission and omission
errors (Connor’s, 2000; Impara et al, 1998; Gordon et al, 1988). The CPT score is compared
against a norm score matched for age and gender (Connor’s, 2000).
To date there is no well-established tool to measure DA in children. Current methods used
to assess divided attention usually involve a variation of the CPT with an additional task
included e.g. counting or listening to auditory stimuli (Salthouse, 2003). Most have involved
dividing attention across different modalities, despite previous research suggesting it’s
harder to divide attentional resources when tasks are from the same modality (Navon et al,
1979).
However the ability of CPT’s too accurately measure attention has been questioned;
Sanders et al (2007) argues CPTs are more a measure of performance deterioration than
accuracy levels. Likewise correlations between omission errors and poor attention are low
suggesting omission errors may not always be an accurate measure of low attention when
used alone (Barkley, 1990). In addition low correlations have also been reported between
parent and teacher ratings of child’s behaviour and CPT’s (Lovejoy et al, 1990), challenging
its validity. Attention is a highly fluid process that fluctuates; despite this CPT’s do not
currently measure intra-individual variability (stability of attention throughout duration of
task; Hill et al, 2012).
The present study will attempt to overcome these issues by assessing sustained and divided
attentional abilities objectively on a portable tablet laptop developed by Culmer et al in
Page 13
8
2009, which can be used in a classroom setting whilst still ensuring accuracy and power of
laboratory measures. The visuo-motor attention measure that runs off the laptop was
created by Hill et al (2012) to obtain objective measurements of SA and DA. The measure
has advantages over CPT’s as it measures intra-individual variability which has been shown
to vary more in children with attention deficits compared to controls on serial reaction time
tasks (Helps et al, 2011); it also requires attention to be divided across a specific visual
modality which is essentially what is required in a classroom setting when children divide
attention between the teacher and the work in front of them. In addition the attention
measure has high ecological validity as the task requires movements similar to those made
when handwriting. In summary the task provides a measure of SA and DA associated with
previous CPT tasks, in addition to visuo-motor measures of attentiveness (Hill et al, 2012).
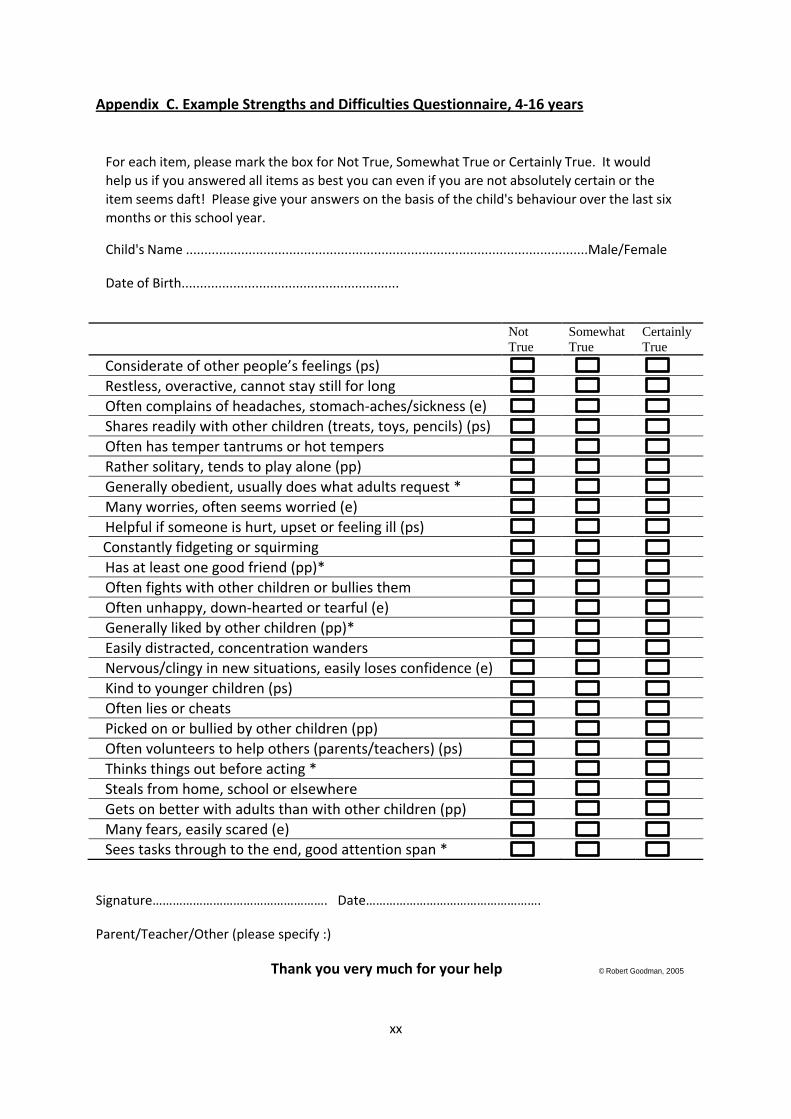
1.5.2 Strengths and Difficulties Questionnaire
The strengths and difficulties questionnaire (SDQ) is used to screen behaviour in children
aged 3-16 against a norm reference group (see appendix C). It was developed in the 1990s
by psychiatrist Robert Goodman (Goodman, 1997) and consists of 25 items measuring
psychological attributes: 4 scales measuring difficulties (emotional symptoms, conduct
problems, hyperactivity, and peer problems), and 1 scale measuring strengths (pro-social).
The questionnaire can be downloaded for free and filled out by parents, teachers or
children and takes on average 5 minutes to complete. SDQ scores have good concurrent
validity (correlate with other psychopathology measures), internal consistency, and test-re-
test reliability (Russell et al, 2012).
A study by Iizuka et al (2010) previously examined SDQ subscales in children with ASD. They
found that compared to controls, ASD children scored significantly higher on emotional
symptoms and peer-problems scales when rated by parents, and higher on peer-problems
and lower on pro-social behaviour when rated by teachers. Posserud et al (2008) found
most of the variance in the Autism Spectrum Screening Questionnaire was explained by a
single factor of social interaction, which strongly correlated with the peer problems SDQ
scale. Russell et al (2012) further demonstrated that the pro-social scale strongly correlated
with an autism diagnosis in the Avon Longitudinal study of Parents and Children (ALSPAC)
cohort. In addition these three subscales were previously analyzed and combined as a
Page 14
9
measure of ASD traits (O’Neill, 2012). Iizuka et al (2010) reiterated that the SDQ is a
screening tool to help indicate further services or treatment that may be required, and is
not a diagnostic tool itself.
Based on these findings, the current study will explore relationships between the emotional
symptoms (marked ‘e’ in appendix C), peer-problems (marked ‘pp’ in appendix C) and pro-
social behaviour (marked ‘ps’ in appendix C) SDQ scales and the attention measures. SDQ’s
will be completed by teachers as they can observe how children interact with a number of
other pupils and adults on a daily basis. Each item is marked either ‘not true’ = 0, ‘somewhat
true’ = 1 or ‘certainly true’ = 2 for all items except those where scoring is reversed (see
items with a * in Appendix C). An overall score for each scale ranging from 0-10 is devised by
summing up each item in the scale.
1.6 Aims and Research Question
Aim
The aim of the study is to explore sustained and divided attentional abilities of children
along a continuum of autistic spectrum disorder traits.
Research Question
Does the presence of autistic traits (as measured by the SDQ) influence performance on
tasks that require sustained attention or divided attention. Previous literature suggests that
performance on these tasks will be differentially affected.
Page 15
10
2. Methods
2.1 Participants
All participants were recruited from Allerton Primary School in Bradford that is part of the
‘Born in Bradford Cohort’, through an opportunistic sample, aged between 7 and 11 years
old. Around 250 participants were tested, however a random sample of 80 of these (20 from
each year) stratified for sex, were included for analysis due to time limits (N=80, male =40,
female =40, right handed =72, left handed=8).
Teachers at the school informed researchers that children under age 7 may struggle to
perform the attention task, thus a pilot study was conducted on a group of children from
year 2 (age=6). As suspected they struggled to comply with task demands (e.g. switching
stylus in hands, lifting pen off screen). Due to this the current study only tested children
from year 3 and above.
The sample represents children in diverse mainstream education, thus some
neurodevelopmental disorders are presumed to be under diagnosed due to the low socio-
economic status of the area and high prevalence of genetic disorders.
2.2 Ethics
Ethical approval was obtained from the University of Leeds Institute Of Psychological
Sciences Research Ethics Committee. The study complied with the ethical standards set out
in the 1964 Declaration of Helsinki.
A parental ‘opt out’ form was distributed to all parents prior to their child’s inclusion in the
study. Children gave verbal consent before performing the task, and were informed that
they could leave at any time if they didn’t want to continue. All experimenters obtained
valid CRB checks to ensure safety of the children; and confidentiality of participants was
protected by ensuring all data was stored in secure computer files.
2.3 Design
The cross-sectional study was a repeated measures design as all children took part in all
attention tasks.
Page 16
11
2.4 Apparatus/Materials
2.4.1 Attention Measure
All visuo-motor attention tasks were carried out on a portable Toshiba Model Tecra M7
tablet computer (screen: 303x190mm, 1600x1200 pixels, 16 bit colour, 60 Hz refresh rate).
The screen rotated 180 degrees and folded down to resemble a normal horizontal writing
surface that participants could engage with using the pen shaped stylus (14cm x0.9cm
diameter). Integrated sensors measured the planar position of the stylus held in their
preferred writing hand at a rate of 120 Hz (Culmer et al, 2009).
The experimental tasks were run on a specialised software programme called KineLab
(created using the LabVIEW programming environment, version 8.21, National
InstrumentsTM). The tablet provides a highly portable device, allowing a measure of human
movement in configurable visuo-spatial tasks. Culmer et al (2009) claimed ‘kinelab consists
of a framework that: (i) enables rapid development of standardised kinematic assessment
trials; (ii) conducts interactive assessment trials and records kinematic data; (iii) automates
data analysis to generate standardised performance metrics’. For a full overview of the
KineLab software see Culmer, Levesley, Mon-Williams & Williams (2009).
2.4.2 Strengths and Difficulties questionnaire
The SDQ (Goodman, 2005) was accessed and downloaded on 01/12/2012 from:
http://www.sdqinfo.org/py/sdqinfo/b3.py?language=Englishqz(UK)
The pro-social behaviour subscale was reversed so a higher score now meant less pro-social
behaviour, indicating higher ASD traits (Russell et al, 2012). This enabled the subscales to be
grouped together by ensuring all scores were in the same direction as higher scores on peer
problems and emotional symptoms subscales also indicate higher ASD traits (Iizuka et al,
2010).
2.5 Procedure
Participants entered the testing room and were briefed in groups of 7. Each participant then
sat at a table with an experimenter who ensured they could comfortably access the laptop.
After entering participant’s details into the laptop, the screen was rotated, folded down,
and placed at a comfortable distance in front of each participant on the table so they could
Page 17
12
easily complete the tasks. Handedness was established by placing the stylus in front of the
participant and asking them to hold it with the hand they usually write with. All participants
previously completed a C-KAT task on the tablet (testing motor abilities – Culmer et al,
2009) as part of a co-existing study with a delay of between 2 hours to 10 days before
completing the attention task.
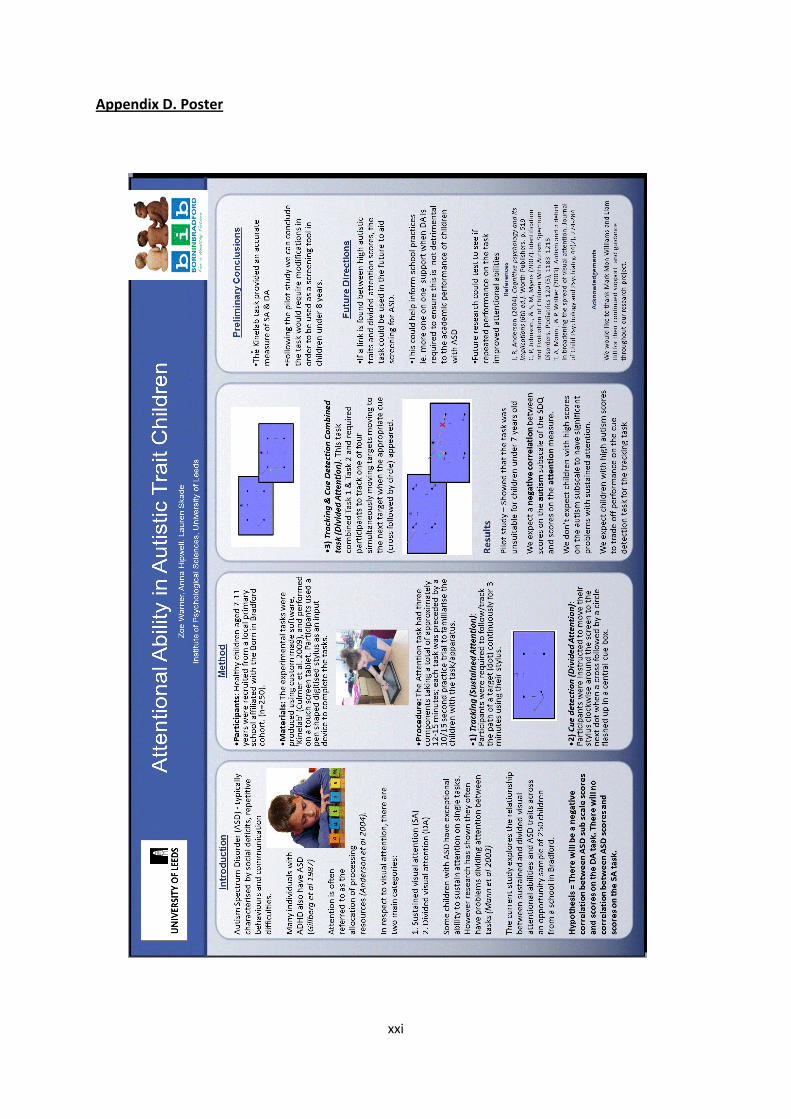
Participants were informed there would be 3 attention games: tracking, shape-spotting and
a combined task, lasting 3 minutes each. All instructions were displayed in clear,
comprehendible language on the screen (including screen shots of each game), however
due to the young age of participants the experimenters also orally explained the
instructions. A practice trial lasting 10-15 seconds preceded each game allowing
participants to become familiar with the stylus and tasks. Throughout all the trials
participants were encouraged to keep the pen touching the screen at all times to ensure
accurate recording of data.
The first two games were baseline measures indicative of sustained attention performance.
These baseline measures allowed performance on the tasks to be compared between single
and dual task conditions (when both games were combined), to provide a measure of
participants’ ability to divide attention. The basic layout was similar for all games: four dots
on the screen, one in each corner connected by arrows stating the direction in which
participants should move the stylus. There was also a small cue box at the top of the screen
in the centre. The following information describes what was different about each task:
Tracking task – sustained attention
Participants were instructed to place the stylus on the bottom left-hand red dot (figure a)
and after a two second delay begin tracking the dot as it moved around the screen in the
bottom left-hand quadrant (figure b). Participants were instructed to keep the tip of the
stylus as close as possible to the centre of the dot. This task provided a baseline measure of
sustained attention performance.
Performance was recorded in the form of a time-series of Tracking Errors (TEs), which are
the straight line distances between the dots centre and the stylus, recorded 120 times per
second. TEs were square-root transformed and summarised by the mean to give root mean
Page 18
13
square (RMS) and standard deviation (SD) of errors. Larger scores on these outcomes imply
lower accuracy and greater fluctuation in performance (Culmer et al, 2009).
Figure a. Tracking task Figure b. Dot turns black and
begins to move
Shape Spotting Task – sustained attention
Participants held the stylus on the bottom left-hand red circle which after a two second
delay prompted shapes to flash in the cue box for 0.5 seconds each (figure c). When
participant’s detected a ‘cross’ followed by a ‘circle’ in the cue box, they were required to
move the stylus to the next stationary dot as stated by the arrows (figure d); they continued
to do this for the remainder of the trials. Participants were instructed not to guess and only
to move to a new circle when they were certain. This task was also a baseline measure of
sustained attention.
Performance was recorded in terms of correct reactions (CRs) in which the correct target
was moved to. A second analysis was mean reaction time (MRT) in seconds, calculated for
valid reactions only. This indicated processing speed of participants in response to cues.
False reactions (FRs) were defined as the number of switches to another target made
despite no valid cue being present.
Figure c. Shape spotting task Figure d. Cross followed by a circle prompted
move to next dot
Page 19
14
Tracking and Shape Spotting combined task – measure of divided attention
This task involved a combination of the tracking and shape spotting tasks, to measure the
degree to which performance changed under dual task compared to single task conditions;
providing a measure of divided attention. Participants began with the stylus on the red dot
in the bottom left-hand corner of the screen, and after a 2 second delay all four dots began
to move in their own quadrants (figure e). Participants were instructed to track the current
dot by keeping the stylus at close to the centre of the dot as possible, whilst at the same
time paying attention to the shapes in the cue box (figure f). When they detected a ‘cross’
followed by a ‘circle’ in the box, they were instructed to move the stylus clockwise to the
next moving dot and begin tracking the new dot (figure g).
Performance measures for the previous two tasks were all measured in this task.
Figure e. All four dots moving Figure f. Tracking current dot
and shape spotting
Figure g. Moving stylus to track next dot after
detecting required shape sequence
2.6 Analysis
2.6.1 Measures
Overall SDQ score was obtained by summing up the reversed pro-social behaviour,
emotional difficulties, peer problems, hyperactivity and conduct problem scores. Higher
scores on all indicate more behaviour difficulties.
Page 20
15
A composite ASD trait score was derived for each child by summing up the reversed pro-
social behaviour, emotional difficulties and peer problem scores. A higher score indicates
more ASD traits.
Complete SDQ and attention battery data sets were collected for all participants. Composite
scores for sustained, divided and overall attentional abilities were created from each
participant’s performance on the attention task.
Z scores were created for each variable by taking a variable e.g. RMS, and from each RMS
score subtracting the mean value of all RMS scores before dividing by the standard
deviation of RMS. This enabled all scores to be converted into the same standardised unit so
they could be grouped and compared against each other.
Composite Sustained Attention score
For each participant Z scores were created for the root mean square (RMS) and standard
deviation (SD) of error for the tracking task; which were averaged to give an overall SA
tracking score. Z scores were also created for the number of correct reactions (No.CR’s),
number of false reactions (No.FR’s), and mean reaction time (MRT) for the cue detection
task; which was averaged to give an overall SA cue-detection score for each participant. A
composite SA score was created by averaging all 5 subscales (i.e. RMS, SD, No.CR’s, No.FR’s
and MRT)
For the purpose of analysis, the No.CR’s subscale was reversed for SA measures so that a
lower score indicated better performance in line with the No.FR’s, MRT, RMS and SD
subscales. Original scores were used for No.CR’sDTD as this is a measure of the difference
between scores from single to dual-tasking, and this difference remains the same even after
reversing No.CR’s for SA measures.
Composite Divided Attention score
Scores from each of the five SA subscales were subtracted from scores on each
corresponding subscale during the combined task to provide a score of dual task difference
(DTD) for each subscale (e.g. MRT on combined task – MRT on SA cue-detection). This
indicated participants change in performance on the combined task compared to the single
tasks, after adjusting for participant’s basic tracking and cue-detection ability. This lead to
Page 21
16
five new subscales: RMSDTD, SDDTD, No.CR’sDTD, No.FR’sDTD, MRTDTD. These indicated
participant’s ability to divide attention; higher scores on all measures indicated a greater
decrement in performance between the two tasks.
Z scores were then created for each of these five DTD subscales. Z scores for RMSDTD and
SDDTD were averaged to give an overall tracking DA score. Z scores for No.CR’sDTD, No.FR’sDTD
and MRTDTD were averaged to give an overall cue-detection DA score. A composite DA score
was created by averaging all 5 DTD subscales.
Overall attention score
SA tracking, SA cue-detection and overall DA Z scores were averaged to provide an overall
measure of performance on the attention tasks for each child.
2.6.2 Statistics
Preliminary correlations were conducted for the overall SDQ score and ASD trait measures
(dependent variable) with the attention measures (Independent variables). Linear
regressions were then conducted to examine these relationships in more detail; these
included semi-partial correlations controlling for age. All data was statistically analysed
using IBM SPSS 20. Relationships and variance explained were considered significant at
p<.05.
Page 22
17
3. Results
3.1 Correlations
Preliminary analysis to investigate relationships between the attention measures and total
SDQ score were conducted using Pearson’s correlation coefficient (r).
Table 1. Correlations for composite attention measures and total SDQ score.
Measure Composite overall
attention score
Composite DA score Composite SA score
Total SDQ score r(80)=.478** r(80)=.285* r(80)=.368**
*=p≤0.05, (2-tailed
**= P≤0.01, (2-tailed)
All composite attention measures correlated significantly with total SDQ scores, showing the
higher a participant’s overall SDQ score is (more difficulties), the higher their attention
scores are (indicates lower performance).
Furthermore, Pearson’s correlation coefficient (r) was used to determine relationships
between attention measures and ASD traits as measured by the SDQ.
Table 2. Correlations for composite attention measures and ASD trait measures.
Measure Composite overall
attention score
Composite DA score Composite SA score
Composite ASD
traits
r(80)= .372**
r(80)= .128 r(80)= .318**
Reversed pro-social
behaviour
r(80)= .395** r(80)= .234* r(80)= .305**
Peer problems
r(80)= .306** r(80)= .025 r(80)= .291**
Emotional
symptoms
r(80)= .395** r(80)= -.025 r(80)= .054
*=p≤0.05, (2-tailed
**= P≤0.01, (2-tailed)
Significant correlations were found for composite ASD trait scores with overall attention and
SA scores, demonstrating that as participants display more ASD traits they perform less
Page 23
18
accurately on SA tasks indicated by higher scores. Significant correlations were also found
for overall attention scores and ASD trait subscales. The reversed pro-social scale was the
only ASD trait subscale that correlated significantly with all attention measures. This shows
that as participants display less pro-social behaviour (higher reversed pro-social score), they
perform less accurate on all attention measures.
3.2 Linear regressions
3.2.1 Divided Attention, Sustained Attention and Composite ASD traits
A strong positive relationship was found between composite attention measures and total
SDQ scores, however further analysis was required to deeper explore relationships between
attention tasks and composite ASD trait scores.
Separate linear regressions indicated that overall attention, and composite SA scores
explained a significant amount of variance in the composite ASD traits, with overall
attention measure explaining 14% (r2= .14, F (1, 78) = 12.5, p<0.001), and SA measure
explaining 10% of the variance (r2= .10, F (1, 78) = 8.8, p<0.01). No significant effect was
found between composite DA score and ASD traits (r2= .02, F (1, 78) = 1.3, p=0.257).
Two outlier’s above three standard deviations from the mean were identified in SA scores
by analysing descriptive statistics. When excluding outliers from linear regressions; SA score
then explained a borderline significant amount of variance in ASD traits (r2= .05, F (1, 76) =
3.9, p=00.53), however outliers were chosen to be included in further analysis, as it’s likely
that these scores were true representations of the participants abilities.
3.2.2 Semi-partial correlation controlling for age
Pearson’s correlation coefficient (r) showed a significant negative relationship between age
and SA (r(80) = -.482, p<0.001 (1-tailed)), demonstrating that SA improved with age.
Because of this a semi-partial correlation is appropriate to control for age, which
demonstrated there was still a significant effect of SA when controlling SA for age. Age
didn’t need to be controlled for the ASD trait measures as age is taken into account by
teachers when completing SDQ’s.
Page 24
19
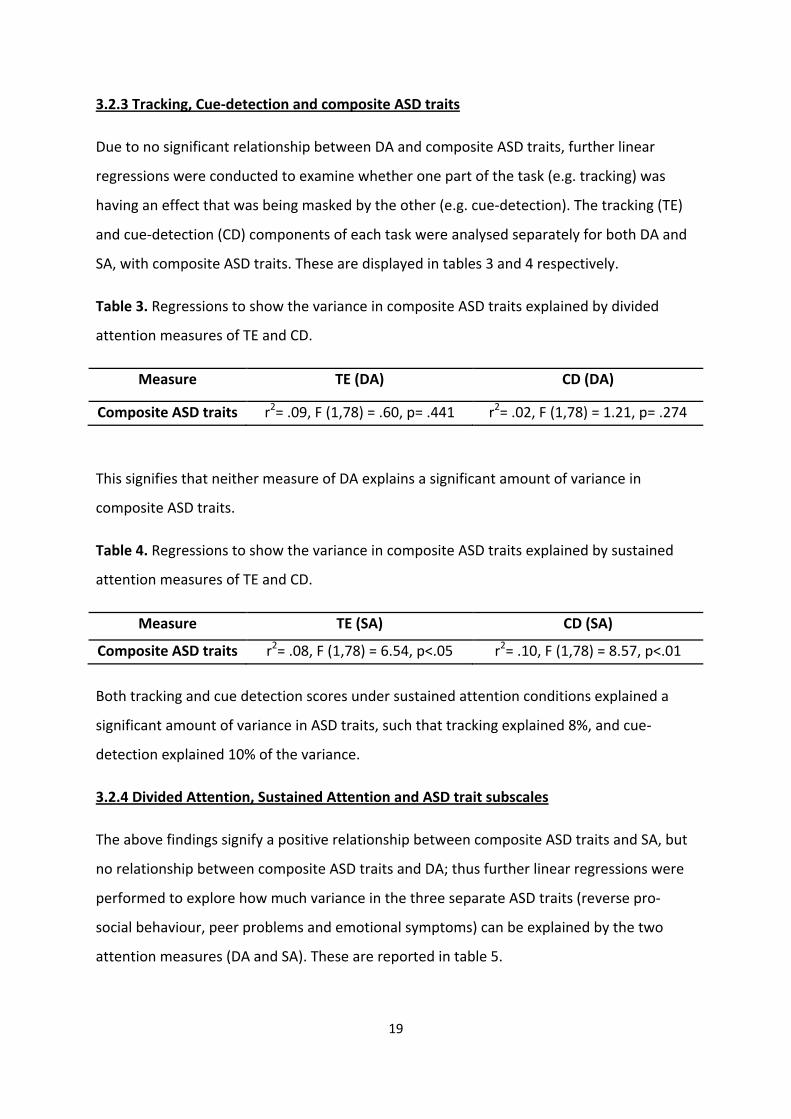
3.2.3 Tracking, Cue-detection and composite ASD traits
Due to no significant relationship between DA and composite ASD traits, further linear
regressions were conducted to examine whether one part of the task (e.g. tracking) was
having an effect that was being masked by the other (e.g. cue-detection). The tracking (TE)
and cue-detection (CD) components of each task were analysed separately for both DA and
SA, with composite ASD traits. These are displayed in tables 3 and 4 respectively.
Table 3. Regressions to show the variance in composite ASD traits explained by divided
attention measures of TE and CD.
Measure TE (DA)
CD (DA)
Composite ASD traits r2= .09, F (1,78) = .60, p= .441 r2= .02, F (1,78) = 1.21, p= .274
This signifies that neither measure of DA explains a significant amount of variance in
composite ASD traits.
Table 4. Regressions to show the variance in composite ASD traits explained by sustained
attention measures of TE and CD.
Measure TE (SA)
CD (SA)
Composite ASD traits r2= .08, F (1,78) = 6.54, p<.05 r2= .10, F (1,78) = 8.57, p<.01
Both tracking and cue detection scores under sustained attention conditions explained a
significant amount of variance in ASD traits, such that tracking explained 8%, and cue-
detection explained 10% of the variance.
3.2.4 Divided Attention, Sustained Attention and ASD trait subscales
The above findings signify a positive relationship between composite ASD traits and SA, but
no relationship between composite ASD traits and DA; thus further linear regressions were
performed to explore how much variance in the three separate ASD traits (reverse pro-
social behaviour, peer problems and emotional symptoms) can be explained by the two
attention measures (DA and SA). These are reported in table 5.
Page 25
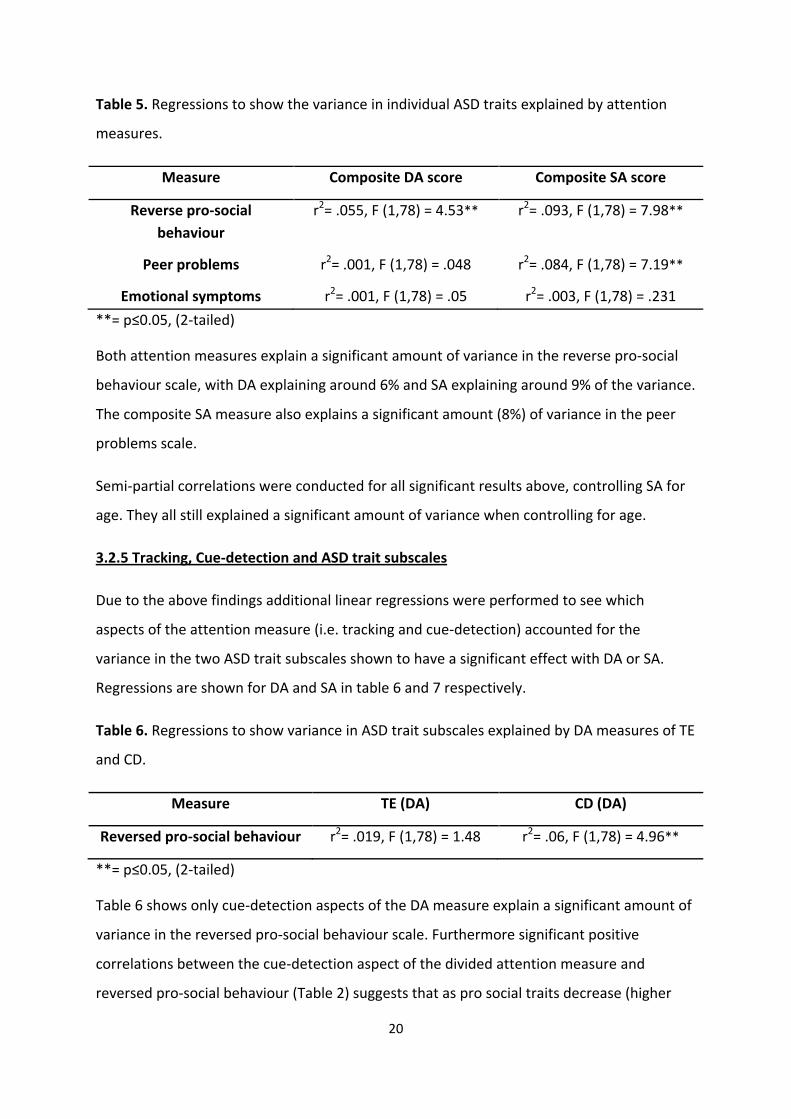
20
Table 5. Regressions to show the variance in individual ASD traits explained by attention
measures.
Measure Composite DA score
Composite SA score
Reverse pro-social
behaviour
r2= .055, F (1,78) = 4.53** r2= .093, F (1,78) = 7.98**
Peer problems
r2= .001, F (1,78) = .048 r2= .084, F (1,78) = 7.19**
Emotional symptoms r2= .001, F (1,78) = .05 r2= .003, F (1,78) = .231
**= p≤0.05, (2-tailed)
Both attention measures explain a significant amount of variance in the reverse pro-social
behaviour scale, with DA explaining around 6% and SA explaining around 9% of the variance.
The composite SA measure also explains a significant amount (8%) of variance in the peer
problems scale.
Semi-partial correlations were conducted for all significant results above, controlling SA for
age. They all still explained a significant amount of variance when controlling for age.
3.2.5 Tracking, Cue-detection and ASD trait subscales
Due to the above findings additional linear regressions were performed to see which
aspects of the attention measure (i.e. tracking and cue-detection) accounted for the
variance in the two ASD trait subscales shown to have a significant effect with DA or SA.
Regressions are shown for DA and SA in table 6 and 7 respectively.
Table 6. Regressions to show variance in ASD trait subscales explained by DA measures of TE
and CD.
Measure TE (DA)
CD (DA)
Reversed pro-social behaviour r2= .019, F (1,78) = 1.48
r2= .06, F (1,78) = 4.96**
**= p≤0.05, (2-tailed)
Table 6 shows only cue-detection aspects of the DA measure explain a significant amount of
variance in the reversed pro-social behaviour scale. Furthermore significant positive
correlations between the cue-detection aspect of the divided attention measure and
reversed pro-social behaviour (Table 2) suggests that as pro social traits decrease (higher
Page 26
21
reverse pro-social scores), performance decrement on task increased between single and
dual task conditions but only for the cue-detection part of task, as indicated in table 6.
Table 7. Regressions to show variance in ASD trait subscales explained by TE and CD
sustained attention measures.
Measure TE (SA)
CD (SA)
Reversed pro-social behaviour r2= .8, F (1,78) = 6.79**
r2= .78, F (1,78) = 6.57**
Peer problems r2= .076, F (1,78) = 6.44** r2= .066, F (1,78) = 5.53**
**= p≤0.05, (2-tailed)
Both sustained attention tasks explain a significant amount of variance in the reversed pro-
social and peer problems scales. Pearson’s correlation coefficient (r) depicts a significant
correlation (Table 2), suggesting that as pro-social behaviour decreases (higher reverse pro-
social score) and peer problems increase, scores on both tasks of sustained attention also
increase (indicating worse performance).
Page 27
22
4. Discussion
4.1 Summary of Findings
This study explored the relationship between primary school children’s sustained and
divided attentional abilities and ASD traits as measured on a continuum using the SDQ.
Initially the results revealed a relationship between composite ASD traits and sustained
attention but not divided attention. Only the SA measure significantly correlated with the
composite ASD trait measure; linear regressions suggested that the SA measure explained a
significant amount of variance in the composite ASD trait measure; however the DA
measure did not. Due to a significant relationship between age and SA, a semi-partial
correlation was carried out which demonstrated there was still a significant effect of SA
when controlling for age.
Further Linear regressions were conducted to investigate the relationship between
constituent parts (tracking and cue-detection) of the attention measures with the composite
ASD trait measure. This signified that both tracking and cue-detection tasks under sustained
attention conditions explained a significant amount of variance in ASD traits; however there
were no significant effects for either part of DA task.
Due to the fact that preliminary analysis revealed a correlation between both sustained and
divided attention measures and total SDQ score, suggesting there may be a relationship that
isn’t being captured by the composite ASD trait measure; further linear regressions were
employed to explore how much variance in the three separate ASD trait subscales could be
explained by the attention measures. Both attention measures explained a significant
amount of variance in the reversed pro-social behaviour scale; the SA measure explained a
significant amount of variance in the peer problems scale; and neither measure explained a
significant proportion of the emotional symptoms scale. This was still the case when semi-
partial correlations were employed to control for age on attention measures.
Additional linear regressions were employed as before to examine the relationship between
constituent parts of both attention measures with these ASD trait subscales. Only the cue-
detection aspect of the DA measure explained a significant amount of variance in the
Page 28
23
reversed pro-social behaviour scale. Both SA measures explained a significant amount of
variance in the reversed pro-social and peer problems scales.
Finally the results revealed that the attention measure was unsuitable for children under
the age of 7 years old.
4.2 Implications
Initially the results suggest that the more ASD traits a child possesses, as indicated by the
composite ASD trait measure, the poorer their ability to SA. Furthermore, no relationship
between DA and the composite ASD trait measure was established. This contradicts the
results found by the majority of previous research that suggest children with ASD have no
deficits of SA (Buchsbaum et al, 1992; Noterdaeme et al, 2001; Johnsonb et al, 2007), but
difficulties in ability to DA (Althaus, 1996; Koldewyn et al, 2012; Swaab-Barneverd, 1998).
One reason for contrasting results may be partly due to ‘floor effects’, as Participants who
displayed more ASD traits may have performed particularly poor on the SA task such that
performance couldn’t get much worse on DA tasks. Alternatively it may be due to the
present study summing up the subscales of the SDQ that have been validated by previous
research as representing ASD traits (Iizuka et al, 2010; Russell et al, 2012, Posserud et al,
2008), into a composite ASD trait score. When analysing the separate subscales of the ASD
traits (pro-social behaviour, peer problems and emotional symptoms), results suggest that
comorbid attention problems may relate to certain aspects of ASD traits but not others;
which may be hidden when utilising the composite ASD trait measure. Results from the
current study suggest that the low pro-social behaviour trait of ASD may be more related to
poor attention than the other ASD trait subscales of the SDQ. It makes sense to suggest that
if there is a relationship between low pro-social behaviour and poor attention that a child
with ASD who displays poor social behaviour such as ‘not helping someone who is hurt or
feeling ill’ may possibly behave like this partly because they are not paying attention to the
situation (Kanner, 1943). This is in line with previous research that states it’s difficult to
understand attention deficits in ASD independent of their association with poor social
behaviour (Kope et al, 2001). Thus although emotional symptoms and peer problems may
be traits of ASD, they may not have a strong relationship with any attentional deficits that
may be present.
Page 29
24
Alternatively ASD traits may be effectively captured by the pro-social scale of the SDQ alone,
in the absence of any increased predictive value coming from the other two subscales.
Evidence for this stems from research by Goodman (1997) which proposes that the pro-
social subscale of the SDQ explains more variance in ASD than the other scales, and
furthermore has shown to be strongly associated with an ASD diagnosis in the ALSPAC
cohort (Russell et al, 2012). Likewise previous research by Russell et al (2010) found a ‘four
fold increase in the odds of an ASD diagnosis for decreasing pro-social behaviour’. Although
the exact SDQ scales used to assess ASD traits often varies between studies (Afshari, 2012).
Despite this, ASD does not manifest a primary behaviour issue relating to attentive
capacities. Thus although results from this study have shown slightly different
interpretations of results depending on how ASD traits are scored, the study does not aim to
validate one SDQ scoring method for ASD traits over another. The key finding is however,
that attention capacity does appear to be poorer in those children who display greater ASD
traits (in particular low pro-social behaviour); suggesting attention is possibly a comorbid
deficit in ASD alongside the defining feature of social and communication impairments. This
replicates results from previous research that suggests there is a relationship between ASDs
and attentional difficulties (Sturm et al 2004), including a deficit in the ability of children
with ASD to DA across a specific modality (Alais et al, 2006; Wainwright-Sharp & Bryson,
1993; Pierce et al, 1997). Although the majority of past research implies there is no deficit in
the ability to sustain attention in ASD, more recent research is consistent with the present
finding that children with ASD do have difficulties sustaining attention (Corbett et al, 2006;
Cristakou et al, 2013). As both sustained and divided attention have a relationship with
academic achievement (Gordon et al, 1994); deficits in these areas may help explain why
children with ASD often show poor performance in school (Dickerson et al, 2003). This has
possible implications for providers of education, in terms of providing strategies and
assistance to ensure these children can fulfill their academic potential. In addition to this the
present study suggests that these attentional difficulties exist along a continuum of ASD
traits; as the number of ASD traits a child shows as rated by teachers on the SDQ increases
(in particular low pro-social behaviour), a decrease in the child’s ability to sustain and divide
attention is demonstrated.
Page 30
25
The findings from the present study may have implications for the ways in which ASDs are
diagnosed. Currently the DSM-IV-TR (2000) has three categories of impairments of which a
child must display a stipulated amount of symptoms from each in order to meet a diagnosis
of ASD. The three categories are: impairments in social interaction; impairments in
communication; and restricted, repetitive and stereotyped patterns of behaviour, interests
and activities (DSM-IV TR; American Psychiatric Association, 2000). No symptoms of
attention deficits are included in this diagnosis, despite past research and definitions
acknowledging that it may be an underlying problem in ASDs. For example Kanner’s (1943)
early description proposed that attention deficits were a symptom of ‘autism’, and Bolte et
al, (1999) suggested that attention problems were a ‘striking’ feature of ‘autism’.
When a clinician is attempting to diagnose a child that displays both ASD and attention
problems complications often arise; as the DSM-IV-TR precludes a dual-diagnosis of both
ASD and Attention Deficit Hyperactivity Disorder (ADHD). This has implications for the way
in which the child is treated, as they may not receive the medication and other treatments
that may benefit them. Kolevzon (2007) reports clinical trials that have demonstrated the
effectiveness of ADHD medication to manage attention deficits in individuals with ASD. Due
to these findings and previous studies that propose possible comorbidity between ASD and
ADHD (Goldstein et al, 2004), it may be in the child’s best interest to permit a dual-diagnosis
if they display both ASD traits and attention deficits; in order for them to acquire the most
beneficial treatment. Treatment for ASD could be further improved by varying the salience
of the treatment offered depending on the severity of ASD, as the present study
demonstrates that ASD traits exist along a continuum although the DSM-IV-TR currently
acknowledges ASDs as single disorders.
In addition, the current findings may aid in earlier identification of ASDs; if a parent or
teacher notices attention problems in a child alongside social problems it may provide an
earlier indicator of difficulties, which may lead to an earlier referral for the child to be
assessed by a clinician for ASD. Potentially attentional ability may be useful as a research
tool; the attention measure used in this study is able to objectively assess sustained and
divided attention, thus perhaps it may be a quicker and easier tool to aid in the diagnosis of
ASD traits, as it is much harder to objectively measure the defining features of social or
communication impairments which usually requires more complex measurements.
Page 31
26
4.3 Strategy adoption during dual-tasking in children displaying higher ASD traits
The finding that fewer pro-social ASD traits has a significant relationship with poorer
performance on the cue detection task but not the tracking task under dual task conditions
suggests that these children who displayed fewer pro-social ASD traits were prioritising the
tracking task over the shape spotting task in the combined condition. This implies they were
more interested in sustaining attention on the single tracking task than trying to divide
attention between the two tasks; thereby detrimentally affecting performance on the cue
detection aspect of the task. This finding contradicts past research that has demonstrated
that during dual-task conditions the requirement to divide attention hinders manual visuo-
motor performance (Kemper et al, 2010), which in turn would be expected to hinder
tracking. Specifically, the current study suggests that children that display higher levels of
ASD traits may be more focused on mastering hand movements required for the tracking
task than trying to focus on both tasks at once. This is in line with previous research that
suggests ASD individuals may have proprioceptive deficits (Weimer et al, 2001) which affect
their fine motor skills leading to difficulties in tasks such as handwriting (Fuentes et al 2009);
this may partly explain the finding in the present study as the hand-movements required for
the tracking task resemble those needed for handwriting, thus if they struggle with these
movements they may focus more of their attention on trying to get the movement right,
irrespective of the other task. This may in turn provide additional insights into the
difficulties children with ASD face in a classroom setting when trying to divide attention
between specifically writing and paying attention to something else (e.g. listening to
teacher); however the present study focused on modality specific interference during dual
tasking so this exact supposition cannot be verified.
4.4 The relationship between attentional abilities and ASD traits
Even though the current study has provided some promising results, it is unable to yield a
cause and effect relationship. It may be that the social and communication impairments, as
well as attentional deficits seen in ASD exist alongside each other. Alternatively one of these
difficulties may cause the other. This may be the case as a failure to sustain attention may
cause problems when communicating, as the child may not be able to engage in a
conversation or game long enough to be able to fully participate or be accepted by the
other children. Likewise a deficit in the ability to divide attention may lead a child with ASD
Page 32
27
to fail to pick up on the different social and non-verbal cues that guide inter-personal
interactions, as well as being unable to concentrate on social situations that require
attention to be paid to numerous stimuli (Kolevzon, 2007). On the other hand it could be
that having social and communication impairments results in poor attention skills, as these
individuals are less likely to be involved in social situations and conversations which require
them to engage their attention; thus they may have less chance to improve their attention
skills.
As previously discussed it is difficult to understand attention deficits in children with ASD
traits independent of the social difficulties they display. There is support for the proposition
that attention deficits may contribute to the poor social behaviour seen in ASD individuals.
For example Adrien et al (1993) found that attention problems observed during the first
year of a child’s life were indicative of increased chances of obtaining an ASD diagnosis one
year later. Recently Elsabbagh et al (2013) further suggested that children who develop
autism typically display deficits in visual attention from the first year of life. In addition,
Althaus (1996) proposed the idea that a deficit of DA in ASD children may underlie their
difficulties to adapt to unfamiliar situations; as adaptation to unfamiliar situations requires
novel information and existing information about the environment to be interpreted,
recognized and processed simultaneously. This is in line with Dawson et al (2012) who
hypothesized that reduced attention has negative consequences for social and language
development and learning, affecting the experience dependent circuitry utilized by these
domains.
In addition children with well-established attention deficits such as those with ADHD often
develop poor social relationships. Evidence for this is provided by Kane (2007) who studied
ADHD children; he concluded that the difficulties these children had in sustaining attention
led to rejection from other peers as they often got bored and forgot rules of games due to
inattention; this is likely to lead to withdrawal and feelings of low self-esteem (Hodgens et
al, 2000). This suggests that attention deficits may have a detrimental effect on social skills.
These findings propose that attentional abilities could be used as a potential indicator of
ASD traits. Improving attention in children with ASD traits may help improve their social and
communication skills that manifest themselves as the defining features of ASD.
Page 33
28
4.5 Limitations
There are some limitations in the present study. Despite the pilot study revealing the
demands of the attention measure were too difficult for children younger than 7 years of
age to comply with, some of the older children still struggled with the nature of the task. For
example during the divided attention condition, right handed participants often lifted the
pen off the screen when they were tracking the top left-hand dot in order to see the cue box
which was obstructed by their hand; left handed children showed similar behaviour when
tracking the top right-hand dot. In addition, the participants were not able to rest their hand
on the tablet to provide stability which they normally would when writing on paper, which
could have affected accuracy of hand movements.
In terms of data collection, although standardised instructions were used, there were 11
different researchers which may have led to participants receiving slightly different
variations of instructions. Furthermore the testing took place in an area of the school that
was open plan and often noisy at break times. This may have affected attention as Schmidt
et al (2008) proposed a relationship between attention and environmental noise which
could be indirectly effective in decreasing or increasing attention.
With regards to analysing the data, the composite measure of sustained and divided
attention may be too broad. Further research may benefit from looking at specific measures
of each task, for example specifically individual variability (IV) in performance; as previous
research established that IV alone provides information about attentiveness (Hill et al,
2012). The SDQ, whilst being a validated measure of behaviour relies on subjective
interpretations of difficulties by teachers. This may result in the ASD traits being scored
differently as teacher’s perceptions of what constitutes as a difficulty may be varied.
4.6 Future Directions
Future research could aim to develop the attention measure, and work towards a clearer
understanding of the associations between attention and ASD traits. Currently it’s a very
subjective decision by a teacher or parent to refer a child to a psychiatrist for suspected
ASD. In the future the attention measure could be used to establish unambiguously the
children who require further assessment for ASD traits. As it has been proposed that a
Page 34
29
potentially large number of children get excluded from school due to undiagnosed autism
(Skuse et al, 2010); a readily available measure like the attention task could be of use in
classrooms where it is easy for the child to carry out simple tests that may highlight
attention problems associated with ASD traits. Potentially this could help decrease the
number of undiagnosed cases of children with autism (Fombonne, 2009). This would be
particularly useful if the measure could be adapted for use on younger children so screening
could take place as early as possible.
The attention measure could potentially be a useful tool for the ‘Born in Bradford’ study if it
was administered to each child the same as the C-KAT motor battery already is. As this
cohort is known to have a high prevalence of undiagnosed genetic disorders, this tool could
assist in highlighting those children with attention problems which could indicate possible
ASD traits; thus allowing early intervention and screening to take place to enable the
children to receive the assistance and treatment they require.
Further research could test to see if repeated performance on the visuo-motor attention
task improves attentional abilities in children displaying more ASD traits, as Afshari (2012)
showed that perceptual-motor training for children with autism increased their attention
abilities. This could be useful as findings from past research suggest that if attention can be
improved in school, an increase in school performance may also be observed (Rabiner et al,
2010). Educational adaptations may be required to compensate for the possible attention
deficit in ASD; seating children with ASD nearer to the teacher and only asking them to do
one thing at a time may be one way in which additional help could improve their
educational outcome (Mayes et al, 2000).
Finally it would be useful to replicate the study using a more thorough representation of
ASD traits such as the SCQ (Rutter et al, 2003) or ASSQ (Ehler et al, 1999), as although the
SDQ subscales used in the present study have been verified to represent some ASD traits
(Iizuka et al, 2010; Russell et al, 2012), they don’t capture all traits associated with ASD; such
as behaviours that are stereotyped and repetitive, language skills and compulsive
behaviours.
Page 35
30
4.7 Conclusions
The present study examined sustained and divided attentional abilities of children along a
continuum of autistic spectrum disorder traits. An association between ASD traits and
sustained and divided attention was found, however this attention deficit may be captured
by certain ASD traits more than others; in particular pro-social behaviour. Overall the results
suggest that attention capacity does appear to be poorer in those children who display
greater ASD traits; suggesting attention problems are possibly a comorbid deficit in ASD
alongside the defining feature of social and communication impairments. The results may
have implications for the ways ASDs are assessed and diagnosed, as they imply that
permitting a dual-diagnosis of ADHD alongside ASD may benefit the child by allowing access
to medication if required. The results may also have implications for education provider’s
strategies to assists children that display ASD traits, as sustained and divided attention have
a relationship with academic achievement. Further research is required to better
understand the relationship between attention and ASD traits; with the attention measure
being a potential future tool to help identify children at risk of ASDs early in life.
Page 36
vi
References
Adrien, J.L., Lenoir, P., Martineau, J.M., Perrot, A., Hameury, L., Larmande, C., Sauvage, D
(1993). Blind Ratings of Early Symptoms of Autism Based upon Family Home Movies. Journal
of the American Academy of Child & Adolescent Psychiatry, 32(3): 617-626.
Afshari, J (2012). The effect of perceptual-motor training on attention in the children with
autism spectrum disorders. Research in Autism Spectrum Disorders, 6(4): 1331-1336.
Alais, D., Morrone, C., & Burr, D (2006). Separate attentional resources for vision and
audition. Proceedings of the royal society B: Biological Sciences, 273: 1339–1345.
Allen, G., & Courchesne, E (2001). Attention Function and Dysfunction in Autism. Frontiers in
Bioscience, 6: 105-119.
Althaus, M., DeSonneville, L.M.J., Minderaa, R.B., Hensen, L.G.N., & Til, R.B (1996).
Information processing and aspects of visual attention in children with the DSM-III-R
diagnosis ‘pervasive developmental disorder not otherwise specified’ (PDDNOS), Focused
and divided attention. Child Neuropsychology, 2(1): 17–29.
American Psychiatric Association (2000). Diagnostic and Statistical Manual of Mental
Disorders Text Revision, 4th edn. American Psychiatric Association, Washington, DC, USA.
Barkley, R.A., DuPaul, G.J., McMurray, M.B (1990). Comprehensive evaluation of attention
deficit disorder with and without hyperactivity as defined by research criteria. Journal of
Consulting and Clinical Psychology, 58(6): 775-89.
Baron-Cohen, S., Scott, F. J., Allison, C., Williams, J., Bolton, P., Matthews, F. E., & Brayne, C
(2009). Prevalence of autism-spectrum conditions: UK school-based population study. The
British Journal of Psychiatry, 194: 500–509.
Bogte, H., Flamma, B., Van Der Meere, J., & Van Engeland, H (2009). Divided attention
capacity in adults with autism spectrum disorders and without intellectual disability. Autism,
13(3), 229–243.
Bolte, S., Dickhut, H., & Poustka, F (1999). Patterns of Parent-Reported Problems Indicative
in Autism. Psychopathology, 32: 93-97.
Page 37
vii
Buchsbaum, M.S., Siegel, B.V., Wu, J.C., Hazlett, E., Sicotte, N., Haier, R., et al. (1992). Brief
report: Attention performance in autism and regional brain metabolic rate assessed by
positron emission tomography. Journal of Autism & Developmental Disorders, 22: 115–125.
Casey, B.J., Gordon, C.T., Mannheim, G.B., & Rumsey, J.M (1993). Dysfunctional attention in
autistic savants. Journal of clinical and experimental neuropsychology, 15: 933-946.
Chee, M.L., & Ivan, L.B (1991). Relations Among Sustained Attention, Reading Performance,
and Teachers' Ratings of Behavior Problems. Remedial and Special Education, 12(2): 40-47.
Christakou, A., Murphy, C.M., Chantiluke, K., Smith, M., Cubillo, A., Daly, E., Giampetro, V.,
Ecker, C., Murphy, D.G., Aims, M., & Rubia, K (2013). Sustained Attention in Children and
Adolescents with Autistic Spectrum Disorder and Attention Deficit Hyperactivity Disorder:
An fMRI Investigation. Molecular Psychiatry, 18: 236-244.
Ciesielski, K.T., Knight, J.E., Prince, R.J., Harris, R.J., & Handmaker, S.D (1995). Event-related
potentials in crossmodal divided attention in autism. Neuropsychologia, 33(2): 225 246.
Conners, C.K., & MHS Staff (2000). Conners’ Continuous Performance Test II: Computer
Program for Windows Technical Guide and Software Manual. North Tonawanda, NY: Multi-
Health Systems.
Corbett, B.A., & Constantine, L.J. (2006). Autism and attention deficit hyperactivity disorder:
Assessing attention and response control with the integrated visual and auditory continuous
performance test. Child Neuropsychology, 12: 335–348.
Courchesne, E., Lincoln, A. J., Yeung-Courchesne, R., Elmasian, R., & Grillon, C. (1989).
Pathophysiologic findings in non-retarded autism and receptive developmental language
disorder. Journal of Autism and Developmental Disorders, 19(1): 1-17.
Courchesne, E., Townsend, J., Akshoomoff, N. A., & Saitoh, O (1994). Impairment in shifting
attention in autistic and cerebellar patients. Behavioral Neuroscience, 108: 848–865.
Culmer, P.R., Levesley, M.C., Mon-Williams, M., & Williams, J.H.G (2009). 'A new tool for
assessing human movement: The Kinematic Assessment Tool'. Journal of Neuroscience
Methods, 184 (1): 184-192.
Page 38
viii
Dawson, G., Bernier, R., & Ring, R.H (2012). Social attention: a possible early indicator of
efficacy in autism clinical trials. Journal of Neurodevelopmental Disorders, 4(11): 1-12.
Dickerson, M.S., & Calhoun, S.L (2003). Analysis of the WISC-III, Stanford-Binet: IV, and
academic achievement test scores in children with autism. Journal of Autism and
Developmental Disorders, 33: 65–80.
Ehlers, S., Gillberg, C., Wing, L., (1999). A Screening Questionnaire for Asperger Syndrome
and Other High-Functioning Autism Spectrum Disorders in School Age Children. Journal of
Autism and Developmental Disorders, 29(2): 129-141.
Elsabbagh, M., Fernandes, J., Webb, S., Dawson, G., Charman, T., & Johnson, M (2013).
Disengagement of Visual Attention in Infancy Is Associated with Emerging Autism in
Toddlerhood. Biological Psychiatry, in press.
Eriksen, C., James, J (1986). Visual attention within and around the field of focal attention: A
zoom lens model. Perception & Psychophysics 40 (4): 225–240.
Fombonne, E (2009). Epidemiology of Pervasive Developmental Disorders. Pediatric
Research, 65 (6): 591–598.
Fuentes, C.T., Mostofsky, S.H., Bastian, A.J (2009). Children with autism show specific
handwriting impairments. Neurology, 73(19): 1532-1537.
Garretson, H.B., Fein, D., & Waterhouse, L (1990). Sustained attention in children with
Autism. Journal of Autism and Developmental Disorders, 20: 101–114.
Goldstein, S., Schwebach, A.J (2004). The comorbidity of pervasive developmental disorder
and attention deficit hyperactivity disorder: results of a retrospective chart review. Journal
of Autism and Developmental Disorder, 34(3): 329-339.
Goodman, R (1997). "The Strengths and Difficulties Questionnaire: A Research Note."
Journal of Child Psychology and Psychiatry, 38: 581-586.
Gordon, M., Mettelman, B.B., & Irwin, M (1994). Sustained attention and grade retention.
Perceptual Motor Skill, 78(2): 555-560.
Page 39
ix
Gordon, M., Mettelman, B.B (1988). The assessment of attention: I. Standardization and
reliability of a behavior-based measure. Journal of Clinical Psychology, 44(5): 682-90.
Guttentag, R.E (1989). Age differences in dual-task performance: Procedures, assumptions
and results. Developmental review, 9: 146-170.
Helps, S.K., Broyd, S.J., Bitsakou, P., & Sonuga-Barke, E.J.S (2011). Identifying a distinctive
familial frequency band in reaction time fluctuations in ADHD. Neuropsychology, 25(6): 711-
719.
Hering., & Ewald (1977). In Stark, Lawrence; Bridgeman, Bruce. The theory of binocular
vision. New York: Plenum Press.
Hill, E.L (2004). ‘Executive Dysfunction in Autism’. Trends in Cognitive Sciences, 8: 26–32.
Hill, J.B.L (2012). The development of a motor task for measuring attentive functioning and
its application to assessing the impact of exercise on childhood attention. A thesis for the
degree of Doctorate of Philosophy in Child Health at the University of Aberdeen.
Hodgens, J., Cole, J., & Boldizar, J (2000). Peer-Based Differences Among Boys With ADHD.
Journal of Clinical Child Psychology, 29(3): 443-452.
Huang, H., & Mercer, V.S (2011). Dual task methodology: Applications in studies of cognitive
and motor performance in adults and children. Pediatric Physical Therapy, 13(3): 133-140.
Iizuka , C., Yamashita, Y., Nagamitsu, S., Yamashita, T., Araki, Y., Ohya, T., Hara, M., Shibuya,
Iakuma, T., Matsuishi, T., (2010) Comparison of the strengths and difficulties questionnaire
(SDQ) scores between children with high-functioning autism spectrum disorder (HFASD) and
attention-deficit/hyperactivity disorder (AD/HD). Brain & Development, 32: 609–612.
Impara, J.C., & Plake, B.S (1998). The thirteenth mental measurements yearbook. Lincoln
(NE): University of Nebraska Press. Test of variables of attention, 1058-62.
Johnsona, C.P., & Myers, S.M (2007). Identification and Evaluation of Children With Autism
Spectrum Disorders. Pediatrics, 120 (5): 1183–1215.
Page 40
x
Johnsonb, K.A., Kelly S.P., Bellgrove, M.A., Barry, E., Cox, E., & Gill, M (2007). Response
variability in Attention Deficit Hyperactivity Disorder: Evidence for neuropsychological
heterogeneity. Neuropsychologia, 45(4): 630–638.
Jolliffe, T., & Baron-Cohen, S (1997). Are people with autism or Asperger’s Syndrome faster
than normal on the Embedded Figures Task? Journal of Child Psychology and Psychiatry, 38:
527–34.
Kane, A (2007). Is your child being rejected by other children? Articles factory -
http://www.articlesfactory.com/author/Anthony+Kane,+MD.html
Kanner, L (1943). Autistic disturbances of affective contact. Nerv Child, 2: 217-250.
Kemper, S., Schmalzried, R., Hoffman, L., & Herman, R. (2010). Aging and the vulnerability of
speech to dual task demands. Psychology and Aging, 25(4), 949-962.
Klee, S.H., & Garfinkel, B.D (1983). The computerized continuous performance task: A new
measure of inattention. Journal of Abnormal Child Psychology, 11: 487-495.
Koldewyn, K., Weigelt, S., Kanwisher, N., & Jiang, Y (2012). Multiple Object Tracking in
Autism Spectrum Disorders. Journal of Autism and Developmental Disorders, in press.
Kolevson, A (2007) Helping the hyperactive child: when autism looks like ADHD. Medscape
Learning Activity.
Kope, T., Ho, H., & Eaves, L (2001). Screening for autism and pervasive developmental
disorders in very young children. British Columbia Medical Journal, 43(5): 266-271.
Lainhart, J.E (1999). Psychiatric problems in individuals with autism, their parents and
siblings. International Review of Psychiatry, 11: 278–298.
Landry, R., & Bryson, S.E (2004). Impaired disengagement of attention in young children
with autism. Journal of child psychology and psychiatry, 45(6): 1115-1122.
Lehman, E.B., Olson, V.A., Aquilino, S.A., & Hall, L.C (2006). Auditory and Visual Continuous
Performance Tests Relationships with Age, Gender, Cognitive Functioning, and Classroom
Behaviour. Journal of Psychoeducational Assessment, 24(1): 36-51.
Page 41
xi
Leyfer, O.T., Folstein, S.E., Bacalman, S., Davis, N.O., Dinh, E., Morgan, J., Tager-Flusberg, H.,
& Lainhart, J.E (2006). Comorbid Psychiatric Disorders in Children with Autism: Interview
Development and Rates of Disorders. Journal of Autism and Developmental Disorders, 36:
849–861.
Lovaas, O.I., Koegel, R.L., & Schreibman, L (1979). Stimulus over selectivity in autism: A
review of research. Psychology Bulletin, 86: 1236-1254.
Lovejoy, M.C., & Rasmussen, N.H (1990). The validity of vigilance tasks in differential
diagnosis of children referred for attention and learning problems. Journal of Abnormal
Child Psychology, 18(6): 671-81.
Magnee., Gelder, B., Engeland, H., & Kemner, C (2011). Multisensory Integration and
Attention in Autism Spectrum Disorder: Evidence from Event-Related Potentials. Plos one,
6(8): e24196.
Mash., & Barkley (2003). Child Psychopathology. New York: The Guilford Press, 409–454.
Mayes, S.D., Calhoun, S.L., & Cromwell, E.W. (2000) Learning disabilities and ADHD:
Overlapping spectrum disorders. Journal of Learning Disabilities, 33: 417-424.
Meere, J.V., Wekking, E., & Sergeant, J (2006). Sustained attention and Pervasive
Hyperactivity. Journal of Child Psychology and Psychiatry, 32(2): 275-284.
Minshew, N.J., Luna, B., & Sweeney, J.A (1999). Oculomotor evidence for neocortical
systems but not cerebellar dysfunction in autism. Neurology, 52(5): 917-922.
Mizuno, K., Tanaka, M., Fukada, S., Imai-Matsumara, K., & Watanabe, Y (2012). Divided
attention of adolescents related to lifestyles and academic and family conditions. Brain &
Development, in press.
Navon, D., & Gopher, D (1979). On the economy of the human-processing system.
Psychology Review, 86: 214–255.
Newschaffer, C., Croen., Daniels (2007). The epidemiology of autism spectrum disorders.
Annual Review of Public Health, 28: 1–24.
Page 42
xii
Noterdaeme, M., Amorosa, H., Mildenberger, K., Sitter, S., & Minow, F (2001). Evaluation of
attention problems in children with autism and children with a specific language disorder.
European Child & Adolescent Psychiatry, 10: 58–66.
O’Neill, M., & Jones, R.F (1997). ‘Sensory-Perceptual Abnormalities in Autism: A Case for
More’. Journal of Autism and Developmental Disorders, 27: 283–93.
O’Neill, L (2012). The relationship between fine and gross motor skill abilities and Autistic
Spectrum Disorder traits. MSc Memory and its Disorders, University of Leeds.
Pierce, K., Glad, K.S., & Schreibman, L (1997). Social Perception in Children with Autism: An
Attentional Deficit? Journal of Autism and Developmental Disorders, 27: 265–82.
Plaisted, G.K., & Davis, G (2009). Perception and apperception in autism: rejecting the
inverse assumption. Philosophical Transactions of the Royal Society of London B: Biological
Sciences, 364(1522): 1393-8.
Posner, M.I (1978). Chronometric explorations of the mind. Hillsdale, NJ: Erlbaum.
Posserud, B., Lundervold, A.J., Steijnen, M.C., Verhoeven, S., Stormark, K.M., Gillberg, C.
(2008) Factor analysis of the Autism Spectrum Screening Questionnaire. Autism, 12(1): 99-
112.
Rabiner, D.L., Murray, D.W., Skinner, A.T., Malone, P.S (2010). A randomized trial of two
promising computer-based interventions for students with attention difficulties. Journal of
Abnormal Child Psychology, 38: 131–142.
Robertson, I.H., Manly, T., Andrade, J., Baddeley, B.T., & Yiend, J (1997). Performance
correlates of everyday attentional failures in traumatic brain injured and normal subjects
Neuropsychologia, 35: 747–758.
Russell, G., Ford, T., Steer, C., & Golding, J. (2010). Identification of children with the same
level of impairment as children on the autism spectrum, and analysis of their service use.
Journal of Child Psychology & Psychiatry, 51(3), 643e651.
Page 43
xiii
Russell, G., Kelly, S.E., Fort, T., & Steer, C (2012). Diagnosis as a social determinant: the
development of prosocial behaviour before and after an autism spectrum diagnosis. Social
Science & Medicine, 75(9): 1642-9.
Rutherford, M.D., Richards, E.D., Moldes, V., & Sekuler, A.B (2007). Evidence of a divided-
attention advantage in autism. Cognitive Neuropsychology, 24(5), 505–515.
Rutter, M., Anthony, B., & Lord, C (2003). The Social Communication Questionnaire Manual.
Los Angeles: Western Psychological Services
Rutter, M (2005). Incidence of autism spectrum disorders: changes over time and their
meaning. Acta Paediatrica, 94(1): 2-15.
Salthouse, T.A., Atkinson, T.M., & Berish, D.E (2003). Executive functioning as a potential
mediator of age-related cognitive decline in normal adults. Journal of Experimental
Psychology: General, 132: 566–594.
Sanders, J., Johnson, K., Garavan, H., Gill, M., Gallagher, L (2007). A review of
neuropsychological and neuroimaging research in autistic spectrum disorders: Attention,
inhibition and cognitive flexibility. Research in Autism Spectrum Disorders, 37: 1–16.
Sandford, J.A., & Turner, A (2000). Integrated visual and auditory continuous performance
test manual. Richmond, VA: Brain Train.
Scheepers, F.E., De Wied, C.C., Hulshoff Pol, H.E., Van de Flier,W., Van der Linden, J.A., &
Kahn, R.S (2001). The Effect of Clozapine on Caudate Nucleus Volume in Schizophrenic
Patients Previously Treated with Typical Antipsychotics. Neuropsychopharmacology, 24: 47–
54.
Schmidt, R.A., & Wrisberg, C.A., (2008). Motor learning and performance: A situation-based
learning approach. (4th ed.). Human Kinetics.
Schneider, W., & Shiffrin, R.M (1977). Controlled and Automatic Human Information
Processing: Perceptual Learning, Automatic Attending, and a General Theory. Psychological
Review, 84: 127–90.
Page 44
xiv
Shalev, L., Ben-Simon, A., Mevorach, C., Cohen, Y., & Tsal, Y (2011). Conjunctive Continuous
Performance Task (CCPT), a pure measure of sustained attention. Neuropsychologia, 49(9):
2584-91.
Shic, F., Bradshaw, J., Klin, A., Scassellati, B., & Chawarska, K (2011). Limited activity
monitoring in toddlers with autism spectrum disorder. Brain Research, 1380: 246-254.
Skuse, D (2010). Institute of Child Health. British Journal of Psychiatry.
Sturm, H., Fernell, E., & Gillberg, C (2004). Autism spectrum disorders in children with
normal intellectual levels: associated impairments and subgroups. Developmental Medicine
and Child Neurology, 46(7): 444-447.
Swaab-Barneveld, J.T (1998). Information Processing in a Child Psychiatric Population.
Master’s thesis, University of Utrecht, The Netherlands.
Taylor, B (2006). Vaccines and the changing epidemiology of autism. Child Care Health
Development, 32(5): 511-9.
Wainwright-Sharp, J.A., & Bryson, S.E (1993). Visual orienting deficits in high-functioning
people with autism. Journal of Autism and Developmental Disorders, 23: 1–13.
Warshaw, H.S (1979). Divided Attention And Classroom Learning. Dissertations from
ProQuest. Paper 1091.
Weimer, A.K., Schatz, A.M., Lincoln, A., Ballantyne, A.O., & Trauner, D.A. (2001). “Motor”
impairment in Asperger syndrome: Evidence for a deficit in proprioception. Journal of
Developmental and Behavioral Paediatrics, 22, 92–101.
William, J (1890) The Principles of Psychology. Classics in the History of Psychology, an
internet resource developed by Christopher D. Green of York University, Toronto, Ontario.
Page 45
xv
Appendices
Contents Page
A. DSM-IV TR diagnostic criteria for ASD xvi
B. ICD-10 diagnostic criteria for ASD xvii
C. Example SDQ 4-16 years xx
D. Poster xxi
E. Supervision diary xxii
G. Raw data and SPSS outputs CD
Page 46
xvi
Appendix A. DSM-IV-TR Diagnostic criteria for ASD
299.00 Autistic Disorder
A. A total of six (or more) items from (1), (2) and (3), with at least two from (1), and one each
from (2) and (3):
(1) qualitative impairment in social interaction, as manifested by at least two of the following:
(a) marked impairment in the use of multiple nonverbal behaviours such as eye-to-eye
gaze, facial expression, body postures, and gestures to regulate social interaction
(b) failure to develop peer relationships appropriate to developmental level
(c) a lack of spontaneous seeking to share enjoyment, interests, or achievements with
other people (eg, by a lack of showing, bringing, or pointing out objects of interest)
(d) lack of social or emotional reciprocity
(2) qualitative impairments in communication as manifested by at least one of the following:
(a) delay in, or total lack of, the development of spoken language (not accompanied by an
attempt to compensate through alternative modes of communication such as gestures
or mime)
(b) in individuals with adequate speech, marked impairment in the ability to initiate or
sustain a conversation with others
(c) stereotyped and repetitive use of language or idiosyncratic language
(d) lack of varied, spontaneous make-believe play or social imitative play appropriate to
developmental level
(3) restricted repetitive and stereotyped patterns of behaviour, interests and activities, as
manifested by at least one of the following:
(a) encompassing preoccupation with one or more stereotyped and restricted patterns of
interest that is abnormal either in intensity or focus
(b) apparently inflexible adherence to specific, non-functional routines or rituals
(c) stereotyped and repetitive motor mannerisms (eg, hand or finger flapping or twisting,
or complex whole body movements)
(d) persistent preoccupation with parts of objects
B. Delays or abnormal functioning in at least one of the following areas, with onset prior to age 3
years: (1) social interaction, (2) language as used in social communication or (3) symbolic or
imaginative play
C. The disturbance is not better accounted for by Rett’s Disorder or Childhood Disintegrative
Disorder
299.80 Asperger’s Disorder
A. Qualitative impairment in social interaction, as manifested by at least two of the following:
(1) marked impairment in the use of multiple nonverbal behaviours such as eye-to-eye gaze,
facial expression, body postures, and gestures to regulate social interaction
(2) failure to develop peer relationships appropriate to developmental level
(3) a lack of spontaneous seeking to share enjoyment, interests, or achievements with other
people (eg, by a lack of showing, bringing or pointing out objects of interest to other people)
(4) lack of social or emotional reciprocity
B. Restricted repetitive and stereotyped patterns of behaviour, interests, and activities, as
manifested by at least one of the following:
(1) encompassing preoccupation with one or more stereotyped and restricted patterns of
interest that is abnormal either in intensity or focus
Page 47
xvii
(2) apparently inflexible adherence to specific, non-functional routines or rituals
(3) stereotyped and repetitive motor mannerisms (eg, hand or finger flapping or twisting, or
complex whole-body movements)
(4) persistent preoccupation with parts of objects
C. The disturbance causes clinically significant impairment in social, occupational, or other
important areas of functioning.
D. There is no clinically significant general delay in language (eg, single words used by age 2 years,
communicative phrases used by age 3 years).
E. There is no clinically significant delay in cognitive development or in the development of age-
appropriate self-help skills, adaptive behaviour (other than in social interaction), and curiosity
about the environment in childhood.
F. Criteria are not met for another specific Pervasive Developmental Disorder or Schizophrenia.
299.80 Pervasive Developmental Disorder Not Otherwise Specified (Including Atypical Autism)
This category should be used when there is a severe and pervasive impairment in the development
of reciprocal social interaction associated with impairment in either verbal or nonverbal
communication skills or with the presence of stereotyped behaviour, interest, and activities, but the
criteria are not met for a specific Pervasive Developmental Disorder, Schizophrenia, Schizotypal
Personality Disorder, or Avoidant Personality Disorder. For example, this category includes ‘atypical
autism’ – presentations that do not meet the criteria for Autistic Disorder because of late age at
onset, atypical symptomatology, or sub threshold symptomatology, or all of these.
Page 48
xviii
Appendix B. ICD-10 Diagnostic criteria for ASD
F84 Pervasive developmental disorders
A group of disorders characterized by qualitative abnormalities in reciprocal social interactions and
in patterns of communication, and by a restricted, stereotyped, repetitive repertoire of interests and
activities. These qualitative abnormalities are a pervasive feature of the individual’s functioning in all
situations.
Use additional code, if desired, to identify any associated medical condition and mental retardation.
F84.0 Childhood autism
A type of pervasive developmental disorder that is defined by: (a) the presence of abnormal or
impaired development that is manifest before the age of three years, and (b) the characteristic type
of abnormal functioning in all the three areas of psychopathology: reciprocal social interaction,
communication, and restricted, stereotyped, repetitive behaviour. In addition to these specific
diagnostic features, a range of other nonspecific problems are common, such as phobias, sleeping
and eating disturbances, temper tantrums, and (self-directed) aggression.
Autistic disorder Infantile:
• autism
• psychosis
Kanner’s syndrome
Excludes: autistic psychopathy (F84.5)
F84.1 Atypical autism
A type of pervasive developmental disorder that differs from childhood autism either in age of onset
or in failing to fulfil all three sets of diagnostic criteria. This subcategory should be used when there
is abnormal and impaired development that is present only after age three years, and a lack of
sufficient demonstrable abnormalities in one or two of the three areas of psychopathology required
for the diagnosis of autism (namely, reciprocal social interactions, communication, and restricted,
stereotyped, repetitive behaviour) in spite of characteristic abnormalities in the other area(s).
Atypical autism arises most often in profoundly retarded individuals and in individuals with a severe
specific developmental disorder of receptive language.
Atypical childhood psychosis
Mental retardation with autistic features
Use additional code (F70-F79), if desired, to identify mental retardation.
F84.5 Asperger’s syndrome
A disorder of uncertain oncological validity, characterized by the same type of qualitative
abnormalities of reciprocal social interaction that typify autism, together with a restricted,
stereotyped, repetitive repertoire of interests and activities. It differs from autism primarily in the
fact that there is no general delay or retardation in language or in cognitive development. This
disorder is often associated with marked clumsiness. There is a strong tendency for the
Page 49
xix
abnormalities to persist into adolescence and adult life. Psychotic episodes occasionally occur in
early adult life.
Autistic psychopathy
Schizoid disorder of childhood
F84.8 Other pervasive developmental disorders
F84.9 Pervasive developmental disorder, unspecified
Page 50
xx
Appendix C. Example Strengths and Difficulties Questionnaire, 4-16 years
For each item, please mark the box for Not True, Somewhat True or Certainly True. It would
help us if you answered all items as best you can even if you are not absolutely certain or the
item seems daft! Please give your answers on the basis of the child's behaviour over the last six
months or this school year.
Child's Name .............................................................................................................Male/Female
Date of Birth...........................................................
Not
True
Somewhat
True
Certainly
True
Considerate of other people’s feelings (ps)
Restless, overactive, cannot stay still for long
Often complains of headaches, stomach-aches/sickness (e)
Shares readily with other children (treats, toys, pencils) (ps)
Often has temper tantrums or hot tempers
Rather solitary, tends to play alone (pp)
Generally obedient, usually does what adults request *
Many worries, often seems worried (e)
Helpful if someone is hurt, upset or feeling ill (ps)
Constantly fidgeting or squirming
Has at least one good friend (pp)*
Often fights with other children or bullies them
Often unhappy, down-hearted or tearful (e)
Generally liked by other children (pp)*
Easily distracted, concentration wanders
Nervous/clingy in new situations, easily loses confidence (e)
Kind to younger children (ps)
Often lies or cheats
Picked on or bullied by other children (pp)
Often volunteers to help others (parents/teachers) (ps)
Thinks things out before acting *
Steals from home, school or elsewhere
Gets on better with adults than with other children (pp)
Many fears, easily scared (e)
Sees tasks through to the end, good attention span *
Signature……………………………………………. Date…………………………………………….
Parent/Teacher/Other (please specify :)
Thank you very much for your help © Robert Goodman, 2005
Page 51
xxi
Appendix D. Poster
Page 52
xxii
Appendix E. Supervision Diary
Weekly meetings were held with Prof. Mark Mon-Williams, details of which are below:
date time given topics discussed and actions to be taken
8/10/12
1 hour First meeting – introductions with group. Overview of topic area
15/10/12 1 hour Discussed background to attention – previous studies and current
findings
22/10/12 1 hour Explanation of C-Kat. Able to take laptops away to practice with at
home.
29/11/12 1 hour Discussed SDQ and how we can measure attention
12/11/12 1 hour Discussed different attention tasks and things that we may want to
explore that may have a relationship with task e.g. Autism
19/11/12 1 hour Discussed possible research questions and associations with
sustained and divided attention.
26/11/12 1 hour BIB training session.
05/02/13 1 hour Discussed method and things to include. Discussed descriptions of
tasks and demographics of participants. Draft abstract and method
for next session.
12/02/13 1 hour Talked about basic things to include in intro. Discussed potential of
comorbidity between ADHD and ASD – framework. Outline of intro
for next session.
19/02/13 1 hour Discussed problems with looking at between-group samples and
why our population based sample may be better.
26/02/13 1 hour How social limitation in autism may be associated with attention.
Possible future directions. Planned poster presentations
5/03/13 1 hour Final questions about method and intro. Talked about using
regression in analysis.
15/03/13 1 hour Discussed possible statistical analysis that could be conducted e.g.
regression. Received email with excel spread-sheet containing raw
data.
Student’s signature
Supervisor’s signature
Page 53
xxiii
Appendix F. Raw data and SPSS output on CD