66
The Relationship of Binder Delta Tc (ΔTc) to Mixture Fatigue Gerald Reinke MTE Services, Inc For SEAUPG Meeting November 14-16, 2017 Jacksonville, FL
The Relationship of Binder Delta Tc (ΔTc) to Mixture Fatigue
Gerald ReinkeMTE Services, Inc
For SEAUPG Meeting
November 14-16, 2017Jacksonville, FL
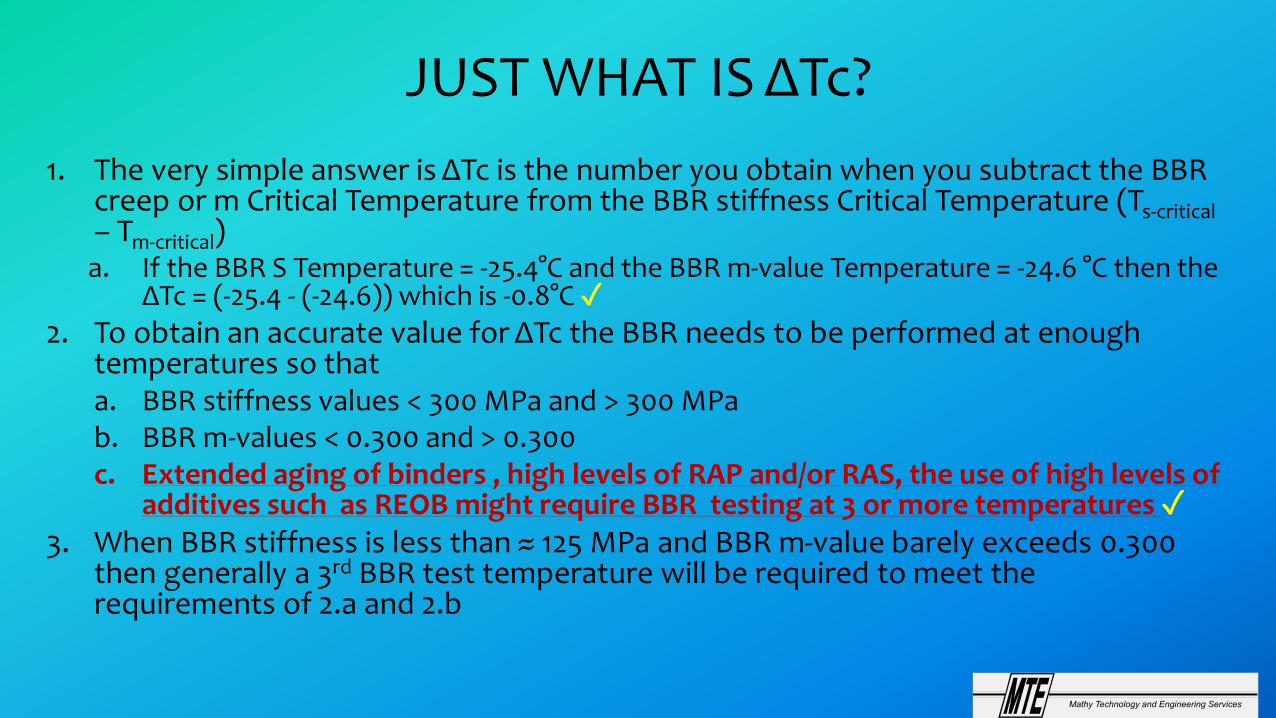
JUST WHAT IS ΔTc?1. The very simple answer is ΔTc is the number you obtain when you subtract the BBR
creep or m Critical Temperature from the BBR stiffness Critical Temperature (Ts-critical – Tm-critical)a. If the BBR S Temperature = -25.4°C and the BBR m-value Temperature = -24.6 °C then the
ΔTc = (-25.4 - (-24.6)) which is -0.8°C ✓2. To obtain an accurate value for ΔTc the BBR needs to be performed at enough
temperatures so thata. BBR stiffness values < 300 MPa and > 300 MPab. BBR m-values < 0.300 and > 0.300c. Extended aging of binders , high levels of RAP and/or RAS, the use of high levels of
additives such as REOB might require BBR testing at 3 or more temperatures ✓3. When BBR stiffness is less than ≈ 125 MPa and BBR m-value barely exceeds 0.300
then generally a 3rd BBR test temperature will be required to meet the requirements of 2.a and 2.b
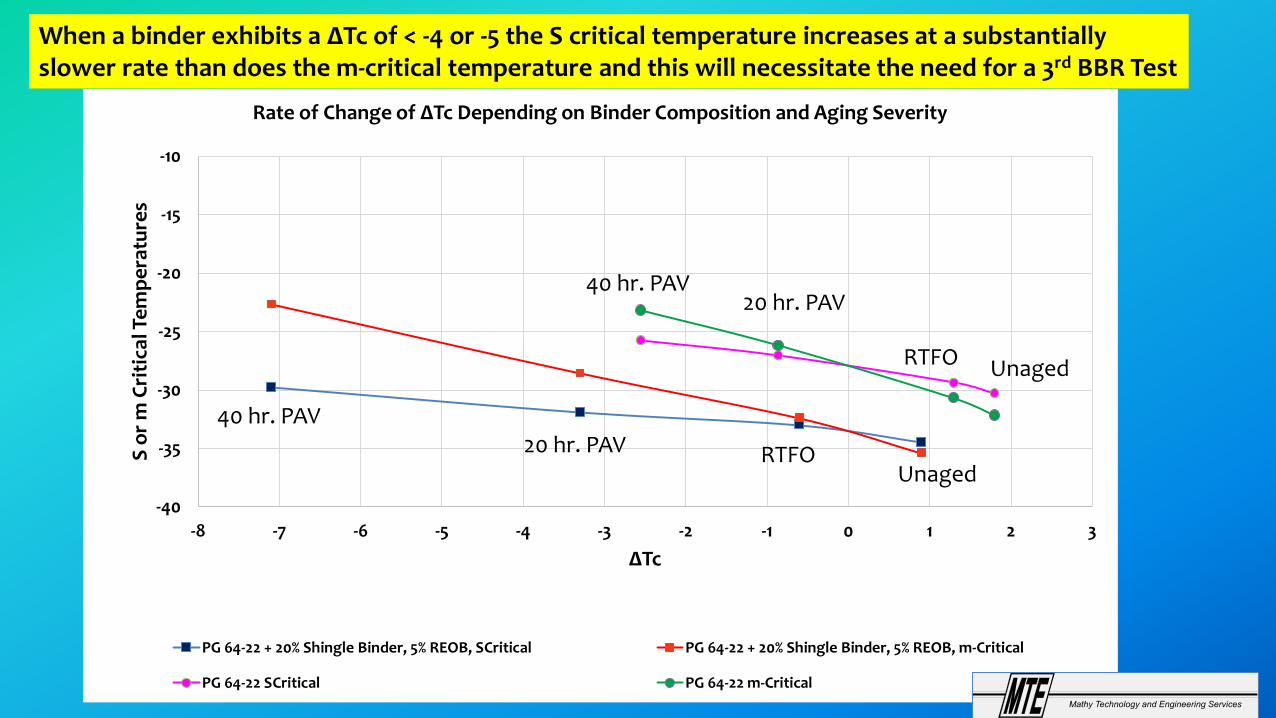
When a binder exhibits a ΔTc of < -4 or -5 the S critical temperature increases at a substantially slower rate than does the m-critical temperature and this will necessitate the need for a 3rd BBR Test
-40
-35
-30
-25
-20
-15
-10
-8 -7 -6 -5 -4 -3 -2 -1 0 1 2 3
S or
m C
ritic
al T
empe
ratu
res
ΔTc
Rate of Change of ΔTc Depending on Binder Composition and Aging Severity
PG 64-22 + 20% Shingle Binder, 5% REOB, SCritical PG 64-22 + 20% Shingle Binder, 5% REOB, m-Critical
PG 64-22 SCritical PG 64-22 m-Critical
Unaged
20 hr. PAV
RTFO
UnagedRTFO
40 hr. PAV
40 hr. PAV
20 hr. PAV

JUST WHAT IS ΔTc?1. The very simple answer is ΔTc is the number you obtain when you subtract the BBR
creep or m Critical Temperature from the BBR stiffness Critical Temperature (Ts-critical – Tm-critical)a. If the BBR S Temperature = -25.4°C and the BBR m-value Temperature = -24.6 °C then the
ΔTc = (-25.4 - (-24.6)) which is -0.8°C
Now you’ve told me how to obtain the value of ΔTc, But just why would I want or need to do that?
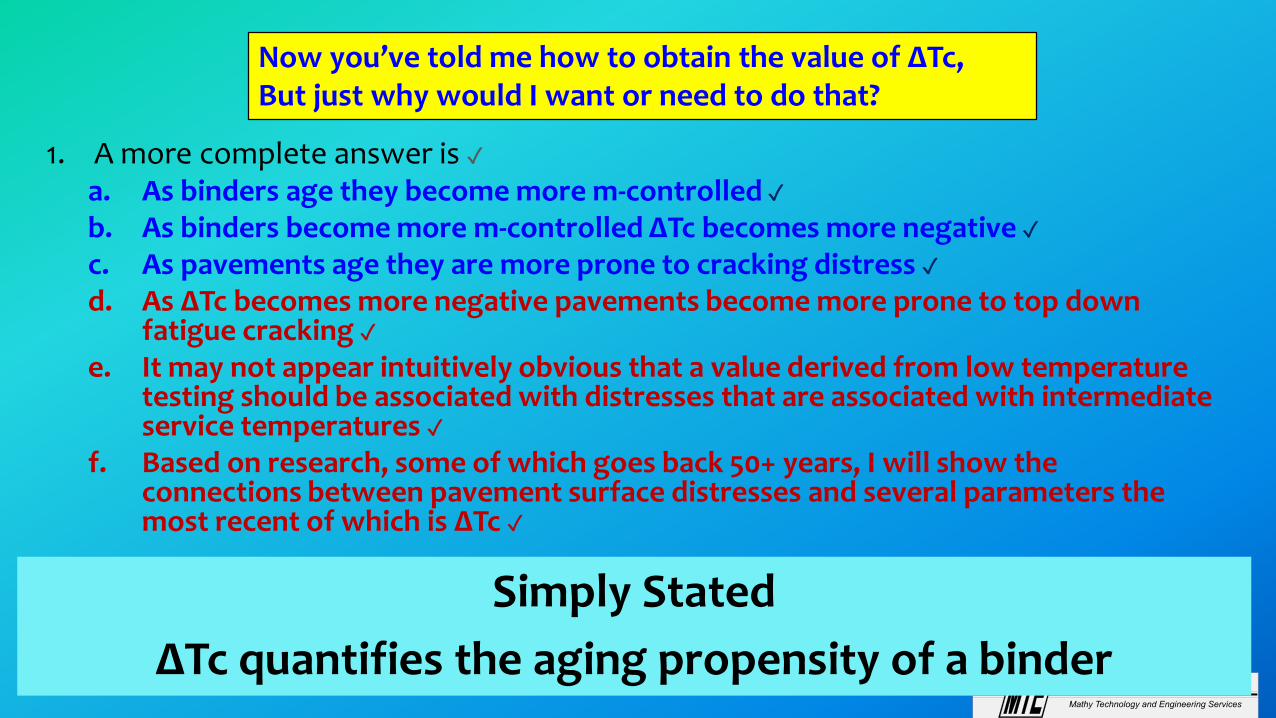
JUST WHAT IS ΔTc?1. A more complete answer is ✓
a. As binders age they become more m-controlled ✓b. As binders become more m-controlled ΔTc becomes more negative ✓c. As pavements age they are more prone to cracking distress ✓d. As ΔTc becomes more negative pavements become more prone to top down
fatigue cracking ✓e. It may not appear intuitively obvious that a value derived from low temperature
testing should be associated with distresses that are associated with intermediate service temperatures ✓
f. Based on research, some of which goes back 50+ years, I will show the connections between pavement surface distresses and several parameters the most recent of which is ΔTc ✓
Now you’ve told me how to obtain the value of ΔTc, But just why would I want or need to do that?
Simply StatedΔTc quantifies the aging propensity of a binder

IN THE FINAL ANALYSIS ΔTc COMES DOWN TO 1 THING

IN THE FINAL ANALYSIS ΔTc COMES DOWN TO 1 THING
NO! NOT THAT 1 THING

IN THE FINAL ANALYSIS ΔTc COMES DOWN TO 1 THING
NO! NOT THAT 1 THING
RELAXATION

IN THE FINAL ANALYSIS ΔTc COMES DOWN TO 1 THING
NO! NOT THAT 1 THINGRELAXATIONSPECIFICALLY BINDER
RELAXATION

TIME TO GET SERIOUS• As with most advances in technical research developments are
the result of cumulative increase in knowledge ✓• I will focus on three individuals, but reading their research will
show the many other contributors along the way• Prithvi (Ken) Kandhal – Pennsylvania DOT Bituminous Engineer• Dr. Charles Glover—Research Professor Texas Transportation
Institute at Texas A&M• Mike Anderson—Director of Research at the Asphalt Institute

KANDHAL’S WORK IN PENNSYLVANIA• In 1961 and 1962 test pavements constructed in Pennsylvania• Pavement performance tracked for more than 1o years and
reported in 1977 ASTM symposium– Surface distress noted– Binder recovered at periodic intervals
• Penetration at 77°F and ductility at 60°F & 5 cm/min tested ✓
• He found that when ductility dropped below 5 cm cracking became an issue ✓
• Provided additional references to other similar research• Kandahl, Low Temperature Ductility in Relation to Pavement
Performance, ASTM STP 628, Marek, Ed., 1977
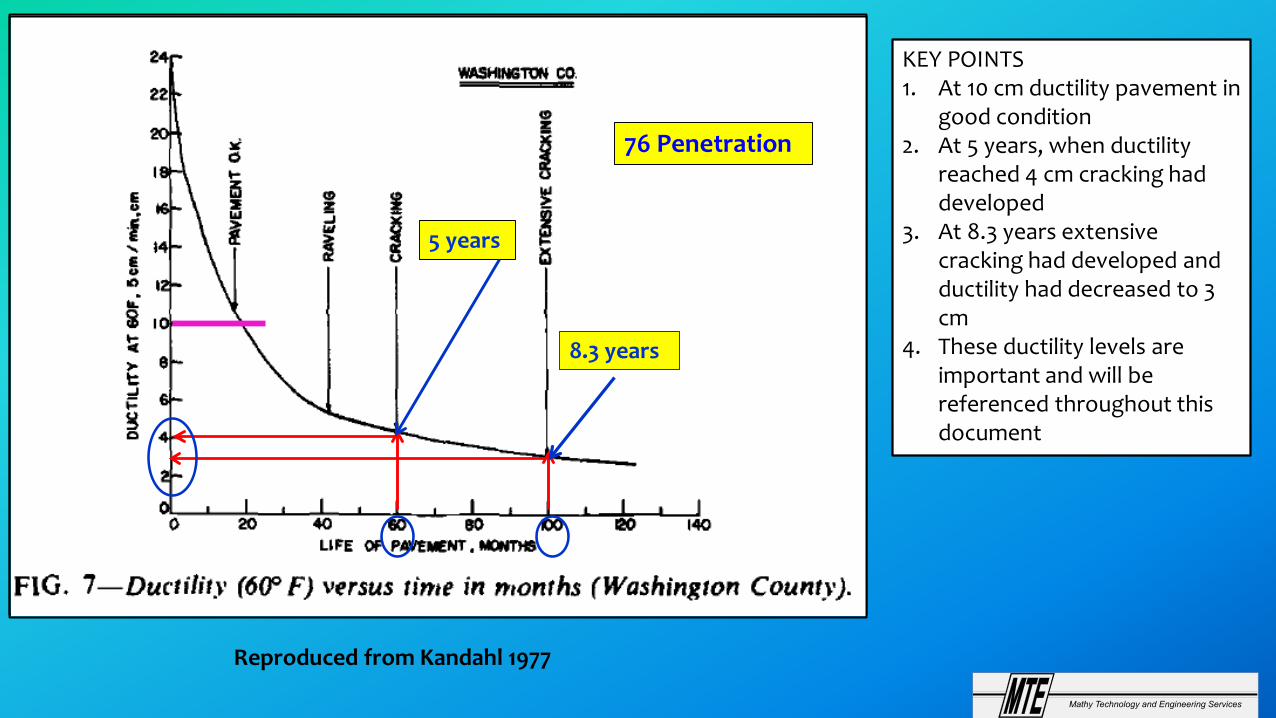
Reproduced from Kandahl 1977
15.5°C
5 years5 years
76 Penetration
5 years
KEY POINTS1. At 10 cm ductility pavement in
good condition2. At 5 years, when ductility
reached 4 cm cracking had developed
3. At 8.3 years extensive cracking had developed and ductility had decreased to 3 cm
4. These ductility levels are important and will be referenced throughout this document
8.3 years
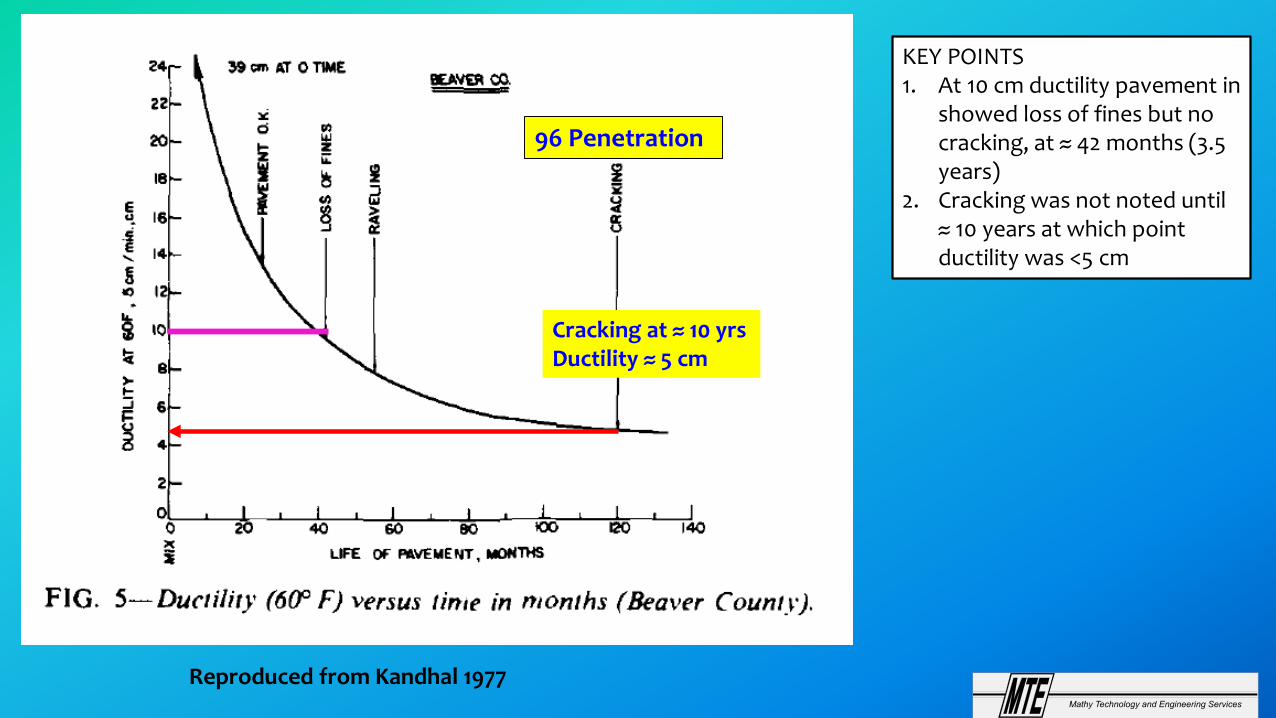
Reproduced from Kandhal 1977
Cracking at ≈ 10 yrsDuctility ≈ 5 cm
96 Penetration
KEY POINTS1. At 10 cm ductility pavement in
showed loss of fines but no cracking, at ≈ 42 months (3.5 years)
2. Cracking was not noted until ≈ 10 years at which point ductility was <5 cm
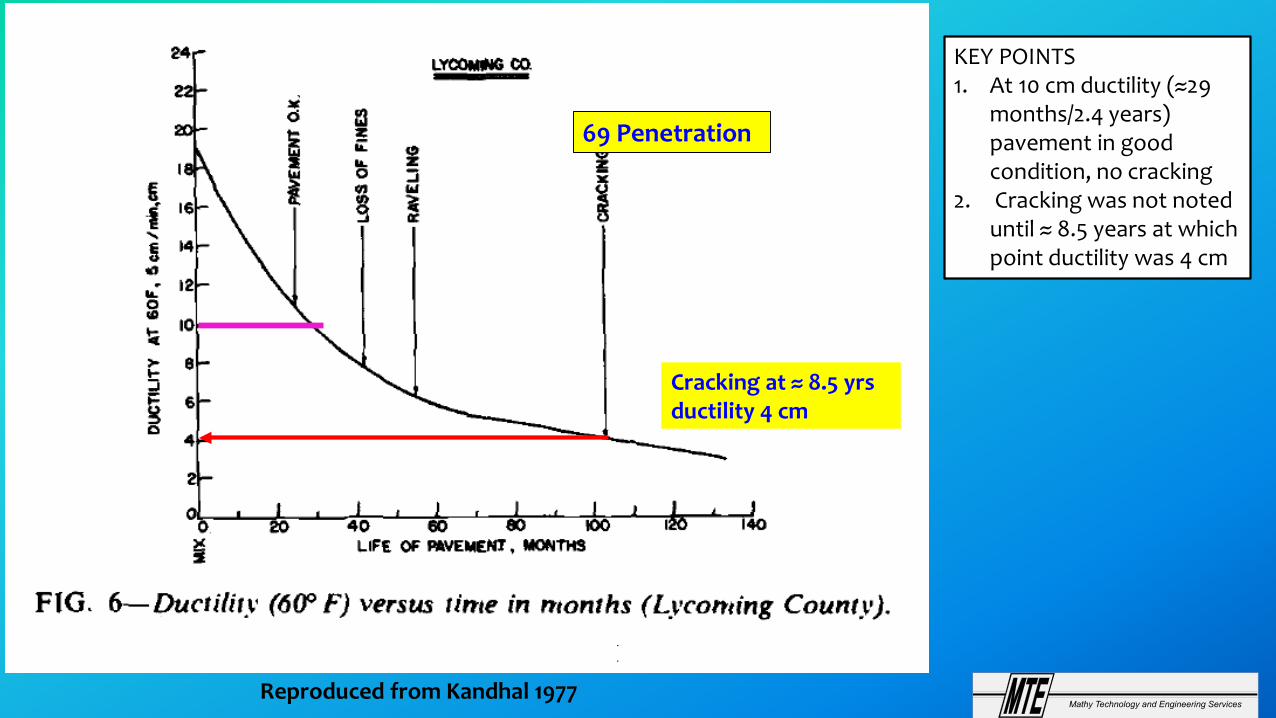
Reproduced from Kandhal 1977
Cracking at ≈ 8.5 yrsductility 4 cm
69 Penetration
Cracking at ≈ 8.5 yrsductility 4 cm
69 Penetration
KEY POINTS1. At 10 cm ductility (≈29
months/2.4 years) pavement in good condition, no cracking
2. Cracking was not noted until ≈ 8.5 years at which point ductility was 4 cm
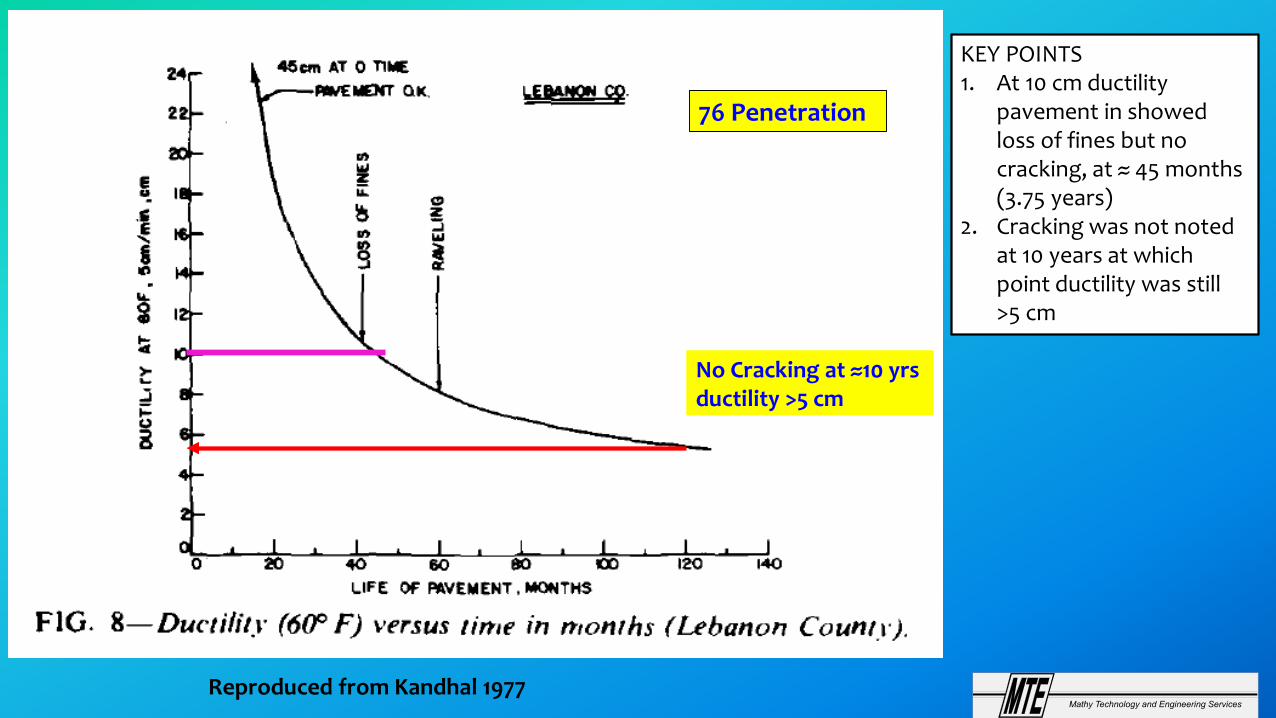
Reproduced from Kandhal 1977
No Cracking at ≈10 yrsductility >5 cm
76 Penetration
KEY POINTS1. At 10 cm ductility
pavement in showed loss of fines but no cracking, at ≈ 45 months (3.75 years)
2. Cracking was not noted at 10 years at which point ductility was still >5 cm
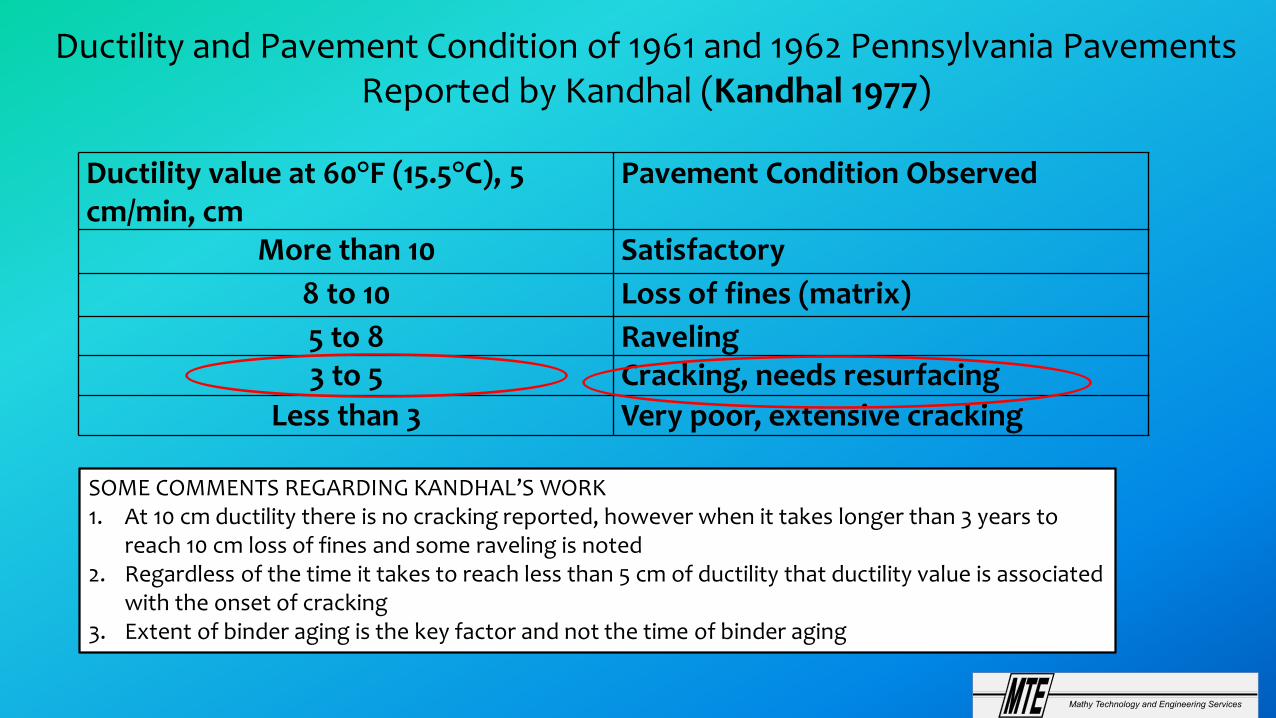
Ductility and Pavement Condition of 1961 and 1962 Pennsylvania Pavements Reported by Kandhal (Kandhal 1977)
Ductility value at 60°F (15.5°C), 5 cm/min, cm
Pavement Condition Observed
More than 10 Satisfactory8 to 10 Loss of fines (matrix)5 to 8 Raveling3 to 5 Cracking, needs resurfacing
Less than 3 Very poor, extensive cracking
SOME COMMENTS REGARDING KANDHAL’S WORK1. At 10 cm ductility there is no cracking reported, however when it takes longer than 3 years to
reach 10 cm loss of fines and some raveling is noted2. Regardless of the time it takes to reach less than 5 cm of ductility that ductility value is associated
with the onset of cracking3. Extent of binder aging is the key factor and not the time of binder aging
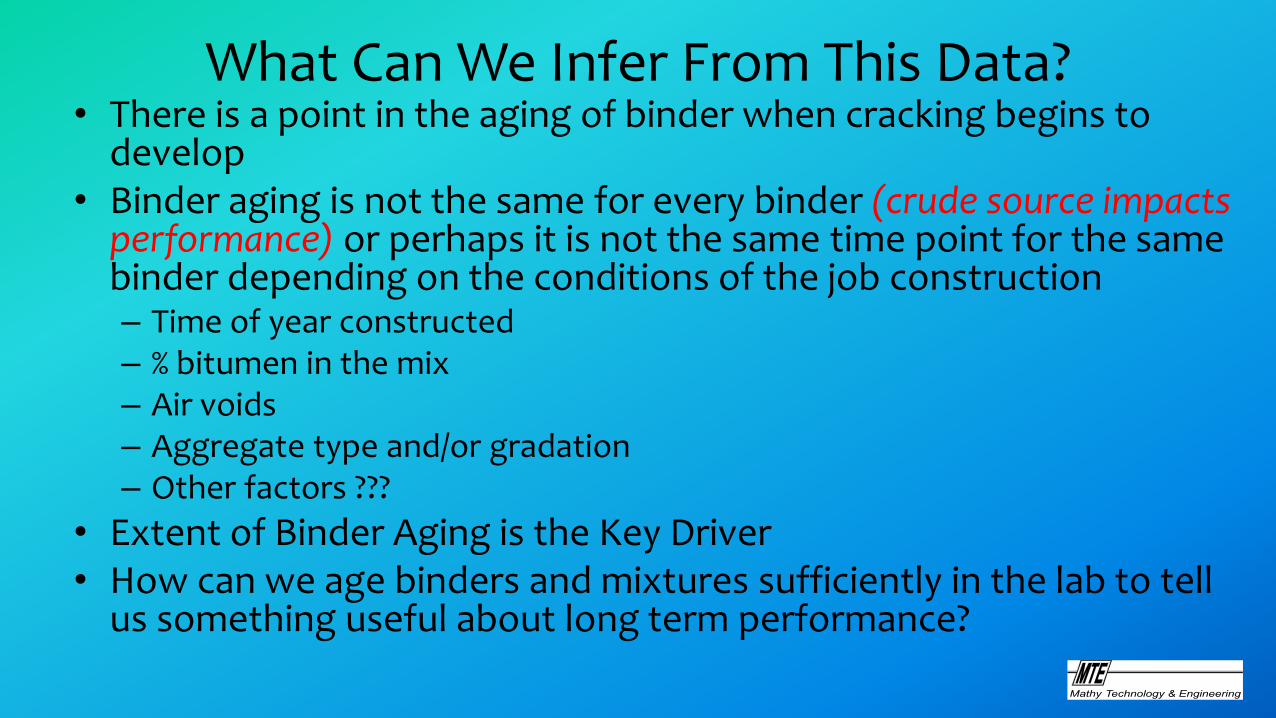
What Can We Infer From This Data?• There is a point in the aging of binder when cracking begins to
develop• Binder aging is not the same for every binder (crude source impacts
performance) or perhaps it is not the same time point for the same binder depending on the conditions of the job construction– Time of year constructed– % bitumen in the mix– Air voids – Aggregate type and/or gradation– Other factors ???
• Extent of Binder Aging is the Key Driver• How can we age binders and mixtures sufficiently in the lab to tell
us something useful about long term performance?
Mathy Technology & Engineering
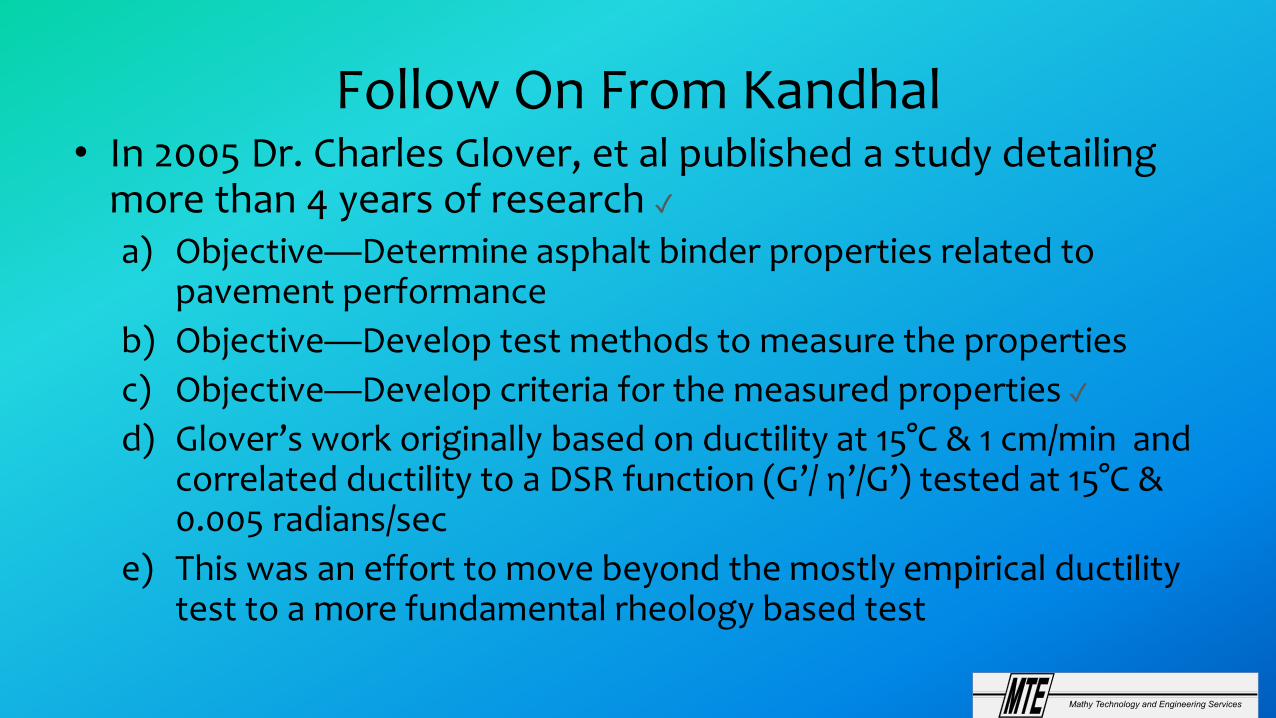
Follow On From Kandhal• In 2005 Dr. Charles Glover, et al published a study detailing
more than 4 years of research ✓a) Objective—Determine asphalt binder properties related to
pavement performanceb) Objective—Develop test methods to measure the propertiesc) Objective—Develop criteria for the measured properties ✓d) Glover’s work originally based on ductility at 15°C & 1 cm/min and
correlated ductility to a DSR function (G’/ η’/G’) tested at 15°C & 0.005 radians/sec
e) This was an effort to move beyond the mostly empirical ductility test to a more fundamental rheology based test
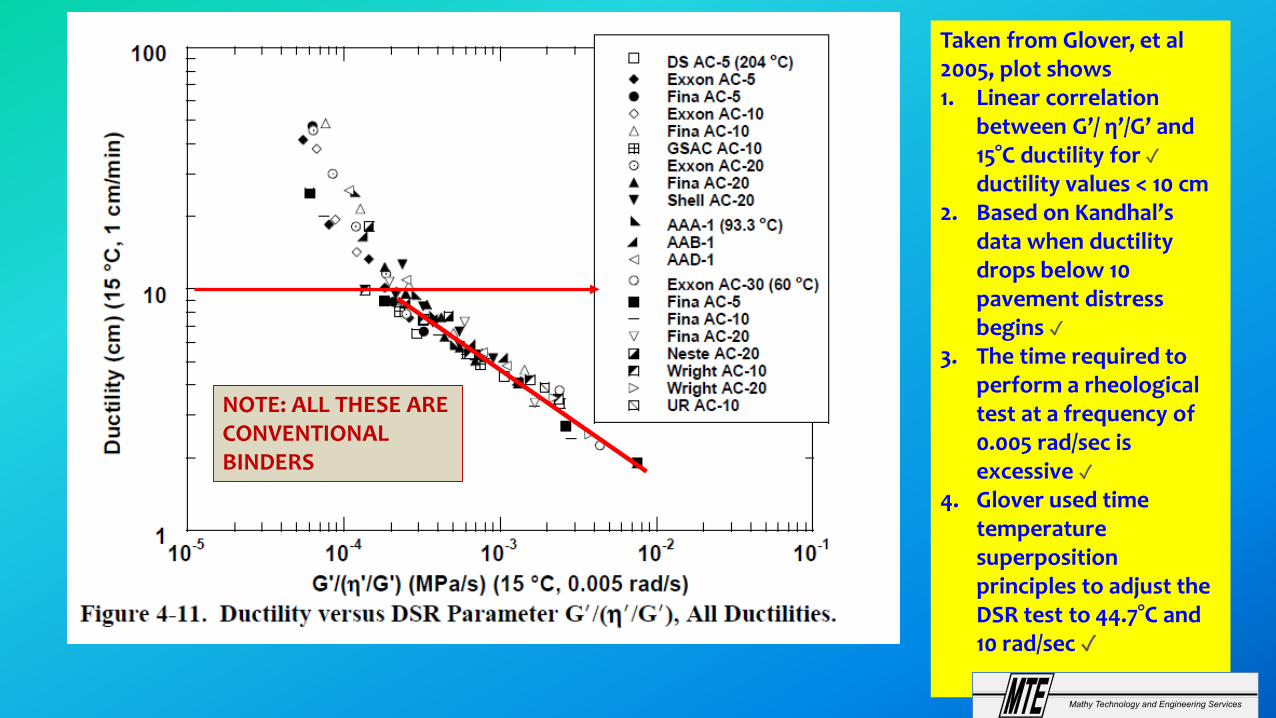
Taken from Glover, et al 2005, plot shows1. Linear correlation
between G’/ η’/G’ and 15°C ductility for ✓ductility values < 10 cm
2. Based on Kandhal’s data when ductility drops below 10 pavement distress begins ✓
3. The time required to perform a rheological test at a frequency of 0.005 rad/sec is excessive ✓
4. Glover used time temperature superposition principles to adjust the DSR test to 44.7°C and 10 rad/sec ✓
NOTE: ALL THESE ARE CONVENTIONAL BINDERS

Moving from Ductility to ΔTc—Glover Recommendations
1. Glover recommended harsher aging criteria than current PAV for binder aging specification testing ✓a) Film thickness of 0.857 mm (≈1/3 PAV thickness), 32 hrs. @ 90°C and
20 atmospheres air pressure ✓
2. G’/ η’/G’ less than 0.003 MPa stiffness (≈3 cm ductility @ 15°C) ✓3. G’/ η’/G’ of 0.0009 MPa stiffness (≈5 cm ductility @ 15°C) border
line for pavement cracking ✓4. You will note that current binder spec’s do not following these
recommendations5. This does not mean they are without merit
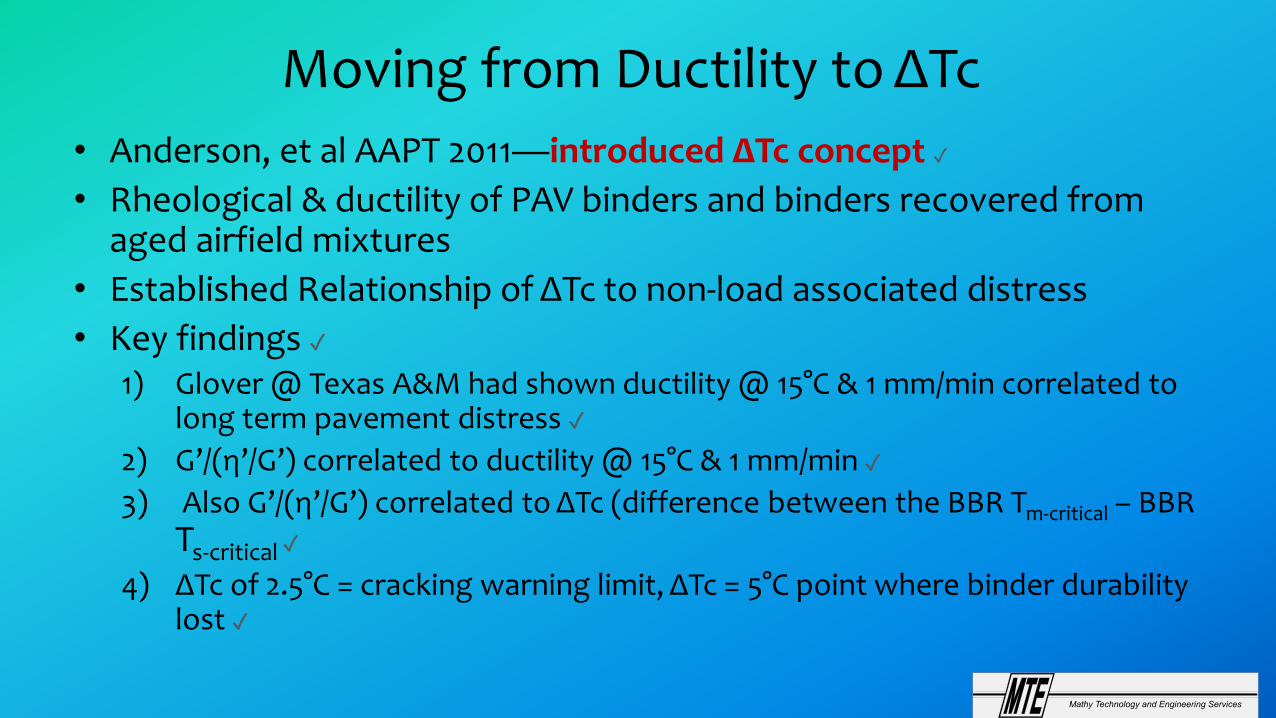
Moving from Ductility to ΔTc• Anderson, et al AAPT 2011—introduced ΔTc concept ✓• Rheological & ductility of PAV binders and binders recovered from
aged airfield mixtures• Established Relationship of ΔTc to non-load associated distress• Key findings ✓
1) Glover @ Texas A&M had shown ductility @ 15°C & 1 mm/min correlated to long term pavement distress ✓
2) G’/(η’/G’) correlated to ductility @ 15°C & 1 mm/min ✓3) Also G’/(η’/G’) correlated to ΔTc (difference between the BBR Tm-critical – BBR
Ts-critical ✓
4) ΔTc of 2.5°C = cracking warning limit, ΔTc = 5°C point where binder durability lost ✓
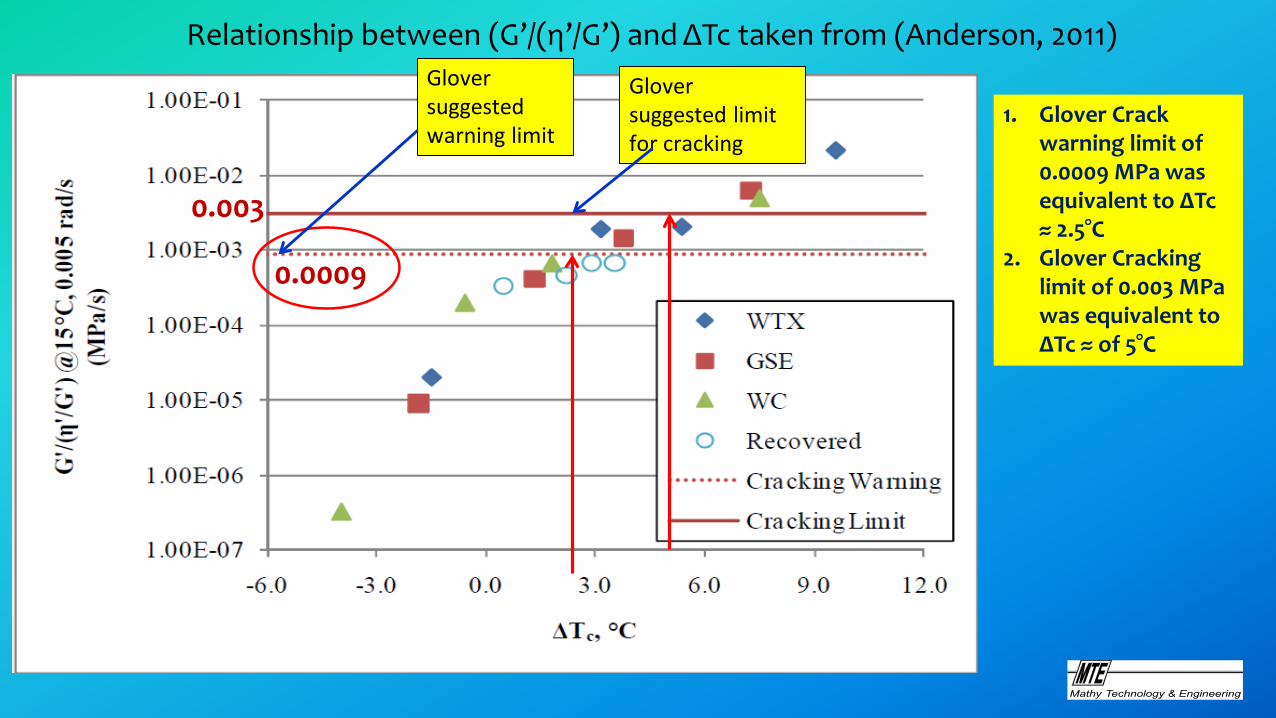
Relationship between (G’/(η’/G’) and ΔTc taken from (Anderson, 2011)
Mathy Technology & Engineering
Glover suggested warning limit
1. Glover Crack warning limit of 0.0009 MPa was equivalent to ΔTc ≈ 2.5°C
2. Glover Cracking limit of 0.003 MPa was equivalent to ΔTc ≈ of 5°C
0.0009
0.003
Glover suggested limit for cracking

Some Necessary Explanation to Avoid Confusion
1. In their 2011 paper Anderson, et al used the concept of BBR Tm-critical – BBR TS-critical to determine ΔTc ✓
a) ∴ ΔTc had positive values when the binder was m-controlled ✓
2. The convention has now been switched to ΔTc= BBR TS-critical–BBR Tm-critical which results in negative values of ΔTc for m-controlled binders ✓
3. Therefore the more negative the value of ΔTc the more likely the binder and mix will have performance problems ✓
Mathy Technology & Engineering
ΔTc and 4 mm DSR Testing
• Much of the data to be discussed next was generated at MTE using a 4 mm DSR test developed at Western Research Institute (see reference list)
• Requires very little material to perform test ✓• Requires research grade DSR and environmental chamber
– Peltier controlled DSR’s have proven problematic ✓• Results correlate well to BBR, but there is a learning curve ✓• Provides a broader temperature range (-36°C to +30°C or +40°C)
of data collection in the time it would take perform the BBR test at 3 temperatures ✓

4 mm DSR upper tool and lower plate
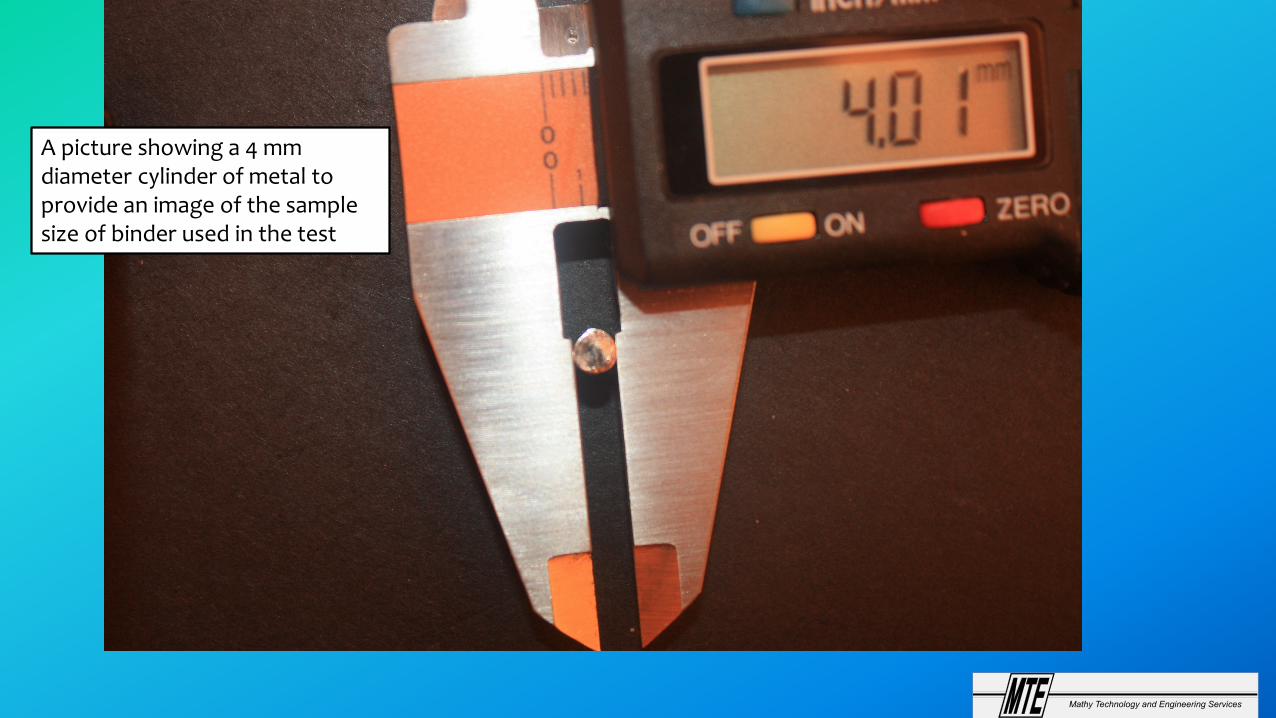
A picture showing a 4 mm diameter cylinder of metal to provide an image of the sample size of binder used in the test
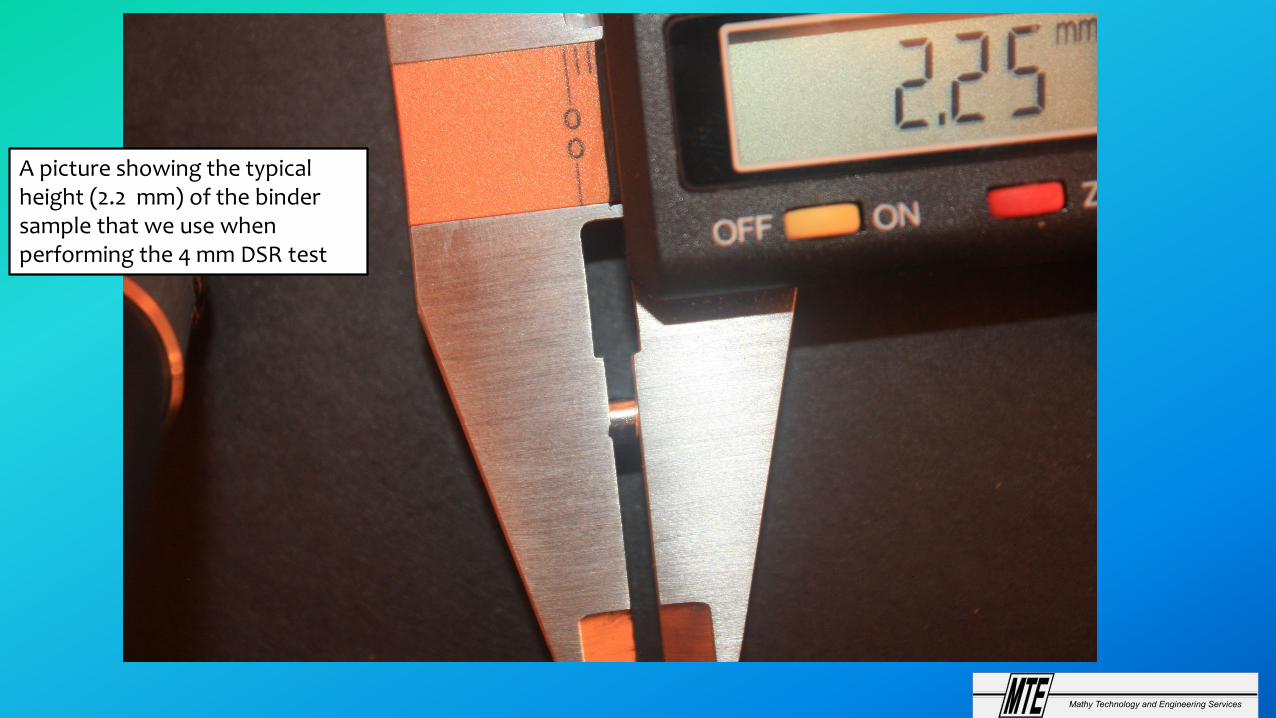
A picture showing the typical height (2.2 mm) of the binder sample that we use when performing the 4 mm DSR test
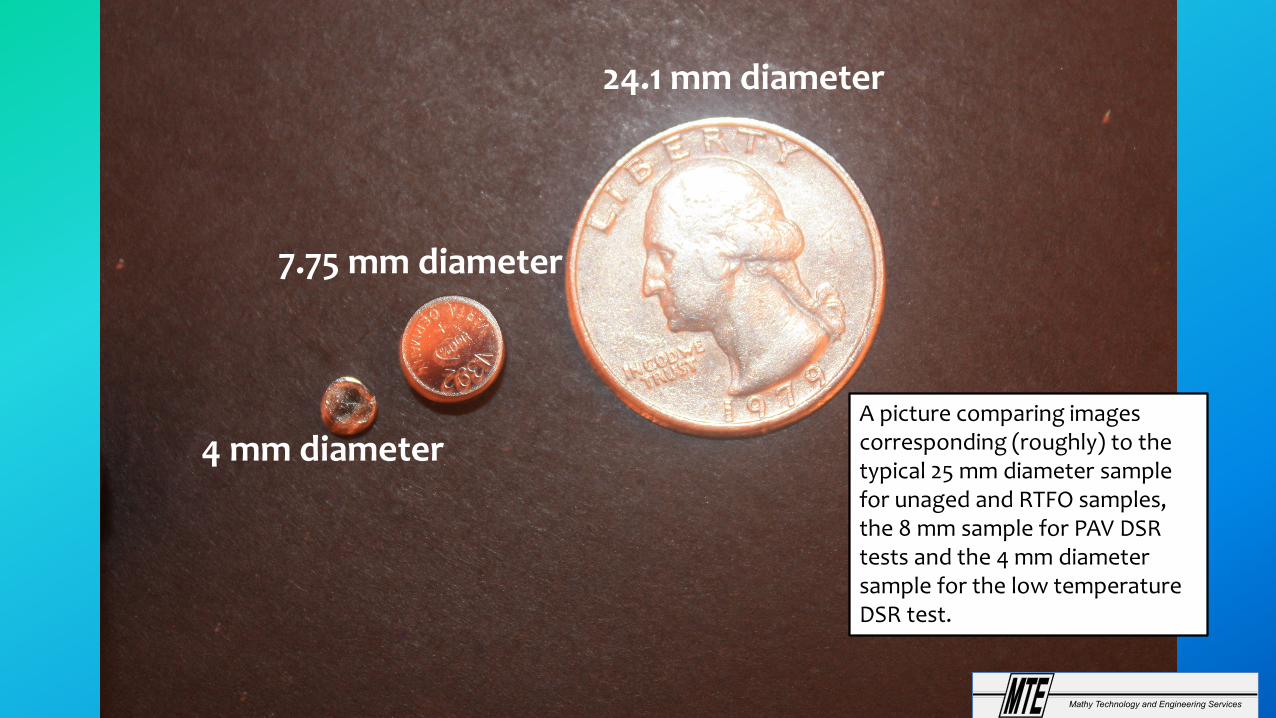
24.1 mm diameter
4 mm diameter
7.75 mm diameter
A picture comparing images corresponding (roughly) to the typical 25 mm diameter sample for unaged and RTFO samples, the 8 mm sample for PAV DSR tests and the 4 mm diameter sample for the low temperature DSR test.
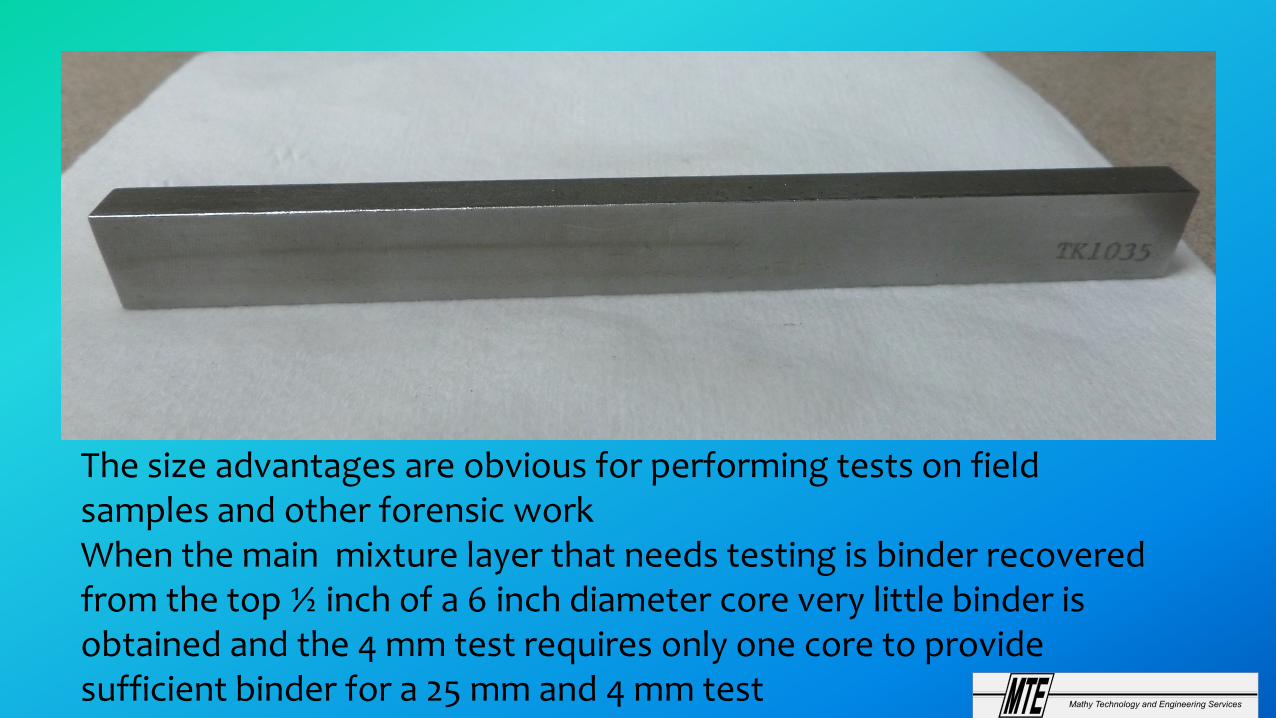
The size advantages are obvious for performing tests on field samples and other forensic workWhen the main mixture layer that needs testing is binder recovered from the top ½ inch of a 6 inch diameter core very little binder is obtained and the 4 mm test requires only one core to provide sufficient binder for a 25 mm and 4 mm test

Just How Does ΔTc Relate to Mix Performance?• Need to get back to RELAXATION• As binders age their ability to relax stress diminishes ∴ BBR
result becomes increasingly m-controlled (poor relaxation) ✓• Some binders have inherently poor relaxation properties, BBR
will show this and ΔTc will quantify ✓• This is not just a low temperature (i.e. sub 0°C) problem
– Ductility decreases when binder cannot relax fast enough to prevent the binder thread from breaking (Kandhal & Glover at 15°C)
– The DSR data shows similar behavior (Glover’s DSR vs Ductility Plot another test performed at 15°C)

Just How Does ΔTc Relate to Mix Performance?• How many of you have really looked at or compared the BBR data
plot for two different binders?• BBR test is not just a single data point at 60 seconds• In that plot is the story of how the binder relaxes (or doesn’t) due
to the imposition of load

1. If you only focus on the slope at 60 seconds you will see a difference, but it is just a comparison of 2 numbers
2. When you look at the complete BBR mastercurve you see how much more readily the binder with a ΔTc of 1°C relaxes stress compared to the binder with a ΔTc of -5°C
10.0
100.0
1,000.0
10,000.0
0.001 0.01 0.1 1 10 100 1000 10000 100000 1000000
BBR
Stif
fnes
s, S
(t),
& 4
mm
Stif
fnes
s G
(t),
MPa
Reduced Time, sec's
BBR S(t) mastercurve @ -18° Ref Temp, Binder A, ΔTc = -5°C
BBR S(t) mastercurve @ -18° Ref Temp, Binder B, ΔTc= 1°C
Relaxation time = 60 seconds
COMPARISON OF BBR MASTERCURVES @ -18°C FOR TWO DIFFERENT BINDERSCOMMENTS1. Binder sample B has a ΔTc of
-5°C compared to sample A with a ΔTc of +1.
2. The important point is that sample A relaxes the applied BBR load over the same time period at slower rate than sample B
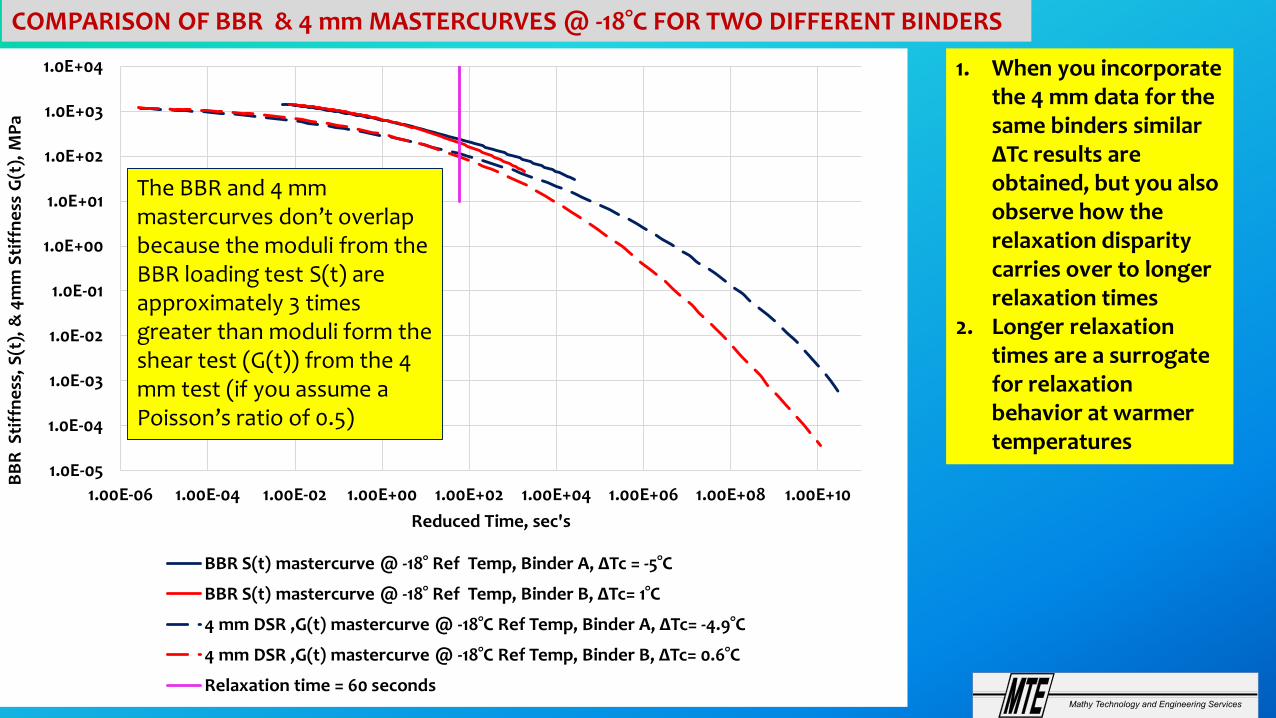
1. When you incorporate the 4 mm data for the same binders similar ΔTc results are obtained, but you also observe how the relaxation disparity carries over to longer relaxation times
2. Longer relaxation times are a surrogate for relaxation behavior at warmer temperatures
1.0E-05
1.0E-04
1.0E-03
1.0E-02
1.0E-01
1.0E+00
1.0E+01
1.0E+02
1.0E+03
1.0E+04
1.00E-06 1.00E-04 1.00E-02 1.00E+00 1.00E+02 1.00E+04 1.00E+06 1.00E+08 1.00E+10
BBR
Stif
fnes
s, S
(t),
& 4
mm
Stif
fnes
s G
(t),
MPa
Reduced Time, sec's
BBR S(t) mastercurve @ -18° Ref Temp, Binder A, ΔTc = -5°C
BBR S(t) mastercurve @ -18° Ref Temp, Binder B, ΔTc= 1°C
4 mm DSR ,G(t) mastercurve @ -18°C Ref Temp, Binder A, ΔTc= -4.9°C
4 mm DSR ,G(t) mastercurve @ -18°C Ref Temp, Binder B, ΔTc= 0.6°C
Relaxation time = 60 seconds
COMPARISON OF BBR & 4 mm MASTERCURVES @ -18°C FOR TWO DIFFERENT BINDERS
The BBR and 4 mm mastercurves don’t overlap because the moduli from the BBR loading test S(t) are approximately 3 times greater than moduli form the shear test (G(t)) from the 4 mm test (if you assume a Poisson’s ratio of 0.5)
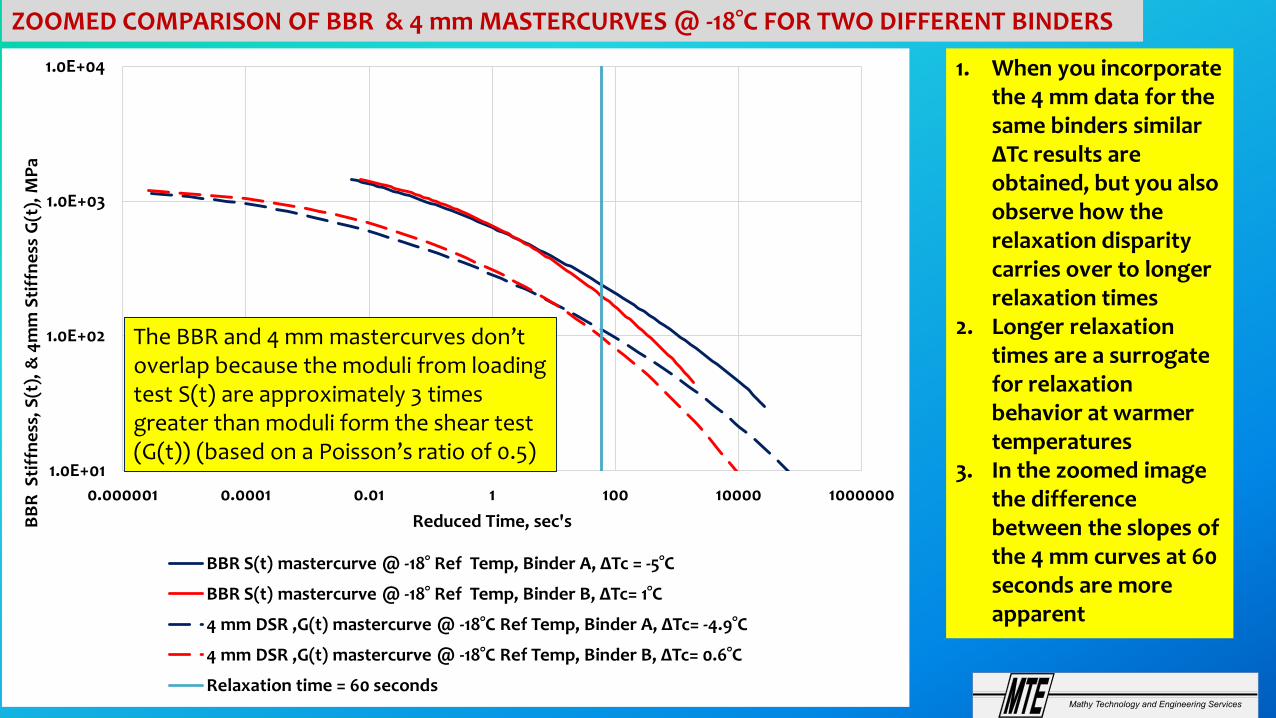
1. When you incorporate the 4 mm data for the same binders similar ΔTc results are obtained, but you also observe how the relaxation disparity carries over to longer relaxation times
2. Longer relaxation times are a surrogate for relaxation behavior at warmer temperatures
3. In the zoomed image the difference between the slopes of the 4 mm curves at 60 seconds are more apparent
ZOOMED COMPARISON OF BBR & 4 mm MASTERCURVES @ -18°C FOR TWO DIFFERENT BINDERS
1.0E+01
1.0E+02
1.0E+03
1.0E+04
0.000001 0.0001 0.01 1 100 10000 1000000
BBR
Stif
fnes
s, S
(t),
& 4
mm
Stif
fnes
s G
(t),
MPa
Reduced Time, sec's
BBR S(t) mastercurve @ -18° Ref Temp, Binder A, ΔTc = -5°C
BBR S(t) mastercurve @ -18° Ref Temp, Binder B, ΔTc= 1°C
4 mm DSR ,G(t) mastercurve @ -18°C Ref Temp, Binder A, ΔTc= -4.9°C
4 mm DSR ,G(t) mastercurve @ -18°C Ref Temp, Binder B, ΔTc= 0.6°C
Relaxation time = 60 seconds
The BBR and 4 mm mastercurves don’t overlap because the moduli from loading test S(t) are approximately 3 times greater than moduli form the shear test (G(t)) (based on a Poisson’s ratio of 0.5)
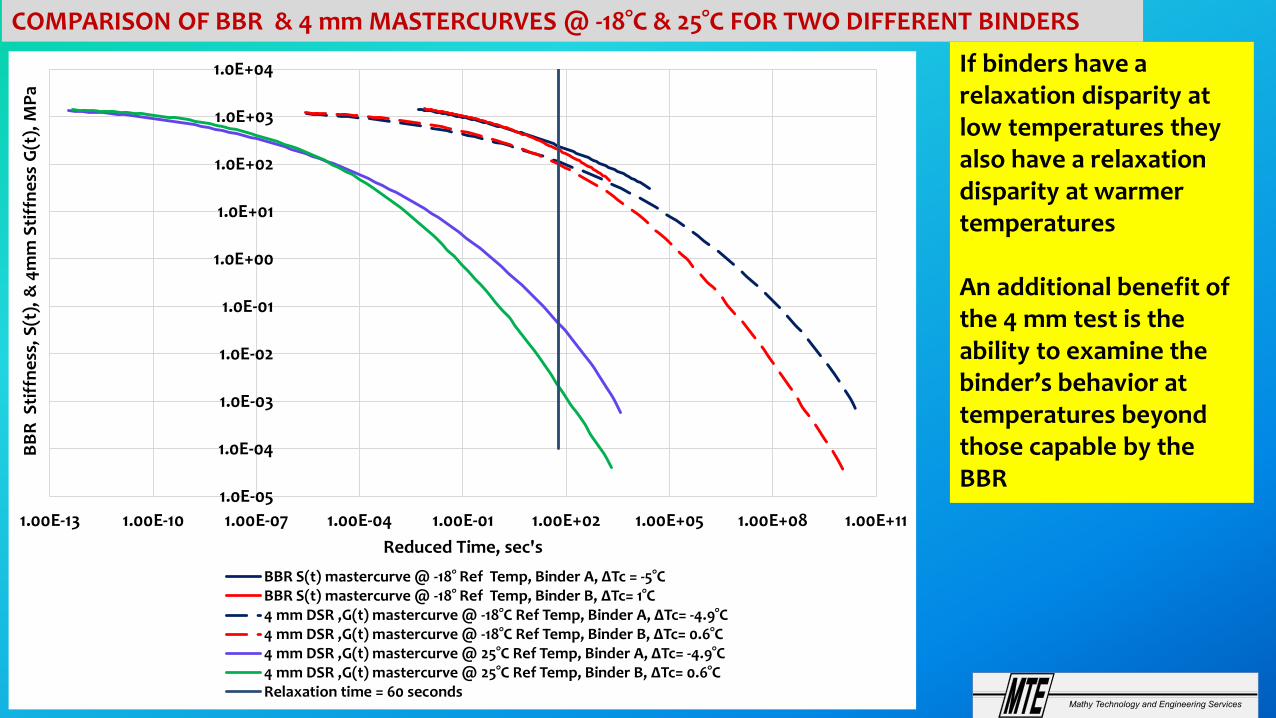
If binders have a relaxation disparity at low temperatures they also have a relaxation disparity at warmer temperatures
An additional benefit of the 4 mm test is the ability to examine the binder’s behavior at temperatures beyond those capable by the BBR
1.0E-05
1.0E-04
1.0E-03
1.0E-02
1.0E-01
1.0E+00
1.0E+01
1.0E+02
1.0E+03
1.0E+04
1.00E-13 1.00E-10 1.00E-07 1.00E-04 1.00E-01 1.00E+02 1.00E+05 1.00E+08 1.00E+11
BBR
Stif
fnes
s, S
(t),
& 4
mm
Stif
fnes
s G
(t),
MPa
Reduced Time, sec's
BBR S(t) mastercurve @ -18° Ref Temp, Binder A, ΔTc = -5°CBBR S(t) mastercurve @ -18° Ref Temp, Binder B, ΔTc= 1°C4 mm DSR ,G(t) mastercurve @ -18°C Ref Temp, Binder A, ΔTc= -4.9°C4 mm DSR ,G(t) mastercurve @ -18°C Ref Temp, Binder B, ΔTc= 0.6°C4 mm DSR ,G(t) mastercurve @ 25°C Ref Temp, Binder A, ΔTc= -4.9°C4 mm DSR ,G(t) mastercurve @ 25°C Ref Temp, Binder B, ΔTc= 0.6°CRelaxation time = 60 seconds
COMPARISON OF BBR & 4 mm MASTERCURVES @ -18°C & 25°C FOR TWO DIFFERENT BINDERS
1.00E+00
1.00E+01
1.00E+02
1.00E+03
1.00E+04
1.00E+05
1.00E+06
1.00E+07
1.00E+08
1.00E+09
1.00E+10
1.00E-04 1.00E-02 1.00E+00 1.00E+02 1.00E+04 1.00E+06 1.00E+08 1.00E+10 1.00E+12 1.00E+14
Com
plex
She
ar M
odul
us, P
a
REDUCED FREQUENCY, rad/sec
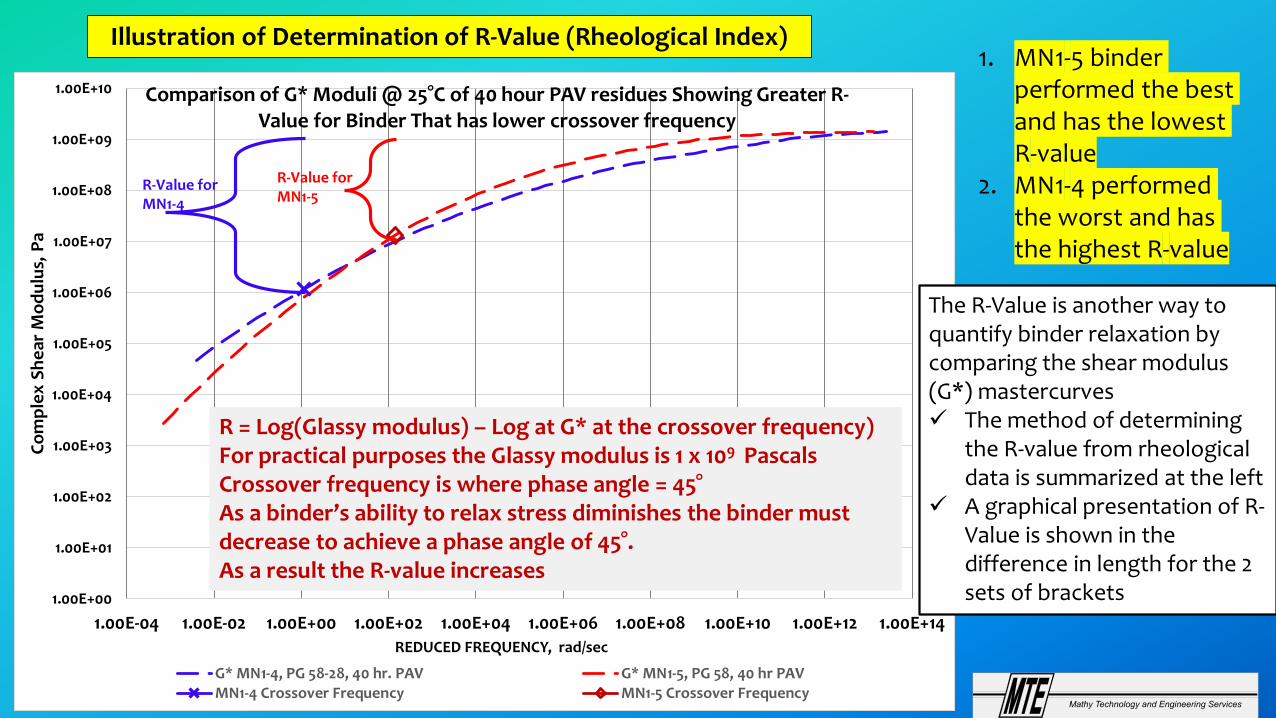
Comparison of G* Moduli @ 25°C of 40 hour PAV residues Showing Greater R-Value for Binder That has lower crossover frequency
G* MN1-4, PG 58-28, 40 hr. PAV G* MN1-5, PG 58, 40 hr PAVMN1-4 Crossover Frequency MN1-5 Crossover Frequency
R-Value forMN1-4
R-Value forMN1-5
Illustration of Determination of R-Value (Rheological Index)1. MN1-5 binder
performed the best and has the lowest R-value
2. MN1-4 performed the worst and has the highest R-value
R = Log(Glassy modulus) – Log at G* at the crossover frequency)For practical purposes the Glassy modulus is 1 x 10⁹ PascalsCrossover frequency is where phase angle = 45°As a binder’s ability to relax stress diminishes the binder must decrease to achieve a phase angle of 45°. As a result the R-value increases
The R-Value is another way to quantify binder relaxation by comparing the shear modulus (G*) mastercurves The method of determining
the R-value from rheological data is summarized at the left
A graphical presentation of R-Value is shown in the difference in length for the 2 sets of brackets

SOME FIELD EXAMPLES

COMPARATIVE CRUDE SOURCE STUDY
• In August of 2006 Mathy constructed at the request of MNDOT and in cooperation with WRI 5 test sections on Olmsted CTH 112, North of Rochester, MN
• Three of these test sections were to be a performance comparison of 3 different crude sources of PG 58-28 binder and the other 2 were a virgin PG 58-34 PMA binder and the project specified mix of a PG 58-34 + 20% RAP
Mathy Technology & Engineering38

0
2
4
6
8
10
12
14
16
18
20
MN1-1 MN1-2 MN1-3 MN1-4 MN1-5
Cra
ckin
g, m
Cracking Results from 2010 Survey, 4 years old, Note cracking data is in meters
Data was collected and published by Wester Research Institute
Transverse (low), m Transverse (mod), m Longitudinal (Low), m
Mathy Technology & Engineering
At 4 years there was not much total cracking in any test section , however sections MN1-3 and MN1-4 had the most cracking.
58-34 +20%RAP
Mathy Technology & Engineering
0
10
20
30
40
50
60
0
2
4
6
8
10
12
14
16
18
20
MN1-1 MN1-2 MN1-3 MN1-4 MN1-5
Long
itudi
nal C
rack
ing,
m
Tran
sver
se C
rack
ing,
mFa
tigue
Cra
ckin
g, m
2
Transverse (low), m Transverse (mod), mFatigue, m2 Longitudinal (Low), m
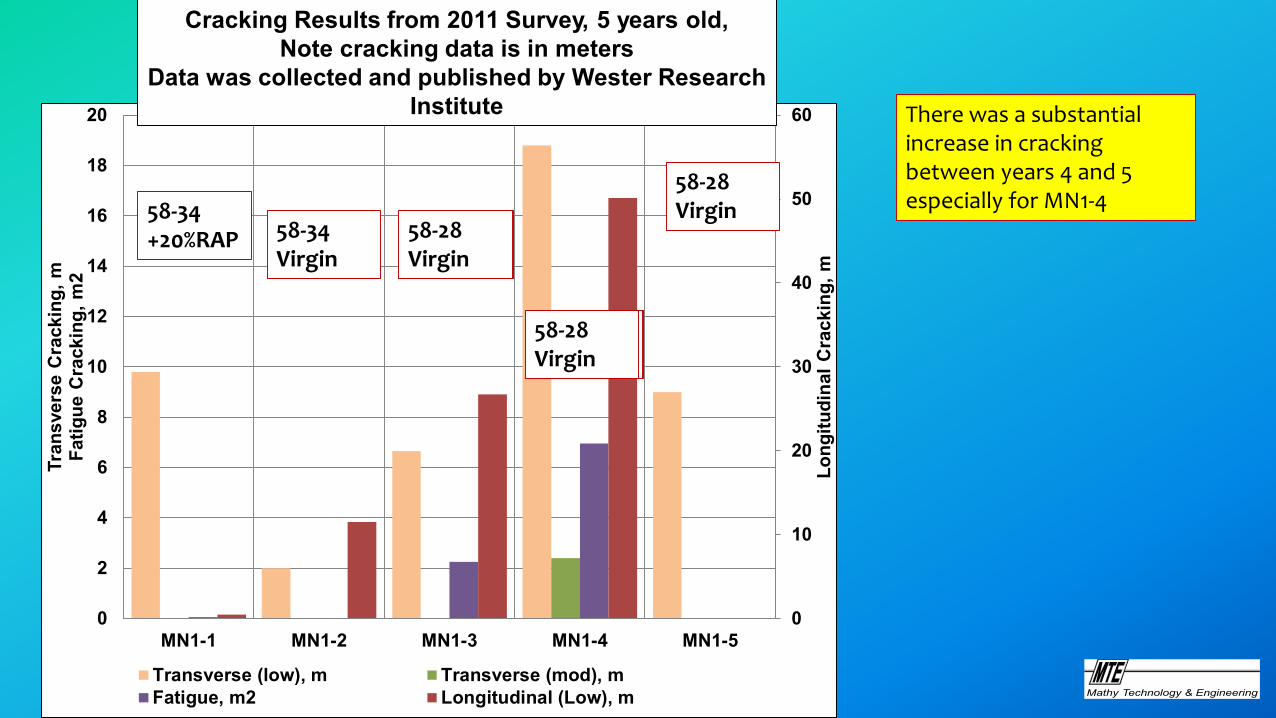
58-34 Virgin
58-28 Virgin
58-28 Virgin
58-28 Virgin
58-28 Virgin
58-28 Virgin58-28 Virgin
There was a substantial increase in cracking between years 4 and 5 especially for MN1-458-34
+20%RAP
Cracking Results from 2011 Survey, 5 years old, Note cracking data is in meters
Data was collected and published by Wester Research Institute

Mathy Technology & Engineering41
CORRELATION BETWEEN ΔTc OF 20 & 40 HOUR PAV AND CRACKS IN 2012 FOR OLMSTED CTH 112
218.8 meters
130.5 meters
18 meters
61.9 meters
MN1-4
MN1-3
MN1-5
MN1-2
MN1-4
MN1-3
MN1-5
MN1-2
R² = 0.919
R² = 0.9593
0
50
100
150
200
250
-10 -8 -6 -4 -2 0 2 4
TOTA
L CR
ACK
S (I
NCL
UD
ES C
ENTE
RLIN
E)
ΔTc (the more negative the more m controlled)
Total Distress (includes centerline & area of fatigue area) from Sept 2012 WRI Survey
20 hour PAV 40 hour PAV Linear (20 hour PAV) Linear (40 hour PAV)
COMMENTS1. Plot of ΔTc for 20 and 40 hour
PAV residues versus the amount of cracking after 6 years of service
2. The correlation is slightly better for the 40 hour PAV data than the 20 hour data
3. Regardless of the ΔTc values there is a strong correlation between worsening pavement performance and worsening ΔTc
Mathy Technology & Engineering42
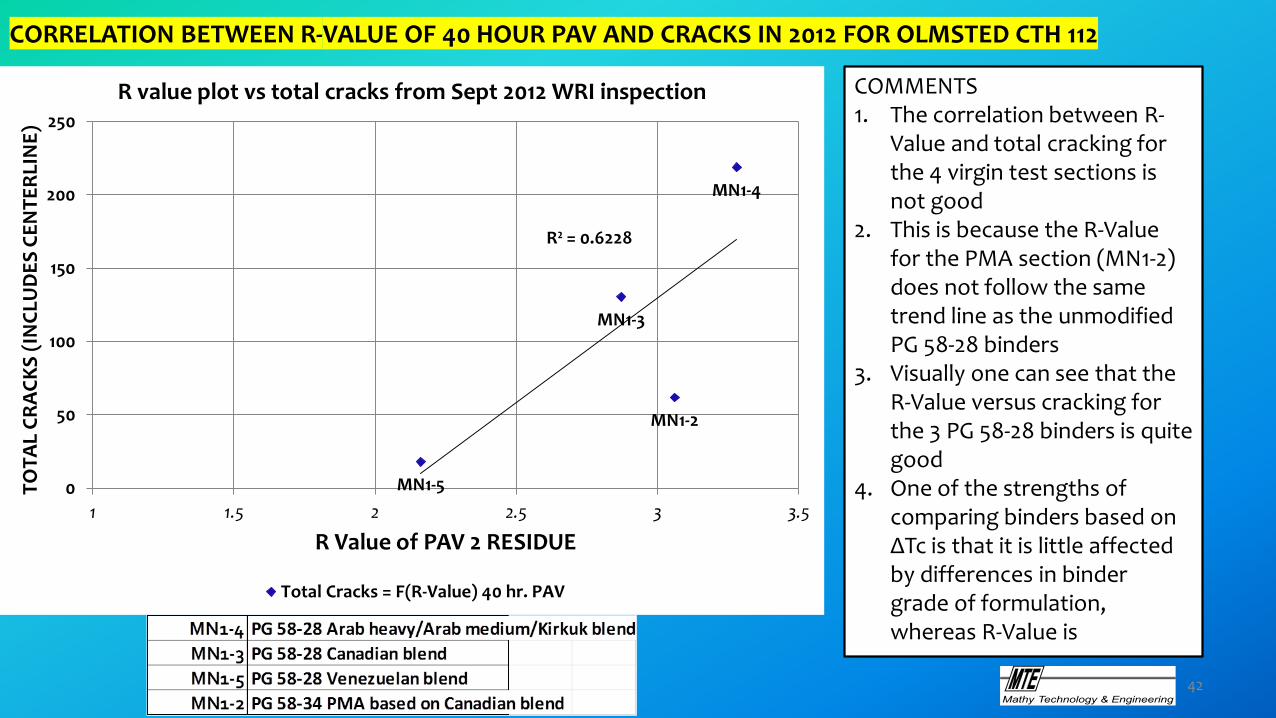
CORRELATION BETWEEN R-VALUE OF 40 HOUR PAV AND CRACKS IN 2012 FOR OLMSTED CTH 112
MN1-4
MN1-3
MN1-5
MN1-2
R² = 0.6228
0
50
100
150
200
250
1 1.5 2 2.5 3 3.5
TOTA
L CR
ACK
S (I
NCL
UD
ES C
ENTE
RLIN
E)
R Value of PAV 2 RESIDUE
R value plot vs total cracks from Sept 2012 WRI inspection
Total Cracks = F(R-Value) 40 hr. PAV
COMMENTS1. The correlation between R-
Value and total cracking for the 4 virgin test sections is not good
2. This is because the R-Value for the PMA section (MN1-2) does not follow the same trend line as the unmodified PG 58-28 binders
3. Visually one can see that the R-Value versus cracking for the 3 PG 58-28 binders is quite good
4. One of the strengths of comparing binders based on ΔTc is that it is little affected by differences in binder grade of formulation, whereas R-Value is

1.0E+00
1.0E+01
1.0E+02
1.0E+03
1.0E+04
1.0E+05
1.0E+06
1.0E+07
1.0E+08
1.0E+09
1.0E+10
1.0E-13 1.0E-11 1.0E-09 1.0E-07 1.0E-05 1.0E-03 1.0E-01 1.0E+01 1.0E+03 1.0E+05
Rela
xatio
n M
odul
us, G
(t),
Log
Scal
ed
Reduced time, Log ScaledG(t) @15°C 1478, 08-27-14-D, MN1-5, 58-28, 40 HR. PAV, 4mm, G(t) @15°C 1478, 08-27-14-E, MN1-3, 58-28, 40 HR. PAV, 4mm
G(t) @15°C MN1-4, 58-28, 07-10-14-D, 40 HR. PAV, 4mm
MN1-5ΔTc=+0.8°C
MN1-3ΔTc= -4.2°C
MN1-4ΔTc= -7.6°C
Reduced Time VS Relaxation Modulus @ 15°C for MN1-3, MN1-4, MN1-5 of 40 hour PAV ResidueCOMMENTS1. The plot shows relaxation
moduli for the 40 hour PAV residue of 3 CTH 112 PG 58-28 binders
2. As the relaxation time increases the relaxation modulus of MN1-4 and MN1-3 begin to merge and yet MN1-3 has a ΔTc that is 3.4°C better than MN1-4.
3. MN1-3 has a higher stiffness than MN1-4 at short relaxation times but relaxes more rapidly than MN1-4
4. The plots show that MN1-4 relaxes at a slower rate than does MN1-3

-1.4
-1.2
-1
-0.8
-0.6
-0.4
-0.2
0
-11 -10 -9 -8 -7 -6 -5 -4 -3 -2 -1 0 1 2 3 4 5 6
Slop
e of
Log
redu
ced
time
vs. R
elax
atio
n M
odul
us d
ata
Log Reduced time
Log Reduced Time VS. Slope (m vlaue) of Relaxation Modulus
slope MN1-5, 40 HR PAV RESIDUE slope MN1-3 40 HR. PAV RESIDUE slope MN1-4 40 HR. PAV RESIDUE
MN1-5ΔTc=+0.8°C
MN1-3ΔTc= -4.2°C
MN1-4ΔTc= -7.6°C
COMMENTS1. To further clarify the
results of the previous slide I show the plot of slope value of the relaxation modulus mastercurves for each binder. Think of this as determining the m-value at every point along the relaxation modulus curve
2. What you see is the slope of MN1-3 changes faster than does the slope of MN1-4 and the slope of MN1-5 decreases at the fastest rate of all.
3. This rate of relaxation emphasizes the interrelation of relaxation slope and level of ΔTc
The plots in this slide are the slope values from the previous plots. I calculated the first derivative of relaxation modulus data plot at 100 points resulting in the plots shown here.
45
MN1-2
MN1-3
MN1-4
MN1-5MN1-2MN1-3
MN1-4MN1-5
y = -54.788x + 151.08R² = 0.9638
y = -4.1875x + 16.721R² = 0.6744
y = -50.601x + 134.36R² = 0.9349
0.0
100.0
200.0
300.0
400.0
500.0
600.0
-7.0 -6.0 -5.0 -4.0 -3.0 -2.0 -1.0 0.0 1.0 2.0
DIS
TR
ESS
DAT
A, 2
014
SUR
VE
Y, m
eter
ΔTc OF BINDER RECOVERED FROM TOP 1/2 INCH OF 2014 CORES
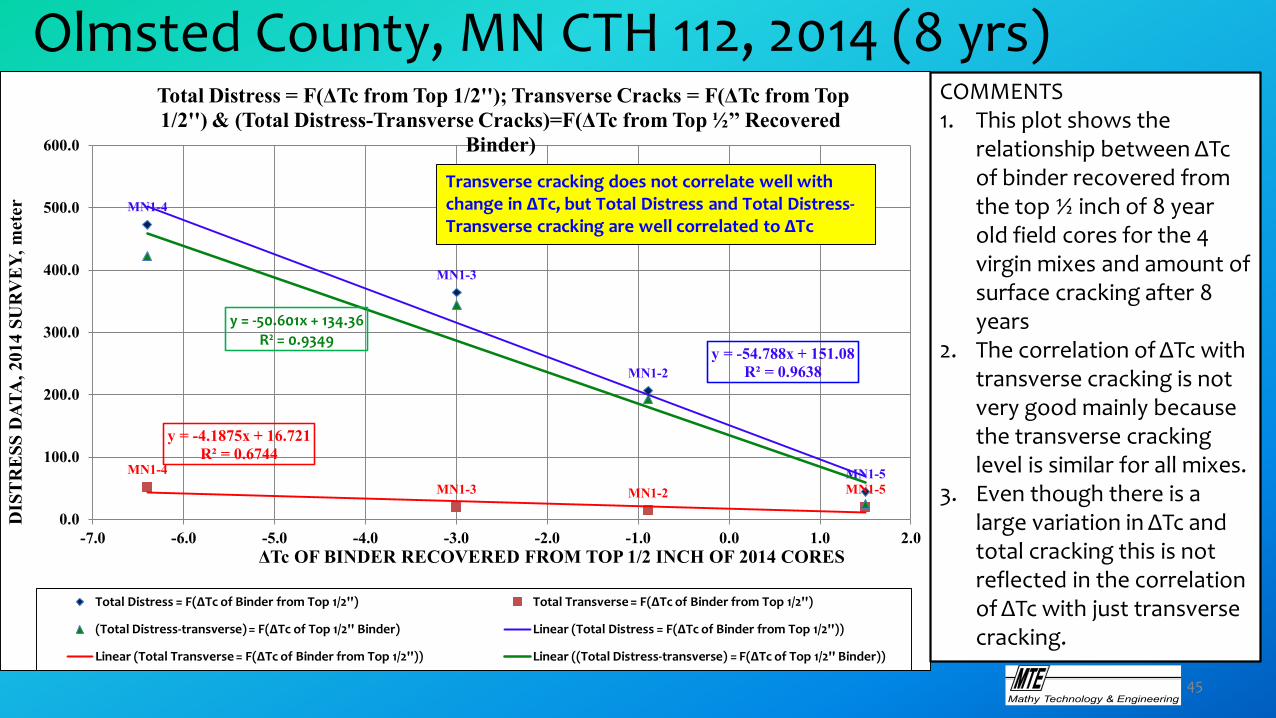
Total Distress = F(ΔTc from Top 1/2''); Transverse Cracks = F(ΔTc from Top 1/2'') & (Total Distress-Transverse Cracks)=F(ΔTc from Top ½’’ Recovered
Binder)
Total Distress = F(ΔTc of Binder from Top 1/2'') Total Transverse = F(ΔTc of Binder from Top 1/2'')
(Total Distress-transverse) = F(ΔTc of Top 1/2'' Binder) Linear (Total Distress = F(ΔTc of Binder from Top 1/2''))
Linear (Total Transverse = F(ΔTc of Binder from Top 1/2'')) Linear ((Total Distress-transverse) = F(ΔTc of Top 1/2'' Binder))
Transverse cracking does not correlate well with change in ΔTc, but Total Distress and Total Distress-Transverse cracking are well correlated to ΔTc
Mathy Technology & Engineering
Olmsted County, MN CTH 112, 2014 (8 yrs) COMMENTS1. This plot shows the
relationship between ΔTc of binder recovered from the top ½ inch of 8 year old field cores for the 4 virgin mixes and amount of surface cracking after 8 years
2. The correlation of ΔTc with transverse cracking is not very good mainly because the transverse cracking level is similar for all mixes.
3. Even though there is a large variation in ΔTc and total cracking this is not reflected in the correlation of ΔTc with just transverse cracking.
1.0E+00
1.0E+01
1.0E+02
1.0E+03
1.0E+04
1.0E+05
1.0E+06
1.0E+07
1.0E+08
1.0E+09
1.0E+10
1.0E-08 1.0E-06 1.0E-04 1.0E-02 1.0E+00 1.0E+02 1.0E+04 1.0E+06 1.0E+08 1.0E+10 1.0E+12
RELA
XATI
ON
MO
DU
LUS,
G(t
), P
a
REDUCED TIME, SECONDS
G(t) @-18°C MN1-2 (PMA), 8 yr core Top ½ in, 4mm G(t) @-18°C MN1-1, 8 yr core Top ½ in, 4mm
G(t) @-18°C MN1-4, 8 yr core Top ½ in, 4mm G(t) @-18°C MN1-3, 8 yr core Top ½ in, 4mm
G(t) @-18°C MN1-5, 8 yr core Top ½ in, 4mm
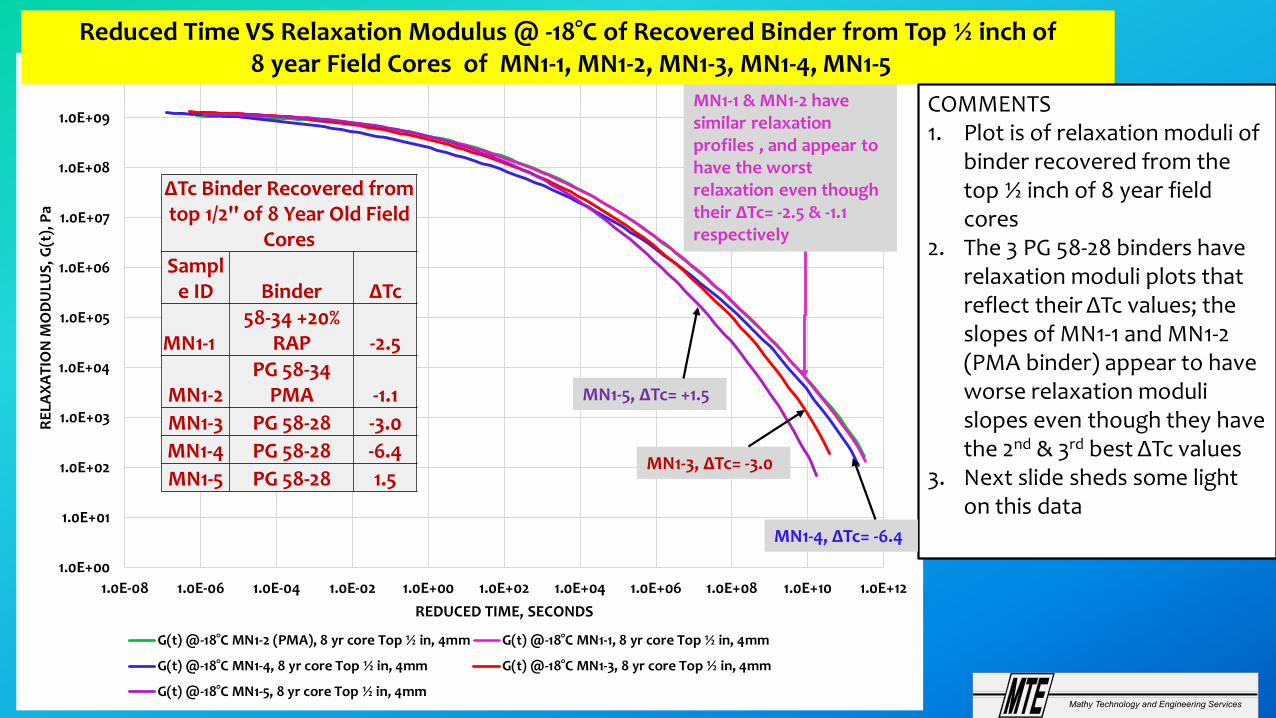
MN1-1 & MN1-2 have similar relaxation profiles , and appear to have the worst relaxation even though their ΔTc= -2.5 & -1.1 respectively
Reduced Time VS Relaxation Modulus @ -18°C of Recovered Binder from Top ½ inch of8 year Field Cores of MN1-1, MN1-2, MN1-3, MN1-4, MN1-5
COMMENTS1. Plot is of relaxation moduli of
binder recovered from the top ½ inch of 8 year field cores
2. The 3 PG 58-28 binders have relaxation moduli plots that reflect their ΔTc values; the slopes of MN1-1 and MN1-2 (PMA binder) appear to have worse relaxation moduli slopes even though they have the 2nd & 3rd best ΔTc values
3. Next slide sheds some light on this data
ΔTc Binder Recovered from top 1/2'' of 8 Year Old Field
CoresSampl
e ID Binder ΔTc
MN1-158-34 +20%
RAP -2.5
MN1-2PG 58-34
PMA -1.1MN1-3 PG 58-28 -3.0MN1-4 PG 58-28 -6.4MN1-5 PG 58-28 1.5
MN1-4, ΔTc= -6.4
MN1-3, ΔTc= -3.0
MN1-5, ΔTc= +1.5

-0.5
-0.45
-0.4
-0.35
-0.3
-0.25
-0.2
-0.15
-0.1
-0.05
0
-8 -6 -4 -2 0 2 4 6
SLO
PE O
F RE
LAXA
TIO
N M
OD
ULU
S M
AST
ERCU
RVE
LOG of REDUCED TIME
SLOPE OF RELAXATION MODULUS @ -18°C VERSUS LOG OF REDUCED TIME
Slope G(t) @-18°C MN1-4, 8 yr core Top ½ in, 4mm Slope G(t) @-18°C MN1-2 (PMA), 8 yr core Top ½ in, 4mm
Slope G(t) @-18°C MN1-1, 8 yr core Top ½ in, 4mm Slope G(t) @-18°C MN1-3, 8 yr core Top ½ in, 4mm
Slope G(t) @-18°C MN1-5, 8 yr core Top ½ in, 4mm LOG OF 60 SECONDS
TEST SECTION
Slope_at_-18°C
MN1-1 -0.2541MN1-2 -0.2957MN1-3 -0.2634MN1-4 -0.24845MN1-5 -0.2911
COMMENTS1. This is a zoomed plot of the
slope of the relaxation modulus mastercurve vs log of reduced time for all 5 CTH 112 binders
2. MN1-1 starts out at a slightly lower relaxation modulus than MN1-5, but relaxes more slowly and by 60 seconds is relaxing at a slower rate than MN1-2
3. MN1-4 which has the lowest relaxation modulus at short times relaxes so slowly that it eventually crosses over all of the other binders and has the worst slope of all materials
Mathy Technology & Engineering

-0.18
-0.16
-0.14
-0.12
-0.1
-0.08
-0.06
-0.04
-0.02
0
-8 -6 -4 -2 0 2 4 6 8 10 12 14
2nd
Der
ivat
ive
of B
inde
r Rel
axat
ion
Mod
ulus
Mas
terc
urve
Reduced Time, seconds, Log Scale
2nd Derivative of G(t) @-18°C MN1-4 8 yr core top 1/2'' 2nd Derivative of G(t) @-18°C MN1-1 8 yr core top 1/2''
2nd Derivative of G(t) @-18°C MN1-3, 8 yr core top 1/2'' 2nd Derivative of G(t) @-18°C MN1-2, 8 yr core top 1/2''
2nd Derivative of G(t) @-18°C MN1-5, 8 yr core top 1/2'' reduced time = 60 seconds
ΔTc= +1.5
ΔTc= -1.1
ΔTc= -3.0
ΔTc= -2.5
ΔTc= -6.4
Plot of 2nd Derivative of Relaxation Modulus Mastercurve COMMENTS1. The 2nd derivative of the
relaxation modulus mastercurve in effect provides the rate of change in the slope of the relaxation modulus
2. The data at 60 seconds shows MN1-4 (ΔTc = -6.4) has the slowest relaxation rate; the relaxation rates for MN1-1 (ΔTc = -2.5), MN 1-3 (ΔTc = -3.0), and MN1-2(ΔTc= -1.1) are grouped very closely together as are their ΔTc values.
3. MN1-5 (ΔTc = +1.5) exhibits amuch greater relaxation rateand also has a substantially higher ΔTc
4. These results show quantitatively and qualitatively the interconnection between binder relaxation and ΔTc
MN1-4
MN1-3
MN1-5
MN1-2
R² = 0.6228
0
50
100
150
200
250
1 1.5 2 2.5 3 3.5
TOTA
L CR
ACK
S (I
NCL
UD
ES C
ENTE
RLIN
E)
R Value of PAV 2 RESIDUE
R value plot vs total cracks from Sept 2012 WRI inspection
Total Cracks = F(R-Value) 40 hr. PAV
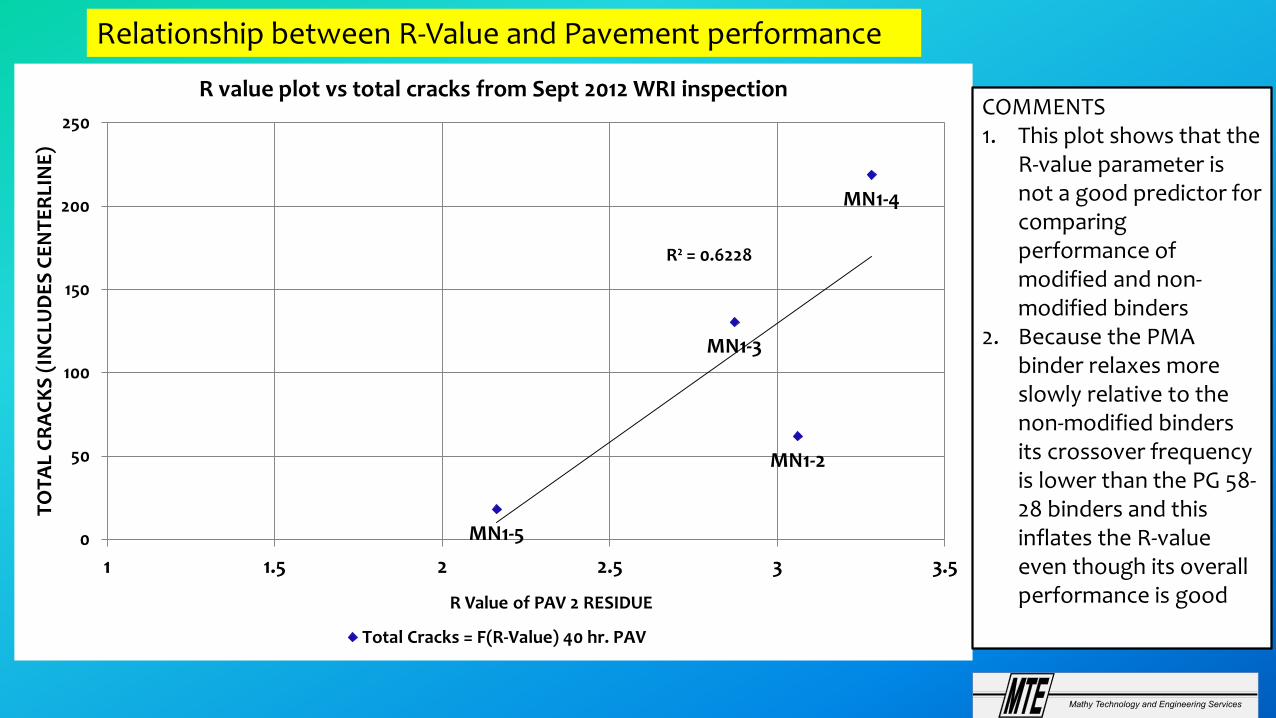
Relationship between R-Value and Pavement performance
COMMENTS1. This plot shows that the
R-value parameter is not a good predictor for comparing performance of modified and non-modified binders
2. Because the PMA binder relaxes more slowly relative to the non-modified binders its crossover frequency is lower than the PG 58-28 binders and this inflates the R-value even though its overall performance is good
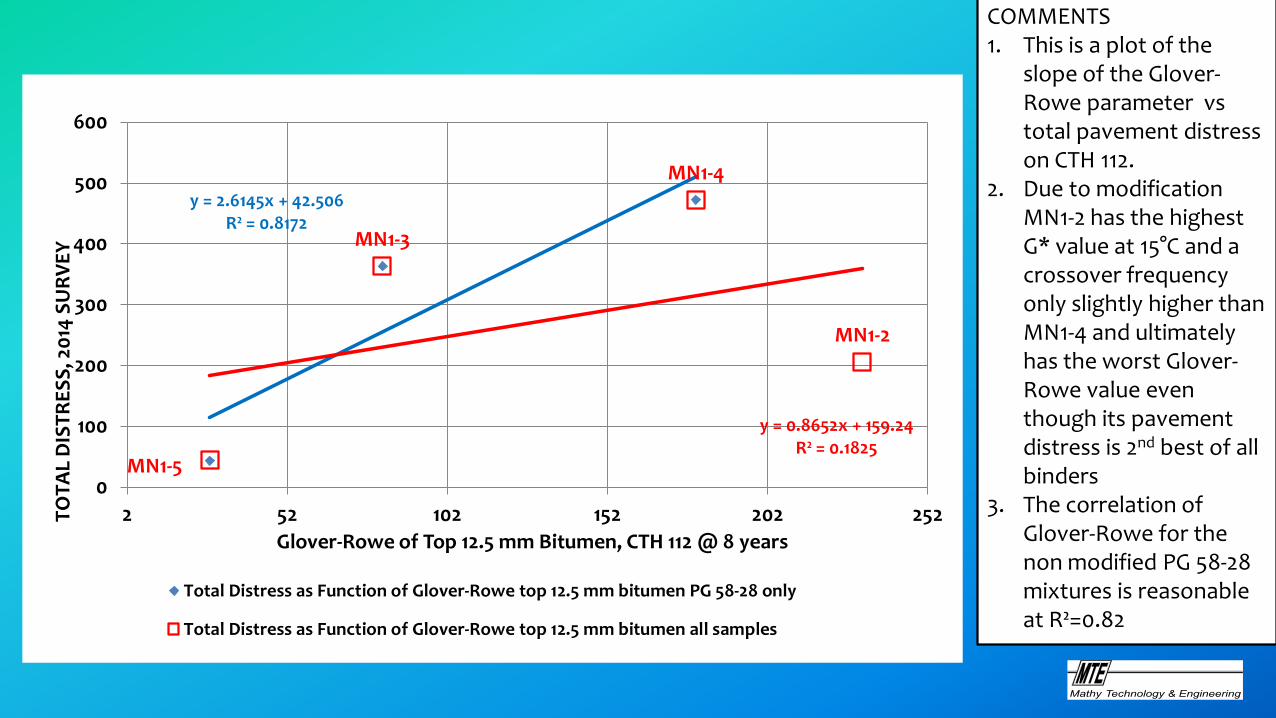
MN1-2
MN1-3
MN1-4
MN1-5
y = 2.6145x + 42.506R² = 0.8172
y = 0.8652x + 159.24R² = 0.1825
0
100
200
300
400
500
600
2 52 102 152 202 252TOTA
L D
ISTR
ESS,
201
4 SU
RVEY
Glover-Rowe of Top 12.5 mm Bitumen, CTH 112 @ 8 years
Total Distress as Function of Glover-Rowe top 12.5 mm bitumen PG 58-28 only
Total Distress as Function of Glover-Rowe top 12.5 mm bitumen all samples
COMMENTS1. This is a plot of the
slope of the Glover-Rowe parameter vs total pavement distress on CTH 112.
2. Due to modification MN1-2 has the highest G* value at 15°C and a crossover frequency only slightly higher than MN1-4 and ultimately has the worst Glover-Rowe value even though its pavement distress is 2nd best of all binders
3. The correlation of Glover-Rowe for the non modified PG 58-28 mixtures is reasonable at R²=0.82
Mathy Technology & Engineering

MN1-2
MN1-3
MN1-4
MN1-5
y = -59.563x + 464.77R² = 0.9926
y = -45.767x + 374.4R² = 0.6489
0
50
100
150
200
250
300
350
400
450
500
0 1 2 3 4 5 6 7 8
TOTA
L D
ISTR
ESS,
201
4 SU
RVEY
Cross Over Frequency of Top 12.5 mm Bitumen, CTH 112 @ 8 years
Total Distress as Function of Crossover Freq top 12.5 mm bitumen PG 58-28 only
Total Distress as Function of Crossover Freq top 12.5 mm bitumen all samples
COMMENTS1. It stands to reason that if
R-Value is does not correlate well to pavement performance that crossover frequency would not given that one of the inputs for R-Value is crossover frequency.
2. MN1-2 has a crossover frequency slightly better than MN1-4, the worst performer.
3. Crossover frequency correlates strongly for the non-modified binders even though they are from 3 distinct crude sources.
4. Crossover frequency does not correlate across different binder formulations
Total avement Distress plotted as a Function of Crossover Frequency
Mathy Technology & Engineering

MnROAD TEST OF 3 BINDERS
1. CONSTRUCTED IN SEPT 19992. 3 BINDERS
a. PG 58-28b. PG 58-34c. PG 58-40
3. TRAFFICED UNTIL APRIL 20074. ANNUAL OR NEARLY ANNUAL PAVEMENT DISTRESS
SURVEYS CONDUCTED
Mathy Technology & Engineering
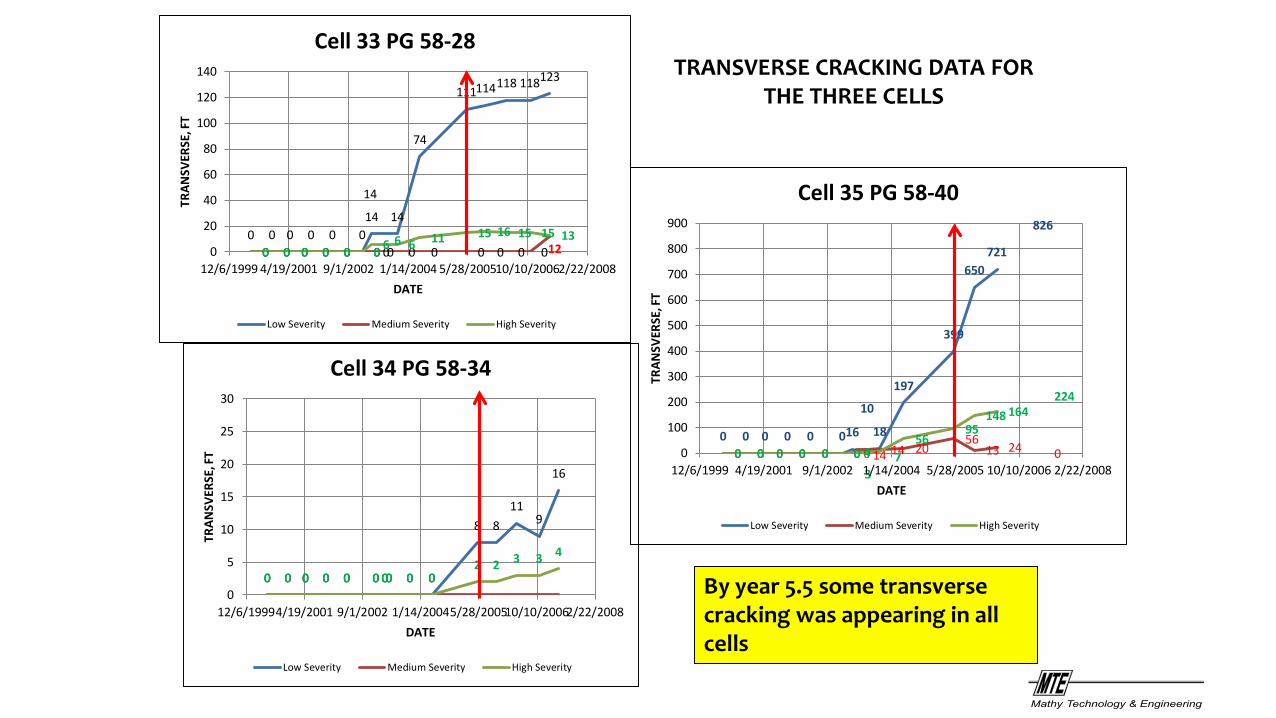
0 0 0 0 0 014
14
14
74
111114118 118123
0 0 0 0 0 0 00 0 0 0 0 0 0120 0 0 0 0 0 6 6 6 11 15 16 15 15 130
20
40
60
80
100
120
140
12/6/1999 4/19/2001 9/1/2002 1/14/2004 5/28/200510/10/20062/22/2008
TRAN
SVER
SE, F
T
DATE
Cell 33 PG 58-28
Low Severity Medium Severity High Severity
0 0 0 0 0 0 00 0 0
8 811
9
16
0 0 0 0 0 0 00 0 02 2 3 3 4
0
5
10
15
20
25
30
12/6/19994/19/2001 9/1/2002 1/14/20045/28/200510/10/20062/22/2008
TRAN
SVER
SE, F
T
DATE
Cell 34 PG 58-34
Low Severity Medium Severity High Severity
0 0 0 0 0 016
10
18
197
399
650721
826
0 0 0 0 0 0 0 14 14 2056
13 24 00 0 0 0 0 0 4
37
5695
148 164224
0
100
200
300
400
500
600
700
800
900
12/6/1999 4/19/2001 9/1/2002 1/14/2004 5/28/2005 10/10/2006 2/22/2008
TRAN
SVER
SE, F
T
DATE
Cell 35 PG 58-40
Low Severity Medium Severity High Severity
TRANSVERSE CRACKING DATA FOR THE THREE CELLS
By year 5.5 some transverse cracking was appearing in all cells
Mathy Technology & Engineering
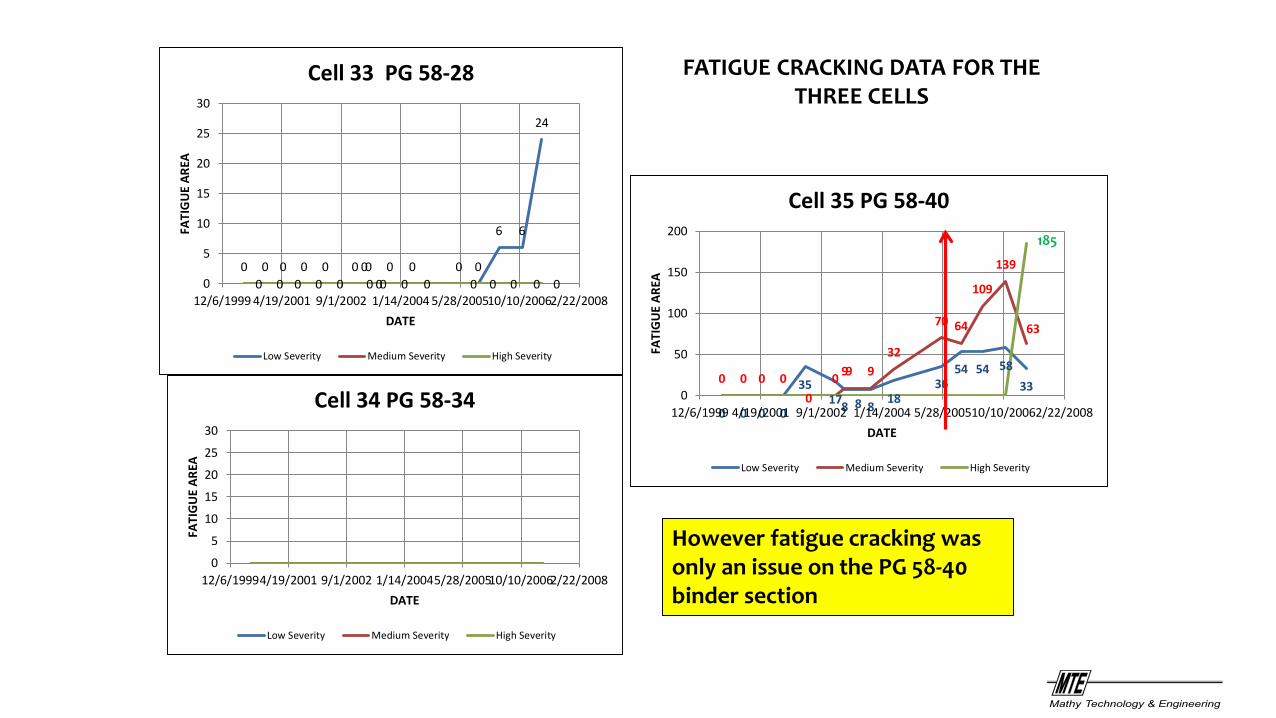
0 0 0 0 0 0 00 0 0 0 0
6 6
24
0 0 0 0 0 0 00 0 0 0 0 0 0 00
5
10
15
20
25
30
12/6/1999 4/19/2001 9/1/2002 1/14/2004 5/28/200510/10/20062/22/2008
FATI
GU
E AR
EA
DATE
Cell 33 PG 58-28
Low Severity Medium Severity High Severity
0
5
10
15
20
25
30
12/6/19994/19/2001 9/1/2002 1/14/20045/28/200510/10/20062/22/2008
FATI
GU
E AR
EA
DATE
Cell 34 PG 58-34
Low Severity Medium Severity High Severity
0 0 0 0
35178 8 8 18
3654 54 58
330 0 0 00
0 99 932
70 64
109
139
63
0
50
100
150
200
12/6/1999 4/19/2001 9/1/2002 1/14/2004 5/28/200510/10/20062/22/2008
FATI
GU
E AR
EA
DATE
Cell 35 PG 58-40
Low Severity Medium Severity High Severity
185
FATIGUE CRACKING DATA FOR THE THREE CELLS
However fatigue cracking was only an issue on the PG 58-40 binder section
Mathy Technology & Engineering
58-28
58-34
58-40
PG 58-28
PG 58-34
PG 58-40
0
200
400
600
800
1000
1200
1400
1600
1800
-9.0 -8.0 -7.0 -6.0 -5.0 -4.0 -3.0 -2.0 -1.0 0.0
Tota
l Cra
cks (
Non
CL
), fe
et
ΔTc, °C
4 Year Total Cracks (Non CL)= F(ΔTc @ 40 hr. PAV) 5.5 Year Total Cracks (Non CL) = F(ΔTc @ 40 hr.)
7.5 Year Total Cracks (Non CL) = F(ΔTc @ 40 hr. PAV)
Mathy Technology & Engineering
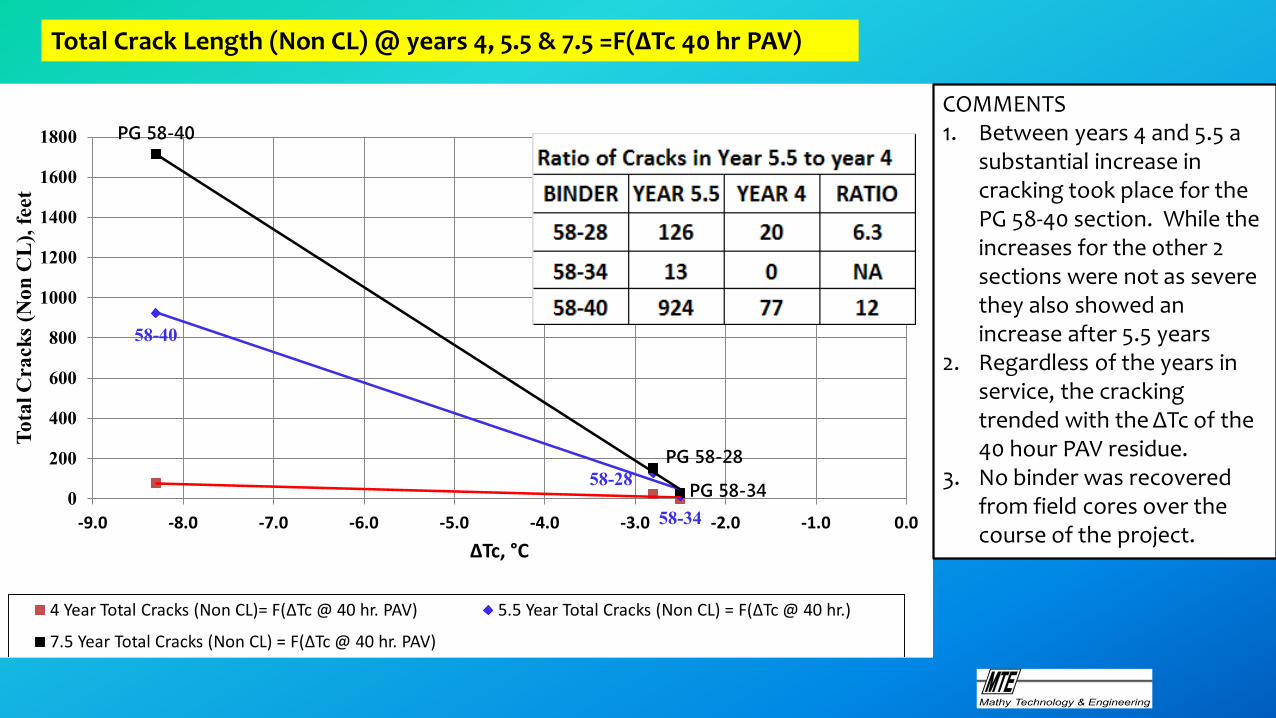
Total Crack Length (Non CL) @ years 4, 5.5 & 7.5 =F(ΔTc 40 hr PAV)
COMMENTS1. Between years 4 and 5.5 a
substantial increase in cracking took place for the PG 58-40 section. While the increases for the other 2 sections were not as severe they also showed an increase after 5.5 years
2. Regardless of the years in service, the cracking trended with the ΔTc of the 40 hour PAV residue.
3. No binder was recovered from field cores over the course of the project.
58-40
58-34
58-28
0
200
400
600
800
1000
1200
1400
1600
1800
0 50 100 150 200 250
Crac
king
at 7
.5 y
ears
, Fee
t
Glover-Rowe, kPa
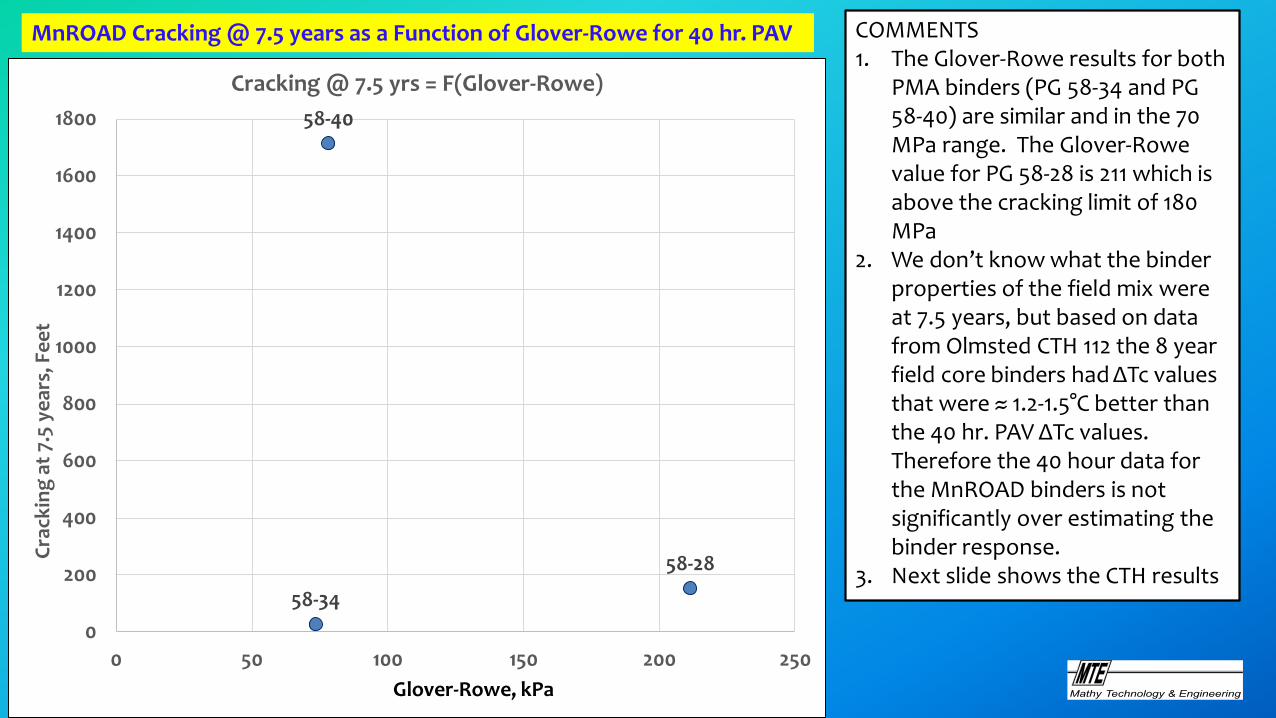
Cracking @ 7.5 yrs = F(Glover-Rowe)
MnROAD Cracking @ 7.5 years as a Function of Glover-Rowe for 40 hr. PAV COMMENTS1. The Glover-Rowe results for both
PMA binders (PG 58-34 and PG 58-40) are similar and in the 70 MPa range. The Glover-Rowe value for PG 58-28 is 211 which is above the cracking limit of 180 MPa
2. We don’t know what the binderproperties of the field mix wereat 7.5 years, but based on datafrom Olmsted CTH 112 the 8 year field core binders had ΔTc values that were ≈ 1.2-1.5°C better than the 40 hr. PAV ΔTc values. Therefore the 40 hour data for the MnROAD binders is not significantly over estimating the binder response.
3. Next slide shows the CTH results
Mathy Technology & Engineering
MN1-2
MN1-3
MN1-4
MN1-5
MN1-2
MN1-3
MN1-4
MN1-5
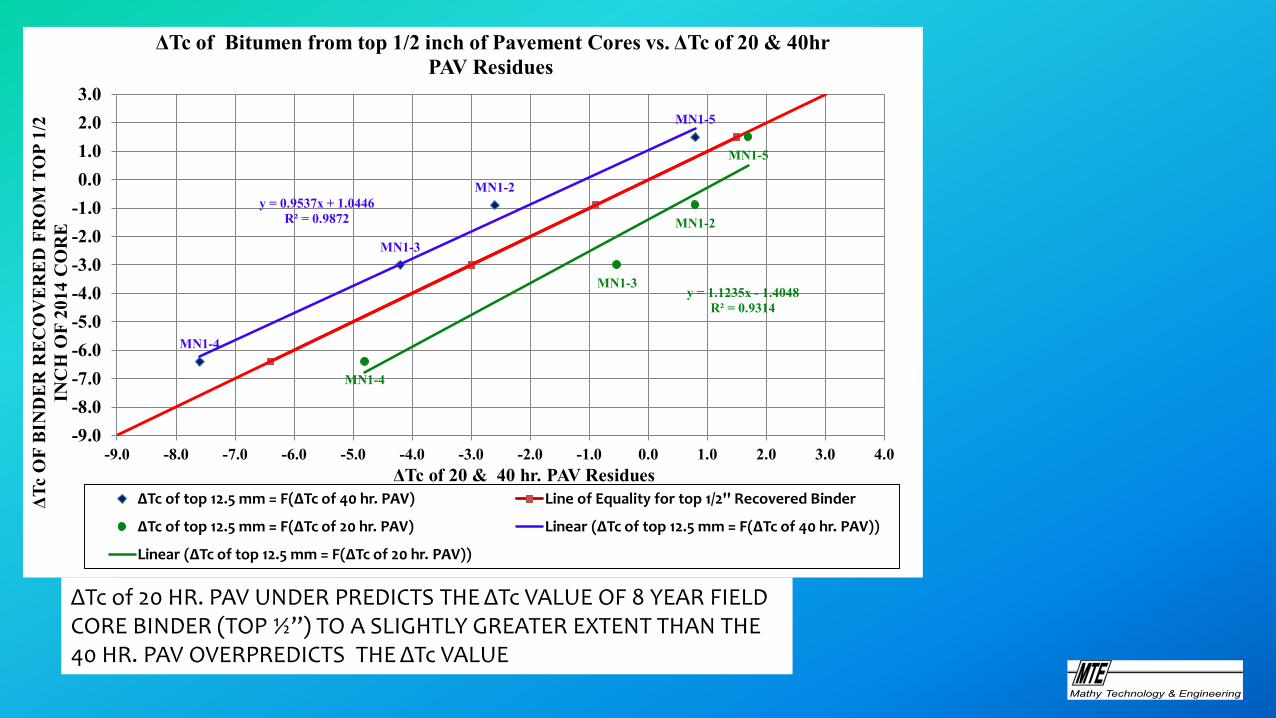
y = 0.9537x + 1.0446R² = 0.9872
y = 1.1235x - 1.4048R² = 0.9314
-9.0-8.0-7.0-6.0-5.0-4.0-3.0-2.0-1.00.01.02.03.0
-9.0 -8.0 -7.0 -6.0 -5.0 -4.0 -3.0 -2.0 -1.0 0.0 1.0 2.0 3.0 4.0
ΔTc
OF
BIN
DE
R R
EC
OV
ER
ED
FR
OM
TO
P 1/
2 IN
CH
OF
2014
CO
RE
ΔTc of 20 & 40 hr. PAV Residues
ΔTc of Bitumen from top 1/2 inch of Pavement Cores vs. ΔTc of 20 & 40hr PAV Residues
ΔTc of top 12.5 mm = F(ΔTc of 40 hr. PAV) Line of Equality for top 1/2'' Recovered Binder
ΔTc of top 12.5 mm = F(ΔTc of 20 hr. PAV) Linear (ΔTc of top 12.5 mm = F(ΔTc of 40 hr. PAV))
Linear (ΔTc of top 12.5 mm = F(ΔTc of 20 hr. PAV))
ΔTc of 20 HR. PAV UNDER PREDICTS THE ΔTc VALUE OF 8 YEAR FIELD CORE BINDER (TOP ½’’) TO A SLIGHTLY GREATER EXTENT THAN THE 40 HR. PAV OVERPREDICTS THE ΔTc VALUE
Mathy Technology & Engineering
58-40 58-34
58-28
0
50
100
150
200
250
-9 -8 -7 -6 -5 -4 -3 -2 -1 0
Glo
ver-
Row
e, M
Pa
ΔTc
Glover-Rowe vs ΔTc
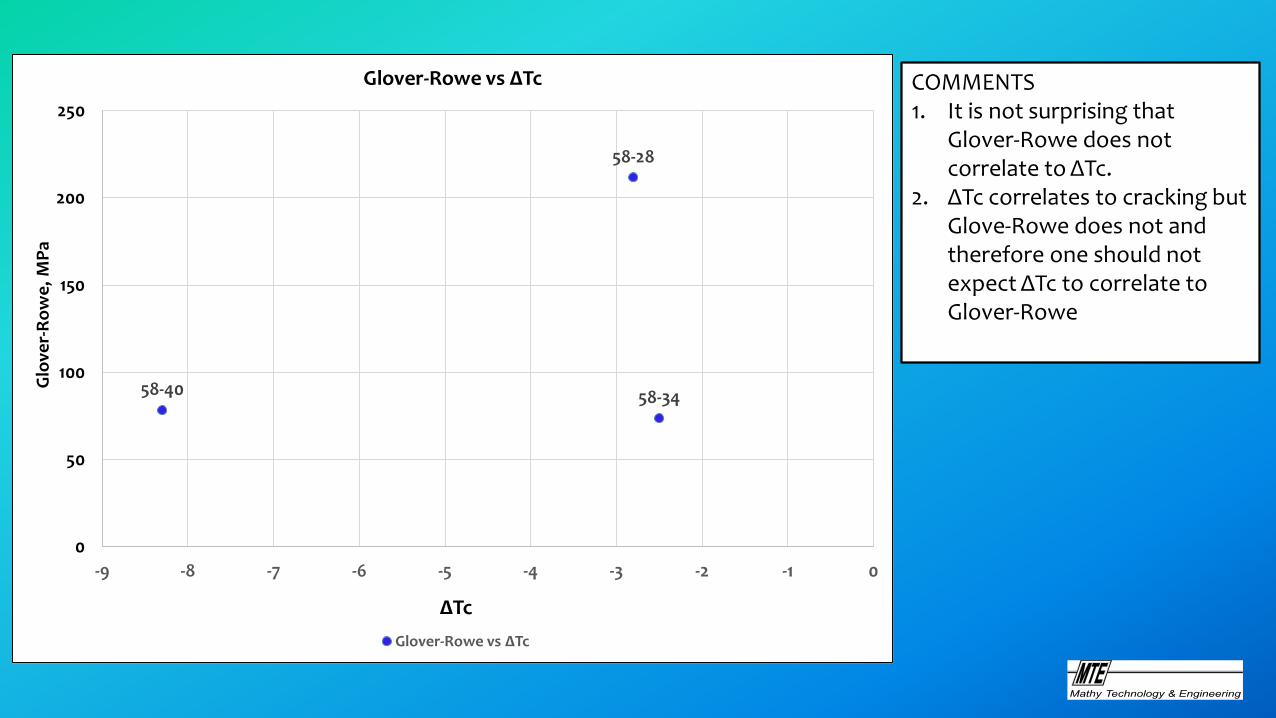
Glover-Rowe vs ΔTc
COMMENTS1. It is not surprising that
Glover-Rowe does not correlate to ΔTc.
2. ΔTc correlates to cracking but Glove-Rowe does not and therefore one should not expect ΔTc to correlate to Glover-Rowe
Mathy Technology & Engineering

0.05183692
0.88636220.1663575
0
200
400
600
800
1000
1200
1400
1600
1800
0 0.1 0.2 0.3 0.4 0.5 0.6 0.7 0.8 0.9 1
Crac
king
Dis
tres
s, F
eet
Crossover Frequency
Cracking @ 7.5 yrs = F(Crossover Freq)
58-28/152 feet 58-34/26
feet
58-40/1713 feet
COMMENTS1. It does not appear as though
there is a good correlation between crossover frequency and pavement cracking
2. An exponential function could be fit to the 3 data points, but it is unlikely that the change in crossover frequency between 0.166 and 0.052 radians/sec (a 3 fold decrease) could result in binder property degradation sufficient to result in an 11 fold increase in cracking distress.
Crossover Freq Calculation
Ratio crossover Frequencies
Cracking calculation
Ratio of cracking
data58-34/58-28 5.32806 152/26 5.8461538558-28/58-40 3.2092 1713/152 11.2697368
Mathy Technology & Engineering
1.0E+00
1.0E+01
1.0E+02
1.0E+03
1.0E+04
1.0E+05
1.0E+06
1.0E+07
1.0E+08
1.0E+09
1.0E+10
1.0E-06 1.0E-04 1.0E-02 1.0E+00 1.0E+02 1.0E+04 1.0E+06 1.0E+08 1.0E+10 1.0E+12
Rela
xatio
n M
odul
us, G
(t),
Pa
Reduced Time, seconds, Log scale
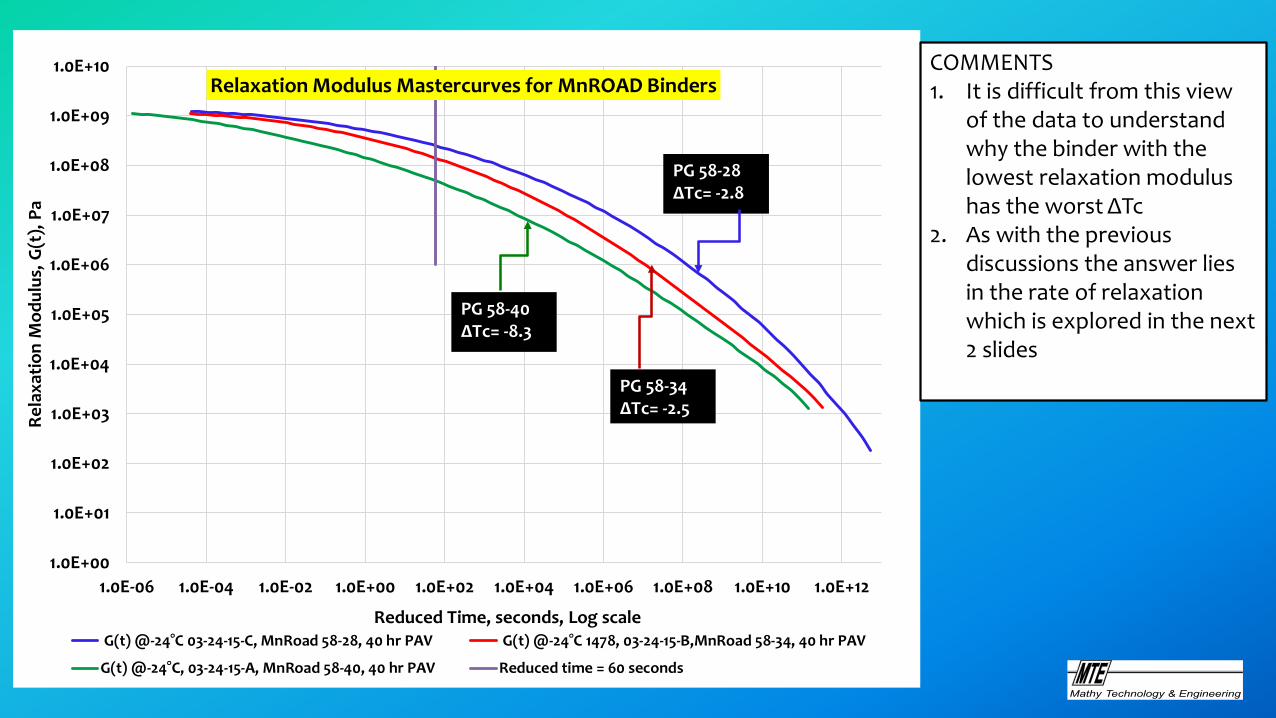
Relaxation Modulus Mastercurves for MnROAD Binders
G(t) @-24°C 03-24-15-C, MnRoad 58-28, 40 hr PAV G(t) @-24°C 1478, 03-24-15-B,MnRoad 58-34, 40 hr PAV
G(t) @-24°C, 03-24-15-A, MnRoad 58-40, 40 hr PAV Reduced time = 60 seconds
PG 58-28ΔTc= -2.8
PG 58-40 ΔTc= -8.3
PG 58-34ΔTc= -2.5
COMMENTS1. It is difficult from this view
of the data to understand why the binder with the lowest relaxation modulus has the worst ΔTc
2. As with the previous discussions the answer lies in the rate of relaxation which is explored in the next 2 slides
Mathy Technology & Engineering
-1.2
-1
-0.8
-0.6
-0.4
-0.2
0
-8.00 -6.00 -4.00 -2.00 0.00 2.00 4.00 6.00 8.00 10.00 12.00 14.00
Slop
e of
Rel
axat
ion
Mod
ulus
Mas
terc
urve
Log of Reduced Time
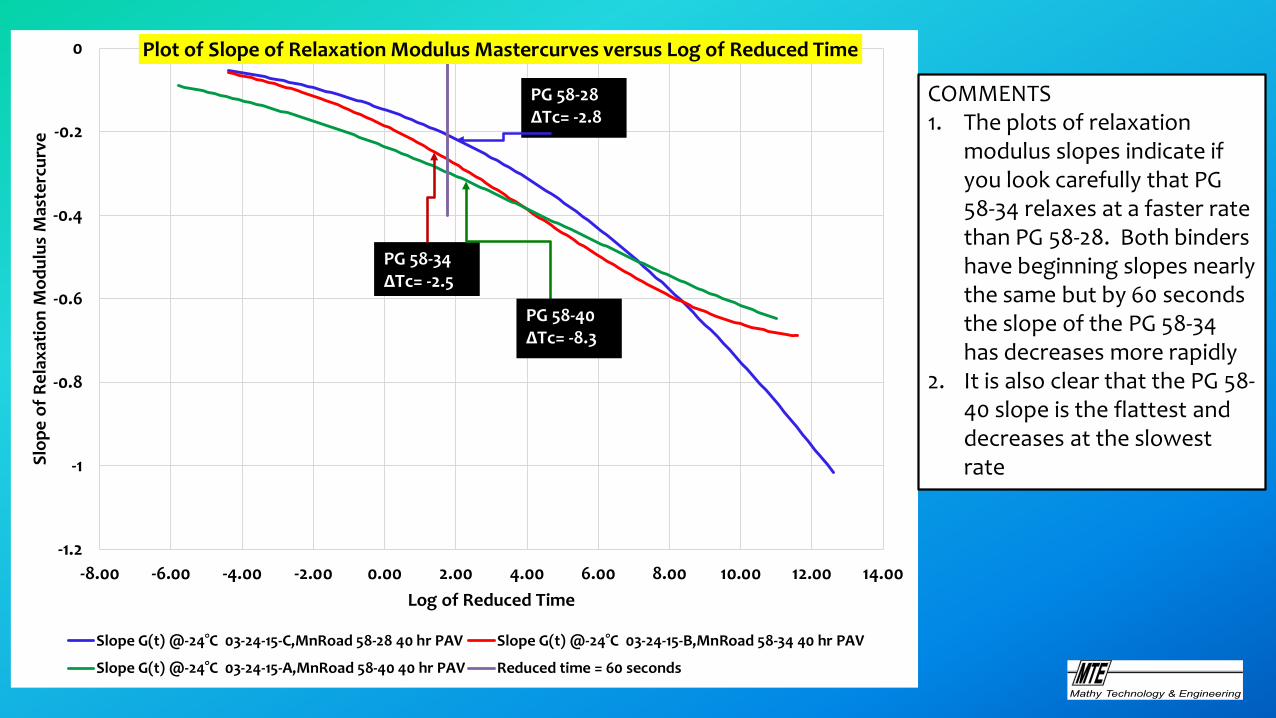
Plot of Slope of Relaxation Modulus Mastercurves versus Log of Reduced Time
Slope G(t) @-24°C 03-24-15-C,MnRoad 58-28 40 hr PAV Slope G(t) @-24°C 03-24-15-B,MnRoad 58-34 40 hr PAV
Slope G(t) @-24°C 03-24-15-A,MnRoad 58-40 40 hr PAV Reduced time = 60 seconds
PG 58-28ΔTc= -2.8
PG 58-34ΔTc= -2.5
PG 58-40 ΔTc= -8.3
COMMENTS1. The plots of relaxation
modulus slopes indicate if you look carefully that PG 58-34 relaxes at a faster rate than PG 58-28. Both binders have beginning slopes nearly the same but by 60 seconds the slope of the PG 58-34 has decreases more rapidly
2. It is also clear that the PG 58-40 slope is the flattest and decreases at the slowest rate
Mathy Technology & Engineering
-0.12
-0.1
-0.08
-0.06
-0.04
-0.02
0
-8 -6 -4 -2 0 2 4 6 8 10 12 14
2ndD
eriv
ativ
e of
Rel
axat
ion
Mod
ulus
Mas
terc
urve
Log of Reduced Time2nd Derivative of G(t) @-24°C 03-24-15-A,MnRoad 58-40 40 hr PAV2nd derivative G(t) @-24°C 03-24-15-B,MnRoad 58-34 40 hr PAV2nd Derivative G(t) @-24°C 03-24-15-C,MnRoad 58-28 40 hr PAVReduced time = 60 seconds
PG 58-28ΔTc= -2.8
PG 58-34ΔTc= -2.5
PG 58-40 ΔTc= -8.3
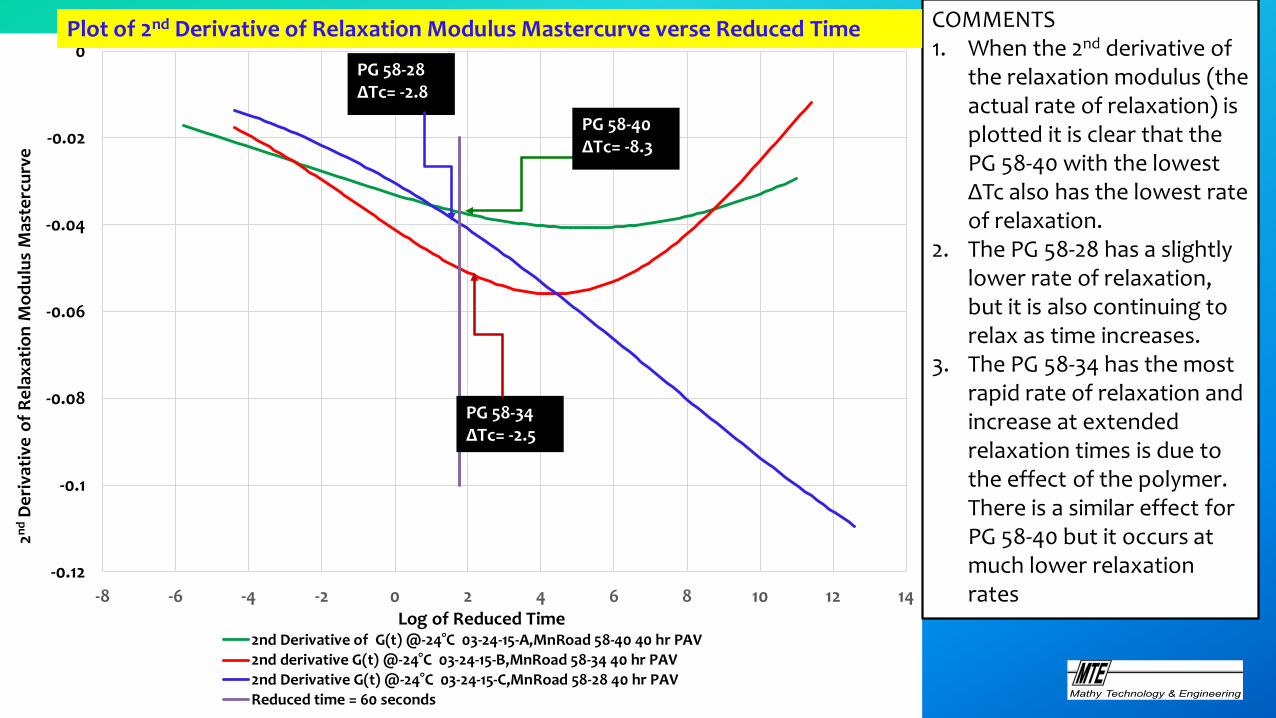
COMMENTS1. When the 2nd derivative of
the relaxation modulus (the actual rate of relaxation) is plotted it is clear that the PG 58-40 with the lowest ΔTc also has the lowest rate of relaxation.
2. The PG 58-28 has a slightly lower rate of relaxation, but it is also continuing to relax as time increases.
3. The PG 58-34 has the mostrapid rate of relaxation andincrease at extended relaxation times is due to the effect of the polymer. There is a similar effect forPG 58-40 but it occurs atmuch lower relaxationrates
Plot of 2nd Derivative of Relaxation Modulus Mastercurve verse Reduced Time
Mathy Technology & Engineering
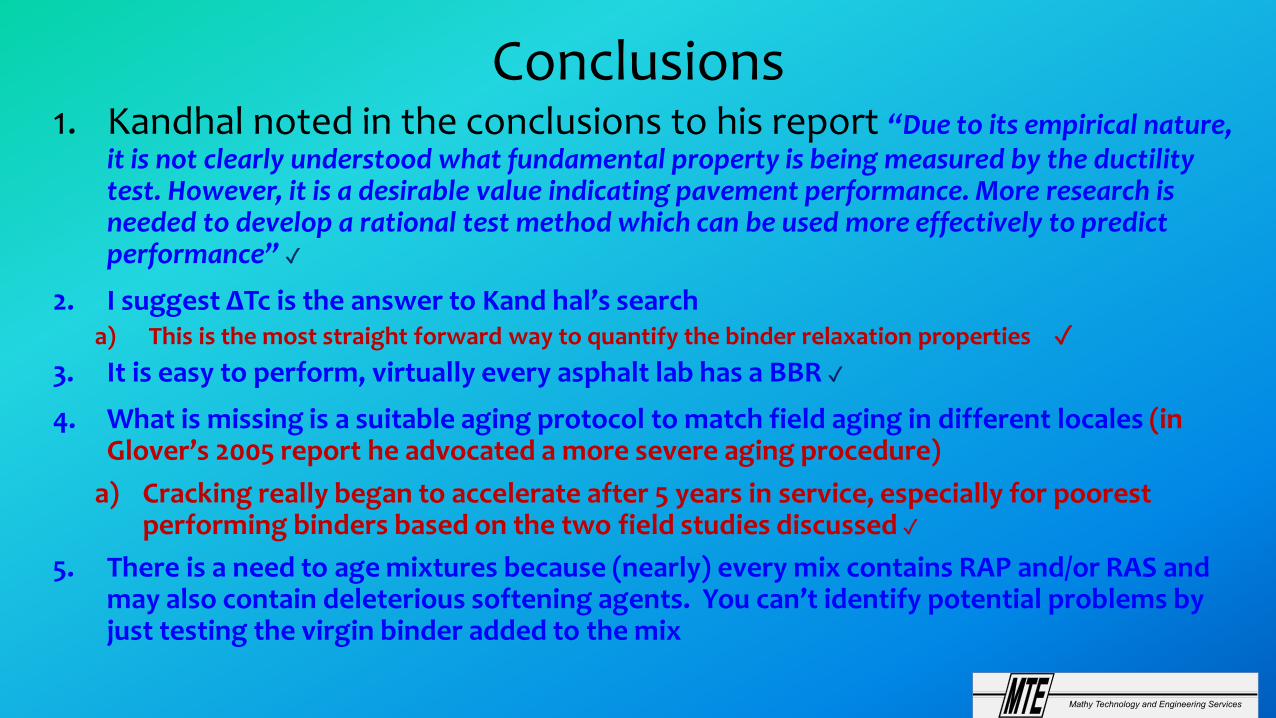
Conclusions1. Kandhal noted in the conclusions to his report “Due to its empirical nature,
it is not clearly understood what fundamental property is being measured by the ductility test. However, it is a desirable value indicating pavement performance. More research is needed to develop a rational test method which can be used more effectively to predict performance” ✓
2. I suggest ΔTc is the answer to Kand hal’s searcha) This is the most straight forward way to quantify the binder relaxation properties ✓
3. It is easy to perform, virtually every asphalt lab has a BBR ✓
4. What is missing is a suitable aging protocol to match field aging in different locales (in Glover’s 2005 report he advocated a more severe aging procedure)
a) Cracking really began to accelerate after 5 years in service, especially for poorest performing binders based on the two field studies discussed ✓
5. There is a need to age mixtures because (nearly) every mix contains RAP and/or RAS and may also contain deleterious softening agents. You can’t identify potential problems by just testing the virgin binder added to the mix
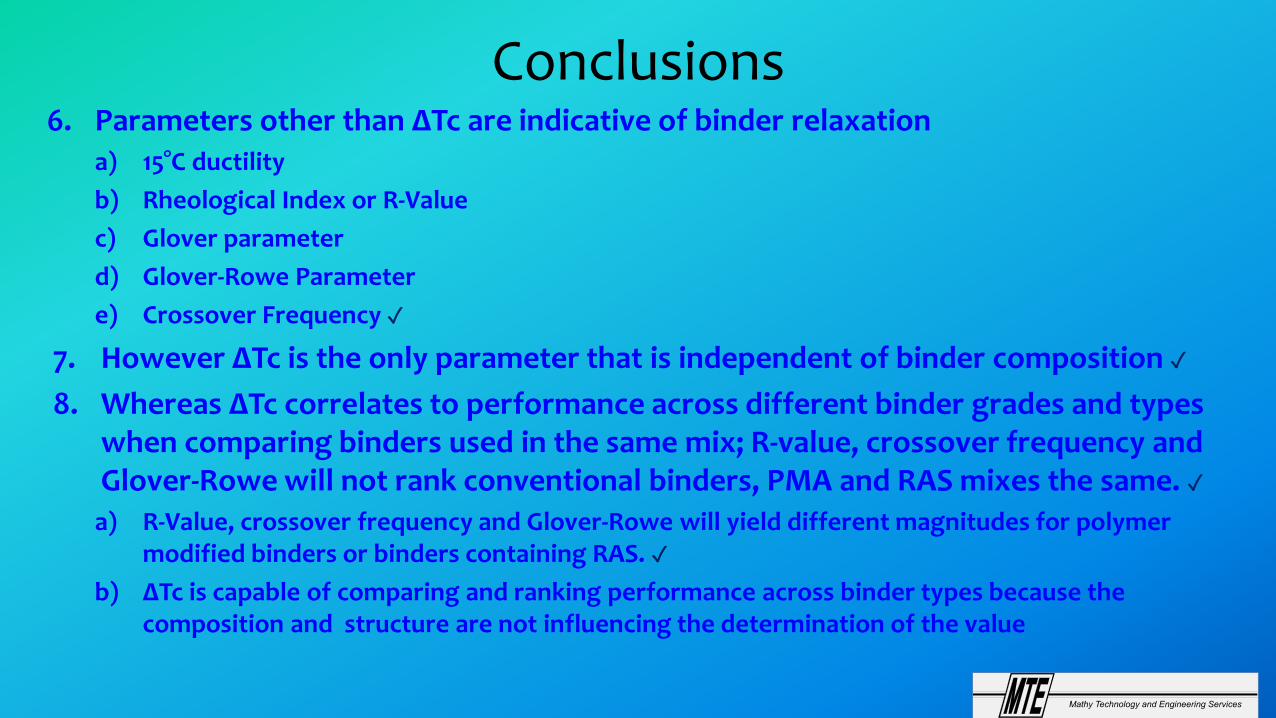
Conclusions6. Parameters other than ΔTc are indicative of binder relaxation
a) 15°C ductility b) Rheological Index or R-Valuec) Glover parameterd) Glover-Rowe Parametere) Crossover Frequency ✓
7. However ΔTc is the only parameter that is independent of binder composition ✓8. Whereas ΔTc correlates to performance across different binder grades and types
when comparing binders used in the same mix; R-value, crossover frequency and Glover-Rowe will not rank conventional binders, PMA and RAS mixes the same. ✓
a) R-Value, crossover frequency and Glover-Rowe will yield different magnitudes for polymer modified binders or binders containing RAS. ✓
b) ΔTc is capable of comparing and ranking performance across binder types because the composition and structure are not influencing the determination of the value
References1. Kandahl, Low Temperature Ductility in Relation to Pavement Performance, ASTM STP 628,
Marek, Ed., 19772. Glover, Charles J, Davison, Richard, Domke, Chris, Ruan, Yonghong, Juristyarini, Pramitha, Knorr,
Daniel, Jung, Sung, “Development Of A New Method For Assessing Asphalt Binder Durability With Field Validation”, FHWA/TX-05/1872-2, August 2005
3. Anderson, R. M, King, G.N., Hanson, D.I., Blankenship, P.B. "Evaluation of the Relationship between Asphalt Binder Properties and Non-Load Related Cracking." Association of Asphalt Paving Technologists, 2011 Volume 80, pp 615-663, 2011
4. TRB papers in 2010, 2011 and 2012 by Sui and Farrar, et al from Western Research Institutre5. EECongress in Istanbul, 2012, Farrar, et al

Thank you for your time and attention
Questions or Comments


