University of Missouri, St. Louis University of Missouri, St. Louis IRL @ UMSL IRL @ UMSL Dissertations UMSL Graduate Works 7-25-2013 The Relationships Among Recruiter Characteristics and Pre-and The Relationships Among Recruiter Characteristics and Pre-and Post-hire Recruitment Outcomes Post-hire Recruitment Outcomes Jacob Scott Fischer University of Missouri-St. Louis Follow this and additional works at: https://irl.umsl.edu/dissertation Part of the Psychology Commons Recommended Citation Recommended Citation Fischer, Jacob Scott, "The Relationships Among Recruiter Characteristics and Pre-and Post-hire Recruitment Outcomes" (2013). Dissertations. 305. https://irl.umsl.edu/dissertation/305 This Dissertation is brought to you for free and open access by the UMSL Graduate Works at IRL @ UMSL. It has been accepted for inclusion in Dissertations by an authorized administrator of IRL @ UMSL. For more information, please contact [email protected].
Transcript
University of Missouri, St. Louis University of Missouri, St. Louis
IRL @ UMSL IRL @ UMSL
Dissertations UMSL Graduate Works
7-25-2013
The Relationships Among Recruiter Characteristics and Pre-and The Relationships Among Recruiter Characteristics and Pre-and
Jacob Scott Fischer University of Missouri-St. Louis
Follow this and additional works at: https://irl.umsl.edu/dissertation
Part of the Psychology Commons
Recommended Citation Recommended Citation Fischer, Jacob Scott, "The Relationships Among Recruiter Characteristics and Pre-and Post-hire Recruitment Outcomes" (2013). Dissertations. 305. https://irl.umsl.edu/dissertation/305
This Dissertation is brought to you for free and open access by the UMSL Graduate Works at IRL @ UMSL. It has been accepted for inclusion in Dissertations by an authorized administrator of IRL @ UMSL. For more information, please contact [email protected].
THE RELATIONSHIPS AMONG RECRUITER CHARACTERISTICS AND PRE-
AND POST-HIRE RECRUITMENT OUTCOMES
by
Jacob S. Fischer M.A., Psychology, University of Missouri – St. Louis, 2008
B.S., Psychology, Brigham Young University, 2005
A DISSERTATION
Submitted to the Graduate School of the
UNIVERSITY OF MISSOURI – ST. LOUIS In partial Fulfillment of the Requirements for the Degree
DOCTOR OF PHILOSOPHY
in
PSYCHOLOGY with an emphasis in Industrial Organizational Psychology
May 2013
Advisory Committee
James Breaugh, Ph. D.
Chairperson
Therese Macan, Ph. D.
Haim Mano, Ph. D.
John Meriac, Ph. D.
Fischer, Jacob, 2013, UMSL, p. 2 �
Table of Contents�Abstract ............................................................................................................................... 4�
During the period of recruitment and selection, there are many opportunities for
applicants and representatives of the organization to interact and exchange information
(Breaugh, Macan, Grambow, 2008). One concern present throughout the literature is that
many researchers categorize these interactions as being recruitment or selection focused
when most interactions include elements of both. For example, during interviews,
interviewers typically attempt to recruit the candidate on the merits of the organization
and at the same time screen the candidate. This dual focus is not typical for research,
which has largely focused on the selection aspects of the interview. However, the social
interaction aspects are beginning to receive greater attention (Barrick, Swider, & Stewart,
2010).
An additional concern is that recruitment variables are being examined without
considering the impact of other variables (Saks, 2005). For example, realistic job
previews (RJPs) have been shown to have very small effects on retention (Phillips, 1998),
yet the effect of RJPs are often examined without considering the recruitment source, an
applicant’s past job experience, or an applicant’s familiarity with the organization
(Breaugh, 2009). Failure to consider such variables may be one reason why we see such
small effects (see Phillips, 1998).
The crux of these concerns has to do with how the recruitment process is viewed and
studied. In general, most researchers and practitioners would agree that recruitment and
selection are interrelated. Yet, they tend to be studied separately. For example, one
recruitment activity, such as a job ad, likely moderates the effectiveness of other
activities, such as an RJP, but these activities are usually studied separately. Breaugh
Fischer, Jacob, 2013, UMSL, p. 6 �
(2012) argued that the field would benefit by examining the recruitment process from an
integrated perspective. This paper attempts to do so in two ways.
First, this study addresses the potential effects of recruiter characteristics but in a
broader way than previous research1. Most research on recruiter characteristics
concentrates on the effect of activities on applicant reactions and intentions. However, the
recruiter can have an integral role in the entire recruitment process, which includes
developing sourcing strategies, conducting interviews, and preparing newly hired
employees to begin working. Throughout much of the process, corporate recruiters are
the link between applicants and hiring managers, and they must manage relationships
with both parties. There is considerable research regarding interactions between recruiters
and applicants (see Chapman, Uggerlev, Carroll, Piasintin, & Jones, 2005) but very little
is known about how recruiters interact with hiring managers. Previous measures of
recruiter effectiveness have concentrated on applicant perceptions (e.g., informative
recruiters are perceived to be effective; Connerley & Rynes, 1997). Research is sparse on
other measures of recruiter effectiveness, such as time to fill a position, person-
organization fit, and retention (Saks, 2005). This study will examine the importance of
recruiter2 characteristics for predicting pre- and post-hire outcomes including time to fill
position, retention, and performance.
Second, this study investigates how various recruitment and selection practices
interact during the staffing process. This is important given that it is difficult to separate ���������������������������������������� �������������������1 Causal terminology is used here and throughout the paper for stylistic purposes. The design of this study only allows for examination of relationships and not causality. 2 As a point of clarity, I define recruiter as the individual responsible for making official contact with potential candidates, attending job fairs, receiving candidate resumes, posting job ads, conducting interviews and making hiring recommendations to hiring managers. Hiring managers may also participate in these activities but they are not required. Hiring managers have the responsibility to interview candidates screened by the recruiter and make the final hiring decision. �
Fischer, Jacob, 2013, UMSL, p. 7 �
practices into strictly recruitment or selection focused (Breaugh, 2012; Dineen & Soltis,
2010). Typical selection practices have an element of recruitment. For example,
applicants taking a cognitive ability test may react negatively and ultimately be less
attracted to the organization and less likely to accept an offer (Macan, Avedon, Paese, &
Smith, 1994). In this case, although the test is used for selection, it indirectly affects
recruitment goals of attraction and offer acceptance. Additionally, the effects of one
recruitment or selection practice may influence the effects of another practice. For
example, research examining the effects of college placement offices has generally
ignored the fact that students may have already been prescreened (Breaugh, 2009). In this
case, prescreening eliminates certain types of applicants and changes the nature of the
applicant pool. This study will investigate several areas in which recruitment and
selection practices are likely to interact.
In summary, this paper takes an integrated perspective of recruitment and selection. It
investigates recruiter characteristics and the interactions among recruitment and selection
practices. I begin a discussion of the study by reviewing the recruitment process and
general research on recruitment.
Recruitment
Breaugh and colleagues (Breaugh, 2012; Breaugh & Starke, 2000; Breaugh et al,
2008) described a recruitment process that involves four stages. Figure 1 shows a
modified example of the stages described by Breaugh and colleagues. In the first stage,
recruitment objectives are established. Objectives can focus on pre-hire and post-hire
results. Pre-hire outcomes include time to fill positions, number of applicants, and
number of employee referrals. Post-hire outcomes include performance, retention, and
Fischer, Jacob, 2013, UMSL, p. 8 �
person-organization fit. After establishing objectives, strategies for meeting objectives
are developed. Once strategies are developed, activities are conducted to implement each
strategy. In the last stage, objectives are measured to assess how well they were met. The
organization’s recruiting function is typically responsible for the maintenance and
success of these stages. The current study focuses on the conducting activities stage.
In Figure 1, the conducting activities stage includes interactions in which information
is exchanged from one party to another. Types of interactions can include TV
commercials, job ads, websites, interviews, tests, job previews, and site visits. Selection
practices are included at this stage because they are a form of interaction between the
organization and applicant. Recruitment objectives and strategies clearly influence how
selection decisions are made. For example, an objective to hire people with mechanical
ability may require administering a mechanical abilities test to screen applicants.
Similarly, if increased diversity in recruitment is desired, a banding approach might be
used when scoring a cognitive ability test. In any case, establishing recruitment objectives
and strategies guide recruitment and selection practices.
Barber (1998) described recruitment interactions in phases. These phases occur
within the conducting activities stage of the model previously discussed. Barber
categorized these interactions according to the organization’s purpose. The phases
include activities to (a) generate applicants, (b) maintain applicant interest, and (c)
influence job choice.
In the first phase, organizations focus on the applicant population, or those who have
not yet submitted an application but who have attributes and experiences targeted by the
organization. The purpose is to create a pool of applicants from which to select qualified
Fischer, Jacob, 2013, UMSL, p. 9 �
future employees. Characteristics of this phase include very little personal contact,
incomplete information, and screening (Barber, 1998). Common recruitment activities
during this phase are referral programs and job ads through the newspaper, television,
radio, or internet. Activities during this phase should communicate and present
information in a way that will pique interest in the job and/or organization and
subsequently lead to individuals submitting an application and joining the applicant pool.
Maintaining applicant interest involves the recruitment of specific individuals with
the goal of selecting applicants who will receive a job offer (Barber, 1998). In this phase,
companies engage in the process of identifying a subset of applicants from the applicant
pool that they want to pursue. Part of this phase includes activities that provide applicants
with additional information about the organization or job in an attempt to keep them
interested (e.g., handing out brochures, sharing videos that provide realistic job
previews). At the same time, the organization uses screening activities (e.g., interviews,
selection tests) to gather additional information about applicants. Throughout this phase
of maintaining interest, the candidate becomes more knowledgeable about the job, work
environment, and culture while the organization becomes more aware of the skills and
abilities of the applicant. As a result, applicants fine-tune their assessment of fit and
organizations are able to narrow the pool of applicants (Breaugh et al., 2008).
After a job offer has been made, the organization begins the influencing job choice
phase of recruitment (Barber, 1998). During this phase, applicants make decisions about
accepting or rejecting a job offer. Up to this point in the recruitment process, applicants
have typically interacted several times with the organization. Thus, activities from
Barber’s first two phases carry over to applicant decisions. Recruitment factors
Fischer, Jacob, 2013, UMSL, p. 10 �
influencing job choice include site visits, frequent communication, and building
Similarly, the Occupational Information Network (O*NET) reports that recruiters and
sales agents share a number of important work activities. Two that are of interest in this
paper are interacting with others outside the organization and maintaining relationships.
Importance ratings on O*NET indicate that for both occupations these work activities are
rated between very important and extremely important.
Fischer, Jacob, 2013, UMSL, p. 16 �
For recruiters, interaction with candidates occurs through job fairs, interviews, or site
visits. Recruiters are also responsible for interacting with hiring managers. The context of
these interactions is different, but the goal is the same. Part of a recruiter’s job is to ‘sell’
the organization to the candidate and the candidate to the hiring manager. Because of
their sociable nature, extraverts should tend to have frequent contact with hiring
managers. They should feel comfortable contacting hiring managers on a regular basis. In
a study on expatriates and social ties, Johnson, Kristof-Brown, Van Vianen, and De Pater
(2003) found that extraversion was related to the frequency of contact with other
expatriates. Extending these results, we can infer that extraverted recruiters should have
frequent contact with applicants and hiring managers. We can also surmise that because
extraverts are comfortable speaking with people and interacting socially that they should
have quality interactions with others – especially in a “sales” type interaction.
Furthermore, given the similarity between the two jobs and thinking of the hiring
manager as a customer, extraversion should also be important for recruiter success.
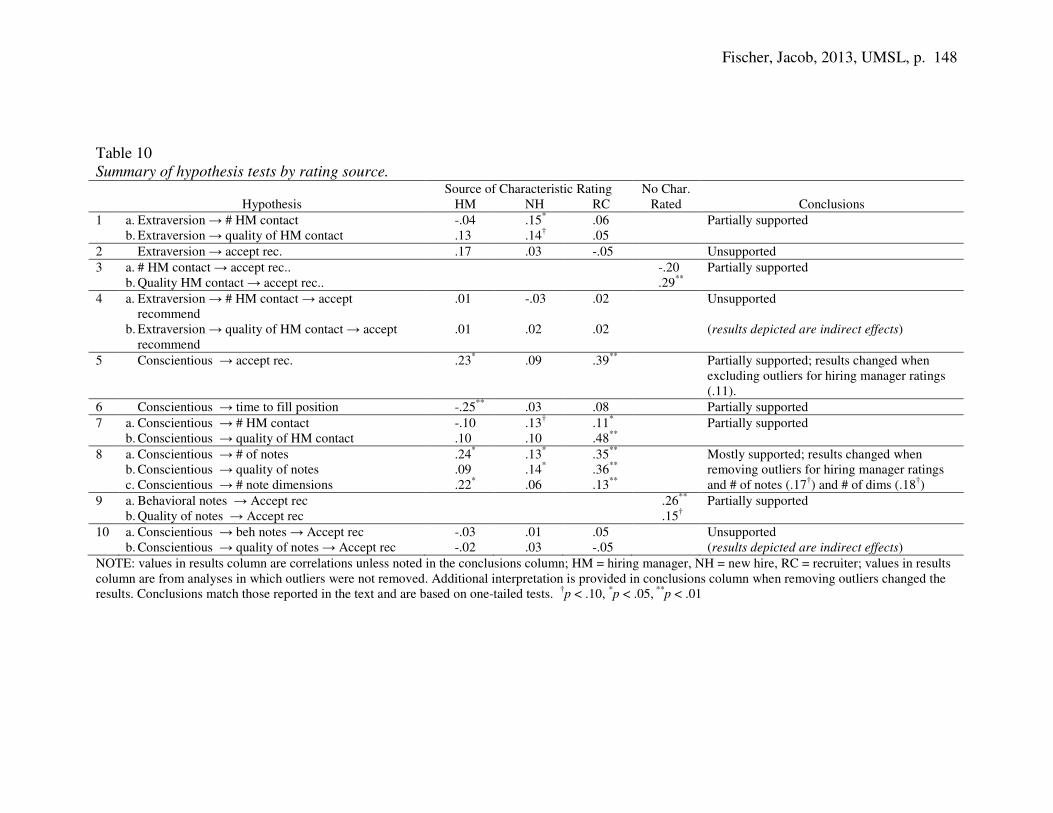
Hypothesis 1a: Recruiter extraversion will be positively related to amount of contact recruiters have with hiring managers. Hypothesis 1b: Recruiter extraversion will be positively related to quality of contact3 recruiters have with hiring managers. Hypothesis 2: Recruiter extraversion will be positively related to the hiring manager’s acceptance of the recruiter’s hiring recommendation.
Building and maintaining relationships is also an important recruiter activity. In sales,
relationship building is emphasized because firms can create long-term commitment with
���������������������������������������� �������������������3 Quality of contact between recruiters and hiring managers was added at the committee’s recommendation. It is included in additional hypotheses as well.
Fischer, Jacob, 2013, UMSL, p. 17 �
customers (Weitz & Bradford, 1999). In recruitment, applicant relationships with
recruiters are important because they can maintain the applicant’s interest in the job
(Rynes et al., 1991). Extraversion is an important characteristic because it is related to
relationship building behaviors (Wanberg & Kammeyer-Mueller, 2000). It seems clear
that behaviors associated with extraversion will create opportunities to make friendships
and build relationships with others. This is especially true in cases where there is limited
time allowed for interpersonal interaction. Extraverts should be adept at building
relationships quickly. This concept is important for recruiters as they interact with
applicants and hiring managers.
Contacting hiring managers and building a relationship with them is especially
important for recruiters who will be making hiring recommendations about candidates.
For those recommendations to be meaningful, hiring managers must trust recruiters. An
individual trusts another when he/she feels that the other person has good intentions and
has their interests at heart (Rousseau, Sitkin, Burt, & Camerer, 1998). McAllister (1995)
found that the frequency of interpersonal interaction was associated with the amount of
trust in the relationship. Given the short timeframe for interactions with hiring managers,
recruiters must develop relationships relatively quickly. Frequent contact should create
opportunities for trust to develop and result in hiring managers accepting the
recommendations of recruiters. Furthermore, the quality of the interactions will also be
important for hiring managers accepting recommendations.
Hypothesis 3a: The amount of contact recruiters have with hiring managers will be positively related to the hiring manager’s acceptance of the recruiter’s hiring recommendation.
Fischer, Jacob, 2013, UMSL, p. 18 �
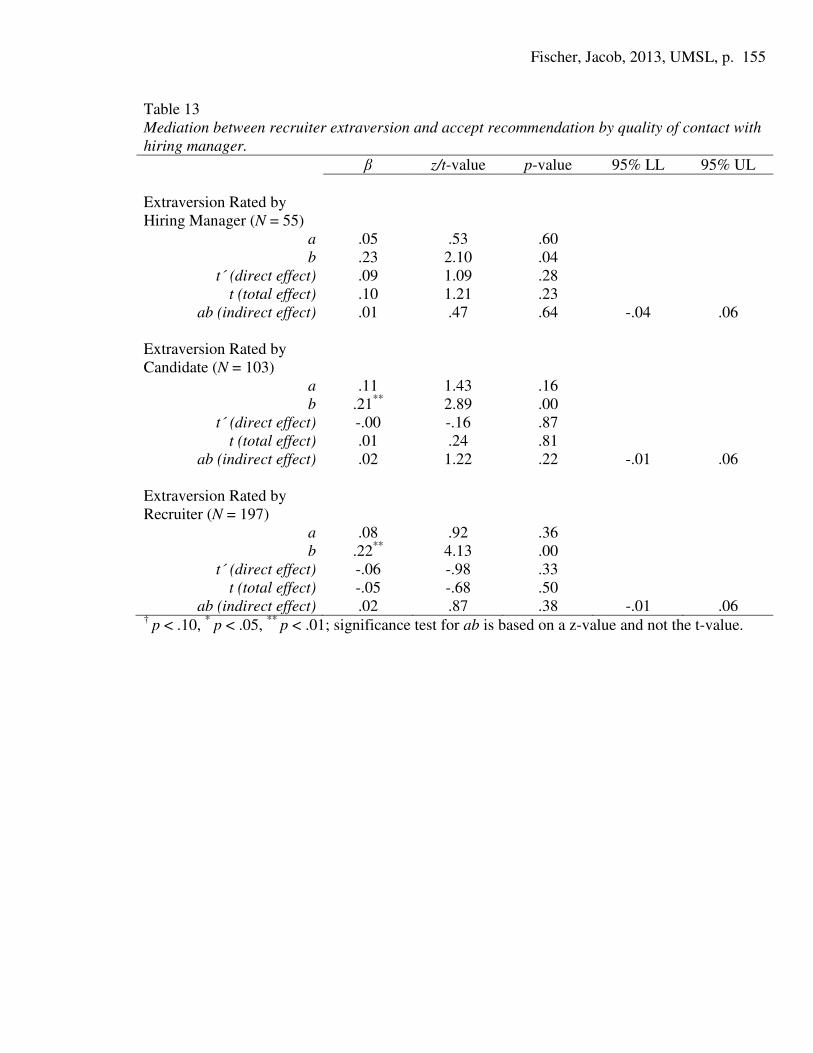
Hypothesis 3b: The quality of contact recruiters have with hiring managers will be positively related to the hiring manager’s acceptance of the recruiter’s hiring recommendation. Hypothesis 4a: The amount of contact recruiters have with hiring managers will partially mediate the relationship between recruiter extraversion and the hiring manager’s acceptance of the recruiter’s hiring recommendation. Hypothesis 4b: The quality of contact recruiters have with hiring managers will partially mediate the relationship between recruiter extraversion and the hiring manager’s acceptance of the recruiter’s hiring recommendation.
Conscientiousness. Individuals characterized as conscientious tend to be seen as
dependable, organized, persistent, and achievement oriented. Of the Big Five personality
dimensions, conscientiousness tends to have the strongest relationship with overall
conscientiousness is important because of the planning requirements of the job.
Recruiters must integrate information from multiple sources such as resumes,
applications, interview notes, and hiring manager notes. Recruiters who are able to take
an organized and methodical approach to managing the recruitment process should be
better at achieving recruitment objectives. For example, time to fill position is a time
sensitive measure that requires planning when to conduct interviews, hold consensus
meetings, and follow-up with applicants and hiring managers. Planning is essential to
limiting the duration between the time when the position is opened to the time when it is
filled. On top of that, recruiters must be able to manage this process for multiple
applicant pools and positions at the same time. For each position, recruiters must
maintain notes from meetings with hiring managers as well as interview notes from the
respective candidates. A conscientious recruiter will be able to organize effectively the
Fischer, Jacob, 2013, UMSL, p. 19 �
process of recruitment for positions, as well as decisions about applicants. As a result,
hiring managers should be more willing to accept recommendations and time to fill
should be lower.
Hypothesis 5: Recruiter conscientiousness will be positively related to the hiring manager’s acceptance of the recruiter’s hiring recommendation. Hypothesis 6: Recruiter conscientiousness will be negatively related to time to fill position.
Conscientiousness, because of its emphasis on order, planning, and perfectionism, is
likely to be related to taking thorough notes and contacting hiring managers more
frequently. Achievement striving and duty, two components of conscientiousness, help
explain why conscientious recruiters would take more notes and have frequent contact
with hiring managers. Moon (2001) argued that when under the purview of others, those
who are achievement strivers or dutiful will exhibit conscientious behaviors. Doing so
helps the individual look good (achievement striving) and supports the work of others
(dutifulness).
Note-taking is a component of structured interviewing (Campion, Palmer, &
Campion, 1997) and recruiters who are high in conscientiousness should be concerned
about taking good notes because conversations they have with others will be based on
these notes and the notes will represent their work product. In addition, contact with
hiring managers will allow more opportunities for demonstrating achievements in the
recruitment process and supporting the work of the hiring manager. Taking notes during
the interview and contacting the hiring manager frequently should help demonstrate
recruiters’ achievement and support the work of others.
Fischer, Jacob, 2013, UMSL, p. 20 �
Hypothesis 7a: Recruiter conscientiousness will be positively related to the amount of contact the recruiter has with the hiring manager. Hypothesis 7b: Recruiter conscientiousness will be positively related to the quality of contact the recruiter has with the hiring manager. Hypothesis 8a: Recruiter conscientiousness will be positively related to the amount of notes taken by the recruiter. Hypothesis 8b: Recruiter conscientiousness will be positively related to the quality of notes taken by the recruiter.
Literature on note-taking as a part of the employment interviews indicates that note-
taking is beneficial for memory and recall (Middendorf & Macan, 2002), validity
could aid recruiters in crafting arguments that rely on data to discuss strengths and
weakness of candidates and provide reasons for their recommendations.
There are many strategies for taking notes and the content of notes varies. Burnett et
al. (1998) discussed five content dimensions to evaluating the types of notes in
employment interviews. These dimensions include behavioral, dispositional, contextual,
procedural, and judgmental. These researchers found that behavioral notes were the most
predictive of future performance while procedural notes were the least predictive and
were even associated with lower validity coefficients for interviews.
Order, planning, and perfectionism define conscientiousness. Thus, it is likely that
conscientiousness is related to taking notes on multiple content dimensions. Because
recruiters high in conscientiousness should be concerned about taking thorough notes,
their notes should cover more of the content dimensions described by Burnett et al.
(1998).
Hypothesis 8c: Recruiter conscientiousness will be positively related to the number of note-taking content dimensions recorded by recruiters.
Fischer, Jacob, 2013, UMSL, p. 22 �
Middendorf and Macan (2002) used the dimensions in Burnett et al. (1998) but
included strategies for note-taking. Strategies included key points, where only main ideas
are noted, and conventional or verbatim notes, where much of what the candidate said is
recorded. They found that memory and recall was more accurate when conventional note-
takers recorded behavioral, dispositional, and contextual notes. Increased memory and
recall can be especially important when recruiters interview many candidates and there
are significant time lapses between interviews and consensus meetings.
In terms of accepting recruiter recommendations, behavioral note-taking may be most
important. Behavioral notes focus on experience and help interviewers recall what
candidates said (Middendorf & Macan, 2002). For the same reason, quality of notes
should be important to recruiters as they discuss candidates with hiring managers.
Reviewing how applicants have demonstrated performance dimensions in the past should
be appealing to hiring managers and could potentially build better arguments for
recruiters as they make recommendations.
Hypothesis 9a: Behavioral note-taking by recruiters will be positively related to the degree hiring managers accept recruiter hiring recommendations. Hypothesis 9b: Quality notes will be positively related to the degree hiring managers accept recruiter hiring recommendations Hypothesis 10a: Behavioral note-taking will partially mediate the relationship between conscientiousness and the hiring manager’s acceptance of the recruiter’s hiring recommendation. Hypothesis 10b: Quality notes will partially mediate the relationship between conscientiousness and the hiring manager’s acceptance of the recruiter’s hiring recommendation.
Fischer, Jacob, 2013, UMSL, p. 23 �
Recruiter recommendations. Finally, the acceptance of recruiter recommendations
is an important piece to achieving post-hire objectives of the recruitment program. In
some organizations, hiring managers are responsible for the final hiring decision and may
choose to accept recruiter recommendations or decline recommendations and hire
someone else. In this case, hiring managers are not required to hire the person
recommended by the recruiter. They are able to select the person they feel is best for the
job – even if this conflicts with the recruiter’s recommendation4. Hiring managers who
accept recommendations when not required to do so may recognize their inexperience
and/or lack of expertise in evaluating and selecting candidates. When hiring managers
discount the input of recruiters, recruitment objectives may go unrealized. Some hiring
managers who do not accept recommendations may think they “have a feeling” about a
candidate or want to select someone for reasons that are unrelated to the job. On the other
hand, hiring managers may have job related reasons for their selection choices. Rejecting
the recommendation of recruiters does not mean the hiring manager ignored the results of
appropriate selection devices.
However, recruiters should be more accurate in their choices than hiring managers for
several reasons. First, there is typically more influence on recruiters to adhere to
structured interviews. This is important because structured interviews are more valid than
unstructured interviews (Huffcutt & Arthur, 1994). Second, recruiters have more
experience using selection tools such as interviews. Therefore, they should be more
willing than hiring managers to rely on mechanical methods for selection – given
organization support for mechanical methods. The reliance on mechanical methods for ���������������������������������������� �������������������4 Organizations obviously vary in the degree of freedom given to hiring managers to make the final hiring decision. Hiring managers in the organization at which this study took place have the discretion to hire the applicant they select and can ignore recruiters’ recommendations.
Fischer, Jacob, 2013, UMSL, p. 24 �
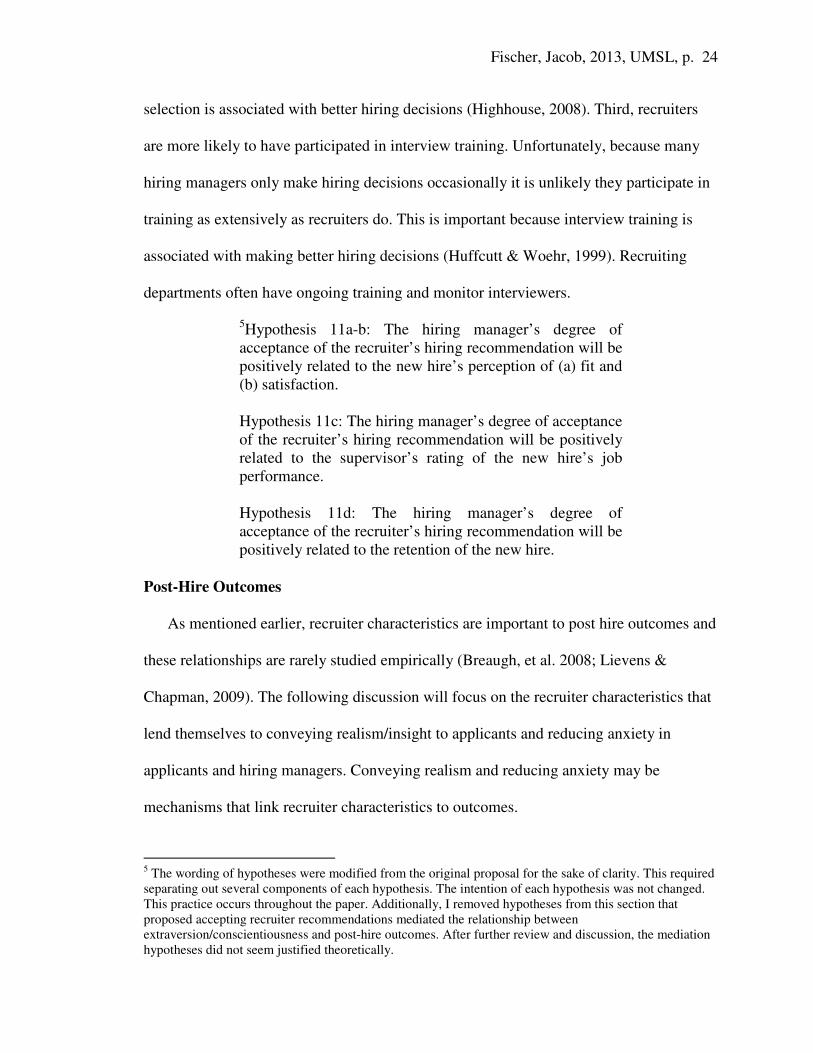
selection is associated with better hiring decisions (Highhouse, 2008). Third, recruiters
are more likely to have participated in interview training. Unfortunately, because many
hiring managers only make hiring decisions occasionally it is unlikely they participate in
training as extensively as recruiters do. This is important because interview training is
associated with making better hiring decisions (Huffcutt & Woehr, 1999). Recruiting
departments often have ongoing training and monitor interviewers.
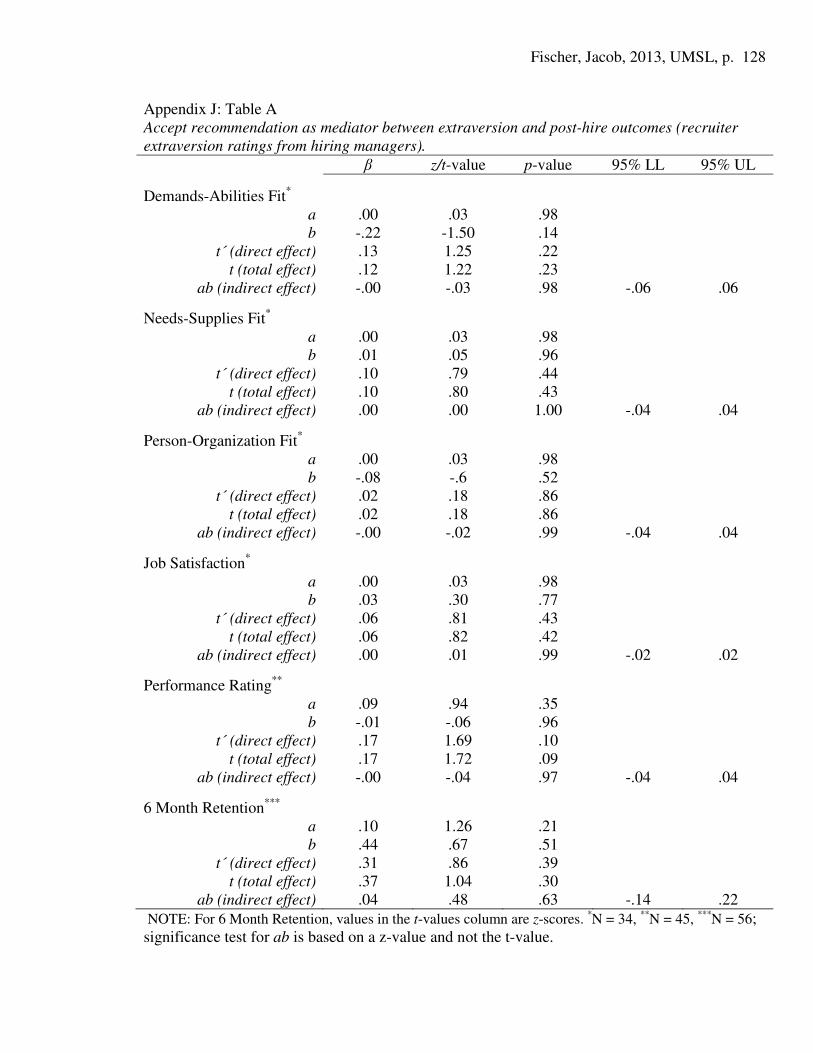
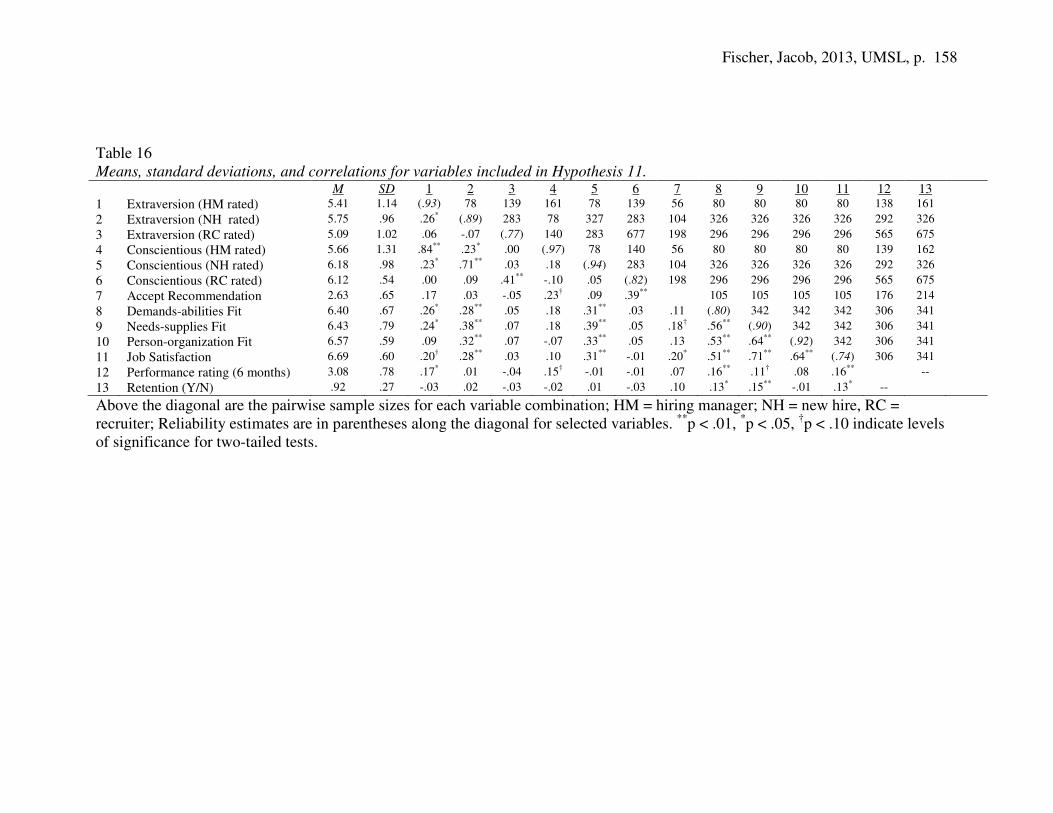
5Hypothesis 11a-b: The hiring manager’s degree of acceptance of the recruiter’s hiring recommendation will be positively related to the new hire’s perception of (a) fit and (b) satisfaction. Hypothesis 11c: The hiring manager’s degree of acceptance of the recruiter’s hiring recommendation will be positively related to the supervisor’s rating of the new hire’s job performance. Hypothesis 11d: The hiring manager’s degree of acceptance of the recruiter’s hiring recommendation will be positively related to the retention of the new hire.
Post-Hire Outcomes
As mentioned earlier, recruiter characteristics are important to post hire outcomes and
these relationships are rarely studied empirically (Breaugh, et al. 2008; Lievens &
Chapman, 2009). The following discussion will focus on the recruiter characteristics that
lend themselves to conveying realism/insight to applicants and reducing anxiety in
applicants and hiring managers. Conveying realism and reducing anxiety may be
mechanisms that link recruiter characteristics to outcomes.
���������������������������������������� �������������������5 The wording of hypotheses were modified from the original proposal for the sake of clarity. This required separating out several components of each hypothesis. The intention of each hypothesis was not changed. This practice occurs throughout the paper. Additionally, I removed hypotheses from this section that proposed accepting recruiter recommendations mediated the relationship between extraversion/conscientiousness and post-hire outcomes. After further review and discussion, the mediation hypotheses did not seem justified theoretically.
Fischer, Jacob, 2013, UMSL, p. 25 �
Informativeness and personableness. It is clear from the literature that the ability to
provide realism is important to applicant attraction and perceptions of effectiveness.
Recruiters can provide realism and insight by conveying detailed information about the
job and organization. Providing this information is important because applicants
frequently lack insight about the job and work environment (Breaugh & Starke, 2000).
Conveying realism should increase the likelihood that applicants have accurate job
expectations. When expectations are unrealistic, dissatisfaction, lack of fit, and
withdrawal may result. In a meta-analysis, Wanous et al. (1992) found that met
expectations predicted job satisfaction, commitment and turnover intentions. Results for
predicting actual turnover were less strong. This is not surprising since actual turnover is
not as proximal to met expectations as job satisfaction and turnover intentions are.
Realism is also important for person-environment fit. Candidates often make
employment decisions based on how well they fit with the job or organization. Realistic
descriptions of the future environment provide insight to candidates to aid their decision.
If the information is unrealistic or incomplete, pre-hire perceptions of fit may be
inaccurate. This will create a situation in which the post-hire environment is not what was
expected and there will be misfit.
Increased insight is critical to post-hire satisfaction and fit because initial perceptions
create expectations. If expectations are inaccurate, dissatisfaction and turnover are likely
outcomes (Wanous et al., 1992). Perceptions are more likely to be accurate when
individuals have sufficient insight into the environment and their own needs. To address
this need for insight into the environment, organizations create opportunities for
applicants to learn about the job through realistic job previews, site visits, and
Fischer, Jacob, 2013, UMSL, p. 26 �
conversations with incumbents. Another key resource for applicants is recruiters.
Informative recruiters should be better equipped to provide information on the work
environment as a whole, as well as information that is of greater detail for narrow topics
of the work environment.
Although critical to candidate decisions, a recruiter’s ability to provide detailed and
thorough information does not always equate to conveying realism. Essentially, recruiters
perceived as informative could end up providing detailed yet unrealistic information,
which would also create unrealistic expectations. Applicants may still consider the
recruiter informative in a pre-hire context, but after gaining experience, post-hire, they
may realize that the recruiter was not providing accurate information. However, given a
recruiter can focus on one position or has sufficient understanding of the job, accidental
misinformation should be unlikely. Additionally, when recruiters are rated by new hires
they recruited, ratings could be poor if recruiters provided inaccurate information. This is
an incentive to provide detailed and accurate information. Under these conditions, the
likelihood of inaccurate information is reduced. Furthermore, if candidates lack
information, realistic or not, they may feel accepting the offer is taking too much of a
chance, especially if they have opportunities with other companies and jobs that they
know more about. Informative recruiters should have higher rates of job offer acceptance.
Furthermore, recruiter informativeness should also be related to post-hire outcomes that
rely on detailed information.
Hypothesis 12: Recruiter informativeness will be positively related to the job acceptance rate for a position. Hypothesis 13: Recruiter informativeness will be positively related to a new hire’s perception of (a) fit and (b) satisfaction, and (c) the new hire’s retention.
Fischer, Jacob, 2013, UMSL, p. 27 �
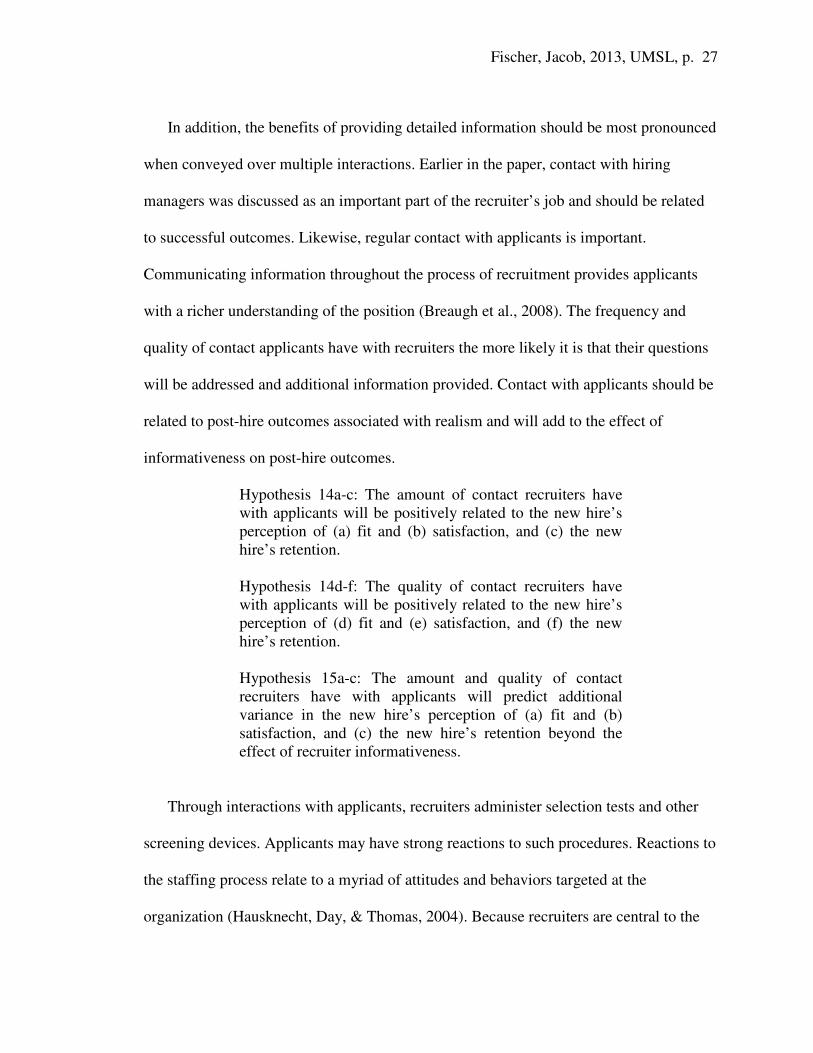
In addition, the benefits of providing detailed information should be most pronounced
when conveyed over multiple interactions. Earlier in the paper, contact with hiring
managers was discussed as an important part of the recruiter’s job and should be related
to successful outcomes. Likewise, regular contact with applicants is important.
Communicating information throughout the process of recruitment provides applicants
with a richer understanding of the position (Breaugh et al., 2008). The frequency and
quality of contact applicants have with recruiters the more likely it is that their questions
will be addressed and additional information provided. Contact with applicants should be
related to post-hire outcomes associated with realism and will add to the effect of
informativeness on post-hire outcomes.
Hypothesis 14a-c: The amount of contact recruiters have with applicants will be positively related to the new hire’s perception of (a) fit and (b) satisfaction, and (c) the new hire’s retention. Hypothesis 14d-f: The quality of contact recruiters have with applicants will be positively related to the new hire’s perception of (d) fit and (e) satisfaction, and (f) the new hire’s retention.
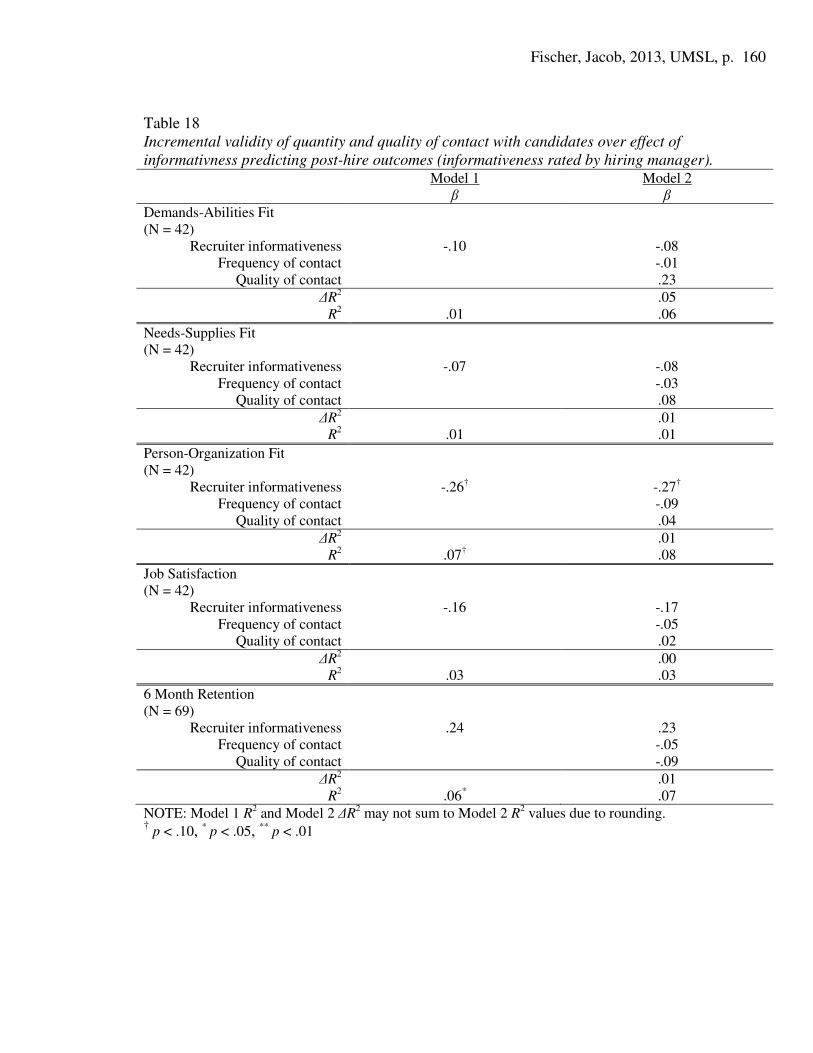
Hypothesis 15a-c: The amount and quality of contact recruiters have with applicants will predict additional variance in the new hire’s perception of (a) fit and (b) satisfaction, and (c) the new hire’s retention beyond the effect of recruiter informativeness.
Through interactions with applicants, recruiters administer selection tests and other
screening devices. Applicants may have strong reactions to such procedures. Reactions to
the staffing process relate to a myriad of attitudes and behaviors targeted at the
organization (Hausknecht, Day, & Thomas, 2004). Because recruiters are central to the
Fischer, Jacob, 2013, UMSL, p. 28 �
administration of the recruitment and selection process, they likely contribute to positive
Interactional justice is also an important component to explaining perceptions of fairness
in selection (Gilliland, 1993). Gilliland (1993) contended that honest explanations and
feedback about the selection process contribute to applicants’ overall perception of
fairness in selection. Likewise, two way communication and the interpersonal
effectiveness of the administrator feed into perceptions of fairness in selection. Fairness
perceptions lead to reactions during the hiring process (e.g., acceptance decisions, test
motivation) and after the hiring process (e.g., performance, satisfaction).
Based on Gilliland’s (1993) model of justice and fairness in selection, informative
recruiters are likely to more effectively prepare applicants and hiring managers for the
Fischer, Jacob, 2013, UMSL, p. 30 �
selection procedures because they will provide more information about the process.
Informative recruiters should give the necessary information and explain why a
procedure is used, while personable recruiters should convey decisions and expectations
in a friendly way. Informative recruiters likely reflect informational justice and
personable recruiters likely reflect interpersonal justice. Tapping each form of justice
likely reduces the anxiety about how selection procedures are implemented and
contributes to positive reactions from new hires – including satisfaction with the process
and remaining a candidate.
Hypothesis 16: Recruiter informativeness will be positively related to new hire satisfaction with the recruitment process (after hire). Hypothesis 17: Recruiter personableness will be positively related to new hire satisfaction with the recruitment process (after hire).
In a similar fashion, hiring managers are generally required to adhere to specific
procedures to ensure they hire the best candidate while remaining true to legal and
organization requirements. Feelings of anxiety are likely for hiring managers who are
unfamiliar with the recruitment process (Landy & Conte, 2007). Informational and
interpersonal justice should play a part in hiring managers’ reactions to the process.
Informative recruiters will be able to explain why certain procedures are necessary, such
as conducting structured interviews or consensus meetings. Personable recruiters should
help hiring managers feel at ease with the process. Having someone answer questions and
guide the process in a warm and friendly manner should reduce the anxiety and stress
associated with making a hiring decision and increases a manager’s satisfaction with the
recruiter.
Fischer, Jacob, 2013, UMSL, p. 31 �
Hypothesis 18: Recruiter informativeness will be positively related to hiring manager satisfaction with the recruitment process (after hire). Hypothesis 19: Recruiter personableness will be positively related to hiring manager satisfaction with the recruitment process (after hire).
It should be noted that informativeness may actually stem from conscientiousness. It
is likely that conscientiousness leads to informative behaviors that ultimately provide
realism and reduce anxiety. In this sense, conscientiousness may be an antecedent of
informativeness. Likewise, extraversion may lead to personable behaviors and is an
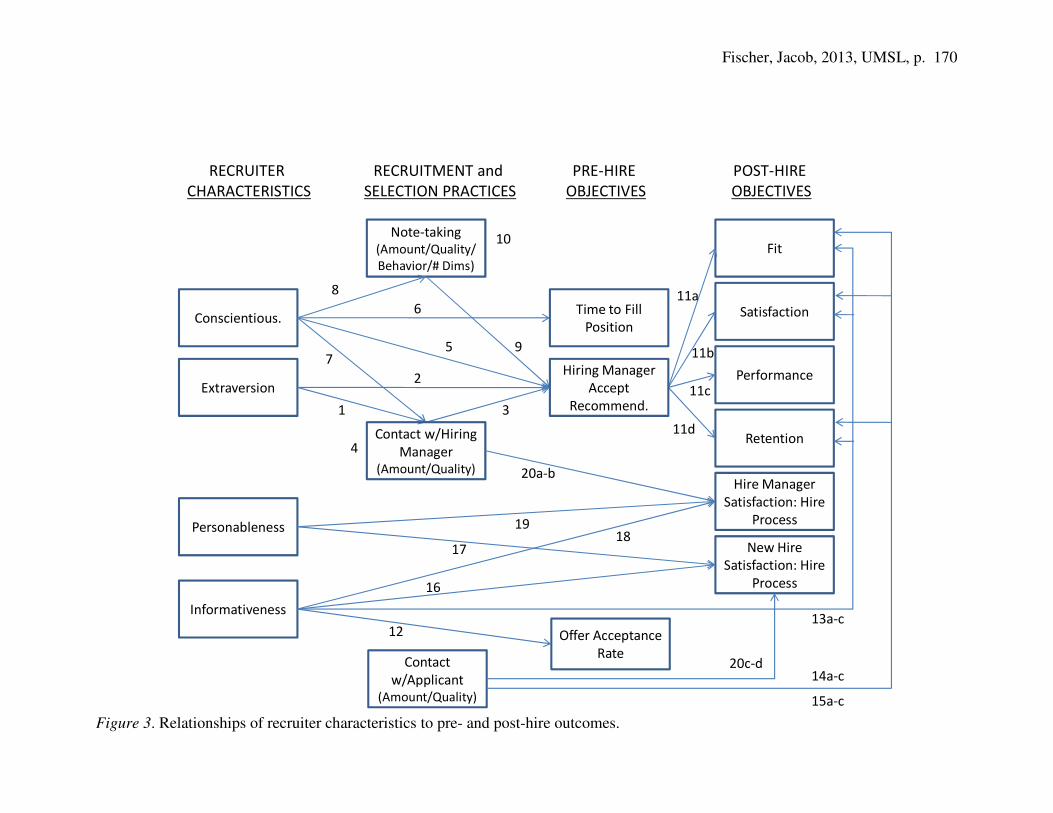
antecedent of personableness. Although not portrayed in this paper (see Figure 3),
another way to conceptualize recruiter characteristics would be a model that includes the
causal ordering of recruiter characteristics6.
In addition to recruiter characteristics, recruitment practices that contribute to clarity
of the process and reduced anxiety may have similar effects. Boswell et al. (2003)
showed that follow-up was an important practice associated with positive applicant
decisions. In their sample, 46% indicated that follow up behaviors such as frequent
contact, prompt responses, and cards influenced decisions. Continuing with the same
principles of interpersonal and informative justice, follow-up and contact may also relate
to hiring manager and applicant post-hire satisfaction with the recruitment process.
Recruiters who proactively contact applicants will be able to answer more questions and
provide more information, which should reduce anxiety and lead to positive post-hire
reactions.
���������������������������������������� �������������������6 Future research may want to consider modeling recruiter characteristics in this fashion, as well as looking at the interactions or combined effects of recruiter characteristics.
Fischer, Jacob, 2013, UMSL, p. 32 �
In the same way, recruiters who follow-up with hiring managers to review the status
of applicants, discuss timelines, and help prepare them for interviews will be able to
provide more information and training. These practices should help reduce anxiety and
increase the satisfaction with the hiring process. Furthermore, increased contact should
help build relationships between hiring managers and recruiters.
Hypothesis 20a-b: The (a) amount and (b) quality of contact recruiters have with hiring managers will be positively related to the hiring manager’s satisfaction with the recruitment process (after hire). Hypothesis 20c-d: The (c) amount and (d) quality of contact recruiters have with applicants will be positively related to the applicant’s satisfaction with the recruitment process (after hire).
In summary, recruiters play a central role in the recruitment and selection process.
This study is different from previous research in that the focus is on objective pre-hire
outcomes as well as post-hire outcomes. Previous research has been limited to pre-hire
outcomes such as applicant reactions and behaviors. In addition, this study will attempt to
show that recruiter characteristics relate to the administration of recruitment and selection
practices and that these practices are important to pre- and post-hire outcomes.
Recruitment and Selection Practices
As mentioned earlier, this study investigates the interaction of selection and
recruitment variables. Understandably, much of the work with selection devices has
focused on predicting job performance while little has been done explaining how those
devices may interact with recruitment efforts.� One selection device that may have
implications for recruitment outcomes and activities is biodata. Biodata is generally
understood as historical events or experiences that shape a person’s behavior or identity
Fischer, Jacob, 2013, UMSL, p. 33 �
(Mael, 1991). Research shows that biodata predicts job performance (Schmidt & Hunter,
1998) and turnover (Barrick & Zimmerman, 2005).
There are several theories about why biodata is predictive of employee behavior. The
underlying theme is that through experience individuals change (Breaugh, 2009). This
includes changes in personality, patterns of behavior, ability, and interests. Mumford and
colleagues (Mumford & Owens, 1987; Mumford & Stokes, 1991) argue that through
choices and subsequent experiences, individual attributes develop and change. In a
similar vein, Mael (1991) contends that experience influences a person’s propensity to
define oneself in terms of membership in social categories. This social identification then
influences how individuals act and create behavioral patterns. Thus, biodata items target
the personal attributes and behavioral patterns formed from experience.
A candidate’s work experience is a typical form of biodata. Quinones, Ford, and
Teachout (1995) developed a framework to categorize how experience is measured. In
their framework, they explained that work experience varies along dimensions of
specificity (task, job, organization) and mode of measurement (amount, time, type). They
found that previous experience approximating the work in terms of tasks and frequency
showed the highest relationship to job performance. In addition, they found that
experience was more predictive of objective work performance than subjective work
performance.
The work by Quinones et al. (1995) has important implications for framing and
coding biodata items. The framing of biodata items may change the usefulness of the
biodata measure (Breaugh, 2009). For example, if the criterion is job performance,
framing biodata items that more closely approximate specific tasks within the job may be
Fischer, Jacob, 2013, UMSL, p. 34 �
more predictive than framing items that simply reference time in a related job. Similarly,
for some jobs, the type of college degree may not be as important as the extent to which
an applicant took relevant courses or participated in relevant extra-curricular activities.
Quinones et al. (1995) focused their work on job performance. However, depending
on the criterion, items that reference specific tasks or the frequency of experience may
not be the most predictive. The criterion of person-organization fit is an example. Briefly
defined, person-organization fit is the compatibility between a person’s interests,
abilities, or personality and the organization’s needs or personality (Kristof, 1996). For
this criterion, experience with required tasks may not be as important as experience in
similar working conditions. In this case, an organization level specificity and the type of
experience may be more important because they reference experience in similar
organizations rather than similar tasks. Following this logic, this study will focus on
different methods of coding experience for use in predicting the achievement of
recruitment objectives.
Clearly, selecting high performing employees and keeping them at the organization
are important recruitment objectives as well as necessary criteria for showing the benefits
of a selection tool. However, experience may predict other recruitment outcomes such as
time to fill, fit, or satisfaction. Figure 4 shows the relationship between similar experience
and pre- and post-hire recruitment outcomes.
The idea that experience predicts how applicants will behave in pre- and post-hire
situations has implications for targeted recruitment. Targeted recruitment involves
choosing what types of employees to attract, where to find them, and how to reach them.
Although a practical concern for organizations, research on targeting is sparse (Barber,
Fischer, Jacob, 2013, UMSL, p. 35 �
1998; Breaugh et al., 2008; Ployhart, Schneider, & Schmitt, 2006). A typical targeting
strategy is to seek out those who have previous experience in a certain position. The
thought is that experienced applicants will already have the necessary skills and abilities
(Barber, 1998). Another reason why this is important is that through certain experiences
applicants will have insight into the job or organization.
An extension of the theoretical rationale for using previous experience in the selection
process is that through different experiences individuals gain insight. It is this insight that
aids an individual in their job search and socialization. For recruitment, previous
experience can signal the amount of insight an applicant has, which will impact various
recruitment practices and outcomes. Using previous experience as a proxy for applicant
insight may prove useful for creating a strong targeted recruitment strategy.
Breaugh et al. (2008) described three levels of position insight and the extent of
insight available to certain groups. These levels are job tasks, work group, and
organization. Breaugh et al. contended that former employees would have the greatest
insight across all three levels. Temporary employees and those who participated in
internships would also have good insight. Those applicants working in similar jobs would
have good insight into the tasks but not the work group or organization. In contrast,
applicants with family members or friends at the organization would have good insight
into the organization but not as much into the job tasks or work group.
By focusing on insight, researchers and practitioners can develop biodata items that
will be important for pre- and post-hire recruitment objectives. In this study, work
experience and accomplishments were examined in terms of similarity to the job and
working environment. Applicants with similar past experience should be seen as more
Fischer, Jacob, 2013, UMSL, p. 36 �
qualified by recruiters. As a result, it is likely that recruiters will screen resumes for those
with similar experience. To the extent that candidates with similar experience are found
in the applicant pool, the time required to fill a position will be faster than if applicant
pools lacked candidates with a great deal of similar experience. One way to determine
this, if rejected candidates are unavailable, is to correlate the new hire’s level of similar
experience with the time required to fill the position7.
In addition, those with similar job experience should have a better idea of what the
job is like. They should be more willing to accept offers given the fact that they remained
in the applicant pool up to this point. For candidates with less similar experience, they
might still be deciding if the work is right for them and may refuse the offer because of
uncertainty about the work. One way to test this is hypothesis, without access to the
entire applicant pool, would be to correlate the new hires’ level of experience and the
offer acceptance rate for positions. Although not ideal, it would provide some indication
that similar experience is important for objective pre-outcomes.
Furthermore, the insight available to applicants with experience in similar jobs and
working environments should help them adjust to the job and the environment, resulting
in post-hire fit, satisfaction, retention, and performance.
Hypothesis 21a-b: The degree of similarity between previous jobs and the current position will be negatively related to (a) time to fill position and positively related to (b) the offer acceptance rate of the position. Hypothesis 21c-d: The degree of similarity between previous jobs and the current position will be positively
���������������������������������������� ���������������������In this study, it was not possible to examine the past experience of all applicants and which applicants
received job offers but declined. The study could only examine the past experience of those accepting job offers. The job offer rate for each position was the number of offers accepted divided by the number offers made.
Fischer, Jacob, 2013, UMSL, p. 37 �
related to the new hire’s perception of (c) fit and (d) satisfaction. Hypothesis 21e: The degree of similarity between previous jobs and the current position will be positively related to the hiring manager’s rating of the new hire’s job performance. Hypothesis 21f: The degree of similarity between previous jobs and the current position will be positively related to the new hire’s retention.
Hypothesis 21g-h: The degree of similarity between previous experiences (e.g., education, accomplishments) and the current position will be positively related to the new hire’s perception of (g) fit and (h) satisfaction. Hypothesis 21i: The degree of similarity between previous experiences (e.g., education, accomplishments) and the current position will be positively related to the supervisor’s rating of the new hire’s job performance. Hypothesis 21j: The degree of similarity between previous experiences (e.g., education, accomplishments) and the current position will be positively related to the new hire’s retention.
Similar experience may also interact with other pre-hire activities. For example,
Walker, Feild, Giles, and Bernerth (2008) found that applicants with more job search
experience attended to high-quality messages in job ads, while those with less experience
attended to the aesthetics of job ads. Thus, having job search experience helped focus on
the critical aspects of the ad and avoid relying on peripheral cues. Since experience taps
the insight of applicants, some information communicated by recruiters may not be as
important for applicants with similar previous experience. Knowing an applicant’s
background can lead recruiters to tailor their recruitment messages. Information from
recruiters will still be critical for applicants without similar experience or insight. In this
Fischer, Jacob, 2013, UMSL, p. 38 �
case, the benefit of information from recruiters is dependent upon the experience and
insight of applicants.
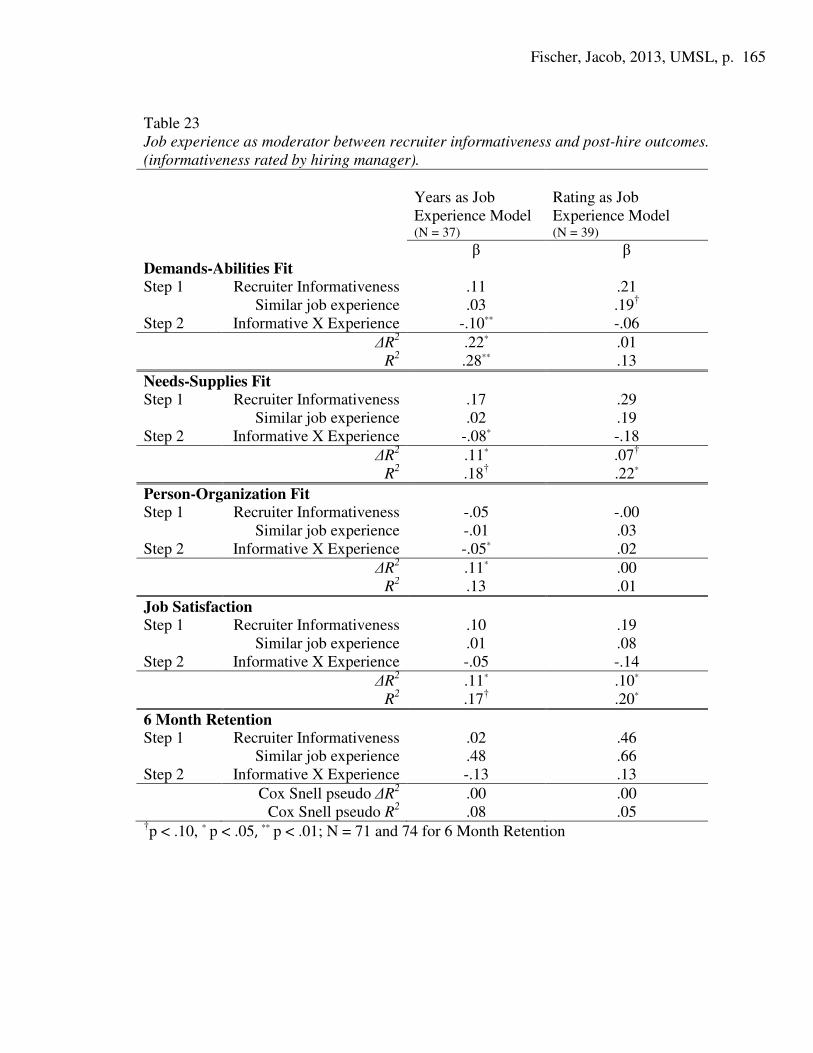
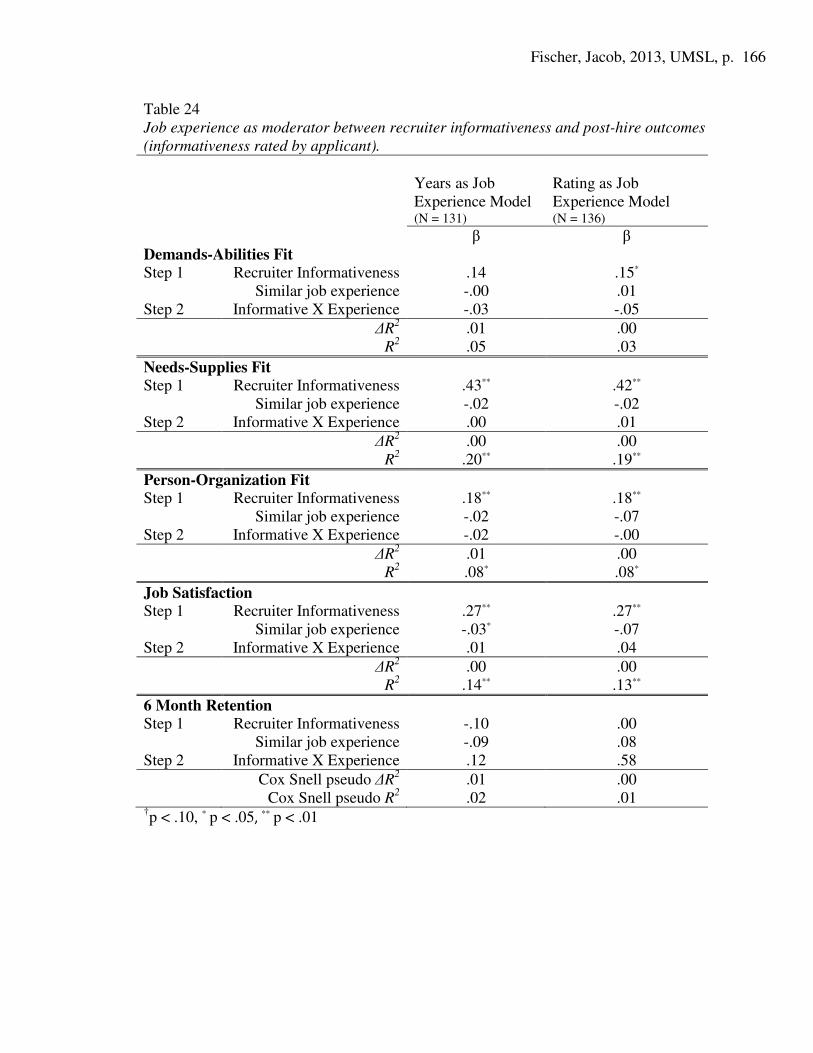
Hypothesis 22a: Experience in similar jobs will moderate the relationship between informative recruiters and new hire perceptions of fit, such that the relationship will be stronger when experience is low and weaker when experience is high. Hypothesis 22b: Experience in similar jobs will moderate the relationship between informative recruiters and new hire reported satisfaction, such that the relationship will be stronger when experience is low and weaker when experience is high. Hypothesis 22c: Experience in similar jobs will moderate the relationship between informative recruiters and new hire retention, such that the relationship will be stronger when experience is low and weaker when experience is high.
Multilevel Recruiter Effects
One aspect of recruitment that has not yet been mentioned is the fact that in many
cases applicants and hiring managers are nested within recruiters. This creates an
independence issue for many statistical tests. In the context of recruitment and selection,
the effects of recruitment and selection practices may depend on recruiter characteristics
or styles. Some research does suggest that recruitment and selection practices are often
influenced by individual recruiter preferences (Fritzsche & Brannick, 2002; Kristof-
Brown, 2000; Rynes & Gerhart, 1990). To explore potential non-independent effects of
recruitment and selection practices, a multilevel strategy may be needed. However,
multilevel analysis is only needed in the case where there are nesting effects (Bickel,
2007). Nesting occurs when groups of observations have a common link such as
attending the same school or living in the same geographic region. Nesting effects are
Fischer, Jacob, 2013, UMSL, p. 39 �
present when group membership explains variation in scores. In the method section, I
will discuss the issue of nesting and how I will address nesting in analyses. The following
paragraphs explain why nesting may be an issue in recruitment.
Accounting for the nested nature of recruitment outcomes is important because the
relationship among variables may vary across recruiters. From previous research, it is
apparent that recruiters differ in their administration of recruitment and selection
practices. For example, Rynes and Gerhart (1990) categorized the attributes that
influence recruiter perceptions of applicant fit during the employment interview. They
determined that attributes influence perceptions of fit because of a) idiosyncratic recruiter
preferences, b) organizational preferences, and c) universal preferences – where most
organizations would consider the characteristic as important. Using these categories,
Kristof-Brown (2000) investigated the antecedents to recruiter perceptions of fit. She
found that over 70% of the attributes included in her study were associated with a
recruiter’s idiosyncratic preference for evaluating person-job fit. She found similar results
for attributes indicative of person-organization fit. Similarly, Hakel and Shuh (1971)
documented the importance given to different applicant attributes during the interview.
They found that recruiters across seven occupations only agreed on 22 of 730 (3%)
attribute statements. Agreement was defined as at least 90% of recruiters endorsing the
attribute.
Finally, Fritzsche and Brannick (2002) found that when reviewing applicant resumes,
recruiters did not conform to a generalizable strategy. Furthermore, each recruiter’s
strategy was unreliable over time. Other studies have replicated these findings and have
Fischer, Jacob, 2013, UMSL, p. 40 �
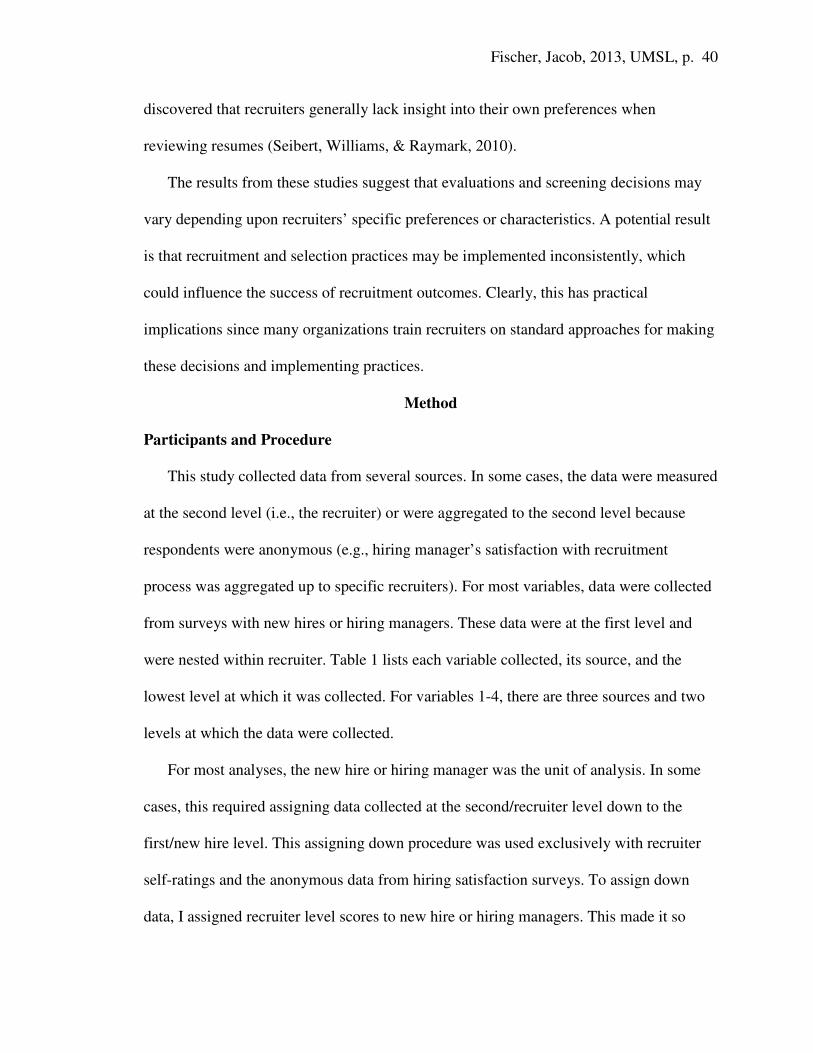
discovered that recruiters generally lack insight into their own preferences when
The results from these studies suggest that evaluations and screening decisions may
vary depending upon recruiters’ specific preferences or characteristics. A potential result
is that recruitment and selection practices may be implemented inconsistently, which
could influence the success of recruitment outcomes. Clearly, this has practical
implications since many organizations train recruiters on standard approaches for making
these decisions and implementing practices.
Method
Participants and Procedure
This study collected data from several sources. In some cases, the data were measured
at the second level (i.e., the recruiter) or were aggregated to the second level because
respondents were anonymous (e.g., hiring manager’s satisfaction with recruitment
process was aggregated up to specific recruiters). For most variables, data were collected
from surveys with new hires or hiring managers. These data were at the first level and
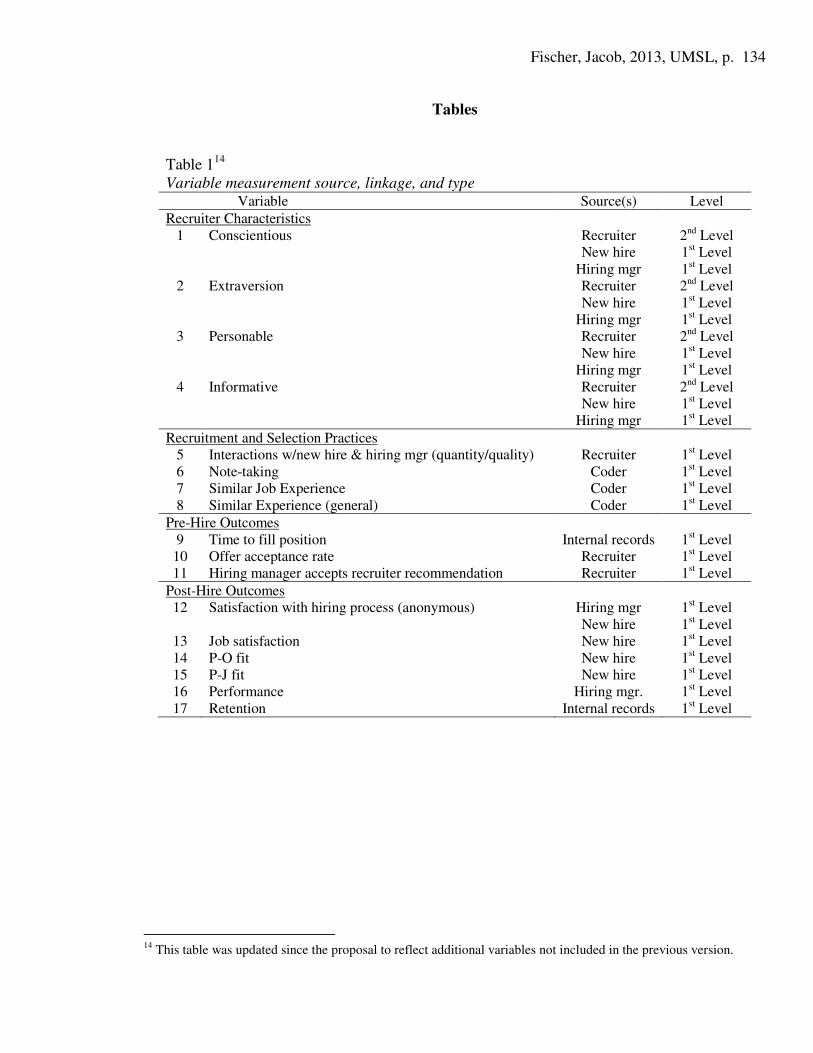
were nested within recruiter. Table 1 lists each variable collected, its source, and the
lowest level at which it was collected. For variables 1-4, there are three sources and two
levels at which the data were collected.
For most analyses, the new hire or hiring manager was the unit of analysis. In some
cases, this required assigning data collected at the second/recruiter level down to the
first/new hire level. This assigning down procedure was used exclusively with recruiter
self-ratings and the anonymous data from hiring satisfaction surveys. To assign down
data, I assigned recruiter level scores to new hire or hiring managers. This made it so
Fischer, Jacob, 2013, UMSL, p. 41 �
every new hire or hiring manager with the same recruiter received the same value in the
dataset. For example, if a recruiter gave a self-rating of 4.5 on the conscientiousness
scale, 4.5 would be assigned to all new hires or hiring managers associated with that
recruiter. The limitations of this approach are discussed later in the paper.
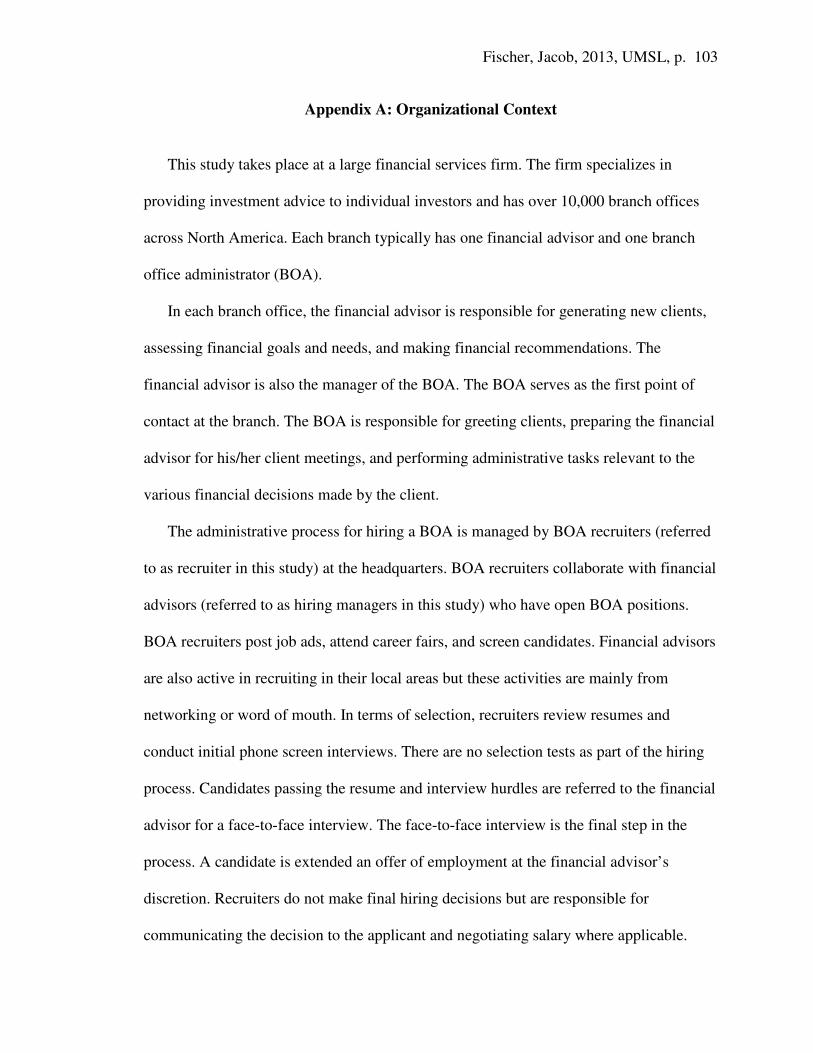
Internal records indicated that there were 774 new hires for the branch office
administrator (BOA) position between March 2011 and August 2011. The BOA position
is similar to a clerical or administrative assistant role but has a significant customer
service component. See Appendix A for additional information on the position and
sponsoring firm.
Data were collected through surveys with recruiters, new hires, hiring managers, and
by reviewing resumes and interview notes. Only recruiters sourcing the branch office
administrator (BOA) position were included. To initiate the staffing process, the branch
financial advisor/hiring manager contacts the corporate recruiter responsible for
recruiting and hiring in the geographic region. Staffing a BOA position can occur in order
to a) fill a new position in a new branch, b) replace a BOA who has left, or c) make an
addition to staff. The recruiter holds an initial meeting with the hiring manager to
understand the local branch’s needs. During the meeting, the recruiter and the hiring
manager discuss the staffing process and expectations. Additional information on the
hiring process for BOAs is discussed in Appendix A.
External sources for staffing a BOA include newspapers, referrals, and online job
postings. Internal sources include BOAs transferring from another branch or part-time
branch office assistants that apply for full-time positions. This study was limited to
external candidates because internal candidates do not always participate in the same
Fischer, Jacob, 2013, UMSL, p. 42 �
hiring process. Furthermore, only hired candidates were included since rejected
candidates would lack a significant amount of outcome data (e.g., fit, satisfaction, and
performance data) and would not have an opportunity to complete surveys on the hiring
process and recruiter interactions. The organization did not have a process to contact
rejected candidates.
At the beginning of the study, 18 recruiters were sent a survey measuring
conscientiousness, extraversion, informativeness, and personableness (newly hired BOAs
and hiring managers also provided ratings on these measures). The response rate for the
recruiter survey was 83% resulting in 15 recruiters in the final data set with self-ratings.
Of the 15 recruiters responding, 87% were female, 92% had three or more years of
experience, 100% had completed the firm’s structured interview training, and 27% had
participated in training through a professional organization. The typical selection process
for hiring recruiters was to administer interviews only. Interviews were structured and
largely based on the organization’s competency model. Selection tests or other
assessments outside of an interview were not typical for non-managers at the
organization.
Not all recruiters completed the survey before data collection began with new hires
and hiring managers. In the invitation to the survey, recruiters were told that the purpose
of the study was to understand the competencies critical to recruitment outcomes and the
success of branch offices. Recruiters were also told that their ratings would be
confidential and would only be used for research purposes. This survey is shown in
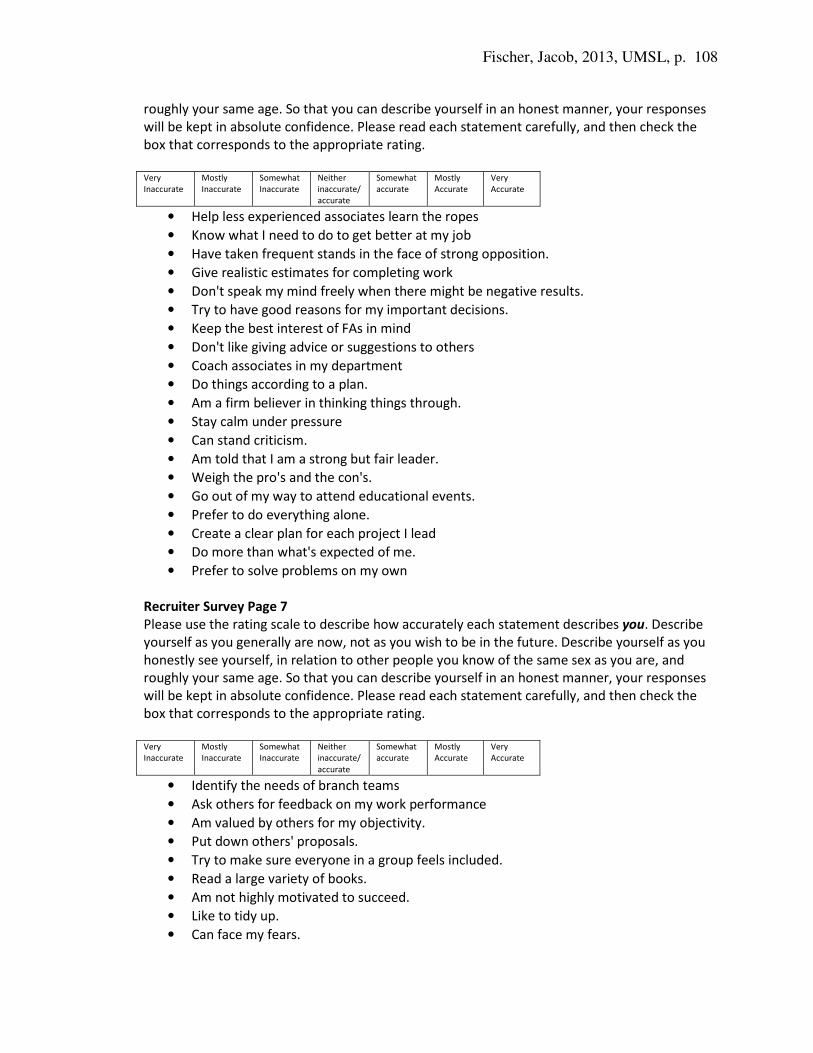
Appendix B. All surveys used in this study are shown in Appendices B-G.
Fischer, Jacob, 2013, UMSL, p. 43 �
As recruiters received requisitions to fill positions, they completed a brief survey after
each applicant accepted an offer. Seventeen recruiters participated in this portion of the
research, which resulted in 287 requisition surveys completed. The requisition survey
measured the number of times the recruiter contacted each hired applicant and hiring
manager, the quality of interactions with hiring managers and applicants, and the extent
to which the hiring manager accepted the recruiter’s hiring recommendation. Typically,
recruiters completed this brief questionnaire as they completed the required
documentation to close the requisition. In some cases, recruiters provided data on
requisitions a few weeks after the position was filled. However, many recruiters used a
software program that helped document their interactions with hiring managers and
candidates. This software helped several recruiters “back fill” their requisition surveys.
Even with this option, only 37% of the 774 new hires had requisition data. The survey is
shown in Appendix C.
New hires were sent two surveys8 after their start date. Although I did not collect
demographic data on the new hires in this study, a high percentage of the organization’s
current BOAs are female and a substantial percentage is 31 years or older. It is likely that
the study sample generally reflects the current population. The first survey measured
satisfaction with the recruiter and recruitment process. Invitations were sent
automatically through the firm’s applicant tracking system. In the invitation, new hires
were told that the purpose of the survey was to understand the effectiveness and quality
of the recruitment process. New hires complete the survey anonymously but the results
���������������������������������������� �������������������8 The original proposal indicated that both surveys would be sent out 30-45 days after the new hire’s start date. However, in practice only the organization’s survey was sent out at during that period. For the second survey, the organization decided that it could only go out once each month and could be no earlier than 45 days after hire. This resulted in some new hires receiving the survey near the intended timeframe and others receiving it later.
Fischer, Jacob, 2013, UMSL, p. 44 �
are linked to individual recruiters, which gives an aggregate picture of the recruiter if
collapsing across all new hires. Survey responses from 531 new hires were included in
this study. An accurate response rate could not be calculated from this survey because the
surveys were anonymous and there was no tracking of individual responses. Additionally,
respondents not directly associated with the study could have completed the survey
during the research period. The non-research respondents could have been internal
candidates, which were not included in this study, or some could have been referring to
an interaction that occurred outside of the research period. Even with this limitation, the
data still provide a measure of satisfaction with the hiring process managed by the
recruiter. Appendix D displays this survey.
The second survey was sent by the author through email and measured the new hire’s
job satisfaction, person-job fit, and person-organization-fit, and perceptions of their
recruiter’s informativeness, personableness, conscientiousness, and extraversion. This
survey was not anonymous. In this survey, new hires were told that the purpose was to
gather information about how things were going in the new role and review the hiring
process in order to find ways to better support branch offices. They were also told that the
survey was not anonymous. The two surveys were necessary because the recruitment
satisfaction survey was generated and conducted by the organization and it was not
possible to add items. The second survey allowed data to be linked to specific new hires
whereas the first only linked to recruiters. The response rate for this survey was 44%
resulting in a sample size of 343. The survey used is shown in Appendix E
Hiring managers also received two surveys regarding the hiring process. As with the
new hires, I did not collect demographic data for hiring managers. However, based on the
Fischer, Jacob, 2013, UMSL, p. 45 �
firm’s current population it is likely that a substantial percentage of the research sample is
male and between the ages of 31 and 66. The first survey was part of the organization’s
process for gathering input from hiring managers. Hiring managers were told that the
purpose of the survey was to understand the effectiveness and quality of the recruitment
process. It measured satisfaction with the recruiter and general satisfaction with the hiring
process. This survey was anonymous, but linked to specific recruiters. It was not sent
through the applicant tracking system. Rather, recruiters sent hiring managers an email
invitation to participate in the anonymous survey. Recruiters are encouraged to send this
survey immediately after the requisition has closed. There were 574 responses to this
survey. Like the other organization’s survey, it was not possible to calculate a response
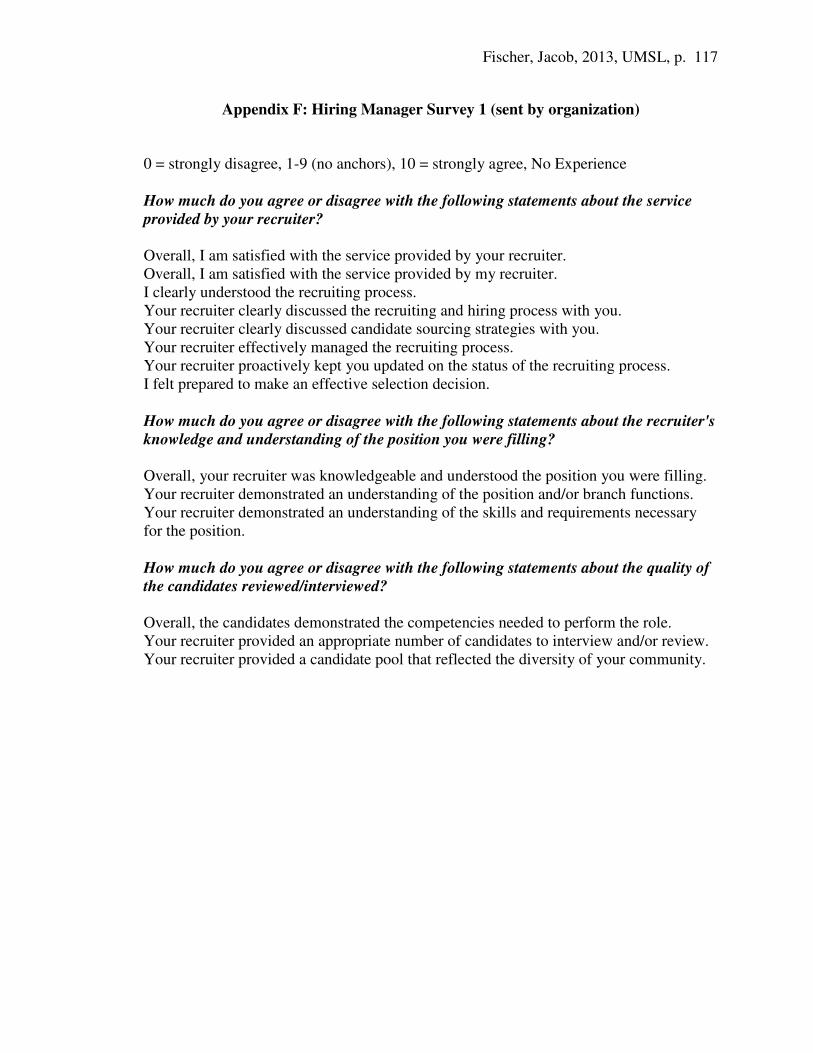
rate. Appendix F shows this survey.
The second survey to hiring managers was sent by the author. The invitation
explained that the purpose was to gather information about how things were going with
the new team and to review the hiring process in order to find ways to better support
branch offices. It was also explained that the survey was not anonymous. It measured the
hiring manager’s perception of the recruiter’s characteristics and their experience in the
recruiting process. This survey’s results link to specific hiring managers and new hires.
The survey was sent to 723 hiring managers. The response rate was 23% for a sample
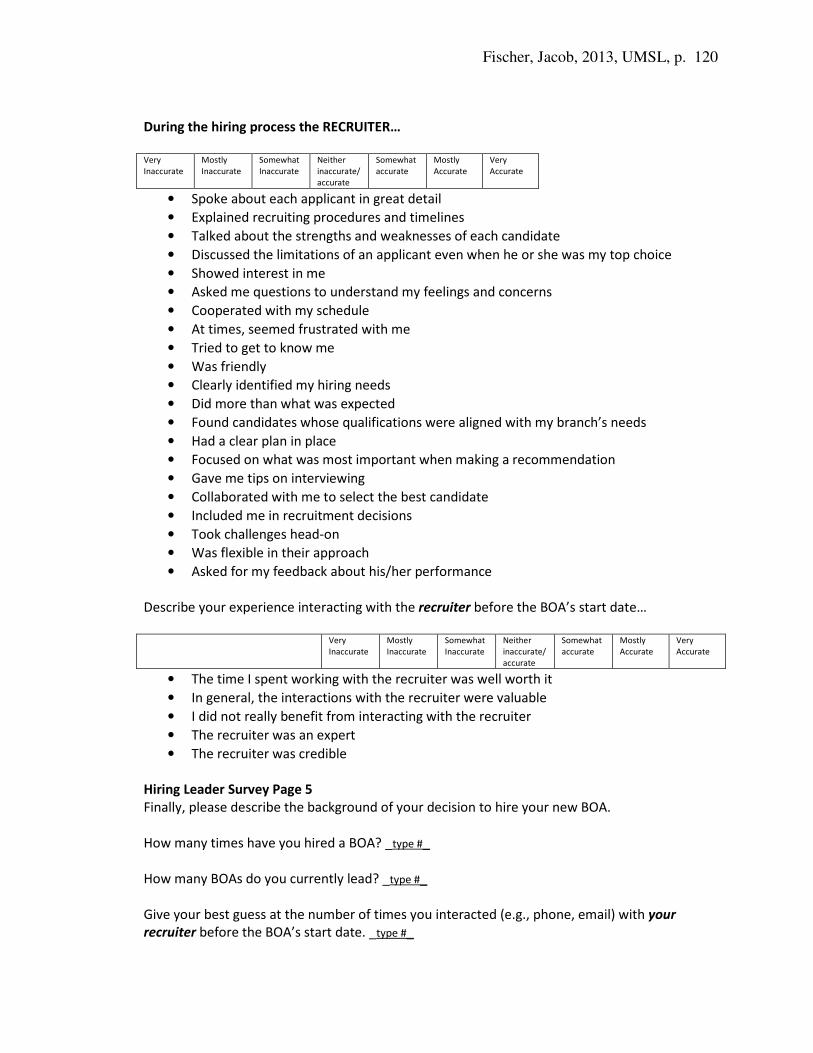
size of 165. The survey is displayed in Appendix G.
With few exceptions, all data collection and response rates are based on the 774 new
hires. The first exception is that only 723 hiring managers could be identified through the
internal organization’s tracking system. This left 51 new hires “unassigned” at the point
of hire to a hiring manager. These 51 remained in the data set since data analysis was
Fischer, Jacob, 2013, UMSL, p. 46 �
separated by rating source. The second exception is that for the organization’s
anonymous surveys sent to new hires and hiring managers it was not possible to match
responses to specific new hires or hiring managers, which means that some respondents
not associated with this study could have been included. Table 2 shows the total sample
sizes and response rates for each of the data collection sources.
Measures
Recruiters. Recruiters completed a survey measuring their conscientiousness,
extraversion, informativeness, and personableness. Each was measured on a 7-point scale
(1 = very inaccurate, 7 = very accurate). Conscientiousness and extraversion were
measured using items from the International Personality Item Pool (IPIP; Goldberg,
Johnson, Eber, Hogan, Ashton, Cloninger et al., 2006). An example item for
conscientiousness is “Pay attention to details” while an example item for extraversion is
“Make friends easily.” Each facet in the IPIP contains 10 items that mirror facets in the
NEO-PI-R (Costa & McCrae, 1992). I found internal consistencies of .82 for
conscientiousness and .77 for extraversion. Appendix H shows all the measures and their
associated items used in this study. Measures are in alphabetical order.
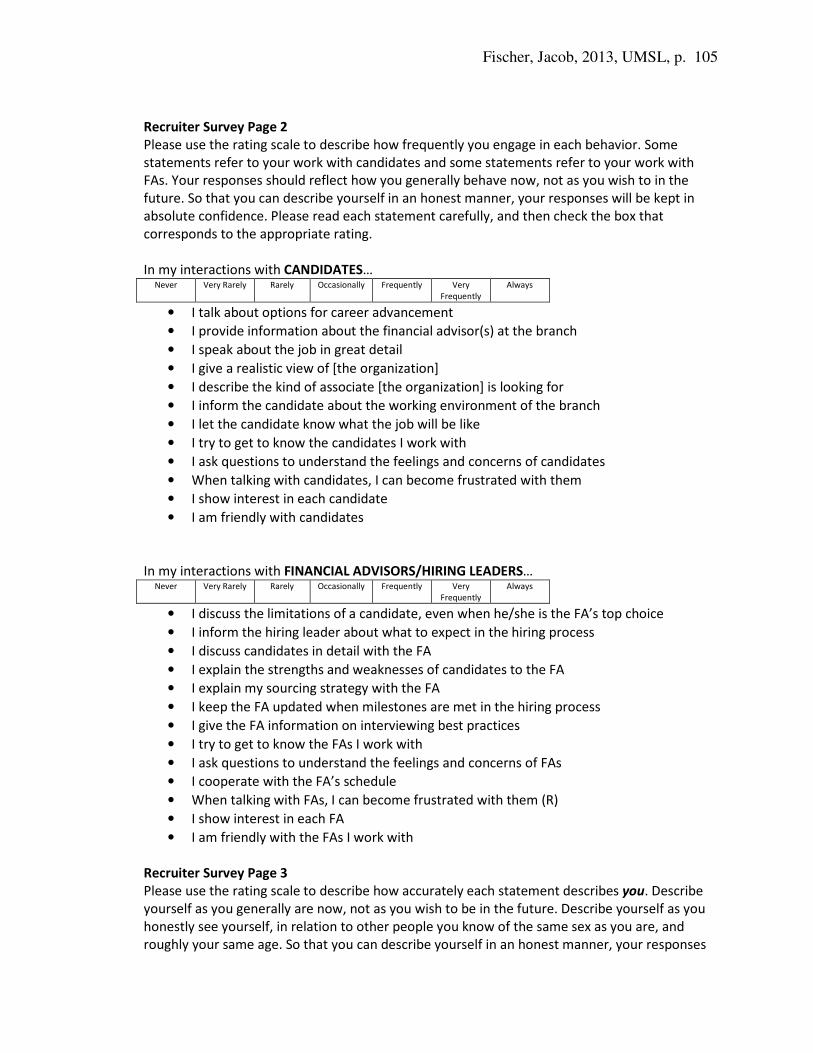
Recruiter informativeness was measured using two scales – one for informative
behaviors toward applicants (6 items) and the other toward hiring managers (5 items).
Items were based on Harris and Fink (1987) and were rated on a 7-point scale (1 = never,
7 = always). Example items include, “Talk about opportunities at other branches” and
“Discuss recruitment procedures and timelines.” I found internal consistencies of .84 for
informativeness toward hiring managers and .90 for informativeness toward applicants.
Personableness was also measured using two scales – one for personable behaviors
Fischer, Jacob, 2013, UMSL, p. 47 �
toward applicants and the other toward hiring managers. Each included five items.
Example items include, “Show interest in each applicant” and “Try to get to know the
hiring managers I work with.” Items were also rated on a 7-point scale and were based on
Harris and Fink. Internal consistencies were .59 for personableness toward hiring
managers and .51 for personableness toward applicants. New hires and hiring managers
completed separate measures of the recruiter’s personableness, informativeness,
conscientiousness, and extraversion. The reliability measures for those measures were
much higher.
Finally, recruiters completed a brief survey after an offer was accepted for a specific
position. This survey included several single item measures designed to gather
information on the extent to which a recruiter’s recommendation was accepted by the
hiring manager9, how many offers were made, and the amount of contact recruiters had
with the hiring manager and the applicant hired. Because these items were single
measures, it was not possible to compute reliability estimates.
New hires. New hires completed two surveys 30-90 days after their start date. The
first survey measures satisfaction with the recruiter (7 items) and satisfaction with the
hiring process (6 items). This survey is anonymous but links to specific recruiters. It was
sent automatically through the firm’s applicant tracking system. Items were rated on an
11-point scale with anchors at the lowest and highest ratings (0 = strongly dissatisfied, 10
= strongly satisfied). The survey is a part of the organization’s method for evaluating the
hiring process; therefore there was not an opportunity to change its characteristics (e.g.,
items, scale size, scale anchors). Only satisfaction with the hiring process was examined
���������������������������������������� �������������������9 Hiring managers at the host organization were free to accept or reject a recruiter’s hiring recommendation.
Fischer, Jacob, 2013, UMSL, p. 48 �
as part of this study since the focus of study was on recruitment outcomes. Example items
for this survey include “I was well informed during each step of the hiring process” and
“I feel the hiring process was fair.” The internal consistency for satisfaction with the
hiring process .91.
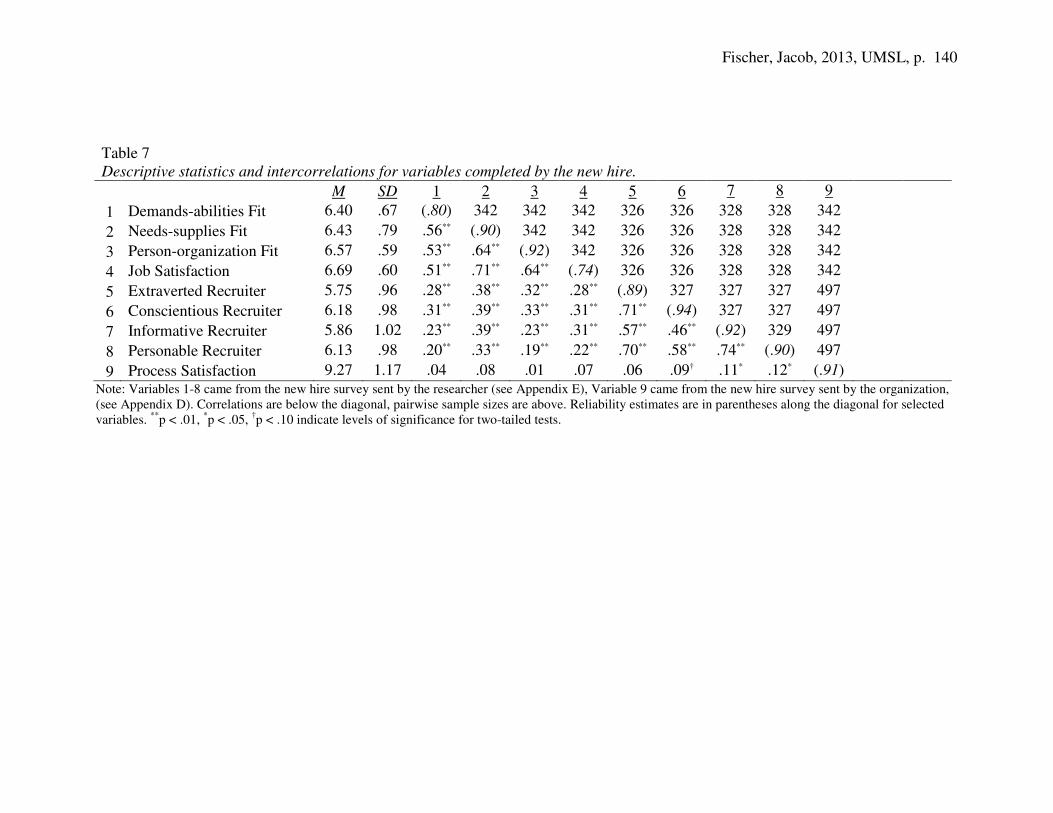
The second survey was sent by the researcher and measured a new hire’s person-job
fit, person-organization fit, and overall job satisfaction. Items measuring fit mirrored
those in Resick, Baltes, and Shantz (2007). Resick et al. combined items from measures
developed by Cable and Judge (1996) and Saks and Ashworth (1997). Person-job fit was
separated into demands-abilities fit and needs-supplies fit. An example item for demands-
abilities fit is “I possess the skills and abilities to perform this job” and an example of
needs-supplies is “This job is a good match for me.” An example item for person-
organization fit is “The values of this organization are similar to my own values.” I found
an internal consistency of .80 for demands-ability job fit (I eliminated one of the items in
the demands-abilities scale to increase alpha from .60). The internal consistency estimate
was .90 for needs-supplies job fit and .92 for person-organization fit. Items were rated on
Hiring managers also provided ratings of the new hire’s job performance after six
months on the job. Performance ratings were collected as part of the organization’s
normal protocol for administering the review. Hiring managers rated performance with a
single item measured on a 4-point scale (1 = Below Expectations, 4 = Outstanding). No
reliability information was available for this measure. However, Wanous and Hudy
(2001) report that the reliability of single item measures of job performance are close to
.70.
Coding. Two coders reviewed interview forms on 373 hired candidates. Coders were
two female graduate students in the university’s Industrial/Organizational Psychology
program. Each interview form included a space for the recruiter to attach the candidate’s
Fischer, Jacob, 2013, UMSL, p. 51 �
resume. Coders also reviewed each attached resume. Not all recruiters attached resumes
to the interview form, which resulted in resume data on 317 hired candidates.
Coders were blind to the study’s hypotheses. To record the data, coders were given a
coding sheet to follow as they reviewed resumes and interview notes. Appendix I shows
the rating form coders used to evaluate resumes and interview notes. Coders participated
in a brief training to create consistency between ratings. During the training, coders
received materials that described the BOA’s responsibilities and activities. They also
practiced coding while reviewing sample resumes and interviews. Throughout the time
coding, coders met with the researcher on two separate occasions to review coding and
discuss questions or concerns.
Coders reviewed structured interview forms to code note-taking dimensions. The
interview consisted of behavioral based questions and technical experience questions.
Sections of the interview that could contain notes were individual questions and an area
to include a brief written summary about the candidate’s interview performance and
general fit for the position. The summary statement was typically sent to hiring managers
to acquaint them with the candidate they would interview. Only notes formally included
in the interview document were coded. Similar to Burnett et al. (1998), notes from each
interview question and the summary statement were dichotomously coded in terms of
conveying or not conveying each content dimension (behavioral, dispositional,
contextual, procedural, and judgmental). For the section on technical experience, the
interview process was inconsistent. There were five possible questions, but hiring
managers dictated which questions were asked, if any. Therefore, to standardize the
coding all technical experience information was treated as a single question and was
Fischer, Jacob, 2013, UMSL, p. 52 �
dichotomously coded. Each interview received a total score for each dimension by
summing the dichotomous codes by dimension. Coders also made an overall rating of the
amount of detail included in the notes (1 = very little detail, 5 = very extensive detail).
Finally, the number of dimensions noted per interview was documented to create another
note-taking variable.
Resumes were coded to capture the degree of similarity of previous jobs to the current
job. Coders made ratings on a 5-point scale (1 = not at all similar, 5 = almost identical).
Years in similar jobs and total years of experience were also coded. In addition to
focusing on previous jobs, resumes were coded on a 5-point scale for the degree of
related non-work experiences, education, or accomplishments (1 = not at all related, 5 =
extremely related). Coding work experience in this way divided the experience domain
into job and other related experiences. This approach is similar to previous research
(Quinones et al., 1995).
For coding on Likert and continuous items, the interrater agreement index, rwg, was
adequate for all variables. However, Brown and Hauenstein (2005) argued that the awg
index is better a measure of agreement because it is less susceptible to sample size and
uses a sample-based variance instead of a population-based value. Therefore, this
measure was also included. In addition to the rwg and awg indices, I computed the inter-
rater correlation because the family of rwg indices may not be reliable when the number of
response options is greater than the number of raters (Brown & Hauenstein). In this
study, there were only two raters and Likert items had five response options. Table 3
shows the measures of agreement for each Likert or continuous variable coded from
notes and resumes. Overall, the agreement on each measure was sufficient. The
Fischer, Jacob, 2013, UMSL, p. 53 �
researcher resolved disagreements between coders if the disagreement differed by more
than one point. Disagreement of more than one point occurred in 13% of coding. If
coders were within one point of one another, the average was computed to resolve the
disagreement. This occurred in 20% of coding.
Finally, Cohen’s kappa was calculated to be .75 for agreement on dichotomous
coding. This was also adequate. The researcher served as tiebreaker in the case of
disagreement. Only 10% of the dichotomous coding required a tiebreaker.
Objective criteria. Time to fill position, turnover, and branch performance are
objective measures collected by the organization. Time to fill position was measured by
the number of days the position was open. At the host organization, turnover is highest
before the sixth month. Therefore, six months was used as the cutoff for measuring
turnover. Branch performance was not available as an additional criterion or potential
proxy to supervisor ratings.
Analytic Strategy
In planning this research project, I intended to use the following analytic techniques
for testing hypotheses. Correlations were to be used to test Hypotheses 1-3, 5-9, 11-14
and 16-21. Mediation using the Sobel (1986) test was to be used to test Hypotheses 4 and
1010. Multiple regression was to be used to test Hypothesis 15. Finally, moderation
analyses using regression were to be used to test Hypotheses 22.
I also considered using multilevel regression if nesting effects were sizable. For the
main analyses, I focused on testing hypotheses at the individual or 1st level. Assigning 2nd
level variables down to the individual level is not an uncommon practice, but there are ���������������������������������������� �������������������10 As recommended by MacKinnon, Fairchild, and Fritz (2007), I also conducted mediation analyses using bootstrapping to account for the skewed distribution of indirect effects. Results using bootstrapping were identical to those found with the Sobel test. Results of the Sobel test are reported in the Results section.
Fischer, Jacob, 2013, UMSL, p. 54 �
limitations (Hofmann, 2002). This practice can result in biased standard errors and
significance tests (Bickel, 2007). To investigate the different sources of variance and
potential biases, I checked for nesting effects. Large nesting effects would have helped
identify hypotheses in which multilevel analyses would have been appropriate. However,
because ratings were also made by individual hiring managers and new hires, I did not
have to rely solely on the assign down approach.
Multilevel regression. Although multilevel analyses are typically the recommended
approach to analyze nested data, there are significant limitations when certain conditions
are not met (James & Williams, 2000). Generally, multilevel tests should have about 30
groups with 30 individuals per group (Hox, 2002). This study had about half the
recommendation for group and individuals per group. Results from several simulations
suggest that when group sample sizes are less than 50, there is a slight downward bias for
the standard errors of fixed parameters (Maas & Hox, 2001). Additionally, Hox (2002)
reports that when there are few groups, the accuracy of the variance components are
underestimated. Hox and Maas (2001) indicate that with at least 30 groups, the variance
components are more accurate but when the number of groups is around 10, the variance
estimates are much too small. In terms of accuracy and sufficient power, a high number
of groups is more important than a high number of individuals per group (Hox, 2002).
For this reason, I relied on OLS regression to analyze hypotheses and planned to use
multilevel regression as an alternative when nesting appeared to be an issue. The primary
purpose for multilevel regression is to analyze nested data or data in which observations
are non-independent. Nesting effects occur when group membership explains variance in
the dependent variable. It is assessed by the intraclass correlation, which is comparable to
Fischer, Jacob, 2013, UMSL, p. 55 �
�2 (Bickel, 2007). Because nesting indicates the presence of non-independent data, I
planned to conduct analyses using multilevel regression when the ICC was large. Hox
(2002) suggests an ICC of .15 is large. However, I only had 16 groups for most analyses
with an average sample size of 18-33 depending on the measure used (see Table 2 for
sample sizes for data collection sources by recruiter). Therefore, I did not use multilevel
regression because there would not be sufficient degrees of freedom for models to
converge and power would be severely limited11. However, the nesting effects are
documented in Table 4.
Table 4 shows strong nesting effects (i.e., ICC value greater than .15) are especially
present for note-taking variables, such as total notes recorded (ICC = .68) and number of
note-taking dimensions recorded (ICC = .58). Nesting effects were not present for
variables measuring similar job experience (ICC for similar job experience in years = .02;
ICC for similar job experience rating = .02). Since I did not rely on multilevel regression,
hypotheses involving variables with nesting effects greater than .15 may warrant
additional caution when drawing conclusions.
Results
Before testing hypotheses I checked the normality of the data. The majority of the
variables in this study were negatively skewed. I also identified univariate outliers by
converting raw scores into standardized scores. If the standardized score was more
extreme than -3.29 or 3.29, I considered it an outlier (Tabachnik & Fidell, 2001). About
7% of cases had an outlier on at least one variable.
���������������������������������������� �������������������11 Although I did not rely on multilevel analysis for formal hypothesis testing, I did conduct the analyses to be consistent with the initial proposal. Results did not vary from the results found using OLS regression and the assign down approach as reported in the Results section.
Fischer, Jacob, 2013, UMSL, p. 56 �
I also checked for any pattern of missing data. In most cases, there was no difference
between variables for cases with complete data compared to cases with incomplete data.
Table 5 shows which variables had significant differences between complete cases and
incomplete cases. Effect sizes range between .15 and .52, in absolute values. However,
most were in the .30 range indicating small to moderate effects. For example, participants
with missing information on interview notes or resumes had recruiters receiving lower
ratings on informativeness, personableness, and conscientiousness. Because taking notes
and collecting a resume are under the recruiter’s responsibility these results may be
another indication that when recruiters do not follow up and record notes or gather
resumes they are perceived as lacking certain positive characteristics. Additionally, part
of the reason could have been created from the lack of contact with candidates. Notice in
the table that participants with missing data on notes and resumes had significantly less
contact with their recruiter than participants with data on notes and resumes. Overall, the
pattern of missing data does not appear to create a bias in the majority of results. One
possible instance is described in a later section.
I conducted analyses several different ways because of the complexity of the data
collection. First, for hypotheses involving recruiter characteristics, I conducted the test
using recruiter self-ratings, new hire, and hiring manager ratings of the characteristic. The
results of each are reported. Second, I conducted tests with and without outliers. Results
are presented for both analyses only when the analysis excluding outliers changed the
conclusions of the initial hypothesis test. Otherwise, only results from analyses including
all available data are reported. Finally, one tailed test p-values are reported for
Fischer, Jacob, 2013, UMSL, p. 57 �
hypotheses proposing positive or negative relationships12. This means that when the
hypothesized direction of the relationship is opposite of what was predicted, the p-value
will be larger than expected with two tailed tests.
Due to the complexity of data collection from multiple sources, characteristics of the
variables collected from each source are described below. Table 6 displays the means,
standard deviations, and intercorrelations for the variables completed by hiring managers.
All variables in the matrix are matched at the hiring manager level, but some of the
variables were aggregated up to the recruiter level before being assigned down to the
corresponding hiring manager level. This practice only occurred for variables correlating
with process satisfaction to account for the anonymous nature of the organization’s
survey. Table 6 shows that many variables seemed to have inflated ratings. For example,
the average performance rating was slightly above 3.0 on the 4-point scale with 76% of
ratings being 3.0 or greater. In addition, hiring manager ratings of recruiter characteristics
are more than one point above the midpoint of the 7-point scale. Finally, measurement of
recruiter characteristics may also be a problematic. The correlations among
characteristics were between .58 and .84, indicating hiring managers may have struggled
to differentiate between characteristics.
Table 7 displays the means, standard deviations, and intercorrelations for the
variables completed by new hires. Because one of the surveys was anonymous but nested
within recruiter, the same practice of aggregating up and then assigning down was
followed for variables correlating with process satisfaction. Data collected from new
hires appear to have similar challenges to variables completed by hiring managers. New
���������������������������������������� �������������������12 As noted earlier, nesting effects can create a downward bias in standard errors that generate smaller p-values. Attention should focus on the effect sizes of tests to aid in understanding the results.
Fischer, Jacob, 2013, UMSL, p. 58 �
hires tended to provide fairly high ratings regarding the organization and the recruiters
they worked with. All variable averages are above the midpoint on the 7-point scale.
Additionally, new hire ratings of recruiter characteristics have high intercorrelations
ranging from .46 to .74. New hires may also have had difficulty distinguishing the
different recruiter characteristics.
Table 8 shows the means, standard deviations, and intercorrelations for the variables
where the recruiter was the source. Recruiter self-ratings were assigned down to the new
hire or hiring manager level. There was no need to aggregate up since ratings on
characteristics were already made at the recruiter level. Recruiter ratings of the degree to
which hiring managers accepted the recruiter’s recommendation were very high (M =
2.64) with 73% of ratings at the highest rating option. This resulted in a ceiling effect on
the 3-point scale. In addition, the averages for the recruiter self-ratings on characteristics
were also high and approaching the ceiling on the 7-point scale. The offer acceptance rate
for each position was also very high at 95%. As a reminder, this variable was gathered
from recruiters and not generated by the organization’s internal tracking system.
Table 9 shows the means, standard deviations, and correlation matrix for all study
variables. Many of the intercorrelations were shown in previous tables (i.e., Tables 6-8).
However, for sake of clarity and reviewing all intercorrelations among study variables,
some results are repeated. The table shows that turnover is low. The retention rate at the
six month mark was 92%. Additionally, the years of total work experience for new hires
is over 16 years while the experience in similar jobs is much lower at 2.39 years.
Furthermore, the majority of notes taken by recruiters were contextual (M = 5.07) and
Fischer, Jacob, 2013, UMSL, p. 59 �
behavioral (M = 2.80) in nature. On average, recruiters recorded less than one procedural
or dispositional note for each candidate interviewed.
Hypothesis Testing
Below I describe the results of hypothesis testing. All results in the paper, unless
noted, are presented with new hires or hiring managers as the unit of analysis. For many
hypotheses, there were three sources of ratings on the recruiter characteristics. As
mentioned earlier, I report results of hypothesis tests with each of the three sources
separately. Due to the complexity and number of the results to review I created Table 10
to provide a summary of the effect sizes for each hypothesis test, which will help
compare across sources when necessary. Most effect sizes in Table 10 are correlations
but some indirect effects and �R2 values are also presented.
Recruiter extraversion. The correlations among the three rating sources for recruiter
extraversion were not very strong. Hiring manager ratings and new hire ratings were the
only pair that had a significant correlation (r = .26, p < .05). Hiring manager ratings and
recruiter self-ratings were not correlated (r = .06, p > .05). Similarly, new hire and
recruiter self-ratings were not correlated (r = -.07, p > .05).
Hypothesis 1 proposed that recruiter extraversion would be positively related to (a)
the number of times a recruiter would contact a hiring manager as well as (b) the quality
of those interactions. Hypothesis 1 was partially supported. Results show that hiring
manager ratings of extraversion were not related to the number of times a recruiter
contacted the hiring manager (r = -.04, p = .37) or to the quality of those interactions (r =
.13, p = .14). However, applicant ratings of recruiter extraversion were related to the
frequency of contact (r = .15, p < .05) and the quality of interactions were related to
Fischer, Jacob, 2013, UMSL, p. 60 �
applicant ratings at the .10 alpha level (r = .14, p < .10). There was no relationship when
using recruiter self-ratings of extraversion: frequency of contact (r = -.06, p = .84),
quality of contact (r = .05, p = .16). For reference, Table 11 shows the means, standard
deviations, and intercorrelations among all variables involved in Hypotheses 1-9. It
repeats information presented in Table 9, but is reduced to allow for easier reference and
interpretation. Additional tables like this are described throughout the results.
In Hypothesis 2, I proposed that recruiter extraversion would be related to the degree
of a hiring manager’s acceptance of recruiter hiring recommendations. This hypothesis
was not supported. Results were not significant with hiring manager ratings (r = .17, p =
.11), applicant ratings (r = .03, p = .39), or recruiter self-ratings of extraversion (r = -.05,
p = .24).
Hypothesis 3 proposed that (a) the quantity and (b) quality of interactions between
recruiters and hiring managers would be related to the degree of a hiring manager’s
acceptance of a recruiter’s hiring recommendation. It was partially supported. These data
were collected from requisition surveys completed by recruiters after an offer was
accepted. Quality of interactions were related to accepting recommendations (r = .29, p <
.01) but the quantity of interactions were not related to accepting recommendations (r =
-.20, p = .99; as mentioned earlier, results reported in the text were evaluated with one
tailed tests, therefore, this correlation was not significant because it was in the opposite
direction).
Hypothesis 4 proposed that (a) the quantity and (b) quality of interactions would each
partially mediate the relationship between extraversion and accepting recommendations.
Hypothesis 4 was not supported. I used the Sobel (1986) test to analyze mediation effects.
Fischer, Jacob, 2013, UMSL, p. 61 �
In the Sobel test, the regression coefficient from the predictor to the mediator is
multiplied by the regression coefficient from the mediator to the criterion. The product of
these regression coefficients is divided by its standard error to determine whether the
indirect effect is significant.
Table 12 shows the mediation effects for the frequency of interactions with hiring
managers. The table presents the effect sizes for each of the components of the mediation
test. The results are shown for each rating source as well. The path from extraversion to
frequency of interactions with the hiring manager is represented as a. For hiring
managers as the source, the regression coefficient for this path is -.16 and is not
significant (t = -.21, p = .84). The path from frequency of interactions to accepting
recruiter recommendations is represented as b. The regression coefficient for this path is
-.04 and is significant (t = -3.27, p < .01). The direct effect, t’, is the effect of extraversion
on accepting recommendations while accounting for the relationship between frequency
of interactions and accepting recommendations. The direct effect is .09 and not
significant (t = 1.27, p = .21). The total effect, t, is the overall relationship between
extraversion and accepting recommendations. The regression coefficient is .10 and also
not significant (t = 1.26, p = .21). Finally, the indirect effect, ab, is the product of the a
and b paths and is not significant (ab = .01, z = .20, p = .84). The significance test for the
indirect effect is based on the normal distribution and not a t distribution. Therefore, the
z-statistic is used to determine significance. Results in Table 12 tend to be consistent
across all three rating sources. Table 13 shows the results of the test of quality of
interactions with hiring managers as a mediator between extraversion and accepting
Fischer, Jacob, 2013, UMSL, p. 62 �
recommendations. These results were also not significant. Again, Hypothesis 4 was not
supported.
Recruiter conscientiousness. As with ratings of extraversion, correlations among
rating sources were low. The correlation between hiring manager and new hire ratings of
conscientiousness was the highest among the pairs but not significant (r = .18, p > .05).
The correlation between hiring manager and recruiter self-ratings was also not significant
(r = -.10, p > .05). Neither was the correlation between new hire ratings and recruiter
self-ratings (r = .05, p > .05).
For Hypothesis 5, I proposed that conscientiousness would relate to the hiring
manager’s acceptance of the recruiter’s recommendation. Hypothesis 5 was partially
supported. With hiring manager ratings of recruiter conscientiousness, results were
significant when including outliers (r = .23, p = .05), but not when excluding outliers (r =
.11, p = .23). Only one outlier was identified and removed. Results were not significant
when using applicant ratings (r = .09, p = .17). However, using recruiter self-ratings did
yield a significant relationship (r = .39, p < .01).
Hypothesis 6 indicated that recruiter conscientiousness would be negatively related to
time to fill position. It was partially supported. Results were significant when using hiring
managers as the rating source for conscientiousness (r = -.25, p < .01). Results were not
significant when using applicant ratings (r = .03, p = .67) or recruiter self-ratings (r = .08,
p = .97).
Hypothesis 7 proposed that recruiter conscientiousness would be related to (a) the
frequency of interactions between recruiters and hiring managers and (b) the quality of
those interactions. Hypothesis 7 was partially supported. For the most part, results were
Fischer, Jacob, 2013, UMSL, p. 63 �
not significant. Hiring manager ratings of recruiter conscientiousness were not related to
frequency of interactions (r = -.10, p = .80) nor quality of interactions (r = .10, p = .22).
Applicant ratings of recruiter conscientiousness were also not related to frequency (r =
.13, p = .07) or quality of interactions (r = .10, p = .13) with hiring managers. In
constrast, recruiter self-ratings of conscientiousness did show a significant relationship
with quality of interactions (r = .48, p < .01) and frequency of interactions (r = .11, p =
.04). When removing outliers, the correlation with frequency of interactions became non-
significant (r = .10, p = .06). Only one outlier was identified and removed.
Hypothesis 8 proposed that recruiter conscientiousness would correlate positively
with the (a) amount and (b) quality of note-taking, as well as the (c) number of note-
taking dimensions. It was mostly supported. For hiring managers as the rating source,
results showed significant relationships between conscientiousness and the total amount
of notes (r = .24, p = .02) but not the quality of notes (r = .09, p = .20). There was also a
significant relationship between conscientiousness and the number of note-taking
dimensions (r = .22, p = .02). When removing outliers, the relationships between hiring
manager rated conscientiousness and the total amount of notes (r = .17, p = .06) and
number of note-taking dimensions (r = .18, p = .05) were only significant at the .10 level.
Only one outlier was identified and removed.
For applicant ratings of conscientiousness there were significant relationships with
the total amount of notes (r = .13, p < .05) and quality of notes (r = .14, p = .04) but not
the number of note-taking dimensions (r = .06, p = .21). Significant relationships also
resulted when using recruiter self-ratings of conscientiousness to predict the amount of
Fischer, Jacob, 2013, UMSL, p. 64 �
notes (r = .35, p < .01), quality of notes (r = .36, p < .01) and number of note-taking
dimensions (r = .13, p = .01).
Hypothesis 9 proposed that (a) recruiter interview note-taking on specific behaviors
would relate to accepting a hiring recommendation and (b) quality notes would relate to
accepting a hiring recommendation. Hypothesis 9 was partially supported. Interview
notes on specific behaviors were significantly related to accepting hiring
recommendations (r = .26, p < .01). The quality of notes was related to accepting hiring
recommendations at the .10 alpha level (r = .15, p = .06).
Hypothesis 10 proposed that the relationship between conscientiousness and
accepting hiring recommendations would be partially mediated by (a) behavioral notes
and (b) quality notes. The hypothesis was not supported. The indirect effects from the
Sobel test were not significant. Tables 14-15 show the details of these analyses.
Hiring recommendations. Hypothesis 11 indicated that acceptance of recruiter
recommendations would relate to post-hire outcomes: (a) fit, (b) satisfaction, (c)
performance, and (d) retention. This set of hypotheses was unsupported. Several analyses
were significant when including outliers: demands-abilities fit (r = .11, p = .12), needs-
supplies fit (r = .18, p = .03), person-organization fit (r = .13, p = .09), satisfaction (r =
.20, p = .02), performance (r = .07, p = .19), six month retention (r = .10, p = .08).
However, when removing outliers the results of some of these results became non-
significant and several were in the opposite direction: demands-abilities fit (r = -.14, p =
.08), needs-supplies fit (r = .00, p = .99), person-organization fit (r = -.15, p = .07),
satisfaction (r = -.01, p = .89). In this set of analyses only one to two outliers were
removed.
Fischer, Jacob, 2013, UMSL, p. 65 �
Given the results changed so dramatically and that most analyses were affected, I
created scatterplots for additional investigation. When graphing the scatterplots of these
relationships, I discovered that the discrepancies between the results were due to a single
case. Figure 5 shows the scatterplots of these relationships. The influential case is
highlighted in each graph. By looking at the graphs it appears that the individual had
extreme low responses on all variables and could be due to intentional distortion. I
investigated the response pattern for that case and responses were not consistently
extreme across all the variables so it would not be appropriate to assume that the
participant was intentionally distorting the responses by selecting the most extreme
responses. Table 16 shows the intercorrelations of all study variables related to this
hypothesis13.
Recruiter informativeness and personableness There was virtually no agreement
across sources for ratings of informativeness or personableness. Hiring manager ratings
of informativeness were not related to new hire ratings (r = .09, p > .05) or recruiter self-
ratings of informativeness toward the hiring manager (r = -.13, p >.05). Hiring manager
ratings were, however, negatively correlated with recruiter self-ratings of informativeness
toward applicants (r = -.23, p < .01). New hire ratings showed no relationship to recruiter
self-ratings of informativeness toward hiring managers (r = .02, p > .05) or self-ratings of
informativeness toward applicants (r = .03, p > .05). On the other hand, recruiter self-
ratings of informativess toward hiring managers and self-ratings toward applicants was
highly correlated (r = .87, p < .01).
���������������������������������������� �������������������13 As mentioned in an earlier footnote, some mediation hypotheses were removed after additional review and discussion. The results of those hypotheses are presented in Appendix J.
Fischer, Jacob, 2013, UMSL, p. 66 �
Similarly, the correlations were low and non-significant for ratings of personableness
across sources. Hiring manager ratings were not related to new hire ratings (r = .16, p >
.05), recruiter self-ratings of personableness toward the hiring manager (r = -.07, p > .05),
or self-ratings of personableness toward applicants (r = -.06, p > .05). New hire ratings
showed no relationship to recruiter self-ratings of personableness toward hiring managers
(r = .03, p > .05) or self-ratings of personableness toward applicants (r = .02, p > .05).
However, recruiter self-ratings of personableness toward hiring managers and self-ratings
toward applicants were highly correlated (r = .59, p < .01).
Hypothesis 12 proposed that recruiter informativeness would positively correlate with
the offer acceptance rate for a position. This hypothesis was not supported. Offer
acceptance rate did not correlate with informativeness for any of the rating sources:
hiring managers (r = -.04, p = .64), applicants (r = -.04, p = .31), or recruiter self-ratings
(r = .10, p = .06). Table 17 displays the intercorrelations for variables included in
Hypotheses 12-14.
Hypothesis 13 indicated that informativeness would positively correlate with post-
hire outcomes: (a) fit, (b) satisfaction, and (c) retention. It was partially supported.
Results were not significant when using hiring manager ratings of informativeness:
demands-abilities fit (r = .07, p = .27), needs-supplies fit (r = .09, p = .21), person-
organization fit (r = -.16, p = .92), satisfaction (r = .03, p = .40), and six month retention
(r = .05, p = .28).
However, when using applicant ratings of recruiter informativeness several
significant relationships emerged: demands-abilities fit (r = .23, p < .01), needs-supplies
Fischer, Jacob, 2013, UMSL, p. 67 �
fit (r = .39, p < .01), person-organization fit (r = .23, p < .01), satisfaction (r = .31, p <
.01), and six month retention (r = .05, p = .19).
Results were not significant when using recruiter self-ratings of informativeness:
demands-abilities fit (r = .00, p = .47), needs-supplies fit (r = .09, p = .07), person-
organization fit (r = .08, p = .08), satisfaction (r = .07, p = .13), and six month retention (r
= -.02, p = .65).
Hypothesis 14 proposed that a recruiter’s amount of contact with the applicant would
positively correlate with post-hire outcomes: (a) fit, (b) satisfaction, and (c) retention. It
additionally proposed that a recruiter’s quality of contact would positively correlate with
post-hire outcomes: (d) fit, (e) satisfaction, and (f) retention. Hypothesis 14 was not
supported. As with the amount and quality of contact with hiring managers, these
variables were collected on the requisition survey completed by the recruiter after an
offer was accepted. For amount of contact, relationships with outcomes were not
significant: demands-abilities fit (r = -.08, p = .83), needs-supplies fit (r = -.08, p = .82),
person-organization fit (r = -.13, p = .93), satisfaction (r = -.07, p = .78), and six month
retention (r = -.09, p = .93). Likewise, quality of contact did not relate to post-hire
outcomes: demands-abilities fit (r = .10, p = .12), needs-supplies fit (r = .06, p = .24),
person-organization fit (r = .07, p = .22), satisfaction (r = .09, p = .15), and six month
retention (r = .01, p = .44).
Hypothesis 15 indicated that amount and quality of contact would predict additional
variance over recruiter informativeness in post-hire outcomes: (a) fit, (b) satisfaction, and
(c) retention. This hypothesis was not supported. The �R2 values were not significant
when using hiring manager ratings of recruiter informativeness: demands-abilities fit
Fischer, Jacob, 2013, UMSL, p. 68 �
(�F(2, 39) = 1.08 , p = .35), needs-supplies fit (�F(2, 39) = .16, p = .85), person-
organization fit (�F(2, 39) = .21, p = .81), job satisfaction (�F(2, 39) = .06, p = .94) and
six month retention (�F(2, 66) = .33, p = .72).
Results were not significant when using applicant ratings of recruiter informativeness:
demands-abilities fit (�F(2, 124) = 1.52, p = .22), needs-supplies fit (�F(2, 124) = .17, p
= .19), person-organization fit (F(2, 124) = 2.16, p = .12), job satisfaction (�F(2, 124) =
1.47, p = .23) and six month retention (�F(2, 124) = 2.79, p = .07). When removing
outliers, only the conclusions for six month retention changed (�F(2, 120) = 4.16, p =
.02) with a �R2 of .07. Six outliers were removed in this analysis.
Finally, similar non-significant results ocurred when using recruiter self-ratings of
informativeness: demands-abilities fit (�F(2,114) = 1.03, p = .36), needs-supplies fit
(�F(2, 114) =.62 , p = .54), person-organization fit (�F(2, 114) = 1.91, p = .15), job
satisfaction (�F(2, 114) = .69, p = .50) and six month retention (�F(2, 253) = .04, p =
.96). Tables 18-20 show the results of each test by rating source.
Hypotheses 16-20 evaluated the recruiter characteristics and activities as predictors of
the hiring manager and new hire’s satisfaction with the hiring process. The analysis of
these hypotheses was challenging due to the fact that hiring process satisfaction data were
taken from the organization’s anonymous surveys. Although anonymous, responses were
nested within recruiter. To test the hypotheses, I aggregated predictor data up to the
recruiter level by taking the mean of each predictor by recruiter. Next, I assigned the
aggregated scores down to the anonymous new hires or hiring managers. Each
anonymous new hire or hiring manager with the same recruiter received the same value
for the predictor.
Fischer, Jacob, 2013, UMSL, p. 69 �
I chose to aggregate the predictors (recruiter characteristics, quantity and quality
interactions with hiring managers or applicants) rather than the criterion data (hiring
satisfaction) because the predictors were more closely aligned with the recruiter. The
criterion data in this case were further removed from the recruiter. Thus, it seemed more
consistent to aggregate the variables more closely aligned with the recruiter level.
I did not follow this pattern when reporting the intercorrelations between hiring
satisfaction and other variables in this study (see Table 9). For intercorrelations among
hiring satisfaction and other variables (i.e., all variables excluding recruiter
characteristics and quantity and quality interactions with hiring managers or applicants), I
chose to aggregate the hiring satisfaction variables up to the recruiter level and then
assign those ratings down to the other variables. I chose this method because these
variables were more proximal to recruiters. This process resulted in analyses with sample
sizes of nearly 500 rather than 15 if predictors and criteria were each aggregated up to the
recruiter level. Therefore, in Table 9, all correlations between hiring process satisfaction
and recruiter characteristics, quantity and quality of interactions with hiring managers or
applicants are reported based on aggregating and assigning down recruiter characteristics,
quantity and quality of interactions. Whereas all correlations between hiring process
satisfaction and all other variables are based on aggregating and assigning down hiring
process satisfaction variables. The limitations of these approaches are discussed later.
In terms of hypotheses involving hiring satisfaction variables, Hypothesis 16
proposed that recruiter informativeness would positively correlate with new hire
satisfaction with the hiring process. It was mostly supported. For hiring managers as the
rating source, results were significant (r = .11, p < .01). Results were also significant with
Fischer, Jacob, 2013, UMSL, p. 70 �
new hires as the rating source (r = .11, p < .01). However, when using recruiter self-
ratings the results were not significant (r = -.05, p = .83). Table 21 shows the
intercorrlations among study variables in Hypotheses 16-20.
Hypothesis 17 proposed that recruiter personableness would relate to a new hire’s
satisfaction with the hiring process. This hypothesis was supported. Hiring manager
ratings of personableness were significantly related to satisfaction with the hiring process
(r = .10, p = .01). Likewise, results were significant when using new hire ratings of
recruiter personableness (r = .12, p < .01). For recruiter self-ratings, results were not
significant (r = .03, p =.25).
Hypothesis 18 proposed that recruiter informativeness would be a predictor of hiring
manager satisfaction with the hiring process. Hypothesis 18 was partially supported.
Results were significant when using hiring manager ratings of informativeness (r = .13, p
< .01) but not when using new hire ratings (r = .02, p = .33) or recruiter self-ratings (r =
-.15, p = .99).
Hypothesis 19 indicated that recruiter personableness would predict hiring manager
satisfaction with the hiring process. Hypothesis 19 was partially supported. Significant
results occurred when using hiring manager ratings of personableness (r = .12, p = .01)
but not when using new hire ratings (r = .06, p = .07) or recruiter self-ratings (r = -.10, p
= .99).
Hypothesis 20 proposed that the (a) amount of contact with hiring managers, (b) the
quality of contact with hiring managers, (c) the amount of contact with candidates, and
(d) the quality of contact with candidates would relate to satisfaction with the hiring
process. Hypothesis 20 was not supported. Results showed that amount of contact with
Fischer, Jacob, 2013, UMSL, p. 71 �
hiring managers was not related to hiring managers’ hiring process satisfaction (r = -.05,
p =.85). The quality of contact with hiring managers did not correlate with hiring
managers’ process satisfaction (r = -.01, p = .62). The amount of contact with applicants
was not related to applicants’ process satisfaction (r = .06, p =.12). Finally, the quality of
contact with applicants did not relate to applicants’ process satisfaction(r = -.02, p = .67).
Recruitment and selection practices. Hypotheses 21a-b proposed that similar job
experience would correlate with pre-hire outcomes: (a) time to fill position and (b) offer
acceptance rate. Similar job experience was gathered from resumes. It was measured in
years of similar job experience and by an overall rating of similar job experience. Each
form was used in testing hypotheses. Hypotheses 21a was supported. Years of similar
experience was related to time to fill position (r = -.10, p = .03). The relationship between
the rating of similar experience and time to fill position and was also significant (r = -.16,
p < .01).
Hypothesis 21b was not supported. Years of similar experience did not correlate with
the offer acceptance rate for the position (r = -.01, p = .55). Likewise the overall rating of
similar experience did not correlate with the offer acceptance rate for the position (r =
.01, p = .54).
Hypothesis 21c-f proposed that job experience would correlate with post-hire
Therefore, recruiters are likely to seek out these types of candidates from the candidate
Fischer, Jacob, 2013, UMSL, p. 84 �
pool early in the recruitment process. This would lead to more experienced candidates
getting through the hiring process faster.
When it comes to post-hire outcomes, there was limited evidence to support the idea
that similar experience is a predictor (see Hypothesis 21). There was no relationship
between similar experience and fit and satisfaction. However, both years and the rating of
similar experience were related to supervisor ratings of performance. This is consistent
with previous research proposing that the type of work experience should relate to
performance in a similar role (Quinones et al., 1995).
Finally, this study also proposed that researchers should not study recruitment and
selection variables in isolation but should account and test for possible interactions. As a
whole, results of interactions between recruitment and selection variables were
conflicting across rating sources (see Hypothesis 22). The interaction between similar
experience and recruiter informativeness tended to predict post-hire outcomes when using
years of experience and hiring manager ratings of recruiter informativeness (see Figure
6). Those tests were consistent with the hypothesis in that the more experience an
applicant had, the less important the recruiter’s informativeness was to post-hire
outcomes. This has important implications for targeted recruitment and selection efforts.
For example, if an applicant has significant experience it is unlikely that the recruiter will
need to provide significant information outside of what is already known to the applicant.
On the other hand, if an applicant is new to the field, then the degree to which a recruiter
can provide information will be helpful for setting expectations related to post-hire
outcomes.
Fischer, Jacob, 2013, UMSL, p. 85 �
However, when using recruiter self-ratings, interactions were significant but the form
was in the opposite direction (see Figures 8-9). In these situations, when an applicant has
a high degree of similar job experience, the relationship between recruiter
informativeness and post-hire outcomes was positive but when applicants had very little
similar job experience the relationship between informativeness and post-hire outcomes
was not significant. One possible reason for the inconsistency between hiring manager
ratings and self-ratings could be the lack of agreement among rating sources. Future
research should clarify how applicant experience and informativeness interact to predict
pre- and post-hire outcomes.
Limitations
General limitations of this study include the timing and order of data collection,
potential for common method variance, inconsistency in ratings of recruiter
characteristics across sources, the use of an assign down approach to dealing with group
level data, range restriction, and limited information from applicants and hiring
managers. Each of these general limitations is discussed below.
Study results could have been affected by the timing and order of data collection. For
example, hiring managers were asked to provide ratings of recruiter characteristics after
their position was filled and the new hire was on the job. The significant relationship
between conscientiousness and time to fill position could have been be due to the fact
that hiring managers made ratings on the recruiter’s conscientiousness after new hires
were on the job (see Hypothesis 6). This may have created a bias if hiring managers were
thinking about the outcomes of the hiring process when completing surveys. Following
the logic of the halo effect, if outcomes were positive, hiring managers may have
Fischer, Jacob, 2013, UMSL, p. 86 �
attributed the results to the recruiter and been more likely to make ratings on recruiters
that were positive, thus creating an inflated correlation between recruiter characteristics
and objective criteria. However, hiring managers in this study would not typically have a
point of comparison for time to fill position. On average, hiring managers in this sample
participated in hiring a BOA only 2.30 times during their tenure and had 1.17 BOAs on
staff at the branch.
Additionally, the timing of data collection was problematic for the measurement of
post-hire attitudes. In the study, some new hires provided ratings at 45 days after hire and
others provided ratings closer to 90 days after hire. As mentioned earlier, the organization
made the requirement that the research survey be sent out only once each month. As a
result, findings could have been biased because of the inconsistent measurement times.
Perceptions of fit and satisfaction may differ significantly at 45 days compared to 90 days
after hire. Finally, all recruiters did not complete their self-ratings of characteristics at the
same time. Some recruiters completed the self-ratings before the main data collection
began and others completed it during the time main data collection was underway.
Recruiters responding later in the process may have inflated self-ratings if they knew
which characteristics were being studied.
Another limitation was that several analyses contained variables measured from the
same source. This could have led to biased correlations based on common method
variance. However, in several cases, variables completed by the same source were not
completed at the same time and self-report variables (e.g., recruiter conscientiousness)
were paired with factual reports of events (e.g., frequency of contact with hiring
managers). Both of these strategies reduce the potential for common method variance
Fischer, Jacob, 2013, UMSL, p. 87 �
(Spector, 2006). Although these precautions were taken for several analyses, some
hypothesis tests were still at risk of this bias. For example, the results of Hypothesis 13
showed that recruiter informativeness was correlated with post-hire attitudes. This was
only the case when using new hire ratings and new hires completed measures of recruiter
informativeness and post-hire outcomes at the same time.
The lack of agreement in ratings of recruiter characteristics across rating sources is
another limitation. The low correlations across sources may be one reason for the
variability in results across sources. Across sources, ratings on recruiter characteristics
were consistently unrelated. Hiring manager and new hire ratings showed greater
agreement but were still only weakly correlated on conscientiousness and extraversion.
Only in the case of extraversion was the correlation significant between hiring managers
and new hires (see Table 9). The lack of agreement could be due to a number of reasons.
One reason could be that recruiters may have inflated their self-ratings if they thought
that the ratings would be used for decision-making purposes. Average recruiter self-
ratings were near or higher than 5.0 on a 7-point scale (see Table 8). However, it was
clearly communicated that ratings were for research purposes only.
Another reason could have been the frame-of-reference that each rating source held.
Schmit, Ryan, Stierwalt, and Powell (1995) showed that frame-of-reference can moderate
the criterion-related validity of personality measures, with work specific contexts having
greater validity. Recruiters were asked to make ratings as they see themselves relative to
others. Instructions did not specify a work context whereas hiring managers and new
hires were asked to make ratings based on their interaction with the recruiter at work.
Fischer, Jacob, 2013, UMSL, p. 88 �
Ratings may have been more consistent if the frame-of-reference was similar across
sources.
It could also be that new hires may have inflated their ratings due to their satisfaction
with being hired. Results may have been different if all applicants were asked to provide
ratings on recruiters before a hiring decision was made. It could also be that only hiring
managers and new hires with positive experiences responded to the surveys. One hint that
this might be the case is that the time to fill position was significantly faster for new hires
completing the survey than for those not completing the survey (see Table 5). It is likely
that those making it through the selection process faster had more positive reactions than
those who took longer to get through the selection process. The positive reactions may
have merged into positive perceptions of the recruiter.
Another general limitation is that for several hypothesis tests, the assumption of
independence was violated because an assign down approach was taken when dealing
with variables collected at or aggregated up to the recruiter level. The approach,
especially utilized in testing Hypotheses 16-20, creates potentially downwardly biased
standard errors and makes it easier to find significance (Maas & Hox, 2001). However,
the assign down approach was the best method available given the low number of
recruiters and the fact that the organization used an anonymous survey that could not be
matched to the new hire or hiring manager.
Additionally, range restriction on the predictors and criteria could have played a role
in the non-significant correlations. For example, none of the predictors had significant
correlations with offer acceptance rate or six month retention. These variables had very
little variability: 95% of applicants accepted offers and 92% of new hires were retained
Fischer, Jacob, 2013, UMSL, p. 89 �
during the first six months. As mentioned earlier, predictors could also have suffered
from range restriction in that the general population of recruiters may already possess
some of the characteristics given the nature of the job and the hiring process likely
included aspects of those characteristics.
The lack of data available from hiring managers and rejected candidates is also a
limitation. It was not possible to gather extensive information regarding hiring managers’
perspectives on their interactions with recruiters or applicants. For example, there was no
measure of prior experience between the hiring managers and recruiters. It could be that a
hiring manager’s comfort and familiarity with the recruiter moderated some of the
relationships between recruitment activities and acceptance of hiring recommendations.
Additionally, this study was limited to measuring pre-hire outcomes for only those
applicants that were hired. By incorporating all applicants, the relationship between
recruiter characteristics and additional pre-hire outcomes could be better established. For
example, this study was unable to draw conclusions about how recruiter characteristics
relate to applicant dropout rates. By excluding rejected applicants it was not possible to
investigate the conditions in which offers were rejected and how recruiter characteristics
and activities may have influenced those decisions.
Finally, this study did not include measures of realism or anxiety. These two concepts
formed the rationale for why informativeness and personableness are important recruiter
characteristics. However, the study results were limited by not including actual measures
of these concepts. By including the measures, the study could have better assessed the
impact of recruitment activities on pre- and post-hire outcomes. It could have also tested
whether informativeness and personableness are related to applicant insight, perceptions
Fischer, Jacob, 2013, UMSL, p. 90 �
of realism, and reduced anxiety in the selection process. Including measures of realism
and anxiety would have been especially beneficial if rejected applicants were included.
Even with these limitations the opportunity to investigate the recruiter’s connection to
pre-hire outcomes (e.g., time to fill), and post-hire outcomes (e.g., job satisfaction) is
noteworthy. These outcomes are very important to organizations and have rarely been
included in studies of recruitment (Lievens & Chapman, 2009; Saks, 2005). Additional
research that addresses some of these limitations would be beneficial.
Practical Implications, Future Research, and Conclusion
Overall, results point to conscientiousness as the characteristic with the most
consistent relationship to outcomes and the one with the most practical benefits to
organizations. The generally positive findings for conscientiousness support the idea that
conscientious recruiters are well suited to guide hiring managers and candidates through
the selection process and contribute to the major goals of the recruitment process.
Contributions to the organization by focusing on recruiter conscientiousness may include
better documentation on applicant qualifications, lower time to fill position, and
influencing hiring managers to accept a hiring recommendation. Informativeness and
personableness also showed positive results but they were not as consistent or strong.
One practical implication is for organizations to hire recruiters based on
characteristics included in this study. This may enable recruiting departments to be more
effective in achieving recruitment objectives. Of course, recruitment objectives may
determine which characteristic is most important for the situation. For example, if the
objective is to create a better process for candidates and hiring managers, informativeness
or personableness may be the focus of the selection efforts. If the objective is to reduce
Fischer, Jacob, 2013, UMSL, p. 91 �
time to fill or increase the quality of documentation on candidate qualifications (i.e.,
notes) then conscientiousness may be the best option.
In addition to employee selection, organizations could create training programs that
contribute to the attainment of recruitment objectives. Training based on behaviors
associated with recruiter characteristics could be the most beneficial. For example,
training recruiters to demonstrate personable behaviors could be an effective method for
potentially reducing the anxiety of applicants during the hiring process, which may help
applicant to have positive experience regardless of the hiring outcome. In addition,
training on note-taking strategies that focus on behavioral notes would be helpful.
Typically, recruiters are trained on interviewing techniques, but more specific training on
how to take and utilize behavioral based notes would be important, especially when the
acceptance of hiring recommendations is desired.
Furthermore, increasing accountability for recruiter behaviors associated with
positive outcomes will help organizations monitor progress toward objectives. For
example, holding recruiters accountable to take behavioral based notes and rewarding
them accordingly should provide opportunities for greater focus on note content that is
related to hiring managers accepting recruiter recommendations. Showing that note-
taking relates to hiring manager decisions is an important finding for recruiting
departments tasked with helping hiring managers make evidence-based decisions.
Ensuring recruiters take behavioral notes could be a relatively simple way to increase
their ability to communicate hiring recommendations and influence hiring managers.
In terms of future research, incorporating a multilevel approach to test hypotheses
would account for the nested nature of recruitment outcomes and avoid one of the
Fischer, Jacob, 2013, UMSL, p. 92 �
limitations in this study. In addition, methods that include additional controls regarding
common method variance and the timing of data collection would be important. One
possibility could be to gather hiring manager perceptions of recruiter characteristics
before an offer is accepted. This would reduce the possibility for a halo type bias in the
ratings.
Although results did not support hypotheses related to extraversion as an important
recruiter characteristic, future research should continue to investigate the importance of
extraversion for recruiter outcomes. Several methodological limitations could have
influenced these findings. Perhaps extraversion might be related to outcomes that are
more objective and sales oriented, such as the number of hires, the number of candidates
attending events, or the number of applicants submitting resumes at events. Given
extraversion’s connection to sales performance (Vinchur et al., 1998), this could be a
fruitful area to research. Extraversion could also be a characteristic that is more important
for applicant reactions earlier in the recruitment process. For example, extraversion may
be a strong characteristic for attracting applicants, which is an early phase of the
recruitment process. The timing of when extraversion is of most value should be studied.
Future research should also provide a more extensive examination into the
relationship between conscientiousness and note-taking. For example, it would be
interesting to understand which form of note-taking is most likely to occur with
conscientious recruiters and whether they would take notes if not prompted, which was
not the case in this study. Likewise, understanding how conscientiousness, note-taking,
and quality contact work together to support recruitment objectives would be helpful. For
example, how does note-taking relate to quality interactions with hiring managers
Fischer, Jacob, 2013, UMSL, p. 93 �
throughout the period of recruitment and how are behavioral notes best used to
communicate the quality of candidates? It could be that specific stories about past
behaviors and performance in similar roles are the most relevant and influential in hiring
manager decisions.
Additional focus on the hiring manager’s experience with the recruiter, applicants,
and recruitment objectives is also needed. Especially interesting would be the role of pre-
hire interactions between the hiring manager and applicant outside of the interview as
well as the hiring manager’s perception of the applicants recommended for interview by
the recruiter. Additionally, a hiring manager’s perception of the recruiter could change
over the course of the recruitment period. Future research could look into how those
changes might occur and what impact they might have on the recruitment process.
This study was limited to two of the Big 5, but a focus on other characteristics is an
additional avenue to investigate. Agreeableness, openness to experience, and neuroticism
may also have relationships with pre- or post-hire recruitment outcomes. Similarly,
examining the individual facets of conscientiousness or extraversion will help narrow the
focus to essential characteristics while excluding facets that are not as important. This
may be especially helpful in the case of extraversion, since most relationships with
outcomes in this study were not significant.
Additionally, including characteristics beyond personality traits would be an
important contribution. For example, cognitive ability is consistently shown to predict job
performance. Future research could investigate the relationship between recruiter
cognitive ability and pre- and post-hire outcomes. This would expand the understanding
Fischer, Jacob, 2013, UMSL, p. 94 �
of important recruiter characteristics and the depth of our understanding around the
importance and positive effects of cognitive ability as a critical characteristic.
This study contributes to the literature by providing some of the first tests of the
recruiter’s role with objective pre-hire outcomes and post-hire outcomes. Something that
has been called for by previous researchers (Lievens & Chapman, 2009). Incorporating
these variables common to the practice of human resource management provides
practical benefits to practitioners.
In conclusion, this study expands the importance of recruiter characteristics by
showing a connection to recruitment outcomes outside traditional pre-hire perceptions
and reactions by applicants. This study demonstrated that recruiter characteristics are
related to objective pre-hire outcomes and relate to behavior during selection activities.
With a renewed perspective on recruiter characteristics, organizations can focus on
additional ways to improve recruitment objectives, especially during the pre-hire stage.
Fischer, Jacob, 2013, UMSL, p. 95 �
References
Barber, A. E. (1998). Recruiting employees. Thousand Oaks: Sage Publications.
Barrick, M. R. & Mount, M. K. (1991). The big five personality dimensions and job performance: A meta-analysis. Personnel Psychology, 44, 1-26.
Barrick, M. R., Swider, B. W., & Stewart, G. L. (2010). Initial evaluations in the interview: Relationships with subsequent interviewer evaluations and employment offers. Journal of Applied Psychology, 95, 1163-1172.
Barrick, M. R. & Zimmerman, R. D. (2005). Reducing voluntary, avoidable turnover through selection. Journal of Applied Psychology, 90, 159-166.
Bickel, R. (2007). Multilevel analysis for applied research: It’s just regression! New York: The Guilford Press.
Bies, R.J. & Moag, J.S. (1986). Interactional justice: Communication criteria of fairness. Pp. 43-55 in Roy Lewicki (Ed.), Research on negotiation in organizations, vol. 1. Greenwich, CT: JAI Press.
Biesanz, J. C., Neuberg, S. L., Judice, T. N., & Smith, D. M. (1999). When interviewers desire accurate impressions: The effects of notetaking on the influence of expectations. Journal of Applied Social Psychology, 29, 2529-2549.
Boswell, W. R., Roehling, M. V., LePine, M. A., & Moynihan, L. M. (2003). Individual job choice decision and the impact of job attributes and recruitment practices: A longitudinal field study. Human Resource Management, 42, 23-37.
Braddy, P. W., Meade, A. W., & Kroustalis, C. M. (2006). Organizational recruitment website effects on viewers’ perceptions of organizational culture. Journal of Business and Psychology, 20, 525-543.
Breaugh, J. A. (2009). Employee recruitment: Current knowledge and important areas for future research. Human Resource Management Review, 18, 103-118.
Breaugh, J. A. (2012). Employee recruitment: Current knowledge and suggestions for future research. In N. Schmitt (Ed.) The Oxford Handbook of Personnel Assessment and Selection.
Breaugh, J. A., Macan, T. H. & Grambow, D. M. (2008). Employee recruitment: Current knowledge and directions for future research. In G. P. Hodgkinson & J. K. Ford (Eds.), International Review of Industrial and Organizational Psychology, vol. 23, (pp. 45-82), New York: John Wiley & Sons.
Fischer, Jacob, 2013, UMSL, p. 96 �
Breaugh, J. A. & Starke, M. (2000). Research on employee recruitment: So many studies, so many remaining questions. Journal of Management, 26, 405-434
Brown, R. D. & Hauenstein, N. M. A. (2005). Interrater agreement reconsidered: An alternative to rwg indices. Organizational Research Methods, 8, 165-184.
Burnett, J. R., Fan, C., Motowidlo, S. J., & DeGroot, T. (1998). Interview notes and validity. Personnel Psychology, 51, 963-983.
Cable, D. M. & Judge, T. A. (1996). Person-organization fit, job choice decisions, and organizational entry. Organizational Behavior and Human Decision Processes, 67, 294-311.
Cammann, C., Fichman, M., Jenkins, D., & Klesh, J. (1979). The Michigan Organizational Assessment Questionnaire. Unpublished manuscript, University of Michigan, Ann Arbor.
Campion, M. A., Palmer, D. K., & Campion, J. E. (1997). A review of structure in the selection interview. Personnel Psychology, 50, 655-702.
Carless, S. A. & Imber, A. (2007). The influence of perceived interviewer and job and organizational characteristics on applicant attraction and job choice intentions: The role of applicant anxiety. International Journal of Selection and Assessment, 15, 359-371.
Chapman, D. S., Uggerlev, K. L., Carroll, S. A., Piasentin, K. A., & Jones, D. A. (2005). Applicant attraction to organizations and job choice: A meta-analytic review of the correlates of recruiting outcomes. Journal of Applied Psychology, 90, 928-944.
Colquitt, J. A., Conlon, D. E., Wesson, M. J., Porter, C. O. L. H., & Ng, K. Y. (2001). Justice at the millennium: A meta-analytic review of 25 years of organizational justice research. Journal of Applied Psychology, 86, 425-445.
Connerley, M. L. (1997). The influence of training on perceptions of recruiters’ interpersonal skills and effectiveness. Journal of Occupational and Organizational Psychology, 70, 259-272.
Connerley, M. L. & Rynes, S. L. (1997). The influence of recruiter characteristics and organizational recruitment support on perceived recruiter effectiveness: Views from applicants and recruiters. Human Relations, 50, 1563-1586.
Costa, P. T., Jr., & McCrae, R. R. (1992). Normal personality assessment in clinical practice: The NEO Personality Inventory. Psychological Assessment, 4, 5-13.
Dineen, B. R. & Soltis, S. M. (2010). Recruitment: A review of research and emerging directions. In S. Zedeck (Ed.) APA Handbook of Industrial and Organizational
Fischer, Jacob, 2013, UMSL, p. 97 �
Psychology, vol. 2, (pp. 43-66). Washington, D.C., American Psychological Association.
Fritszche, B. A. & Brannick, M. T. (2002). The importance of representative design in judgment tasks: The case of resume screening. Journal of Occupational and Organizational Psychology, 75, 163-169.
Gilliland, S. W. (1993). The perceived fairness of selection systems: An organizational justice perspective. Academy of Management Review, 18, 694-734.
Goldberg, C. B. (2003). Applicant reactions to the employment interview: A look at demographic similarity and social identity theory. Journal of Business Research, 56, 561-571.
Goldberg, L. R., Johnson, J. A., Eber, H. W., Hogan, R., Ashton, M. A., Cloninger, C. R., & Gough, H. G. (2006). The international personality item pool and the future of public-domain personality measures. Journal of Research in Personality, 40, 84-96.
Goltz, S. M. & Giannantino, C. M. (1995). Recruiter friendliness and attraction to the job: The mediating role of inferences about the organization. Journal of Vocational Behavior, 46, 109-118.
Greenberg, J. (1990). Organizational justice: Yesterday, today, and tomorrow. Journal of Management, 16, 399-432.
Hakel, M. D. & Shuh, A. J. (1971). Job applicant attributes judged across seven diverse occupations. Personnel Psychology, 24, 449-455.
Harris, M. M. & Fink, L. S. (1987). A field study of applicant reactions to employment opportunities: Does the recruiter make a difference? Personnel Psychology, 40, 765-784.
Hausknecht, J. P., Day, D. V., & Thomas, S. C. (2004). Applicant reactions to selection procedures: An updated model and meta-analysis. Personnel Psychology, 57, 639-683.
Highhouse, S. (2008). Stubborn reliance on intuition and subjectivity in employee selection. Industrial and Organizational Psychology, 1, 333-342.
Hofmann, D. A. (2002). Issues in multilevel research: Theory development, measurement, and analysis. In S. G. Rogelberg (Ed.), Handbook of Research Methods in Industrial and Organizational Psychology (pp. 247-274). Blackwell Publishing.
Hough, L. M. & Furnham, A. (2003). Use of personality variables in work settings. In W. Borman, D. Ilgen, and R. Klimoski (Vol. Eds.), Handbook of psychology: Vol. 12. Industrial and organizational psychology (pp. 131-169). New York: Wiley.
Fischer, Jacob, 2013, UMSL, p. 98 �
Hox, J. J. (2002). Multilevel analysis: Techniques and applications. Mahweh, NJ: Lawrence Erlbaum Associates.
Huffcutt, A. I. & Arthur, W., Jr., (1994). Hunter and Hunter (1984) revisited: Interview validity for entry level jobs. Journal of Applied Psychology, 79, 184-190.
Huffcutt, A. I. & Woehr, D. J. (1999). Further analysis of employment interview validity. A quantitative analysis of interviewer-related structuring methods. Journal of Organizational Behavior, 20, 549-560.
James, L. R. & Williams, L. J. (2000). The cross level operator in regression, ANCOVA, and contextual analysis. In K. J. Klein & S. W. J. Kozlowski (Eds.), Multilevel theory, research, and methods in organizations (pp. 382-424). San Francisco: Jossey-Bass.
Johnson, E. C., Kristof-Brown, A. L., Van Vianen, A. E. M., De Pater, I. E., & Klein, M. (2003). Expatriate social ties: Personality antecedents and consequences for adjustment. International Journal of Selection and Assessment, 11, 277-288.
Jones, E., Brown, S. P., Zoltner, A. A., & Weitz, B. A. (2005). The changing environment of selling and sales management. Journal of Personal Selling and Sales Management, 25, 105-111.
Kristof, A. L. (1996). Person-organization fit: An integrative review of its conceptualizations, measurement, and implications. Personnel Psychology, 49, 1-49.
Kristof-Brown, A. L. (2000). Perceived applicant fit: Distinguishing between recruiters’ perception of person-job and person-organization fit. Personnel Psychology, 53, 643-671.
Klehe, U. & Latham, G. (2005). The predictive and incremental validity of the situational and patterned behavior description interviews for teamplaying behavior. International Journal of Assessment and Selection, 13, 108-115.
Landy, F. J. & Conte, J. M. (2007). Work in the 21st century: An introduction to industrial and organizational psychology. Wiley.
Lievens, F. & Chapman, D. S. (2009). Recruitment and selection. In A. Wilkerson, T. Redman, S. Snell, N. Bacon (Eds.), The SAGE Handbook of Human Resource Management (pp. 133-154). London: SAGE.
Petty, R. E. & Cacioppo, J. T., & Goldman, R. (1981). Personal involvement as a determinant of argument-based persuasion. Journal of Personality and Social Psychology, 41, 847-855.
Fischer, Jacob, 2013, UMSL, p. 99 �
Phillips, J. M. (1998). Effects of realistic job previews on multiple organizational outcomes: A meta-analysis. Academy of Management Journal, 41, 673-690.
Ployhart, R. E., Schneider, B., & Schmitt, N. (2006). Staffing organizations: Contemporary practice and research. Mahwah, NJ: Lawrence Erlbaum Associates.
Maas, C. J. M. & Hox, J. J. (2001). Robustness of multilevel parameter estimates against non-normality and small sample sizes. In J. Blasius, J. Hox, E. de Leeuw, & P. Schmidt (Eds.), Social science methodology in the new millennium. Proceedings of the Fifth International conference on logic and methodology. Opladen, FRG: Leske + Budrich.
Macan,T. H. & Dipboye, R. L. (1990). The relationship of interviewers’ preinterview impressions to selection and recruitment outcomes. Personnel Psychology, 43, 745-768.
Macan, T. H., Avedon, M. J., Paese, M., & Smith, D. E. (1994). The effects of applicants’ reactions to cognitive ability tests and an assessment center. Personnel Psychology, 47, 715-738.
Mael, F. A. (1991). A conceptual rationale for the domain and attributes of biodata items. Personnel Psychology, 44, 763-792.
MacKinnon, D. P., Fairchild, A. J., & Fritz, M. S. (2007). Mediation analysis. Annual Review of Psychology, 58, 593-614.
McAllister, D. J. (1995). Affect- and cognition-based trust as foundations for interpersonal cooperation in organizations. Academy of Management Journal, 38, 24-59.
McCarthy, J. M. & Goffin, R. (2004). Measuring job interview anxiety: Beyond weak knees and sweaty palms. Personnel Psychology, 57, 607-637.
McCarthy, J. M. & Goffin, R. (2005). Selection test anxiety: Exploring tension and fear of failure across the sexes in simulated selection scenarios. International Journal of Selection and Assessment, 13, 282-295.
McKinney, A.P., Carlson, K.D.; & Mecham, R.L. III. 2003. Recruiters’ use of GPA in initial screening decisions: Higher GPAs don’t always make the cut. Personnel Psychology, 56, 823-845.
Middendorf, C. H. & Macan, T. H. (2002). Note-taking in the employment interview: Effects on recall and judgments. Journal of Applied Psychology, 87, 293-303.
Moon, H. (2001). The two faces of conscientiousness: Duty and achievement striving in escalation of commitment dilemmas. Journal of Applied Psychology, 86, 533-540
Fischer, Jacob, 2013, UMSL, p. 100 �
Mount, M. K., Barrick, M. R., & Stewart, G. L. (1998). Five-factor model of personality and performance in jobs involving interpersonal interaction. Human Performance, 11, 145-165.
Mumford, M. D. & Owens, W. A. (1987). Methodology review: Principles, procedures, and findings in application of background data measures. Applied Psychological Measurement, 11, 1-31.
Mumford, M. D. & Stokes, G. S. (1991). Development determinants of individual action: Theory and practice in the application of background data. In M. D. Dunnette (Ed.), The Handbook of Industrial and Organizational Psychology (2nd Ed., pp. 1-78). Palo Alto, CA: Consulting Psychologists Press.
Murphy, K. R. (1986). When your top choice turns you down: Effect of rejected offers on the utility of selection tests. Psychological Bulletin, 99, 133-138.
Quinones, M. A., Ford, J. K., & Teachout, M. S. (1995). The relationship between work experience and job performance: A conceptual and meta-analytic review. Personnel Psychology, 48, 887-910.
Resick, C. J., Baltes, B. B., & Shantz, C. W. (2007). Person-organization fit and work-related attitudes and decisions: Examining interactive effects with job fit and conscientiousness. Journal of Applied Psychology, 92, 1446-1455.
Rousseau, D. M., Sitkin, S. B., Burt, R. S., & Camerer, C. (1998). Not so different after all: A cross-discipline view of trust. Academy of Management Review, 23, 393-404.
Rynes, S. L. (1991). Recruitment, job choice, and post-hire consequences: A call for new research directions. In M. D. Dunnette & L. M. Hough (Eds.), Handbook of industrial and organizational psychology (2nd ed., Vol. 2, pp. 399-444). Palo Alto, CA: Consulting Psychologists Press, Inc.
Rynes, S. L. & Cable, (2003). Recruitment research in the twenty first-century. In W. C. Borman & D. M. Ilgen (Eds.), Handbook of industrial organizational psychology (Vol 12, pp. 55-76). New York: Wiley.
Rynes, S. L. & Gerhart, B. (1990). Interviewer assessments of applicant “fit”: An exploratory investigation. Personnel Psychology, 43, 13-35.
Rynes, S. L., Bretz, Jr., R. D., & Gerhart, B. (1991). The importance of recruitment in job choice: A different way of looking. Personnel Psychology, 44, 487-521.
Saks, A. (2005). The impracticality of recruitment research. In A. Evers, N. Anderson, & O. Voskuijl (Eds.), Handbook of Personnel Selection (pp. 47-72). Malden, MA: Blackwell.
Fischer, Jacob, 2013, UMSL, p. 101 �
Saks, A. M. & Ashforth, B. E. (1997). Organizational socialization: Making sense of the past and present as a prologue for the future. Journal of Vocational Behavior, 51, 234-274.
Schmidt, F. L. & Hunter, J. E. (1998). The validity and utility of selection methods in personnel psychology: Practical and theoretical implications of 85 years of research findings. Psychological Bulletin, 124, 262-274.
Schmit, M. J., Ryan, A. M., Stierwalt, S. L., & Powell, A. B. (1995). Frame-of-reference effects on personality scale scores and criterion-related validity. Journal of Applied Psychology, 80, 607-620.
Seibert, M., Williams, K., & Raymark, P. H. (2010, April). Resume screening: A policy-capturing study of recruiter judgments. Paper presented at the 25th Annual Conference of the Society for Industrial Organizational Psychology, Atlanta, GA.
Sobel, M. E. (1986). Some new results on indirect effects and their standard errors in covariance structure models. In N. Tuma (Ed.), Sociological Methodology 1986 (pp. 159-186). Washington, DC: American Sociological Association.
Spector, P. E. (2006). Method variance in organizational research. Organizational Research Methods, 9, 221-232.
Spence, A. M. (1974). Market signaling. Cambrindge, MA: Harvard University Press.
Stevens, C. K. (1998). Antecedents of interview interactions, interviewers’ ratings, and applicants’ reactions. Personnel Psychology, 51, 55-85.
Tabachnik, B. G. & Fidell, L. S. (2001). Using multivariate statistics. Boston: Allyn and Bacan.
Van Hoye, G. & Lievens, F. (2009). Tapping the grapevine: A closer look at word-of-mouth as a recruitment source. Journal of Applied Psychology, 94, 341-352.
Vinchur, A. J., Schippmann, J. S., Switzer III, F. S., & Roth, R. L. (1998). A meta-analytic review of predictors of job performance for salespeople. Journal of Applied Psychology, 83, 586-597.
Walker, H. J., Feild, H. S., Giles, W. F., & Bernerth, J. B. (2008). The interactive effects of job advertisement characteristics and applicant experience on reactions to recruitment messages. Journal of Occupational and Organizational Psychology, 81, 619-638.
Wanberg, C. D. & Kammeyer-Mueller, J. D. (2000). Predictors and outcomes of proactivity in the socialization process. Journal of Applied Psychology, 85, 373-385.
Fischer, Jacob, 2013, UMSL, p. 102 �
Wanous, J. P. & Hudy, M. J. (2001). Single-item reliability: A replication and extension. Organizational Research Methods, 4, 361-375.
Wanous, J. P., Poland, T. D., Premack, S. L., & Davis, K. S. (1992). The effects of met expectations on newcomer attitudes and behaviors: A review and meta-analysis. Journal of Applied Psychology, 77, 288-297.
Weitz, B. A. & Bradford, K. D. (1999). Personal selling and sales management: A relationship marketing perspective. Journal of the Academy of Marketing Science, 27, 241-254.
�
Fischer, Jacob, 2013, UMSL, p. 103 �
Appendix A: Organizational Context
This study takes place at a large financial services firm. The firm specializes in
providing investment advice to individual investors and has over 10,000 branch offices
across North America. Each branch typically has one financial advisor and one branch
office administrator (BOA).
In each branch office, the financial advisor is responsible for generating new clients,
assessing financial goals and needs, and making financial recommendations. The
financial advisor is also the manager of the BOA. The BOA serves as the first point of
contact at the branch. The BOA is responsible for greeting clients, preparing the financial
advisor for his/her client meetings, and performing administrative tasks relevant to the
various financial decisions made by the client.
The administrative process for hiring a BOA is managed by BOA recruiters (referred
to as recruiter in this study) at the headquarters. BOA recruiters collaborate with financial
advisors (referred to as hiring managers in this study) who have open BOA positions.
BOA recruiters post job ads, attend career fairs, and screen candidates. Financial advisors
are also active in recruiting in their local areas but these activities are mainly from
networking or word of mouth. In terms of selection, recruiters review resumes and
conduct initial phone screen interviews. There are no selection tests as part of the hiring
process. Candidates passing the resume and interview hurdles are referred to the financial
advisor for a face-to-face interview. The face-to-face interview is the final step in the
process. A candidate is extended an offer of employment at the financial advisor’s
discretion. Recruiters do not make final hiring decisions but are responsible for
communicating the decision to the applicant and negotiating salary where applicable.�
How well did you understand this branch’s local needs? (Circle the best description)
a) Very little understanding b) Somewhat understood needs c) Moderately understood needs d) Clearly understood needs e) Very clearly understood needs
How many candidates did you send to the FA to interview? _________ How many candidates did you make offers to (including this candidate)? _________ Did the FA have a pre-selected candidate you were required to hire? YES / NO Describe the FA’s reaction to your top choice recommendation? (Circle the best description)
Discussed Candidates Did Not Discuss Candidates a) Rejected my recommendation and went with own
choice a) Hired who I would have hired (my top choice)
b) Accepted my recommendation with some reservations
b) All candidates were equally qualified (I did not have a top choice)
c) Whole heartedly accepted my recommendation To what extent were you involved with the FA as he/she prepared for the branch interview? (Circle the best description)
a) Left it to the FA to prepare/FA did not need any help preparing b) Explained where to locate helpful materials on JonesLink c) Described interview best practices d) Ensured FA had completed branch interview training modules e) Practiced interviewing skills with the FA
As of today, how many times have you interacted with the CANDIDATE (include all interactions)? _____
Rate the quality of those interactions (Circle the best description)
Very low quality Low quality Average quality High quality Very high quality As of today, how many times have you interacted with the FA (include all interactions)? _____
Rate the quality of those interactions (Circle the best description)
Very low quality Low quality Average quality High quality Very high quality How successful do you think this new BOA will be as a member of this branch team? (Circle the best description)
a) Will succeed with great difficulty b) Will need significant help to be successful c) Will meet expectations d) Will exceed expectations e) Will be outstanding
�
Fischer, Jacob, 2013, UMSL, p. 112 �
Appendix D: New Hire Survey 1 (sent by organization)
0 = strongly disagree, 1-9 (no anchors), 10 = strongly agree, No Experience Please indicate how much you agree or disagree with the following statements regarding the Interview Process. My recruiter was knowledgeable of the position. My questions were addressed in a timely manner. I was satisfied with the overall responsiveness of my recruiter. I was satisfied with the overall service provided by my recruiter. I was treated professionally. Please indicate how much you agree or disagree with the following statements regarding the Hiring Process. I was given a confirmed start date. I was well informed during each step of the hiring process. My recruiter discussed the first day On-Boarding Checklist (e.g., welcome call, system access, etc.) with me. The information provided to me by my recruiter, the website and/or Financial Advisor provided me with a realistic job preview. I knew what the job would require when I accepted an offer of employment. I feel the hiring process was fair. I could really communicate my skills and abilities during the hiring process. Overall, I am satisfied with the hiring process. Please indicate how much you agree or disagree with the following statement: In view of my 1st month of experience at [the organization], I would refer a friend or relative.
Fischer, Jacob, 2013, UMSL, p. 113 �
Appendix E: New Hire Survey 2 (sent by researcher)
Appendix F: Hiring Manager Survey 1 (sent by organization)
�
0 = strongly disagree, 1-9 (no anchors), 10 = strongly agree, No Experience How much do you agree or disagree with the following statements about the service provided by your recruiter? Overall, I am satisfied with the service provided by your recruiter. Overall, I am satisfied with the service provided by my recruiter. I clearly understood the recruiting process. Your recruiter clearly discussed the recruiting and hiring process with you. Your recruiter clearly discussed candidate sourcing strategies with you. Your recruiter effectively managed the recruiting process. Your recruiter proactively kept you updated on the status of the recruiting process. I felt prepared to make an effective selection decision. How much do you agree or disagree with the following statements about the recruiter's knowledge and understanding of the position you were filling? Overall, your recruiter was knowledgeable and understood the position you were filling. Your recruiter demonstrated an understanding of the position and/or branch functions. Your recruiter demonstrated an understanding of the skills and requirements necessary for the position. How much do you agree or disagree with the following statements about the quality of the candidates reviewed/interviewed? Overall, the candidates demonstrated the competencies needed to perform the role. Your recruiter provided an appropriate number of candidates to interview and/or review. Your recruiter provided a candidate pool that reflected the diversity of your community.�
Fischer, Jacob, 2013, UMSL, p. 118 �
Appendix G: Hiring Manager Survey 2 (sent by researcher)
Conscientiousness (hiring manager and new hire rated) Be prepared for most things. Pay attention to details. Get chores done right away. Carry out his/her plans. Make plans and stick to them
Conscientiousness (recruiter self-rated)
Am always prepared. Pay attention to details. Get chores done right away. Carry out my plans. Make plans and stick to them. Waste my time. (R) Find it difficult to get down to work. (R) Do just enough work to get by. (R) Don't see things through. (R) Shirk my duties. (R)
Demands-abilities fit
I believe my skills and abilities match those required by the job My job performance is hurt by a lack of expertise on the job (R) My knowledge, skills and abilities match the requirements of the job I possess the skills and abilities to perform this job
Extraversion (hiring manager and new hire rated)
Feel comfortable around people. Make friends easily. Be skilled in handling social situations. Be the life of the party. Know how to captivate people.
Extraversion (recruiter self-rated)
Feel comfortable around people. Make friends easily. Am skilled in handling social situations. Am the life of the party. Know how to captivate people. Have little to say. (R) Keep in the background. (R) Would describe my experiences as somewhat dull. (R) Don't like to draw attention to myself. (R) Don't talk a lot. (R)
Fischer, Jacob, 2013, UMSL, p. 123 �
Informativeness (hiring manager rated)
Spoke about each applicant in great detail Explained recruiting procedures and timelines Talked about the strengths and weaknesses of each candidate Discussed the limitations of an applicant even when he or she was my top choice
Informativeness (new hire rated)
Talked about options for career advancement Provided information about the financial advisor(s) at the branch Spoke about the job in great detail Gave a realistic view of [the organization] Described the kind of associate [the organization] is looking for Was informative about the working environment of the branch Was informative about what the job will be like
I talk about options for career advancement I provide information about the financial advisor(s) at the branch I speak about the job in great detail I give a realistic view of [the organization] I describe the kind of associate [the organization] is looking for I inform the candidate about the working environment of the branch I let the candidate know what the job will be like
I discuss the limitations of a candidate, even when he/she is the FA’s top choice I inform the hiring leader about what to expect in the hiring process I discuss candidates in detail with the FA I explain the strengths and weaknesses of candidates to the FA I explain my sourcing strategy with the FA I keep the FA updated when milestones are met in the hiring process I give the FA information on interviewing best practices
Job satisfaction
All in all, I am satisfied with my job. In general, I don’t like my job. (R) In general, I like working here
Needs-supplies fit
I feel that this job enables me to do the kind of work I want to do This job measures up to the kind of job I was seeking This job is a good match for me This job fulfills my needs
Fischer, Jacob, 2013, UMSL, p. 124 �
Personableness (hiring manager rated) Showed interest in me Asked me questions to understand my feelings and concerns Cooperated with my schedule At times, seemed frustrated with me (R) Tried to get to know me Was friendly
Personableness (new hire rated)
Tried to get to know me Asked questions to understand my feelings and concerns Cooperated with my schedule At times, seemed frustrated with me (R) Showed interest in me Was friendly
I try to get to know the candidates I work with I ask questions to understand the feelings and concerns of candidates When talking with candidates, I can become frustrated with them (R) I show interest in each candidate I am friendly with candidates
�
Personableness toward hiring manager (recruiter self-rated) I try to get to know the FAs I work with I ask questions to understand the feelings and concerns of FAs I cooperate with the FA’s schedule When talking with FAs, I can become frustrated with them (R) I show interest in each FA I am friendly with the FAs I work with
Person-organization fit
I feel my values “match” or fit this organization and the current employees in this organization I think the values and personality of this organization reflect my own values and personality The values of this organization are similar to my own values My values match those of current employees in this organization I feel my personality matches the “personality” or image of this organization
Fischer, Jacob, 2013, UMSL, p. 125 �
Satisfaction with the hiring process (hiring manager rated) Overall, the candidates demonstrated the competencies needed to perform the role. Your recruiter provided an appropriate number of candidates to interview and/or review. Your recruiter provided a candidate pool that reflected the diversity of your community. I clearly understood the recruiting process. I felt prepared to make an effective selection decision.
Satisfaction with the hiring process (new hire rated)
I was well informed during each step of the hiring process. The information provided to me by my recruiter, the website and/or Financial Advisor provided me with a realistic job preview. I knew what the job would require when I accepted an offer of employment. I feel the hiring process was fair. I could really communicate my skills and abilities during the hiring process. Overall, I am satisfied with the hiring process.
Fischer, Jacob, 2013, UMSL, p. 126�
�
Appendix I: Notes & Resume Coding Sheet
ID #___________ �
Dimension Description 5 ��
6��
5 ��
����
5 &�
7 �
5 '�
���
5 (�
�� �
5 )�
��0�
5 *�
��� �
��� � ����
Behavioral 1 (past/specific)
What the applicant did (e.g., volunteered for a task, corrected a mistake)
� � � � � � � �
Behavioral 2 (general)
What the applicant would do/used to do (e.g., used to call customers, would reach out to others)
� � � � � � � �
Contextual The environment in which the applicant behaved (e.g., research project, upset customer, call customers)
Procedural The applicant's behavior during the interview (e.g., speaks too soft, couldn't think of an answer)
� � � � � � � �
Judgmental The interviewer's assessment of the applicant (e.g., good leadership, high drive, OK)
� � � � � � � �
No Notes � � � � � � � �
Ratings � � � � � � �
�
How detailed/extensive are the interview notes on this candidate? Very little detail Moderate Extensive detail
1 2 3 4 5 How similar is the applicant's previous job experience to this position?
Not at all similar Somewhat similar Almost identical 1 2 3 4 5
Round to the nearest whole year:
Years of Similar Job Experience Years of Total Job Experience
How related are previous accomplishments (e.g., education, awards, clubs) to this position?
Not at all related Somewhat similar Extremely related 1 2 3 4 5
Fischer, Jacob, 2013, UMSL, p. 127�
�
Appendix J: List of Removed Mediation Hypotheses with Results
The hiring manager’s degree of acceptance of the recruiter’s hiring recommendation will mediate the relationships between recruiter extraversion and a new hire’s perception of (a) fit and (b) satisfaction. The hiring manager’s degree of acceptance of the recruiter’s hiring recommendation will mediate the relationship between recruiter extraversion and the supervisor’s rating of the new hire’s job performance. The hiring manager’s degree of acceptance of the recruiter’s hiring recommendation will mediate the relationship between recruiter extraversion and the retention of a new hire.
The results these first three hypotheses are shown in Appendix J: Tables 1-3. They were not supported.
The hiring manager’s degree of acceptance of the recruiter’s hiring recommendation will mediate the relationships between recruiter conscientiousness and the new hire’s perception of (a) fit and (b) satisfaction. The hiring manager’s degree of acceptance of the recruiter’s hiring recommendation will mediate the relationship between recruiter conscientiousness and the supervisor’s rating of the new hire’s job performance. The hiring manager’s degree of acceptance of the recruiter’s hiring recommendation will mediate the relationship between recruiter conscientiousness and the retention of a new hire.
The results these last three hypotheses are shown in Appendix J: Tables 4-6.
They were also not supported. �
Fischer, Jacob, 2013, UMSL, p. 128 �
Appendix J: Table A Accept recommendation as mediator between extraversion and post-hire outcomes (recruiter extraversion ratings from hiring managers). � z/t-value p-value 95% LL 95% UL
ab (indirect effect) .04 .48 .63 -.14 .22 NOTE: For 6 Month Retention, values in the t-values column are z-scores. *N = 34, **N = 45, ***N = 56; significance test for ab is based on a z-value and not the t-value.
Fischer, Jacob, 2013, UMSL, p. 129 �
Appendix J: Table B Accept recommendation as mediator between extraversion and post-hire outcomes (recruiter extraversion ratings from candidates). � z/t-value p-value 95% LL 95% UL
ab (indirect effect) .01 .19 .85 -.11 .14 NOTE: For 6 Month Retention, values in the t-values column are z-scores. *N = 103, **N = 92; significance test for ab is based on a z-value and not the t-value.
Fischer, Jacob, 2013, UMSL, p. 130 �
Appendix J: Table C Accept recommendation as mediator between extraversion and post-hire outcomes (recruiter extraversion ratings from recruiters). � z/t-value p-value 95% LL 95% UL
ab (indirect effect) -.02 -.50 .62 -.10 .06 NOTE: For 6 Month Retention, values in the t-values column are z-scores. *N = 94, **N = 161, ***N = 196; significance test for ab is based on a z-value and not the t-value.�
Fischer, Jacob, 2013, UMSL, p. 131 �
Appendix J: Table D Accept recommendation as mediator between conscientiousness and post-hire outcomes (recruiter conscientiousness ratings from hiring managers). � z/t-value p-value 95% LL 95% UL
ab (indirect effect) .06 .57 .57 -.14 .25 NOTE: For 6 Month Retention, values in the t-values column are z-scores. *N = 34, **N = 45, ***N = 56; significance test for ab is based on a z-value and not the t-value.
Fischer, Jacob, 2013, UMSL, p. 132 �
Appendix J: Table E Accept recommendation as mediator between conscientiousness and post-hire outcomes (recruiter conscientiousness ratings from candidates). � z/t-value p-value 95% LL 95% UL
ab (indirect effect) .04 .53 .59 -.12 .21 NOTE: For 6 Month Retention, values in the t-values column are z-scores. *N = 103, **N = 92; significance test for ab is based on a z-value and not the t-value.
Fischer, Jacob, 2013, UMSL, p. 133 �
Appendix J: Table F Accept recommendation as mediator between conscientiousness and post-hire outcomes (recruiter conscientiousness ratings from recruiters). � z/t-value p-value 95% LL 95% UL
ab (indirect effect) .27 1.42 .16 -.10 .65 NOTE: For 6 Month Retention, values in the t-values column are z-scores. *N = 94, **N = 161, ***N = 196; significance test for ab is based on a z-value and not the t-value.
Fischer, Jacob, 2013, UMSL, p. 134 �
Tables
���������������������������������������� �������������������14 This table was updated since the proposal to reflect additional variables not included in the previous version.
Table 114 Variable measurement source, linkage, and type
Post-Hire Outcomes 12 Satisfaction with hiring process (anonymous) Hiring mgr
New hire 1st Level 1st Level
13 Job satisfaction New hire 1st Level 14 P-O fit New hire 1st Level 15 P-J fit New hire 1st Level 16 Performance Hiring mgr. 1st Level 17 Retention Internal records 1st Level
Table 3 Rater agreement interview note and resumes coding. Average rwg Average awg Inter-rater r Quality Notes .83 .98 .77 Similar job exp (years) .96 1.00 .80 Similar job exp (rating) .88 .98 .83 Similar non-job related exp (rating) .88 .99 .73 Total experience (years) .97 .99 .94
Fischer, Jacob, 2013, UMSL, p. 137�
�
Table 4 ICC values for dependent variables.
Variable ICC Variable ICC Performance (6 months) -.01 Similar Non-job Exp (rating) .01 Time to fill position (days) .02 Behavioral Notes .20 Accept Recommendation .20 # of Note-taking Dimensions .58 Offer Acceptance Rate .02 Total Notes .68 # of Interactions with Candidate .46 Quality Notes .58 Quality of Candidate Interaction .41 DA Job Fit -.02 # of Interactions with HM .25 NS Job Fit .00 Quality of Interactions with HM .36 PO Fit -.01 Similar Job Exp (rating) .02 Job Satisfaction -.01 Similar Job Exp (years) .02
Fischer, Jacob, 2013, UMSL, p. 138 �
Table 5 Differences in missing data sources. t-value df d Internal Recruitment System Missing
Note: Variables 1-5 came from the hiring manager survey sent by the researcher (see Appendix G), Variable 6 came from the hiring manager survey sent by the organization (see Appendix F). Correlations are below the diagonal, pairwise sample sizes are above. Reliability estimates are in parentheses along the diagonal for selected variables. **p < .01, *p < .05, †p < .10 indicate levels of significance for two-tailed tests. �
� �
Fischer, Jacob, 2013, UMSL, p. 140 �
Table 7 Descriptive statistics and intercorrelations for variables completed by the new hire.
Note: Variables 1-8 came from the new hire survey sent by the researcher (see Appendix E), Variable 9 came from the new hire survey sent by the organization, (see Appendix D). Correlations are below the diagonal, pairwise sample sizes are above. Reliability estimates are in parentheses along the diagonal for selected variables. **p < .01, *p < .05, †p < .10 indicate levels of significance for two-tailed tests. �
�
� �
Fischer, Jacob, 2013, UMSL, p. 141 �
Table 8 Descriptive statistics and intercorrelations for variables completed by recruiters
Note: Variables 1-2 and 9-12 came from the requisition survey completed for each applicant after accepting an offer (see Appendix C), Variables 3-8 are self-ratings from the recruiter survey, which were compiled at the recruiter or second level and assigned down to the new hire or first level for analysis (see Appendix B). Correlations are below the diagonal, pairwise sample sizes are above. Reliability estimates are in parentheses along the diagonal for selected variables. **p < .01, *p < .05, †p < .10 indicate levels of significance for two-tailed tests. � �
Fischer, Jacob, 2013, UMSL, p. 142�
�
Table 9 Means, standard deviations, and correlations for all study variables.
Above the diagonal are the pairwise sample sizes for each variable combination; HM = hiring manager; AP = applicant; NH = new hire, RC = recruiter; Reliability estimates are in parentheses along the diagonal for selected variables. **p < .01, *p < .05, †p < .10 indicate levels of significance for two-tailed tests. �
� �
Fischer, Jacob, 2013, UMSL, p. 143 �
Table 9 (continued) Means, standard deviations, and correlations for all study variables (continued).
Above the diagonal are the pairwise sample sizes for each variable combination; HM = hiring manager; AP = applicant; NH = new hire, RC = recruiter; Reliability estimates are in parentheses along the diagonal for selected variables. **p < .01, *p < .05, †p < .10 indicate levels of significance for two-tailed tests. � �
Above the diagonal are the pairwise sample sizes for each variable combination; HM = hiring manager, NH = new hire, RC = recruiter, AP = applicant; Reliability estimates are in parentheses along the diagonal for selected variables. **p < .01, *p < .05, †p < .10 indicate levels of significance for two-tailed tests. � �
Fischer, Jacob, 2013, UMSL, p. 145 �
Table 9 (continued) Means, standard deviations, and correlations for all study variables (continued).
Above the diagonal are the pairwise sample sizes for each variable combination; HM = hiring manager; NH = new hire; Reliability estimates are in parentheses along the diagonal for selected variables. **p < .01, *p < .05, †p < .10 indicate levels of significance for two-tailed tests. � �
Fischer, Jacob, 2013, UMSL, p. 146 �
Table 9 (continued) Means, standard deviations, and correlations for all study variables (continued).
Above the diagonal are the pairwise sample sizes for each variable combination; HM = hiring manager, NH = new hire, RC = recruiter, AP = applicant; Reliability estimates are in parentheses along the diagonal for selected variables. **p < .01, *p < .05, †p < .10 indicate levels of significance for two-tailed tests. �
� �
Fischer, Jacob, 2013, UMSL, p. 147 �
Table 9 (continued) Means, standard deviations, and correlations for all study variables (continued).
31 32 33 34 35 36 37 38 39 40 41 31 Time to fill position (days) 169 219 253 253 253 253 472 567 569 569 32 Accept Recommendation -.20* 216 105 105 105 105 176 214 216 216 33 Offer Acceptance Rate -.25** .15* 134 134 134 134 232 284 286 286 34 Demands-abilities Fit -.02 .11 .03 (.80) 342 342 342 306 341 342 342 35 Needs-supplies Fit -.12† .18† -.14 .56** (.90) 342 342 306 341 342 342 36 Person-organization Fit .03 .13 -.05 .53** .64** (.92) 342 306 341 342 342 37 Job Satisfaction -.10 .20* -.12 .51** .71** .64** (.74) 306 341 342 342 38 Performance rating (6 months) -.12** .07 -.12† .16** .11† .08 .16** -- 648 648 39 Retention (Y/N) -.06 .10 -.01 .13* .15** -.01 .13* -- 772 772 40 HM Process Satisfaction -.05 -.05 .03 .08 .06 -.01 .00 -.01 -.01 (.90) -- 41 NH Process Satisfaction -.03 -.14* .06 .04 .08 .01 .07 -.01 -.03 -- (.91) Above the diagonal are the pairwise sample sizes for each variable combination; HM = hiring manager; NH = new hire; Reliability estimates are in parentheses along the diagonal for selected variables. **p < .01, *p < .05, †p < .10 indicate levels of significance for two-tailed tests. �
Fischer, Jacob, 2013, UMSL, p. 148 �
Table 10 Summary of hypothesis tests by rating source.
Source of Characteristic Rating No Char. Rated
Hypothesis HM NH RC Conclusions
1 a. Extraversion � # HM contact b. Extraversion � quality of HM contact
4 a. Extraversion � # HM contact � accept recommend
b. Extraversion � quality of HM contact � accept recommend
.01 .01
-.03 .02
.02 .02
Unsupported (results depicted are indirect effects)
5 Conscientious � accept rec. .23* .09 .39** Partially supported; results changed when excluding outliers for hiring manager ratings (.11).
6 Conscientious � time to fill position -.25** .03 .08 Partially supported 7 a. Conscientious � # HM contact
b. Conscientious � quality of HM contact -.10 .10
.13†
.10 .11*
.48** Partially supported
8 a. Conscientious � # of notes b. Conscientious � quality of notes c. Conscientious � # note dimensions
.24*
.09
.22*
.13*
.14*
.06
.35**
.36**
.13**
Mostly supported; results changed when removing outliers for hiring manager ratings and # of notes (.17†) and # of dims (.18†)
9 a. Behavioral notes � Accept rec b. Quality of notes � Accept rec
.26**
.15† Partially supported
10 a. Conscientious � beh notes � Accept rec b. Conscientious � quality of notes � Accept rec
-.03 -.02
.01
.03 .05 -.05
Unsupported (results depicted are indirect effects)
NOTE: values in results column are correlations unless noted in the conclusions column; HM = hiring manager, NH = new hire, RC = recruiter; values in results column are from analyses in which outliers were not removed. Additional interpretation is provided in conclusions column when removing outliers changed the results. Conclusions match those reported in the text and are based on one-tailed tests. †p < .10, *p < .05, **p < .01 �
� �
Fischer, Jacob, 2013, UMSL, p. 149 �
Table 10 (continued) Summary of hypothesis tests by rating source.
Source of Characteristic Rating No Char. Rated
Hypothesis HM NH RC Conclusions
11 a. Accept rec. � D-A fit Accept rec. � N-S fit Accept rec. � P-O fit
b. Accept rec. � Job satisfaction c. Accept rec. � Performance d. Accept rec. � Retention
.11 .18* .13† .20* .07 .10†
Partially supported; all results became non-significant when excluding outliers
12 Informative � offer accept rate -.04 -.04 .10† Unsupported 13 a. Informative � D-A fit
Informative � N-S fit Informative � P-O fit
b. Informative � Job satisfaction c. Informative � Retention
.07
.09 -.16 .03 .05
.23**
.39**
.23**
.31**
.05
.00
.09
.08
.07 -.02
Partially supported
14 a. # AP contact � D-A fit # AP contact � N-S fit # AP contact � P-O fit
b. # AP contact � Job satisfaction c. # AP contact � Retention
d. Quality AP contact � D-A fit
Quality AP contact � N-S fit Quality AP contact � P-O fit
e. Quality AP contact � Job satisfaction f. Quality AP contact � Retention
-.08 -.08 -.13 -.07 -.09 .10 .06 .07 .09 .01
Unsupported
15 a. Informative + #/Quality AP contact � D-A fit Informative + #/Quality AP contact � N-S fit Informative + #/Quality AP contact � P-O fit
b. Informative + #/Quality AP contact � Job sat. c. Informative + #/Quality AP contact � Retention
.05
.01
.01
.00
.01
.02
.02
.03
.02
.04
.02
.01
.03
.01
.00
Unsupported (results depicted are �R2 values)
NOTE: values in results column are correlations unless noted in the conclusions column; HM = hiring manager, NH = new hire, RC = recruiter, AP = applicant; values in results column are from analyses in which outliers were not removed. Additional interpretation is provided in conclusions column when removing outliers changed the results. Conclusions match those reported in the text and are based on one-tailed tests. †p < .10, *p < .05, **p < .01� �
Fischer, Jacob, 2013, UMSL, p. 150 �
Table 10 (continued) Summary of hypothesis tests by rating source.
c. # AP contact � NH satisfaction w/process d. Quality AP contact � NH satisfaction w/process
-.05 -.01 .06 -.02
All unsupported
NOTE: values in results column are correlations unless noted in the conclusions column; HM = hiring manager, NH = new hire, RC = recruiter, AP = applicant; values in results column are from analyses in which outliers were not removed. Additional interpretation is provided in conclusions column when removing outliers changed the results. Conclusions match those reported in the text and are based on one-tailed tests. †p < .10, *p < .05, **p < .01
Fischer, Jacob, 2013, UMSL, p. 151 �
Table 10 (continued) Summary of hypothesis tests by rating source.
Source of Characteristic Rating No Char. Rated
Hypothesis HM NH RC Conclusions
21 a. Exp (years) � time to fill position Exp (rating) � time to fill position
Supported Unsupported Unsupported; results changed when removing outliers for D-A fit (.21**), P-O fit (.16*) and Performance (.04) Results changed when removing outliers for D-A fit (.17*) Unsupported Supported Unsupported Unsupported Unsupported Unsupported Unsupported
NOTE: values in results column are correlations unless noted in the conclusions column; HM = hiring manager, NH = new hire, RC = recruiter; values in results column are from analyses in which outliers were not removed. Additional interpretation is provided in conclusions column when removing outliers changed the results. Conclusions match those reported in the text and are based on one-tailed tests. †p < .10, *p < .05, **p < .01�
� �
Fischer, Jacob, 2013, UMSL, p. 152 �
Table 10 (continued) Summary of hypothesis tests by rating source.
Source of Characteristic Rating No Char. Rated
Hypothesis HM NH RC Conclusions
22 a. Exp (years) X informative � D-A fit Exp (years) X informative � N-S fit Exp (years) X informative � P-O fit Exp (rating) X informative � D-A fit Exp (rating) X informative � N-S fit Exp (rating) X informative � P-O fit
b. Exp (years) X informative � Job sat Exp (rating) X informative � Job sat
c. Exp (years) X informative � Retention Exp (rating) X informative � Retention
.22*
.11*
.11*
.01
.07†
.00 .11* .10* .00 .00
.01
.00
.01
.00
.00
.00 .00 .00 .01 .00
.06**
.05*
.08**
.03*
.02
.05** .08** .04* .00 .00
Mixed support. Significant �R2 values and the form of interaction generally support hypotheses when using hiring manager ratings. Although �R2 values for recruiter self-ratings are significant, the form of interactions do not support the hypotheses (see Figures 6- 9). (results depicted are �R2 values)
NOTE: values in results column are correlations unless noted in the conclusions column; HM = hiring manager, NH = new hire, RC = recruiter; values in results column are from analyses in which outliers were not removed. Additional interpretation is provided in conclusions column when removing outliers changed the results. Conclusions match those reported in the text and are based on one-tailed tests. †p < .10, *p < .05, **p < .01 � �
Fischer, Jacob, 2013, UMSL, p. 153 �
Table 11 Means, standard deviations, and correlations for variables in Hypotheses 1-9.
Above the diagonal are the pairwise sample sizes for each variable combination; HM = hiring manager; NH = new hire, RC = recruiter; Reliability estimates are in parentheses along the diagonal for selected variables. **p < .01, *p < .05, †p < .10 indicate levels of significance for two-tailed tests. �
Fischer, Jacob, 2013, UMSL, p. 154�
�
Table 12 Mediation between recruiter extraversion and accept recommendation by frequency of contact with hiring manager. � z/t-value p-value 95% LL 95% UL Extraversion Rated by Hiring Manager (N = 56)
ab (indirect effect) .02 1.22 .22 -.01 .05 † p < .10, * p < .05, **
p < .01; significance test for ab is based on a z-value and not the t-value.
Fischer, Jacob, 2013, UMSL, p. 155 �
Table 13 Mediation between recruiter extraversion and accept recommendation by quality of contact with hiring manager. � z/t-value p-value 95% LL 95% UL Extraversion Rated by Hiring Manager (N = 55)
Above the diagonal are the pairwise sample sizes for each variable combination; HM = hiring manager; NH = new hire, RC = recruiter; Reliability estimates are in parentheses along the diagonal for selected variables. **p < .01, *p < .05, †p < .10 indicate levels of significance for two-tailed tests. �
Fischer, Jacob, 2013, UMSL, p. 159 �
Table 17 Means, standard deviations, and correlations for variables included in Hypotheses 11-13.
Above the diagonal are the pairwise sample sizes for each variable combination; HM = hiring manager, NH = new hire, RC = recruiter, AP = applicant; Reliability estimates are in parentheses along the diagonal for selected variables. **p < .01, *p < .05, †p < .10 indicate levels of significance for two-tailed tests.
Fischer, Jacob, 2013, UMSL, p. 160�
�
Table 18 Incremental validity of quantity and quality of contact with candidates over effect of informativness predicting post-hire outcomes (informativeness rated by hiring manager). Model 1 Model 2 � � Demands-Abilities Fit (N = 42)
Recruiter informativeness -.10 -.08 Frequency of contact -.01
Quality of contact .23 �R2 .05
R2 .01 .06 Needs-Supplies Fit (N = 42)
Recruiter informativeness -.07 -.08 Frequency of contact -.03
Quality of contact .08 �R2 .01
R2 .01 .01 Person-Organization Fit (N = 42)
Recruiter informativeness -.26† -.27† Frequency of contact -.09
Quality of contact .04 �R2 .01
R2 .07† .08 Job Satisfaction (N = 42)
Recruiter informativeness -.16 -.17 Frequency of contact -.05
Quality of contact .02 �R2 .00
R2 .03 .03 6 Month Retention (N = 69)
Recruiter informativeness .24 .23 Frequency of contact -.05
Quality of contact -.09 �R2 .01
R2 .06* .07 NOTE: Model 1 R2 and Model 2 �R2 may not sum to Model 2 R2 values due to rounding. † p < .10, * p < .05, ** p < .01
Fischer, Jacob, 2013, UMSL, p. 161 �
Table 19 Incremental validity of quantity and quality of contact with candidates over effect of informativness predicting post-hire outcomes (informativeness rated by applicants). Model 1 Model 2 � � Demands-Abilities Fit (N = 127)
Recruiter informativeness .11 .13 Frequency of contact -.13
Quality of contact .10 �R2 .02
R2 .01 .04 Needs-Supplies Fit (N = 127)
Recruiter informativeness .30** .33** Frequency of contact -.16
Quality of contact .05 �R2 .02
R2 .09* .11* Person-Organization Fit (N = 127)
Recruiter informativeness .17 .20* Frequency of contact -.18*
Quality of contact .06 �R2 .03
R2 .03 .06* Job Satisfaction (N = 127)
Recruiter informativeness .27** .29** Frequency of contact -.13
Quality of contact .07 �R2 .02
R2 .07* .09* 6 Month Retention (N = 127)
Recruiter informativeness .02 .03 Frequency of contact -.12
Quality of contact .18* �R2 .04
R2 .00 .04 6 Month Retention (no outliers; N = 122)
Recruiter informativeness .02 .03 Frequency of contact -.17
Quality of contact .19* �R2 .07*
R2 .00 .07* NOTE: Model 1 R2 and Model 2 �R2 may not sum to Model 2 R2 values due to rounding. *p < .05, ** p < .01
Fischer, Jacob, 2013, UMSL, p. 162 �
Table 20 Incremental validity of quantity and quality of contact with candidates over effect of informativness predicting post-hire outcomes (informativeness rated by recruiter). Model 1 Model 2 � � Demands-Abilities Fit (N = 117)
Recruiter informativeness .05 .05 Frequency of contact -.10
Quality of contact .10 �R2 .02
R2 .00 .02 Needs-Supplies Fit (N = 117)
Recruiter informativeness .07 .09 Frequency of contact -.10
Quality of contact .04 �R2 .01
R2 .01 .02 Person-Organization Fit (N = 117)
Recruiter informativeness .12 .16 Frequency of contact -.18†
Quality of contact .05 �R2 .03
R2 .01 .05 Job Satisfaction (N = 117)
Recruiter informativeness .09 .10 Frequency of contact -.10
Quality of contact .06 �R2 .01
R2 .01 .02 6 Month Retention (N = 253)
Recruiter informativeness -.06 -.06 Frequency of contact -.02
Quality of contact .02 �R2 .00
R2 .01 .01 NOTE: Model 1 R2 and Model 2 �R2 may not sum to Model 2 R2 values due to rounding. *p < .05, ** p < .01
Fischer, Jacob, 2013, UMSL, p. 163�
�
Table 21 Means, standard deviations, and correlations for variables included in Hypotheses 15-19.
Above the diagonal are the pairwise sample sizes for each variable combination; HM = hiring manager, NH = new hire, RC = recruiter, AP = applicant; Reliability estimates are in parentheses along the diagonal for selected variables. **p < .01, *p < .05, †p < .10 indicate levels of significance for two-tailed tests. � �
Fischer, Jacob, 2013, UMSL, p. 164 �
Table 22 Means, standard deviations, and correlations for variables included in Hypothesis 20.
Above the diagonal are the pairwise sample sizes for each variable combination; Reliability estimates are in parentheses along the diagonal for selected variables. **p < .01, *p < .05, †p < .10 indicate levels of significance for two-tailed tests. �
Fischer, Jacob, 2013, UMSL, p. 165�
�
Table 23 Job experience as moderator between recruiter informativeness and post-hire outcomes. (informativeness rated by hiring manager). Years as Job
Experience Model (N = 37)
Rating as Job Experience Model (N = 39)
� � Demands-Abilities Fit Step 1 Recruiter Informativeness .11 .21
Similar job experience .03 .19† Step 2 Informative X Experience -.10** -.06
�R2 .22* .01 R2 .28** .13
Needs-Supplies Fit Step 1 Recruiter Informativeness .17 .29
Similar job experience .02 .19 Step 2 Informative X Experience -.08* -.18
�R2 .11* .07† R2 .18† .22*
Person-Organization Fit Step 1 Recruiter Informativeness -.05 -.00
Similar job experience -.01 .03 Step 2 Informative X Experience -.05* .02
†p < .10, *�p < .05��** p < .01; N = 279 and 285 for 6 Month Retention
Fischer, Jacob, 2013, UMSL, p. 168�
�
Figures
>5A@�>�
, 2.>��!5>�
>��2A!�� �
����>; !>�
��>�>�
, 2.>��!5>�
�,1:@�����!5!�!>�
•������ � �� ����� ���
•.���/���
•.����
•����� �������� ���
•!� ��"���
•2���� �
Figure 1. Stages of Recruitment (modified from Breaugh and colleagues).
Fischer, Jacob, 2013, UMSL, p. 169 �
�>��@ !�� >1������
�>A>��!, 1 �����!�>�
• ��� �� ����
�������� ������������
� ������
• 1� �B �(�����������
�� ��"���
• �����������������
� ������� ��
�� ��"���
��>B� !�>�, @��,� >�
• �������� �������
����� ������� ���
����� � ���� ���
• ������� ������ �����
�� �
• ������� �����B�� �
�� �
• ��� �� �� ������� ���
• ������� ����� ���
�>��@ !�>��
�����>�!��!��
• !� ��� � �"�
• ���������
• >- ��"�� ��
• ������� ���
�, ��B� !�>�, @��,� >�
1�� ������
• /�
• .���� � �� ���
• ��� ��� ����
• �� �� ���
• �� � �� ����� � ��
������������
� ������� ������
• �� � �� ����
� � ���������
�����
�Figure 2. The Role of Recruiter Characteristics in Pre- and Post-Hire Outcomes
Fischer, Jacob, 2013, UMSL, p. 170�
�
/�
�� � �� ���
��� ��� ����
�� �� ���
������� ����
>- ��"�����
1� �B �(���6� ��� 9C ���� #9�
2���"���93�: �� 7
��� �� �� 9� ������
� �������6� ��� 9C ���� #7
�>��@ !�� >1������
�>A>��!, 1 �����!�>�
��>B� !�>�
, 2.>��!5>�
�,��B� !�>�
, 2.>��!5>�
�>��@ !�>��
�����>�!��!��
� ������� �������
���� �
����� � ����
!� ��� � �"���
, ������� �����
�� �
I
O
H*
D
P
HD�B�
HH�
J
�
�����������
� ����� �������
�� � �� ���G�� ����
�����
1�� �� ����
�� � �� ���G�� ����
�����
��� �� �
� 9������� 6� ��� 9C ���� #7
)
HH�
HH�
HH�
HKHP
H�
HJ
I*�B�
I*�B�
H)�B�HI
HO�B�
H
��� �� ��/����
��� ���
K
Figure 3. Relationships of recruiter characteristics to pre- and post-hire outcomes.
Fischer, Jacob, 2013, UMSL, p. 171 �
/�
�� � �� ���
��� ��� ����
�� �� ���
!� ��� � �"������ �����.���
>-��������
���� ������� �
��� �� ��/���
�>��@ !�� >1 ������
�>A>��!, 1 �����!�>�
��>B� !�>�
, 2.>��!5>�
�, ��B� !�>�
, 2.>��!5>�
�>��@ !�>��
�����>�!��!��
��� �����1 ���.���
>-��������
IH�B�
II�B�
IH�B
IH�B�
Figure 415. Relationship between experience and pre- and post-hire objectives
���������������������������������������� �������������������15 This figure was updated since the proposal for clarity.
Fischer, Jacob, 2013, UMSL, p. 172 �
*
H
I
)
O
D
J
�
P
*�D H H�D I I�D ) )�D
8�-�����9�����
����4������ � �������
*
H
I
)
O
D
J
�
P
*�D H H�D I I�D ) )�D
��������44�����!�
����4������ � �������
*
H
I
)
O
D
J
�
P
*�D H H�D I I�D ) )�D
���������-�������!�
����4������ � �������
*
H
I
)
O
D
J
�
P
*�D H H�D I I�D ) )�D
�������#�����:�����!�
����4������ � �������
Figure 5. Scatterplot showing influential cases between accept recommendation and post-hire outcomes
Figure 6. Interactions between hiring manager ratings of recruiter informativeness and years of similar job experience predicting poshire outcomes
Fischer, Jacob, 2013, UM
. Interactions between hiring manager ratings of recruiter informativeness and years of similar job experience predicting pos
Fischer, Jacob, 2013, UMSL, p. 173 �
. Interactions between hiring manager ratings of recruiter informativeness and years of similar job experience predicting post-
Figure 7. Interaction between hiring manager ratings of recruiter informativeness and overall rating of similar job experience predicting job satisfaction
Fischer, Jacob, 2013, UM
nager ratings of recruiter informativeness and overall rating of similar job experience
Fischer, Jacob, 2013, UMSL, p. 174 �
nager ratings of recruiter informativeness and overall rating of similar job experience
Figure 8. Interactions between recruiter self-ratings of recruiter informativeness and years of similar job experience predicting phire outcomes
Fischer, Jacob, 2013, UM
ratings of recruiter informativeness and years of similar job experience predicting p
Fischer, Jacob, 2013, UMSL, p. 175 �
ratings of recruiter informativeness and years of similar job experience predicting post-
Figure 9. Interactions between recruiter self-ratings of recruiter informativeness and overall rating of similar job experience predicting post-hire outcomes
Fischer, Jacob, 2013, UM
ratings of recruiter informativeness and overall rating of similar job experience predicting
Fischer, Jacob, 2013, UMSL, p. 176 �
ratings of recruiter informativeness and overall rating of similar job experience predicting