36
The renaissance in mergers and acquisitions
| Date post: | 11-Jul-2018 |
| Category: |
Documents |
| Upload: | duongduong |
| View: | 217 times |
| Download: | 0 times |
The renaissance in mergersand acquisitions

Copyright © 2014 Bain & Company, Inc. All rights reserved.
About the authors
David Harding is a partner with Bain & Company in Boston and co-leader of Bain’s Global M&A practice.
Richard Jackson is a partner in London and leader of Bain’s M&A practice in EMEA.
Phil Leung is a partner with Bain & Company in Shanghai and leader of Bain’s M&A practice in Asia-Pacifi c.
Matthias Meyer is a director of Bain’s EMEA/Asia-Pacifi c M&A practices and is based in Munich.
Karen Harris is director of the Bain Macro Trends Group and is based in New York.
1
Preface
Mergers and acquisitions are about to undergo a renaissance.
Deal making has always been cyclical, and the last few years have felt like another low point in the cycle. But the historical success of M&A as a growth strategy comes into sharp relief when you look at the data. Bain & Company’s analysis strongly suggests that executives will need to focus even more on inorganic growth to meet the expectations of their investors.
The fi rst installment of this three-part series on the coming M&A renaissance, “The surprising lessons of the 2000s,” looks back at the last 11 years of deal activity and fi nds that it was a very good time for deal makers who followed a repeatable model for acquisitions. The accepted wisdom paints the decade as a period of irra-tional excess ending in a big crash. Yet companies that were disciplined acquirers came out the biggest win-ners. Another surprise: Materiality matters. We found the best returns among those companies that invested a signifi cant portion of their market cap in inorganic growth.
The second part of the series, “What to do with all that cash?” looks forward and argues that the confl uence of strong corporate balance sheets, a bountiful capital environment, low interest rates and eight great macro trends will combine to make M&A a powerful vehicle for achieving a company’s strategic imperatives. The fuel—abundant capital—will be there to support M&A, and the pressure on executives to fi nd growth will only increase as investors constantly search for higher returns. Some business leaders argue that organic growth is always better than buying growth, but the track record of the 2000s should make executives question this conventional view.
The fi nal part of the series, “How to make your deals successful,” highlights the importance of discipline in a favorable environment for M&A. Deal making is not for everyone. If your core business is weak, the odds that a deal will save your company are slim. But if you have a robust core business, you may be well positioned. All successful M&A starts with great corporate strategy, and M&A is often a means to realize that strategy. Under pressure to grow, many companies will fi nd inorganic growth faster, safer and more reliable than organic investments.
As M&A comes back, some executives will no doubt sit on the sidelines thinking it is safer not to play. Experience suggests that their performance will suffer accordingly. The winners will be those who get in the game—and learn how to play it well.

1. The renaissance in mergers and acquisitions: The surprising lessons of the 2000sBy David Harding, Phil Leung, Richard Jackson and Matthias Meyer

Looking back at the first decade of this century, it is clear that many companies succeeded in delivering superior share-holder returns using M&A as a weapon for competitive advantage. Executives had to be smart about it, and they had to be committed. But for those with a repeatable model, the rewards were exceptional.
The surprising lessons of the 2000s
5
when the cumulative value of their acquisitions
over the 11-year period amounted to a large percent-
age of their market capitalization.
• The gold standard of M&A is a repeatable model.
Companies that built their growth on M&A—those
that acquired frequently and at a material level—
recorded TSR nearly two percentage points higher
than the average.
The research supporting these numbers is robust, and
it points the way to a powerful tool for growth. If your
company has a successful strategy, you can use the
balance sheet to strengthen and extend that strategy.
M&A can help you enter new markets and product
lines, fi nd new customers and develop new capabilities.
They can help you boost your earnings and turbocharge
your growth.
The trick, as always, is to do M&A right.
Which deal makers succeed?
M&A can be a slippery subject to study. Businesspeople,
trained in the case method, often try to draw lessons
from individual examples. M&A fans point to successes
such as Anheuser-Busch InBev, whose mergers and
acquisitions have made it the world’s largest brewer.
Skeptics point to classic deal-making busts such as
AOL-Time Warner. The trouble is, you can fi nd a story
to fit virtually any hypothesis about M&A, including
the argument that a company can prosper without
relying on deals (look at IKEA or Hankook Tire).
Case-study evidence is always helpful in understanding
M&A specifics, but as a guide to the territory it can
be misleading.
To establish a foundation on the overall results of deal
making, we launched a worldwide research project
involving more than 1,600 publicly traded companies
and covering more than 18,000 deals from 2000 through
2010. We assessed the performance of companies that
engaged in M&A and those that did not. We compared
results for companies that did a lot of acquisitions with
those that did relatively few. We also looked at whether
the cumulative size of deals relative to a company’s
April 2007 was a remarkable high-water mark for M&A.
That month, companies around the world announced
deals worth more than half a trillion dollars in total
value—the highest ever. For the year, worldwide deals
would surpass 40,000 for the fi rst time; their cumu-
lative value would hit $4.6 trillion, 40% above the dot-
com peak in 2000. It seemed like the M&A party might
never stop.
But when the fi scal crisis brought the boom to an abrupt
end, the hangover set in. Many business leaders again
grew leery of any kind of deal making. M&A was too
risky, they felt. It destroyed more value than it created.
Some agreed with the often-quoted 2004 pronounce-
ment of a CEO named Ellis Baxter, who responded to
a Harvard Business School article questioning the wis-
dom of acquisitions. “In the end,” wrote Baxter, “M&A
is a fl awed process, invented by brokers, lawyers and
super-sized, ego-based CEOs.”
The reaction was understandable. But a sober assess-
ment of M&A activity over the past decade puts deal
making in a different light. Companies that were active
in M&A, the data shows, consistently outperformed
those that stayed away from deals. Companies that did
the most deals, and whose cumulative deal making
accounted for a larger fraction of their market capital-
ization, turned in the best performance of all.
M&A, in short, was an essential part of successful strat-
egies for profi table growth. Many management teams
that avoided deals paid a price for their reticence.
Consider the data. From 2000 through 2010, total share-
holder return (TSR) averaged 4.5% per year for a large
sample of publicly traded companies around the world.
Dividing this sample according to companies’ M&A
activity, here’s what we observe:
• Players outperformed bystanders. As a group, com-
panies that engaged in any M&A activity averaged
4.8% annual TSR, compared with 3.3% for those
that were inactive.
• Materiality mattered—a lot. Companies that did a
lot of deals outperformed the average most often

6
The renaissance in mergers and acquisitions
did between one and six acquisitions boosted their
performance signifi cantly, to 4.5%, and those that did
more than six topped 5% TSR. These seemingly modest
differences in annual TSR add up to signifi cant dispar-
ities over a decade. The top group, for example, had 21%
higher returns than the inactive group.
The difference between frequent acquirers and occa-
sional ones is hardly a mystery. Experience counts. A
company that does more acquisitions is likely to identify
the right targets more often. It is likely to be sharper
in conducting the due diligence required to vet the deals.
It is also likely to be more effective at integrating the
acquired company and realizing potential synergies.
Stanley Works, for example—now Stanley Black & Decker
(SB&D)—embarked on an aggressive M&A program
beginning in 2002, and over the next several years it
acquired more than 25 companies. It used operational
capabilities such as the Stanley Fulfi llment System to
improve the acquired businesses, and it grew more and
more successful at realizing synergies through post-
merger integration. After acquiring key competitor
Black & Decker in 2010, more than doubling its size,
market capitalization made a difference. (For more on
the research, see the sidebar, “What we studied and how
we gauged performance.”)
Data from this study shows unequivocally that deal mak-
ing paid off during that 11-year period. Companies that
were actively engaged in M&A outperformed inactive
companies not only in TSR but in sales growth and
profit growth as well. The data also underscored the
fact that the world of M&A is not uniform and shouldn’t
be treated as such. Some companies were able to use
deals to power consistently higher performance. Others
were far less successful, and often pursued deals that
failed to pay off.
Every transaction has its own characteristics. In general,
however, the difference boiled down to two main factors:
Frequency. As a rule, the more experience a company
has doing M&A, the greater the likelihood that its deals
will be successful. Companies in our study that were
inactive—no mergers or acquisitions during the period—
recorded 3.3% annual TSR (see Figure 1). Those that
Figure 1: Companies that acquire more frequently tend to outperform signifi cantly in the long term
Notes: n=1,616 companies; number of deals includes deals with undisclosed value Sources: Bain M&A Study 2012; Dealogic; Thomson; Bain SVC Database 2011
Translates into21% higher
shareholder returngenerated between
2000–2010
0
2
4
6%
0 1–6
4.5%
7–11
5.1%
12+
Number of acquisitions (2000–2010)
Annual total shareholder returns (CAGR 2000–2010)
5.1%
3.3%
The surprising lessons of the 2000s
7
What we studied and how we gauged performance
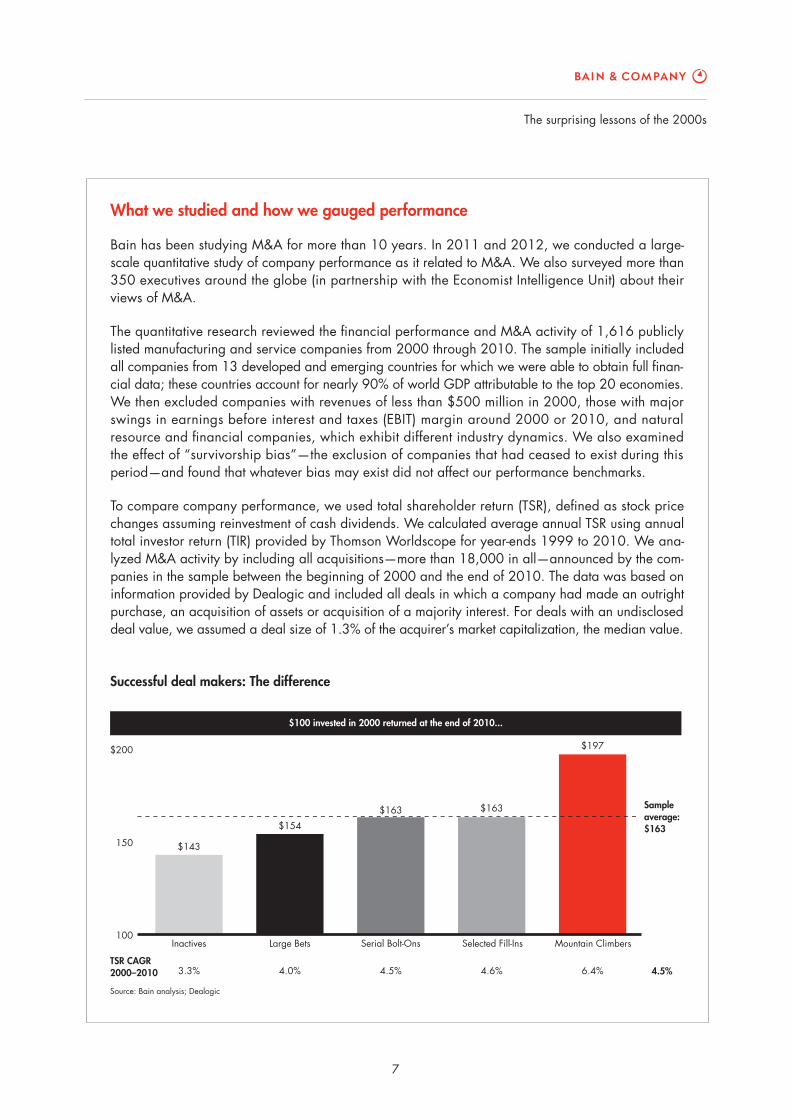
Bain has been studying M&A for more than 10 years. In 2011 and 2012, we conducted a large-scale quantitative study of company performance as it related to M&A. We also surveyed more than 350 executives around the globe (in partnership with the Economist Intelligence Unit) about their views of M&A.
The quantitative research reviewed the fi nancial performance and M&A activity of 1,616 publicly listed manufacturing and service companies from 2000 through 2010. The sample initially included all companies from 13 developed and emerging countries for which we were able to obtain full fi nan-cial data; these countries account for nearly 90% of world GDP attributable to the top 20 economies. We then excluded companies with revenues of less than $500 million in 2000, those with major swings in earnings before interest and taxes (EBIT) margin around 2000 or 2010, and natural resource and fi nancial companies, which exhibit different industry dynamics. We also examined the effect of “survivorship bias”—the exclusion of companies that had ceased to exist during this period—and found that whatever bias may exist did not affect our performance benchmarks.
To compare company performance, we used total shareholder return (TSR), defi ned as stock price changes assuming reinvestment of cash dividends. We calculated average annual TSR using annual total investor return (TIR) provided by Thomson Worldscope for year-ends 1999 to 2010. We ana-lyzed M&A activity by including all acquisitions—more than 18,000 in all—announced by the com-panies in the sample between the beginning of 2000 and the end of 2010. The data was based on information provided by Dealogic and included all deals in which a company had made an outright purchase, an acquisition of assets or acquisition of a majority interest. For deals with an undisclosed deal value, we assumed a deal size of 1.3% of the acquirer’s market capitalization, the median value.
Source: Bain analysis; Dealogic
TSR CAGR2000–2010 4.5%
100
150
$200
Inactives
$143
Large Bets
$154
Serial Bolt-Ons
$163
Selected Fill-Ins
$163
Mountain Climbers
$197
Sampleaverage:$163
3.3% 6.4%4.0% 4.5% 4.6%
$100 invested in 2000 returned at the end of 2010...
Successful deal makers: The difference
8
The renaissance in mergers and acquisitions
position to do deals. But the implications are clear re-
gardless. A company with a strong business is likely to
boost its performance by consistently pursuing M&A,
to the point where its deals account for a large fraction
of its value. If a company’s business is weak, however,
it is highly unlikely that one big deal will turn it around.
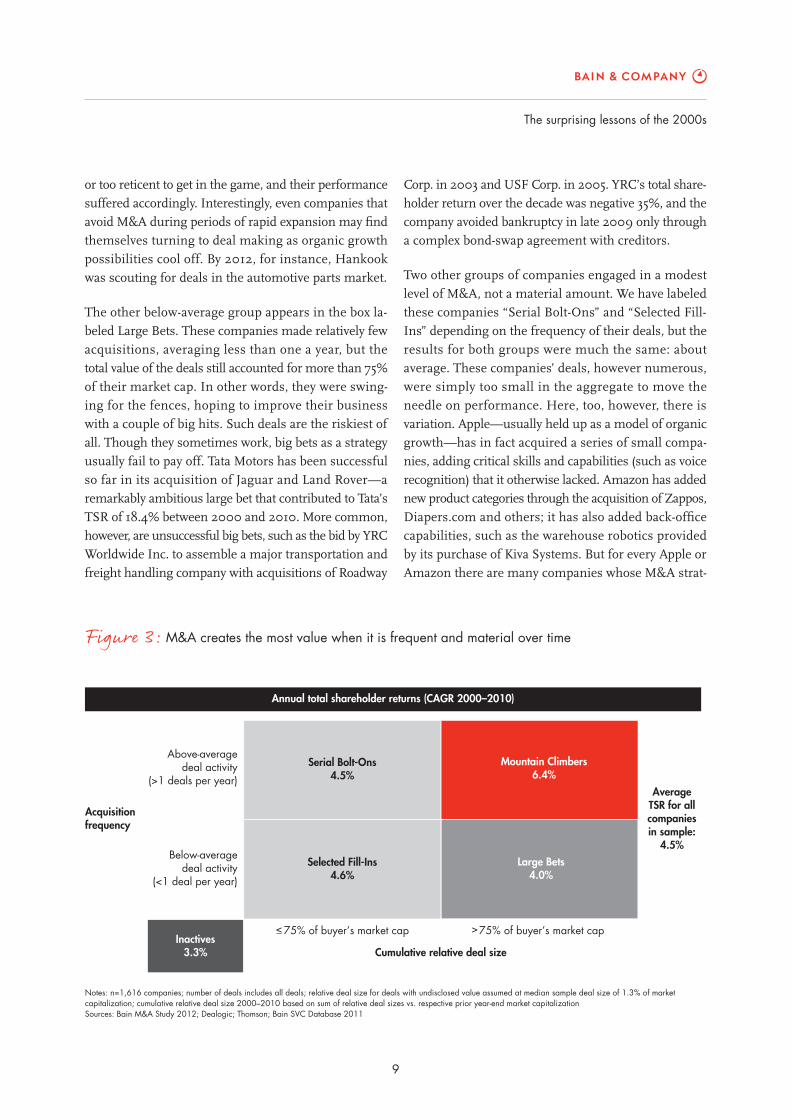
Put frequency and materiality together and you get a
clear picture showing which companies have been most
successful at M&A (see Figure 3). Viewing M&A
through this lens also reveals what kind of deal making
produces the greatest rewards.
The first takeaway: The average annual TSR for all
1,600-plus companies that we studied was 4.5%.
Two groups fell below this average. One was the by-
standers or inactives, the companies that sat on the M&A
sidelines. Some companies in this group, of course,
were committed to organic growth and performed well
despite a lack of M&A: Hankook’s TSR was a remark-
able 26.3%. But many others may have been too weak
it was able to exceed its original savings estimates for
the deal by more than 40%. From 2000 through 2010,
SB&D recorded annual TSR of 10.3%.
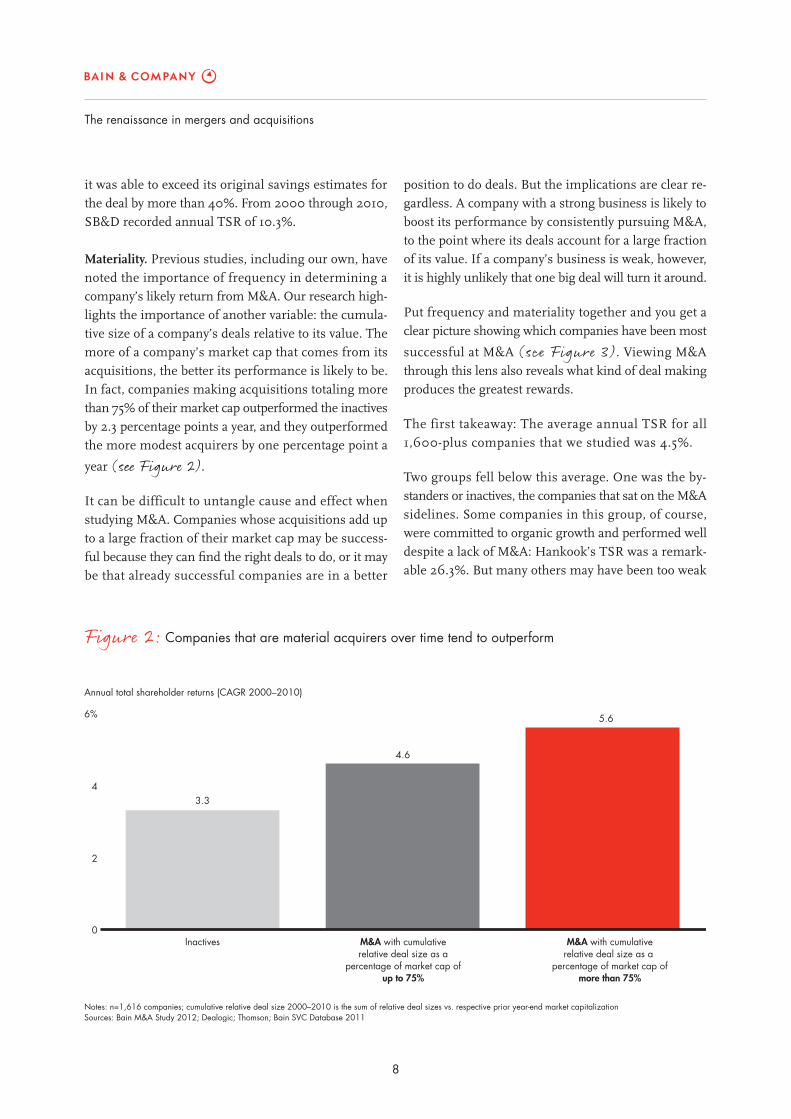
Materiality. Previous studies, including our own, have
noted the importance of frequency in determining a
company’s likely return from M&A. Our research high-
lights the importance of another variable: the cumula-
tive size of a company’s deals relative to its value. The
more of a company’s market cap that comes from its
acquisitions, the better its performance is likely to be.
In fact, companies making acquisitions totaling more
than 75% of their market cap outperformed the inactives
by 2.3 percentage points a year, and they outperformed
the more modest acquirers by one percentage point a
year (see Figure 2).
It can be difficult to untangle cause and effect when
studying M&A. Companies whose acquisitions add up
to a large fraction of their market cap may be success-
ful because they can fi nd the right deals to do, or it may
be that already successful companies are in a better
Figure 2: Companies that are material acquirers over time tend to outperform
Notes: n=1,616 companies; cumulative relative deal size 2000–2010 is the sum of relative deal sizes vs. respective prior year-end market capitalizationSources: Bain M&A Study 2012; Dealogic; Thomson; Bain SVC Database 2011
Annual total shareholder returns (CAGR 2000–2010)
0
2
4
6%
Inactives
3.3
4.6
5.6
M&A with cumulativerelative deal size as a
percentage of market cap ofup to 75%
M&A with cumulativerelative deal size as a
percentage of market cap ofmore than 75%
The surprising lessons of the 2000s
9
Corp. in 2003 and USF Corp. in 2005. YRC’s total share-
holder return over the decade was negative 35%, and the
company avoided bankruptcy in late 2009 only through
a complex bond-swap agreement with creditors.
Two other groups of companies engaged in a modest
level of M&A, not a material amount. We have labeled
these companies “Serial Bolt-Ons” and “Selected Fill-
Ins” depending on the frequency of their deals, but the
results for both groups were much the same: about
average. These companies’ deals, however numerous,
were simply too small in the aggregate to move the
needle on performance. Here, too, however, there is
variation. Apple—usually held up as a model of organic
growth—has in fact acquired a series of small compa-
nies, adding critical skills and capabilities (such as voice
recognition) that it otherwise lacked. Amazon has added
new product categories through the acquisition of Zappos,
Diapers.com and others; it has also added back-offi ce
capabilities, such as the warehouse robotics provided
by its purchase of Kiva Systems. But for every Apple or
Amazon there are many companies whose M&A strat-
or too reticent to get in the game, and their performance
suffered accordingly. Interestingly, even companies that
avoid M&A during periods of rapid expansion may fi nd
themselves turning to deal making as organic growth
possibilities cool off. By 2012, for instance, Hankook
was scouting for deals in the automotive parts market.
The other below-average group appears in the box la-
beled Large Bets. These companies made relatively few
acquisitions, averaging less than one a year, but the
total value of the deals still accounted for more than 75%
of their market cap. In other words, they were swing-
ing for the fences, hoping to improve their business
with a couple of big hits. Such deals are the riskiest of
all. Though they sometimes work, big bets as a strategy
usually fail to pay off. Tata Motors has been successful
so far in its acquisition of Jaguar and Land Rover—a
remarkably ambitious large bet that contributed to Tata’s
TSR of 18.4% between 2000 and 2010. More common,
however, are unsuccessful big bets, such as the bid by YRC
Worldwide Inc. to assemble a major transportation and
freight handling company with acquisitions of Roadway
Figure 3: M&A creates the most value when it is frequent and material over time
Notes: n=1,616 companies; number of deals includes all deals; relative deal size for deals with undisclosed value assumed at median sample deal size of 1.3% of marketcapitalization; cumulative relative deal size 2000–2010 based on sum of relative deal sizes vs. respective prior year-end market capitalizationSources: Bain M&A Study 2012; Dealogic; Thomson; Bain SVC Database 2011
Annual total shareholder returns (CAGR 2000–2010)
Inactives3.3%
Above-averagedeal activity
(>1 deals per year)
Below-averagedeal activity
(<1 deal per year)
Acquisitionfrequency
Serial Bolt-Ons4.5%
Large Bets4.0%
Mountain Climbers6.4%
Selected Fill-Ins4.6%
<_ 75% of buyer’s market cap >75% of buyer’s market cap
Cumulative relative deal size
AverageTSR for allcompaniesin sample:
4.5%

10
The renaissance in mergers and acquisitions
ample, at Anheuser-Busch InBev, which has built its
remarkable growth on a foundation of successful merg-
ers and acquisitions. Each major deal has allowed the
company not only to expand but to increase its EBITDA
margin, using well-honed skills both in integrating the
merger parties and boosting productivity throughout
the new organization.
Understanding the elements of this repeatable model
in detail shows the variety of skills that frequent ac-
quirers develop.
First, successful acquirers understand their strategy and
create an M&A plan that reinforces the strategy. The
strategy provides a logic for identifying target companies.
Second, they develop a deal thesis based on that strat-
egy for every transaction. The thesis spells out how the
deal will add value both to the target and to the acquir-
ing company. For example, it may expand the acquirer’s
capabilities, create new opportunities for existing capa-
bilities, generate signifi cant cost synergies or give the
acquirer access to new markets. Early development of
a meaningful deal thesis derived from a company’s
strategy pays off. In earlier interviews with 250 executives
around the world, we found that 90% of successful
deals started with such a thesis, compared with only
50% of failed deals.
Third, they conduct thorough, data-based due diligence
to test their deal thesis, including a hard-nosed look at
the price of the business they are considering. There
will always be a conventional-wisdom price for a target
company, usually an average of whatever industry ex-
perts and Wall Street analysts think it is worth. A fre-
quent acquirer knows exactly where it can add value
and is therefore able to set its own price—and to walk
away if the price isn’t right. Inadequate diligence is
high on the list of reasons for disappointing deal out-
comes. In a 2012 survey of more than 350 executives,
the top two reasons for perceived deal failure were,
fi rst, that due diligence failed to highlight critical issues
(59% of respondents) and, second, that the company
had overestimated potential synergies in the deal (55%
of respondents).
egy simply didn’t add much. Unless the experience ul-
timately leads to larger deals, these companies were
very likely squandering resources on deals that made
little or no difference to their fi nancial results.
The only companies with deal-making returns signifi -
cantly above average are the “Mountain Climbers.” These
companies are the M&A stars, with returns almost two
percentage points above the average and more than
three points above the inactives. They acquire frequently.
Their acquisitions add up in terms of materiality. Their
deals are generally well conceived, reinforcing their
strategy. They develop strong capabilities, both for
executing deals and for post-merger integration, and
they can use these capabilities effectively in pursuing
large, complex transactions.
Look, for instance, at companies such as Schneider
Electric (based in France), Wesfarmers (Australia) or
Precision Castparts (US). All have used serial acquisitions
effectively to expand into new geographies, new markets
or both, thus boosting their growth. Such companies
often hone their acquisition skills on smaller deals,
enabling them to move quickly to acquire a larger
target when the time is right. Wesfarmers, for example,
did about 20 deals in the decade prior to its 2007
acquisition of Coles Group, the large Australian retailer
(which more than doubled its market cap). Wesfarmers’
TSR averaged 13.4% a year from 2000 through 2010.
Developing a repeatable model
Most successful companies develop a repeatable model—
a unique, focused set of skills and capabilities that they
can apply to new products and new markets over and
over. As our colleagues Chris Zook and James Allen
show in their 2012 book, Repeatability, repeatable mod-
els are key to generating sustained growth. Our own
analysis and experience confi rm the power of repeat-
ability in the world of M&A. An acquirer’s expertise in
fi nding, analyzing and executing the transaction, and
then in integrating the two companies when the deal
is done, determines the success of the typical deal. Fre-
quent acquirers create a repeatable M&A model, one
that they return to again and again to launch and ne-
gotiate a successful deal (see Figure 4). Look, for ex-
The surprising lessons of the 2000s
11
cantly greater return, on average, than their opportu-
nistic counterparts. One reason may be that the Large
Bettors tended to stick to scale deals, staying in the same
business but increasing their scale of operations; more
than three-quarters of the group’s transactions fell into
this category. Scale deals are presumably safer, prom-
ising measurable cost synergies, but they rarely provide
any top-line growth and may require fl awless integration
to capture the potential value. Meanwhile, the Mountain
Climbers were able to execute scope deals, which accounted
for nearly half of their transactions in our study. These
deals expanded the range of the Mountain Climbers’
business and helped boost their performance.
The pressure to grow is only going to increase with
time. Looking back at the fi rst decade of this century,
it is clear that many companies succeeded in delivering
superior shareholder returns using M&A as a weapon
for competitive advantage. Executives had to be smart
about it, and they had to be committed. But for those
with a repeatable model, the rewards were exceptional.
Over the next several years we believe the environment
Fourth, successful acquirers plan carefully for merger
integration. They determine what must be integrated
and what can be kept separate, based on where they
expect value to be created. This is one area that we ob-
serve has improved measurably during the past decade:
Companies are devoting far more time, attention and
resources to integration. In 2002, executives we sur-
veyed said the No. 1 reason for disappointing deal re-
sults was because they “ignored potential integration
challenges.” In 2012, integration challenges had dropped
to No. 6 among the causes cited by executives for dis-
appointing deal results.
Finally, they mobilize to capture value, quickly nailing the
short list of must-get-right actions and effectively execut-
ing the much longer list of broader integration tasks.
Developing a repeatable model gives frequent acquirers
advantages that opportunistic acquirers lack. Look, for
example, at the difference between Mountain Climbers
and the Large Bettors. Both were engaged in substantial
acquisitions, yet Mountain Climbers enjoyed a signifi -
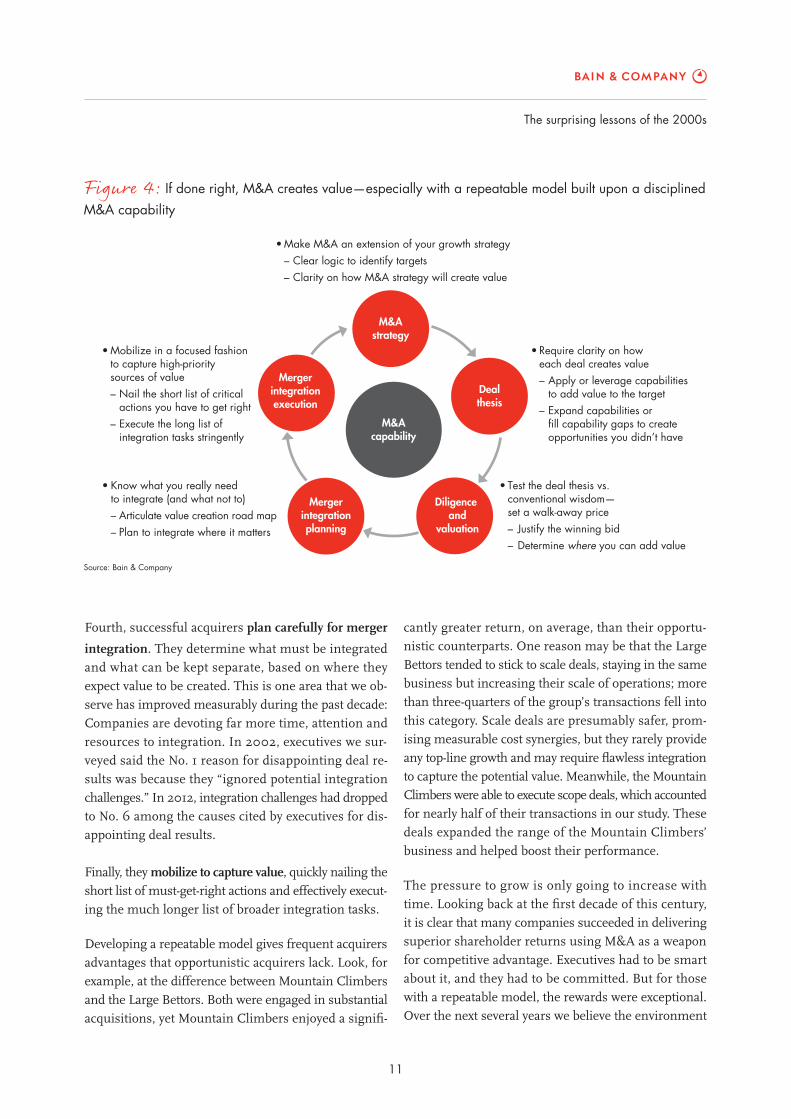
Figure 4: If done right, M&A creates value—especially with a repeatable model built upon a disciplined M&A capability
Source: Bain & Company
• Make M&A an extension of your growth strategy – Clear logic to identify targets – Clarity on how M&A strategy will create value
• Mobilize in a focused fashion to capture high-priority sources of value – Nail the short list of critical actions you have to get right – Execute the long list of integration tasks stringently
• Require clarity on how each deal creates value – Apply or leverage capabilities to add value to the target – Expand capabilities or fill capability gaps to create opportunities you didn’t have
• Know what you really need to integrate (and what not to) – Articulate value creation road map – Plan to integrate where it matters
• Test the deal thesis vs. conventional wisdom— set a walk-away price – Justify the winning bid – Determine where you can add value
M&Astrategy
M&Acapability
Dealthesis
Mergerintegrationexecution
Mergerintegrationplanning
Diligence and
valuation
12
The renaissance in mergers and acquisitions
will become increasingly conducive to well-conceived
deal making. In the second part of this series, we will
look at how the market environment, company balance
sheets and the emerging need to fi nd new capabilities
to expand the scope of competition will all feed the
M&A cycle. In that environment, inorganic growth is
likely to be a key to unlocking strategic imperatives for
many, many companies. Then, in the third part, we will
examine in detail how individual companies capitalize
on such an environment by creating repeatable models,
thereby increasing their odds of deal-making success.
Not every company can do it. But the rewards are sub-
stantial for those that can.

2. The renaissance in mergers and acquisitions: What to do with all that cash?By David Harding, Karen Harris, Richard Jackson and Phil Leung
The confl uence of strong corporate balance sheets, a bountiful capital environment, low interest rates and eight great macro trends will combine to make M&A a powerful vehicle for achieving a company’s strategic imperatives.
What to do with all that cash?
15
The world is awash in capital. By Bain’s estimate, about
$300 trillion in global fi nancial holdings is available for
investment. The time is right to put this money to work,
and a lot of it should fund the renaissance in M&A.
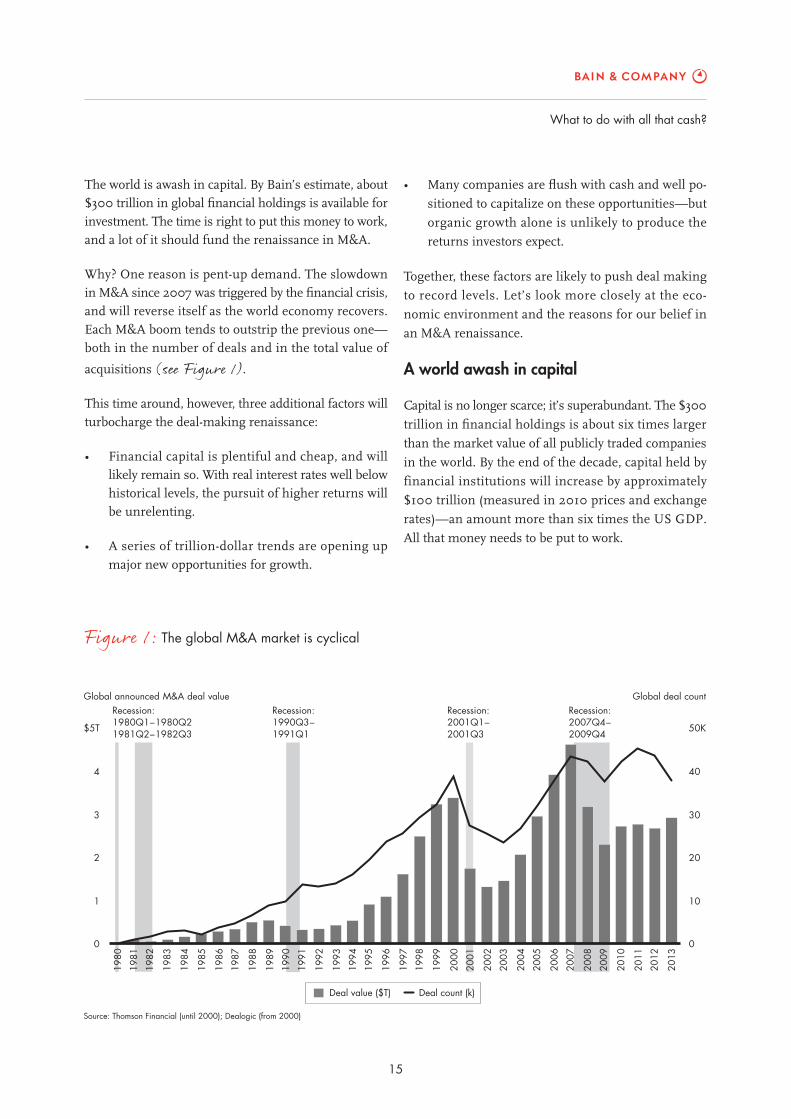
Why? One reason is pent-up demand. The slowdown
in M&A since 2007 was triggered by the fi nancial crisis,
and will reverse itself as the world economy recovers.
Each M&A boom tends to outstrip the previous one—
both in the number of deals and in the total value of
acquisitions (see Figure 1).
This time around, however, three additional factors will
turbocharge the deal-making renaissance:
• Financial capital is plentiful and cheap, and will
likely remain so. With real interest rates well below
historical levels, the pursuit of higher returns will
be unrelenting.
• A series of trillion-dollar trends are opening up
major new opportunities for growth.
• Many companies are fl ush with cash and well po-
sitioned to capitalize on these opportunities—but
organic growth alone is unlikely to produce the
returns investors expect.
Together, these factors are likely to push deal making
to record levels. Let’s look more closely at the eco-
nomic environment and the reasons for our belief in
an M&A renaissance.
A world awash in capital
Capital is no longer scarce; it’s superabundant. The $300
trillion in fi nancial holdings is about six times larger
than the market value of all publicly traded companies
in the world. By the end of the decade, capital held by
financial institutions will increase by approximately
$100 trillion (measured in 2010 prices and exchange
rates)—an amount more than six times the US GDP.
All that money needs to be put to work.
Figure 1: The global M&A market is cyclical
Recession:1980Q1−1980Q21981Q2−1982Q3
Recession:1990Q3−1991Q1
Recession:2001Q1−2001Q3
Recession:2007Q4−2009Q4
0
1
2
3
4
$5T
Global announced M&A deal value Global deal count
1980
1981
1982
1983
1984
1985
1986
1987
1988
1989
1990
1991
1992
1993
1994
1995
1996
1997
1998
1999
2000
2001
2002
2003
2004
2005
2006
2007
2008
2009
2010
2011
2012
2013
Deal value ($T) Deal count (k)
10
20
30
40
50K
0
Source: Thomson Financial (until 2000); Dealogic (from 2000)
16
The renaissance in mergers and acquisitions
From 1973 to 1981, the most recent period of sus-
tained high infl ation, supply constraints in energy
and other sectors combined with buoyant demand
from the young baby boomer generation led to
continuing upward pressure on prices. In the 2010s,
supply growth in most sectors is readily available;
many industries have signifi cant overcapacity. Yet
demand is tepid and is likely to remain so for
decades, partly because of long-term trends such
as the aging of the population. Given these two
factors, producers will fi nd it diffi cult to pass price
increases on to consumers.
Although abundant capital and easy borrowing will
probably not feed general inflation, they are almost
certain to have one kind of inflationary effect: They
will feed the growth of asset bubbles. In a global econ-
omy, some assets somewhere are likely to be increasing
in price at any given time; it might be metals, agricul-
tural commodities, fuels, farmland, other real estate
or indeed nearly any other class of assets. As investors
around the world pour their money into these assets
their prices rise still higher, and the stage is set for a
classic bubble. In the environment we have described,
the bubbles will likely last longer and grow bigger
before they inevitably burst.
High investor expectations
Capital is superabundant, interest rates are correspond-
ingly low, demand is muted and growth sluggish. Does
all this mean that investors expect only modest returns?
Not quite. The data indicates that investors expect
companies to grow considerably faster than their his-
torical growth rates. In the US, where this growth gap is
most pronounced, companies increased their earnings
at an average annual rate of 6% in the period from
1995 through 2013 (see Figure 2). Yearly growth in
nominal GDP during the period 2014 to 2016 is likely
to be much the same as it was then—but investors
expect their companies to grow at about 11% a year.
Executives thus fi nd themselves in a challenging situ-
ation. Capital is widely available at relatively low cost,
including on their own companies’ balance sheets.
Capital is widely available at relatively low cost. The job is to put all this money to work with the goal of creating alpha—performance that outstrips market indexes.
Capital superabundance produces low interest rates. In
the years following the global fi nancial crisis, interest
rates in many countries hit new lows, with real rates
on low-risk investments hovering around zero. We
expect rates to remain low for some time, primarily
because of supply and demand: Financial assets have
grown considerably faster than real output between
the early 1990s and today, a trend that has led to a drop
of 4 to 5 percentage points in the global average lending
rate during this period. Three interrelated factors
reinforce that long-term trend:
• Historically, rates remain low after a crisis of the
sort that began in 2007. Households and businesses
reduce their borrowing. Growth is sluggish. These
long-cycle periods of unusually low interest rates
can extend for decades. In the Great Depression
and more recently in Japan’s Lost Decade, rates re-
mained low for up to 20 years after the initial crisis.
• Central banks around the world are committed to
keeping interest rates low for the foreseeable future.
The US Federal Reserve Board has said that it will
maintain low rates as long as unemployment stays
above 6.5% and infl ation remains below 2.5%. The
European Central Bank and the Bank of Japan are
pursuing similar policies. Central banks are not
only setting their own rates low; they are also
helping to keep market rates down by pumping
money into their economies.
• Despite all this money—and contrary to much
conventional wisdom—inflationary pressures
around the world are likely to remain weak. The
reason is that today’s economy is constrained by
the slow pace of growth in demand, not by supply.

What to do with all that cash?
17
targets while curtailing investment and sacrifi cing top-
line growth—not a formula for making shareholders
happy over the long term. CFOs face a further challenge
as well. Though they are punished by the market for
failing to protect against risk, they aren’t rewarded for
using the balance sheet strategically to strengthen the
business—particularly since such an approach wasn’t
necessary prior to the global fi nancial crisis.
Macro trends—and the opportunitiesfor growth
Against the backdrop of this business climate, we see
eight macro trends in the global economy that open
up major new growth opportunities (see Figure 3). We
won’t discuss them in detail here—for a full account, see
our report, “The great eight: Trillion-dollar growth trends
to 2020.” This brief summary, with the “great eight”
shown in italics, indicates the potential for growth.
Consumers. By 2020, the next billion consumers in devel-
oping nations will join the ranks of the global middle
class, earning more than $5,000 a year. Their purchasing
Companies with investment-grade ratings often fi nd
that they can borrow at a lower cost than many sovereign
nations, whose bonds were once thought to be nearly
risk-free. Companies in zones with highly valued
currencies—Europe, for instance—can take advantage
of their currency’s strength to invest overseas at bargain
rates. The job is to put all this money to work with the
goal of creating alpha—performance that outstrips
market indexes. By the same token, sitting on cash can
be a high-risk strategy when rivals are repositioning
themselves for growth.
Hurdle rates for corporate investments symbolize this
challenge. In our experience, many chief fi nancial offi -
cers (CFOs) have kept hurdle rates high relative to interest
rates in the post-crisis years, explaining that their caution
refl ects the general risks of an uncertain world and the
specifi c risk that interest rates would return to historically
normal levels. But lowering hurdle rates may actually
be a more appropriate move for an era of capital super-
abundance. Lowering them too far is always a danger, but
so is leaving them high. A company with high hurdle
rates may wind up perpetually meeting its earnings
Figure 2: The challenge: Investors expect companies to grow faster than the historical growth embedded in their business
US Europe Asia- Pacific
0
5
10
15
20
25%
Earnings growth (in %)
Note: Based on respective aggregate EPS consensus forecasts for S&P 500 (US), MSCI Europe (Europe), and FTSE Pacific (APAC)Source: Thomson Financial I/B/E/S; Bain analysis
6.1%
11.2%
5.4%
10.4%
7.5%
10.8%
Historicalearnings
Forecastedearnings
Historicalearnings
Forecastedearnings
Historicalearnings
Forecastedearnings
1995–2013 2014–2016
Growth expectations > historical performance
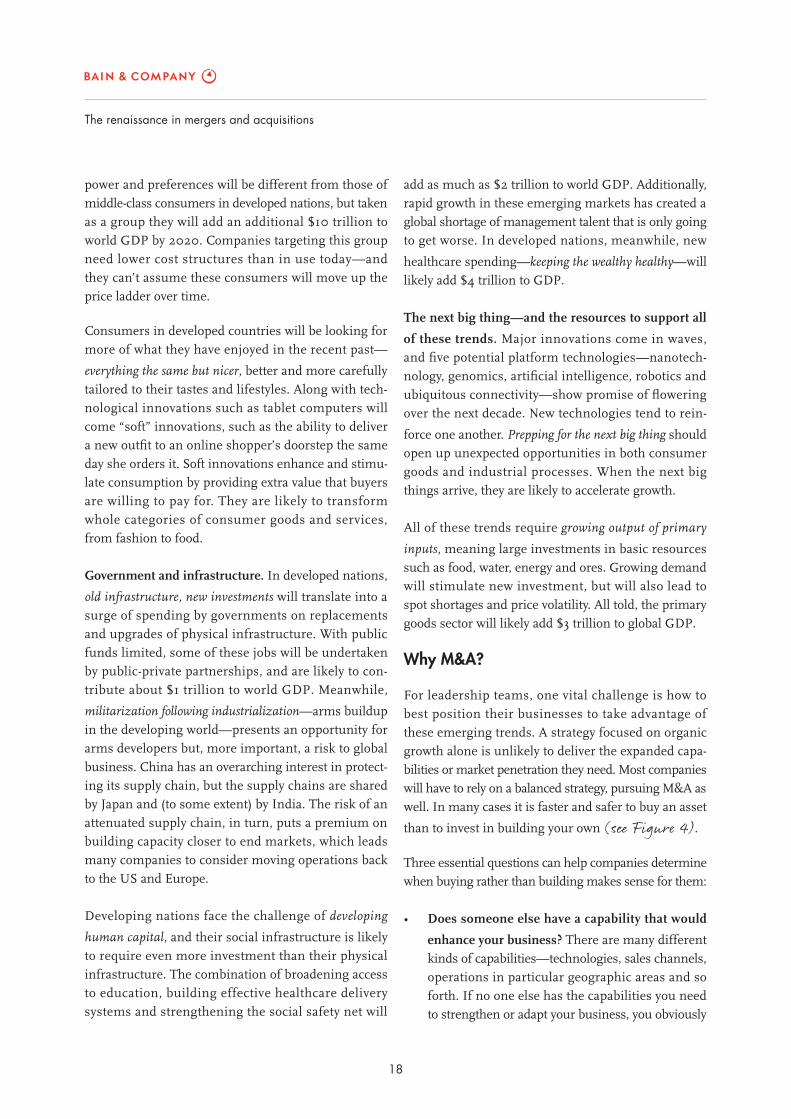
18
The renaissance in mergers and acquisitions
add as much as $2 trillion to world GDP. Additionally,
rapid growth in these emerging markets has created a
global shortage of management talent that is only going
to get worse. In developed nations, meanwhile, new
healthcare spending—keeping the wealthy healthy—will
likely add $4 trillion to GDP.
The next big thing—and the resources to support all
of these trends. Major innovations come in waves,
and fi ve potential platform technologies—nanotech-
nology, genomics, artifi cial intelligence, robotics and
ubiquitous connectivity—show promise of fl owering
over the next decade. New technologies tend to rein-
force one another. Prepping for the next big thing should
open up unexpected opportunities in both consumer
goods and industrial processes. When the next big
things arrive, they are likely to accelerate growth.
All of these trends require growing output of primary
inputs, meaning large investments in basic resources
such as food, water, energy and ores. Growing demand
will stimulate new investment, but will also lead to
spot shortages and price volatility. All told, the primary
goods sector will likely add $3 trillion to global GDP.
Why M&A?
For leadership teams, one vital challenge is how to
best position their businesses to take advantage of
these emerging trends. A strategy focused on organic
growth alone is unlikely to deliver the expanded capa-
bilities or market penetration they need. Most companies
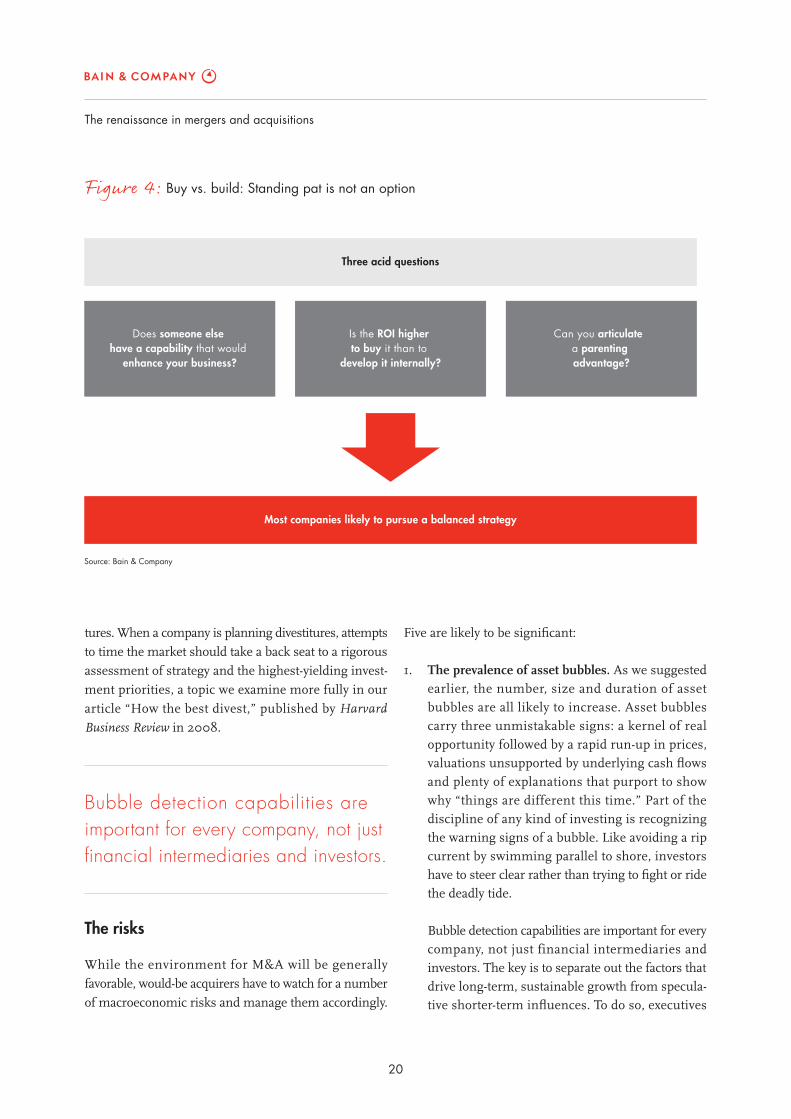
will have to rely on a balanced strategy, pursuing M&A as
well. In many cases it is faster and safer to buy an asset
than to invest in building your own (see Figure 4).
Three essential questions can help companies determine
when buying rather than building makes sense for them:
• Does someone else have a capability that would
enhance your business? There are many different
kinds of capabilities—technologies, sales channels,
operations in particular geographic areas and so
forth. If no one else has the capabilities you need
to strengthen or adapt your business, you obviously
power and preferences will be different from those of
middle-class consumers in developed nations, but taken
as a group they will add an additional $10 trillion to
world GDP by 2020. Companies targeting this group
need lower cost structures than in use today—and
they can’t assume these consumers will move up the
price ladder over time.
Consumers in developed countries will be looking for
more of what they have enjoyed in the recent past—
everything the same but nicer, better and more carefully
tailored to their tastes and lifestyles. Along with tech-
nological innovations such as tablet computers will
come “soft” innovations, such as the ability to deliver
a new outfi t to an online shopper’s doorstep the same
day she orders it. Soft innovations enhance and stimu-
late consumption by providing extra value that buyers
are willing to pay for. They are likely to transform
whole categories of consumer goods and services,
from fashion to food.
Government and infrastructure. In developed nations,
old infrastructure, new investments will translate into a
surge of spending by governments on replacements
and upgrades of physical infrastructure. With public
funds limited, some of these jobs will be undertaken
by public-private partnerships, and are likely to con-
tribute about $1 trillion to world GDP. Meanwhile,
militarization following industrialization—arms buildup
in the developing world—presents an opportunity for
arms developers but, more important, a risk to global
business. China has an overarching interest in protect-
ing its supply chain, but the supply chains are shared
by Japan and (to some extent) by India. The risk of an
attenuated supply chain, in turn, puts a premium on
building capacity closer to end markets, which leads
many companies to consider moving operations back
to the US and Europe.
Developing nations face the challenge of developing
human capital, and their social infrastructure is likely
to require even more investment than their physical
infrastructure. The combination of broadening access
to education, building effective healthcare delivery
systems and strengthening the social safety net will
What to do with all that cash?
19
• Do you have a “parenting advantage” in managing
the capability? Capabilities don’t exist in a vacuum;
they exist in organizations. If your organization is
better than anybody else at managing a particular
capability—perhaps because of your experience
with similar ones—you have a built-in advantage
over other potential acquirers. Nestlé, the global
leader in infant nutrition, was probably the best
possible corporate parent to buy Pfizer’s largely
orphaned baby formula business.
Of course, this analysis raises an obvious question. If
the environment for M&A is already favorable, why
has the pace of deal making been so slow during the
recovery from the fi nancial crisis? The chief reason in
our view is that sellers are holding back. Potential
divestors expect business valuations to increase, and
so are inclined to hold on to their assets for the time
being. But this is likely to change quickly, once sellers
come to see their assets as fully valued or once they
realize that they will be rewarded for prudent divesti-
have to grow them yourself. If the capabilities are
available, they may be candidates for acquisition.
When Comcast, the American cable TV giant,
concluded that it needed content to feed its cable
franchises, it bought NBC/Universal and the
libraries, production and news infrastructure that
came with it.
• Is the risk-adjusted rate of return higher if you
buy the capability than if you build it internally?
Every acquisition carries risks, but every investment
in organic growth also carries risks. The challenge
for companies’ fi nancial teams is to create apples-
to-apples comparisons for expected returns on
investments in organic vs. inorganic growth, fac-
toring in the risks on both sides as accurately as
possible. When Italian tire maker Pirelli wanted to
enter Russia, it concluded that buying a “brownfi eld”
plant and existing business was better than starting
from scratch in a notoriously diffi cult market for
launching a business.
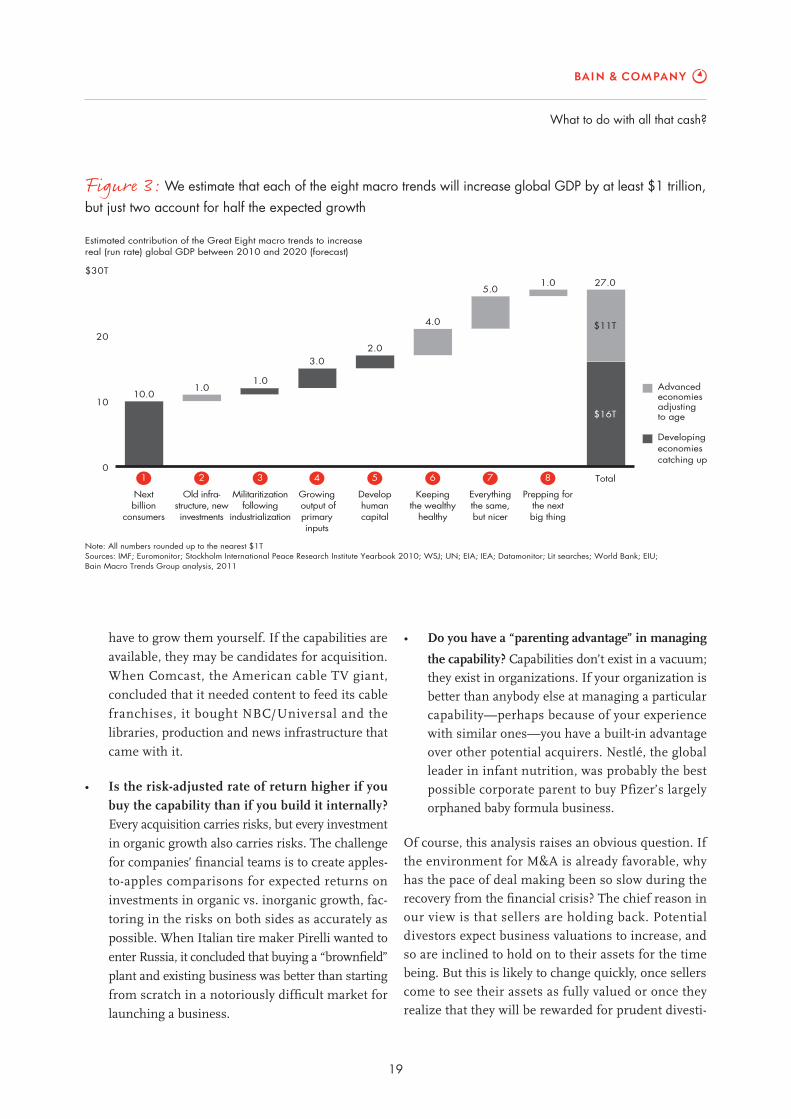
Figure 3: We estimate that each of the eight macro trends will increase global GDP by at least $1 trillion, but just two account for half the expected growth
Note: All numbers rounded up to the nearest $1TSources: IMF; Euromonitor; Stockholm International Peace Research Institute Yearbook 2010; WSJ; UN; EIA; IEA; Datamonitor; Lit searches; World Bank; EIU;Bain Macro Trends Group analysis, 2011
1 2 3 4 5 6 7 8 Total
Advancedeconomiesadjustingto age
Developingeconomiescatching up
Estimated contribution of the Great Eight macro trends to increasereal (run rate) global GDP between 2010 and 2020 (forecast)
Nextbillion
consumers
Develophumancapital
Militaritizationfollowing
industrialization
Growing output ofprimaryinputs
Keepingthe wealthy
healthy
Old infra�structure, newinvestments
Everythingthe same,but nicer
Prepping forthe nextbig thing
0
10
20
$30T
10.01.0
1.0
3.02.0
4.0
5.01.0
$11T
$16T
27.0
20
The renaissance in mergers and acquisitions
Five are likely to be signifi cant:
1. The prevalence of asset bubbles. As we suggested
earlier, the number, size and duration of asset
bubbles are all likely to increase. Asset bubbles
carry three unmistakable signs: a kernel of real
opportunity followed by a rapid run-up in prices,
valuations unsupported by underlying cash fl ows
and plenty of explanations that purport to show
why “things are different this time.” Part of the
discipline of any kind of investing is recognizing
the warning signs of a bubble. Like avoiding a rip
current by swimming parallel to shore, investors
have to steer clear rather than trying to fi ght or ride
the deadly tide.
Bubble detection capabilities are important for every
company, not just financial intermediaries and
investors. The key is to separate out the factors that
drive long-term, sustainable growth from specula-
tive shorter-term infl uences. To do so, executives
tures. When a company is planning divestitures, attempts
to time the market should take a back seat to a rigorous
assessment of strategy and the highest-yielding invest-
ment priorities, a topic we examine more fully in our
article “How the best divest,” published by Harvard
Business Review in 2008.
Bubble detection capabilities areimportant for every company, not just fi nancial intermediaries and investors.
The risks
While the environment for M&A will be generally
favorable, would-be acquirers have to watch for a number
of macroeconomic risks and manage them accordingly.
Figure 4: Buy vs. build: Standing pat is not an option
Source: Bain & Company
Most companies likely to pursue a balanced strategy
Three acid questions
Does someone else have a capability that would
enhance your business?
Is the ROI higher to buy it than to
develop it internally?
Can you articulate a parenting advantage?

What to do with all that cash?
21
keep domestic consumption relatively low and
investment levels high. Because of these policies,
China will likely have excess capital for both domes-
tic and international investment; indeed, Bain’s
Macro Trends Group expects it to contribute an
estimated $87 trillion to the growth in financial
assets by 2020, more than any other single country.
This will put upward pressure on domestic Chinese
assets available for sale to foreign investors. It may
also contribute to a variety of asset bubbles.
5. Increased supply chain risk. The world has grown
comfortable—possibly too comfortable—with the
decades-long trend toward ever-longer supply chains.
In the coming years, a variety of forces may com-
bine to reverse the trend. On the macroeconomic
front, productivity is increasing and the labor-cost
gap between developed and developing nations is
shrinking. On the microeconomic side, companies
are beginning to realize better returns from locating
production closer to consumer markets. Add in the
increased militarization of some Asian nations,
and you have several forces that may send the supply
chain trend in the opposite direction. The risk for
would-be acquirers, of course, is buying production
assets in faraway places just as the world is moving
in the opposite direction.
While M&A is a good strategy for most companies,
it is not easy or simple. The companies best positioned
to work through the issues described above in a disci-
plined manner are those with deep experience in M&A.
In Part III of this series, we return to our theme of the
virtues of a repeatable M&A model for success, which
we will lay out in further detail.
need deep knowledge of a business’s fundamentals
and its interaction with the broader environment.
In the recent US housing bubble, for instance,
homebuilders could have examined the demo-
graphics of the population and trends in income
growth. The widening gulf between income and
population growth (on the one hand) and the
market value of housing (on the other) was a clear
signal of an emerging bubble. The bigger, broader
and longer-lasting bubbles produced by abundant
capital may lead companies to assume that a two-
year or even three-year trend is real and permanent.
Businesses may then deploy real resources only
to have the bottom fall out before they can grace-
fully exit their position. The effects can quickly
become catastrophic.
2. Currency volatility. Currency is one of the largest
traded commodities in the world. It is subject
both to massive intervention by governments and
to long-term structural forces that alter its value
relative to other currencies and to underlying
baskets of goods and services. Every company’s
deal modeling should reflect both upside and
downside currency scenarios.
3. Captured cash. Though the world is awash in
capital, a large fraction may not be accessible to
home-market companies because of tax policies
and currency controls. This can lead to the odd
phenomenon of companies with signifi cant cash
on the balance sheet needing to borrow to complete
transactions or even to pay dividends. JPMorgan
Chase, which studied 600 US companies that
break out how much cash they hold overseas,
notes that foreign holdings represent about 60%
of these companies’ cash, much of it in US dollars.
Some companies have resorted to setting up listed
overseas affi liates to better use the captured cash
and tap into local liquidity. According to the same
bank, 50% of recent listings in Hong Kong have
been by overseas companies.
4. China as an exporter of capital. The Chinese gov-
ernment has deliberately pursued policies that


3. The renaissance in mergers and acquisitions: How to make your deals successful By David Harding, Richard Jackson and Phil Leung

Many leading companies have created a repeatable M&A capability and then turbo-charged their growth through a series of acquisitions. What all these acquirers have in common is sustained institutional invest-ment in this capability, much as if they were building a marketing or manufacturing func-tion from scratch.
How to make your deals successful
25
If you set out to build a globe-spanning, market-leading
beer company, you might not pick Johannesburg (South
Africa) or São Paulo (Brazil) as the launching pad. Yet
those two cities are exactly where the world’s two largest
brewers, SABMiller and Anheuser-Busch InBev, got
their start. The two companies have grown from mod-
est origins to world-straddling giants, with about 30%
of the global beer market between them.
The remarkable trajectories of these two businesses
hold a number of lessons. One is the fast-growing pres-
ence of companies from emerging markets. Another is
the power of cross-border acquisitions, and not just in
the direction of developed to developing countries. But
perhaps the most compelling lesson lies in how the
two companies achieved their current positions. Both
arrived where they are today using similar business
models: a repeatable method of mergers and acquisi-
tions (M&A) supported by a disciplined management
system. SABMiller, for instance, branched out from its
South African home into other African nations, Europe,
India, Latin America, the US and China—all by acquir-
ing local brewers.
In a world of superabundant capital, low interest rates and high investor expectations, M&A is one of the best tools available to companies to help them hit their growth targets.
In many ways, the two companies’ approach represents
the new normal for high-performing companies. Bain
has long tracked the activities of what we call sustained
value creators (SVCs)—companies that increase reve-
nue and earnings at least 5.5% a year over an 11-year
period, such as 2000 to 2010, while earning their cost
of capital. Our study of mergers and acquisitions dur-
ing this time frame showed that 9 out of 10 SVCs were
active in the deal market, and companies in this group
were more than twice as likely as other companies to
derive at least 75% of their market cap from M&A. That
fact is consistent with the broader fi ndings outlined in
Part I of this series, which show that frequent material
acquirers earn higher returns than bystanders. The use
of M&A, moreover, is likely to grow. In a world of super-
abundant capital, low interest rates and high investor
expectations, M&A is one of the best tools available to
companies to help them hit their growth targets, as we
detailed in Part II of the series.
If you agree that M&A creates shareholder value and
that the deal-making environment is likely to be favor-
able for some time to come, you can turn your attention
to three important questions:
• First, how can you tell when a prospective transaction
is a good one for your company? Most companies
will have many likely candidates; the challenge is
to fi nd the right deal for your business.
• Second, should you be looking for scale deals or
scope deals? As we’ll see, the balance between the
two depends partly on your experience in M&A.
• Third, how can you create a repeatable model for
M&A success? As SABMiller and Anheuser-Busch
InBev have learned, along with many others, the
“virtuous circle of M&A repeatability” requires a
signifi cant investment in training, culture and ana-
lytics. But the rewards are also substantial.
How do you recognize a good deal for your company?
A merger or an acquisition can succeed if and only if
it supports your company’s strategy.
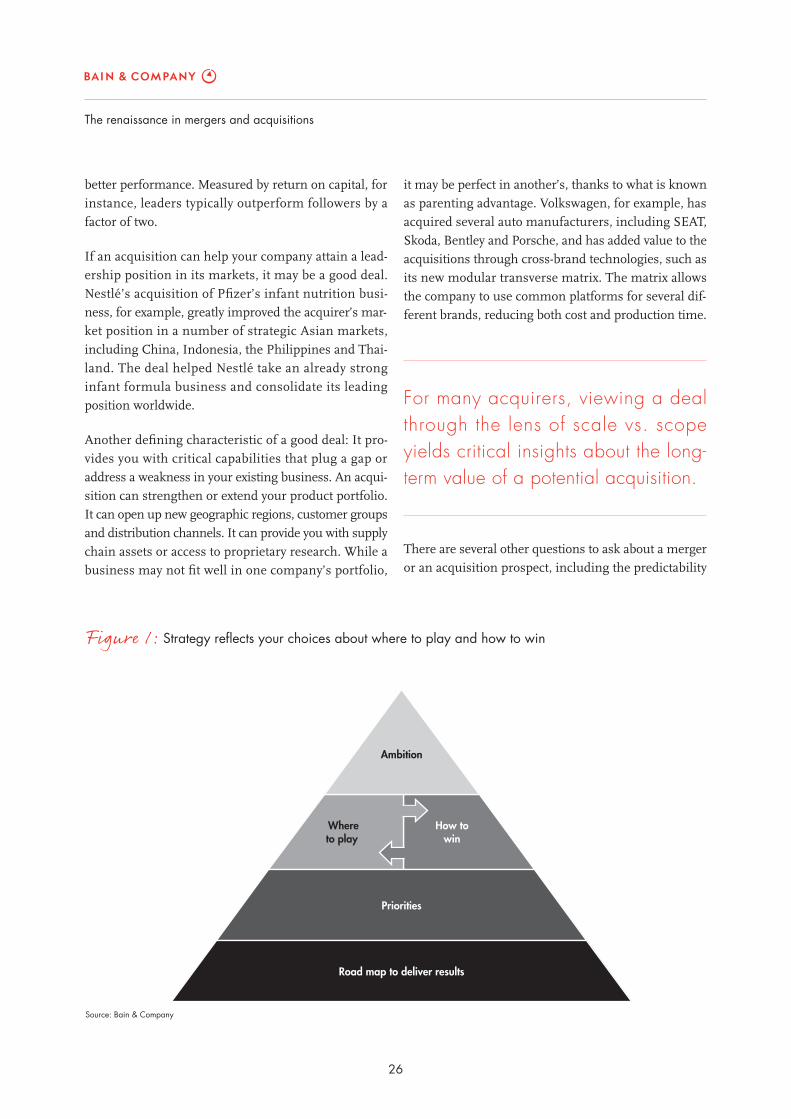
Strategy defi nes how you realize your ambition for the
company (see Figure 1). A company needs to deter-
mine the markets in which it will compete. It must
develop the differentiated capabilities that enable it to
outperform the competition. Most often, winning strat-
egies aim to create leadership economics. Market leaders
generally have lower costs than their competitors. They
often enjoy greater pricing power, brand recognition
and differentiation. These advantages translate into
26
The renaissance in mergers and acquisitions
it may be perfect in another’s, thanks to what is known
as parenting advantage. Volkswagen, for example, has
acquired several auto manufacturers, including SEAT,
Skoda, Bentley and Porsche, and has added value to the
acquisitions through cross-brand technologies, such as
its new modular transverse matrix. The matrix allows
the company to use common platforms for several dif-
ferent brands, reducing both cost and production time.
For many acquirers, viewing a deal through the lens of scale vs. scope yields critical insights about the long-term value of a potential acquisition.
There are several other questions to ask about a merger
or an acquisition prospect, including the predictability
better performance. Measured by return on capital, for
instance, leaders typically outperform followers by a
factor of two.
If an acquisition can help your company attain a lead-
ership position in its markets, it may be a good deal.
Nestlé’s acquisition of Pfi zer’s infant nutrition busi-
ness, for example, greatly improved the acquirer’s mar-
ket position in a number of strategic Asian markets,
including China, Indonesia, the Philippines and Thai-
land. The deal helped Nestlé take an already strong
infant formula business and consolidate its leading
position worldwide.
Another defi ning characteristic of a good deal: It pro-
vides you with critical capabilities that plug a gap or
address a weakness in your existing business. An acqui-
sition can strengthen or extend your product portfolio.
It can open up new geographic regions, customer groups
and distribution channels. It can provide you with supply
chain assets or access to proprietary research. While a
business may not fi t well in one company’s portfolio,
Figure 1: Strategy refl ects your choices about where to play and how to win
Priorities
Road map to deliver results
Ambition
Whereto play
How towin
Source: Bain & Company
How to make your deals successful
27
Today, the verdict is in. Inexperienced acquirers tend to
focus mainly on scale deals, those that improve or con-
solidate their position in a given market. Experienced
acquirers average a 50-50 mix of scale and scope deals,
improving their market positions while also adding
product lines, geographic reach or other important
capabilities. Figure 2 highlights that contrast: It com-
pares what we call “Mountain Climbers”—frequent
acquirers whose acquisitions amount to at least 75% of
their market cap—with “Large Bets,” companies mak-
ing occasional big acquisitions. A recent Bain survey
shows how much more confident these experienced
acquirers are: Asked about moving into an adjacent
market, 73% felt that M&A was likely to be as success-
ful or more successful than building a business from
scratch. Only 55% of inexperienced acquirers felt the
same way. And it is the experienced acquirers, as our
research shows, that usually turn in the best results.
Different patterns of risk and reward accompany each
kind of deal. Scale deals, historically, have put cost
of the target’s cash fl ows and how the market views the
asset. (See the sidebar, “What makes an asset worth buy-
ing? A checklist.”) Your own company’s situation affects
the answers, however, because a deal that makes sense
for a strong company may not have good odds of success
for a weaker one. Financially healthy companies can
afford the time required for careful due diligence. They
can invest more in successful post-merger integration.
Scale or scope?
For many acquirers, viewing a deal through the lens of
scale vs. scope yields critical insights about the long-
term value of a potential acquisition. Scale deals involve
a high degree of business overlap between the target
and acquirer, fueling a company’s expansion in its ex-
isting business. In scope deals, the target is a related
but distinct business, enabling an acquirer to enter a
new market, product line or channel. Both can be use-
ful—and “scale vs. scope” has been a great debate in
the M&A world.
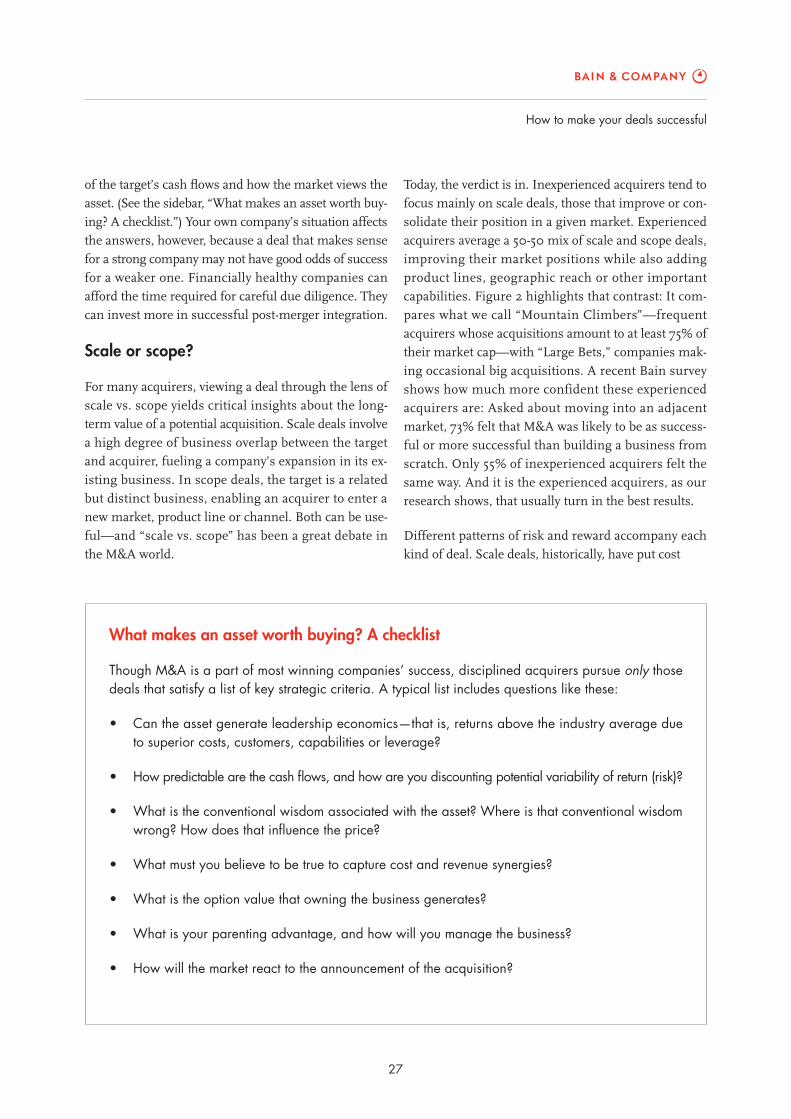
What makes an asset worth buying? A checklist
Though M&A is a part of most winning companies’ success, disciplined acquirers pursue only those deals that satisfy a list of key strategic criteria. A typical list includes questions like these:
• Can the asset generate leadership economics—that is, returns above the industry average due to superior costs, customers, capabilities or leverage?
• How predictable are the cash fl ows, and how are you discounting potential variability of return (risk)?
• What is the conventional wisdom associated with the asset? Where is that conventional wisdom wrong? How does that infl uence the price?
• What must you believe to be true to capture cost and revenue synergies?
• What is the option value that owning the business generates?
• What is your parenting advantage, and how will you manage the business?
• How will the market react to the announcement of the acquisition?

28
The renaissance in mergers and acquisitions
What the most successful acquirers have in common is sustained institutional investment in an M&A capability, much as if you were building a marketing or manufacturing function from scratch.
SABMiller illustrates the advantages of experience, par-
ticularly in cross-border deals. The company has moved
into more than 30 countries in the last 20 years, in
nearly every case by acquiring local brands. It main-
tains and develops these brands, refl ecting the industry
axiom that all beer is local. (“You can’t be a real country
unless you have a beer and an airline,” declared the late
rocker Frank Zappa, a quote SABMiller used in a 2013
presentation highlighting its broad portfolio of brands.)
At the same time it has created a disciplined business
synergies at the top of the deal thesis: If we buy this
company, we will have a larger presence in the market and
realize greater economies of scale. The risk is that the acquirer
winds up creating a slow-moving behemoth and the
synergies never materialize. Scope deals, by contrast,
usually put growth at the top of the deal thesis: Buying
this company gives us access to new and faster-growing
markets. The risk here is that the acquirer will stumble
as it learns to manage an unfamiliar business. Because
of the intrinsic differences between scale deals and scope
deals, every element of the deal cycle, from strategy
through integration, has to be managed differently. Scale
deals succeed on the basis of rapid overall integration,
capture of cost synergies and full cultural integration.
Scope deals succeed when the acquirer preserves the
unique attributes of the company it has just bought,
integrating the two only where it matters—and when
the two businesses begin to cross-pollinate, creating
platforms for future growth. As an acquiring company
becomes more experienced, it learns the differences
between scale and scope deals, and can thereby manage
the risks and maximize the benefi ts.
Figure 2: Almost half the deals done by “Mountain Climbers” are scope deals
Note: Analysis of deals valued at more than $250 million by 194 companies classified as “Mountain Climbers” (n=117) and “Large Bets” (n=77) from 2000–2010Sources: Bain M&A study 2012; Dealogic; Thomson; Bain SVC database 2011; Bain analysis
0
20
40
60
80
100%
Percentage of deals by primary deal rationale
Large Bets
Scale78%
Scope22%
124
Mountain Climbers
Scale54%
Scope46%
388
How to make your deals successful
29
services. Its business development offi ce ensures
a strong, ongoing connection between M&A and
strategy, linking the company’s accumulated deal-
making experience to strategic decisions. The offi ce
asks three critical questions about each potential
acquisition: Does it build on or extend a capability
IBM already has? Does it have scalable intellectual
property? Can it take advantage of our reach into
170 countries?
IBM’s offi ce is also responsible for working with
M&A service providers and maintaining liaisons
with business units. It also measures and tracks
the results of each deal, essentially creating an M&A
learning organization.
2. Accountability for new business activity lodged with
the business units. Business units can come to cor-
porate with ideas for deals, but they must own the
process of managing the business. At Illinois Tool
Works, a diversifi ed manufacturer that routinely
buys small and medium-sized companies to expand
its operations, business unit leaders are tasked with
identifying new M&A opportunities to pursue in
their respective business lines. In recent years, for
example, the company built its car-care business
group with acquisitions of a number of brands of
car wash, wax and other maintenance products.
3. A commitment to differentiated due diligence.
Many companies don’t start due diligence on an
acquisition target until they receive an offering
memorandum from an investment bank. H.J. Heinz
takes a different approach. On key strategic areas,
the company systematically assesses potential ac-
quisitions before they are actively shopped. That
way, executives have a sophisticated point of view
on the asset’s value when it comes on the market.
Heinz’s disciplined process leads to a higher per-
centage of proprietary deals. The company also
establishes a fi rm walk-away price for each prospec-
tive deal, and it plans post-merger integration from
the beginning. Heinz’s due diligence is linked to
its deal thesis at all times, which helps to maintain
discipline during the entire process.
system that enables it to add value to each acquisition.
Global procurement and shared brewing techniques
reduce cost. An innovation tool called SmartGate facil-
itates the introduction of new products in each market.
Eight cooperatively developed “SABMiller Ways” defi ne
best practices in marketing, brand management, talent
development and other facets of the business, and are
rigorously applied to local operations.1
Anheuser-Busch InBev, which traces its managerial
origins to a small Brazilian brewer, incorporates similar
disciplines and has been equally successful with its M&A
strategy. The two companies have become experts at
what are essentially scope deals, because most moves
into a new country are likely to involve new value prop-
ositions, new supply chains, new distribution channels
and so on. No coincidence, both companies have re-
markable records of profi table growth.
Building a repeatable M&A capability
The brewers are hardly alone. Many leading companies
have created a repeatable M&A capability and then turbo-
charged their growth through a series of acquisitions.
What all these acquirers have in common is sustained
institutional investment in this capability, much as if
they were building a marketing or manufacturing func-
tion from scratch.
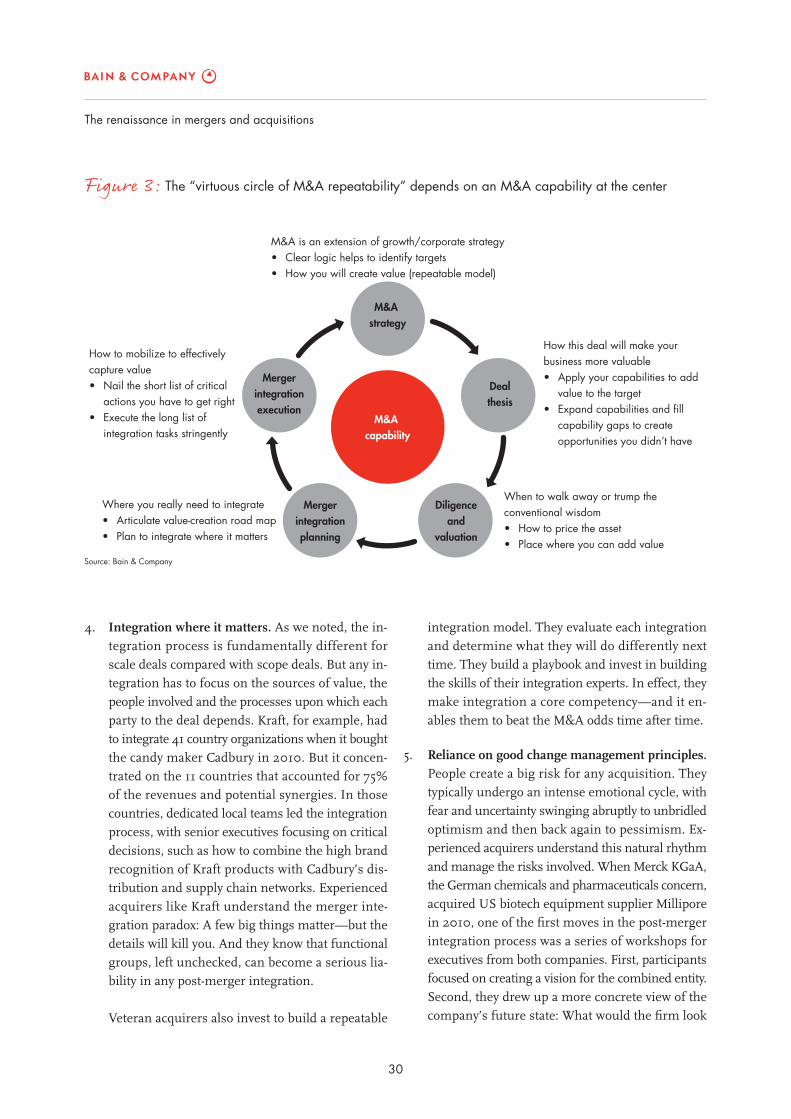
One way of picturing the capability is to think of the
acquisition process as a cycle of steps repeated with
each deal—a virtuous cycle of M&A repeatability, so to
speak (see Figure 3). The key for the purposes of this
article is the red circle in the middle of the figure,
without which the other steps are more likely to fail.
Let’s look at the elements a company must put in place
if it wants to build this kind of M&A capability:
1. A strong business development offi ce at the center,
typically with close links to the company’s strategy
group, CEO and board. IBM’s offi ce is a great ex-
ample. The company has completed more than
140 deals since 2000, acquisitions that played an
important role in redirecting the company’s busi-
ness toward higher-value, more profi table technol-
ogies and market opportunities in software and
30
The renaissance in mergers and acquisitions
integration model. They evaluate each integration
and determine what they will do differently next
time. They build a playbook and invest in building
the skills of their integration experts. In effect, they
make integration a core competency—and it en-
ables them to beat the M&A odds time after time.
5. Reliance on good change management principles.
People create a big risk for any acquisition. They
typically undergo an intense emotional cycle, with
fear and uncertainty swinging abruptly to unbridled
optimism and then back again to pessimism. Ex-
perienced acquirers understand this natural rhythm
and manage the risks involved. When Merck KGaA,
the German chemicals and pharmaceuticals concern,
acquired US biotech equipment supplier Millipore
in 2010, one of the fi rst moves in the post-merger
integration process was a series of workshops for
executives from both companies. First, participants
focused on creating a vision for the combined entity.
Second, they drew up a more concrete view of the
company’s future state: What would the fi rm look
4. Integration where it matters. As we noted, the in-
tegration process is fundamentally different for
scale deals compared with scope deals. But any in-
tegration has to focus on the sources of value, the
people involved and the processes upon which each
party to the deal depends. Kraft, for example, had
to integrate 41 country organizations when it bought
the candy maker Cadbury in 2010. But it concen-
trated on the 11 countries that accounted for 75%
of the revenues and potential synergies. In those
countries, dedicated local teams led the integration
process, with senior executives focusing on critical
decisions, such as how to combine the high brand
recognition of Kraft products with Cadbury’s dis-
tribution and supply chain networks. Experienced
acquirers like Kraft understand the merger inte-
gration paradox: A few big things matter—but the
details will kill you. And they know that functional
groups, left unchecked, can become a serious lia-
bility in any post-merger integration.
Veteran acquirers also invest to build a repeatable
Figure 3: The “virtuous circle of M&A repeatability” depends on an M&A capability at the center
Source: Bain & Company
M&A is an extension of growth/corporate strategy• Clear logic helps to identify targets • How you will create value (repeatable model)
How to mobilize to effectivelycapture value• Nail the short list of critical actions you have to get right• Execute the long list of integration tasks stringently
M&A capability
M&A strategy
Dealthesis
Mergerintegrationexecution
Diligenceand
valuation
Mergerintegrationplanning
How this deal will make yourbusiness more valuable• Apply your capabilities to add value to the target• Expand capabilities and fill capability gaps to create opportunities you didn’t have
Where you really need to integrate• Articulate value-creation road map• Plan to integrate where it matters
When to walk away or trump theconventional wisdom• How to price the asset• Place where you can add value

How to make your deals successful
31
Looking ahead
Our three-part analysis of M&A points to a few key insights.
One is this: You ignore deal making at your peril. Com-
panies that did no acquisitions between 2000 and 2010
turned in poorer performance than the deal makers.
The more deals a company did, and the more material
those deals were, the better its performance was likely
to be.
A second conclusion is that the business environment
has rarely been more favorable for M&A. Capital is
superabundant and interest rates are low. The world
economy abounds with big opportunities. Buying into
a market is often a company’s best tool for tapping into
that growth potential.
The third conclusion—the subject of this article—is that
M&A winners develop a repeatable model. They can do
one deal after another and integrate each one success-
fully because they have created the necessary capability
in their organizations. SABMiller and Anheuser-Busch
InBev show what’s possible: Both companies launched
their business in relatively small developing markets,
and then expanded into one country after another.
Today they straddle the globe.
Not every company has what it takes to pursue M&A
successfully. The best have a deep understanding of their
strategy and begin from a position of strength. They
commit to developing a repeatable model, and they make
the necessary investments. Their reward, as we have
seen, is growth—in revenue, earnings and total share-
holder return—that far outstrips the competition.
like fi ve years down the road? Third, they defi ned
the initiatives required to achieve full potential.
When the vision, the future state and the fi rm’s full
potential are crafted with full participation by all
members of the leadership team, the odds of suc-
cess increase dramatically.
These fi ve components are the building blocks of a re-
peatable M&A model that can foster steady, profi table
growth. It’s been a successful formula for Godrej Con-
sumer Products, the India-based maker of household
and personal-care items. Recognizing that M&A was
essential to its global growth goals, the company pre-
pared for two years before setting foot in the deal mar-
ket. It assembled a strong M&A team. It developed a
playbook that included a rigorous screening process to
identify appropriate acquisition candidates. It followed
a disciplined M&A approach based on a strong under-
standing of each market, a robust deal thesis and det-
ailed due diligence. Godrej focuses on emerging market
deals and just three categories of products (household
insecticides, hair color and personal cleanliness). It targets
companies with leading positions in their markets,
knows how it expects to create value from each deal
and takes a tailored approach to integration. The company’s
11 acquisitions outside India since 2005 include large
deals such as Megasari, Indonesia’s second-biggest
household insecticides company.
This disciplined M&A strategy contributed to Godrej’s
consistently strong performance between 2002 and 2012:
sales growth averaging 27% a year and earnings growth
averaging 33%. The share price rose 42% over the same
period, outperforming peers and resulting in a more than
45-fold increase in the company’s market capitalization.
1 See SABMiller Annual Report 2008, http://www.sabmiller.com/fi les/reports/ar2008/2008_annual_report.pdf
See SABMiller CAGNY presentation, February 19, 2013, pp. 19, 50, http://www.sabmiller.com/index.asp?pageid=70


Shared Ambit ion, True Re sults
Bain & Company is the management consulting fi rm that the world’s business leaders come to when they want results.
Bain advises clients on strategy, operations, technology, organization, private equity and mergers and acquisitions.
We develop practical, customized insights that clients act on and transfer skills that make change stick. Founded
in 1973, Bain has 50 offi ces in 32 countries, and our deep expertise and client roster cross every industry and
economic sector. Our clients have outperformed the stock market 4 to 1.
What sets us apart
We believe a consulting fi rm should be more than an adviser. So we put ourselves in our clients’ shoes, selling
outcomes, not projects. We align our incentives with our clients’ by linking our fees to their results and collaborate
to unlock the full potential of their business. Our Results Delivery® process builds our clients’ capabilities, and
our True North values mean we do the right thing for our clients, people and communities—always.

For more information, visit www.bain.com


