1 THE REPERCUSSIONS ON SMALL BANKS AND SMALL BUSINESSES OF BANK CAPITAL AND LOAN GUARANTEES DIANA HANCOCK Assistant Director, Division of Research and Statistics Mail Stop #153 Board of Governors of the Federal Reserve System Washington, DC 20551 JOE PEEK Gatton Endowed Chair in International Banking and Financial Economics School of Management – Finance 437C Gatton College of Business University of Kentucky Lexington, Kentucky 40506-0034 JAMES A. WILCOX Ψ Kruttschnitt Family Professor of Financial Institutions Haas School of Business 545 Student Services Building, #1900 University of California, Berkeley Berkeley, California 94720 1.510.642.2455 [email protected]ABSTRACT Small businesses rely on banks for credit more than do large businesses. As a result, small businesses may be more adversely affected when adverse shocks, such as reduced bank capital or higher interest rates, reduce the supply of bank loans. We use annual, state- level data for 1990-2000 to estimate: (1) how much lower bank capital and higher interest rates affected businesses of various sizes, (2) how much SBA-guaranteed loans cushioned small businesses in particular and the economy more generally, and (3) whether the effects were larger during recessions and when interest rates were high. Lower bank capital and higher interest rates reduced bank lending, economic growth, employment, and payrolls at businesses of all sizes. Furthermore, lower bank capital at small banks impinged more on small businesses than on large businesses. The results also provide strong, but not conclusive, evidence that SBA-guaranteed loans raised economic growth rates, employment, wages and salaries, and nonfarm proprietors’ incomes. SBA- guaranteed loans were less procyclical and less affected by capital pressures on banks than were non-guaranteed loans. As a result, SBA guarantees tended to stabilize the economy, apparently by partially offsetting the reductions in banks’ lending due to recessions and bank capital pressures. In addition, when economic growth was slower or interest rates were higher, the effects on small businesses of a given change in bank capital, loan delinquencies, and SBA-guaranteed loans were larger. Ψ We thank Allen Berger, Luis Dopico, Charles Ou, Greg Udell, and seminar participants at the Federal Reserve Bank of San Francisco and the University of Kentucky for helpful comments and suggestions. Carolina Marquez and Laura Kawano provided superb research assistance. We thank the Office of Advocacy of the U.S. Small Business Administration for financial support. The views expressed here are those of the authors and do not necessarily reflect the opinions of the Board of Governors of the Federal Reserve System or its staff, the U.S. Small Business Administration or its Office of Advocacy.
Transcript
1
THE REPERCUSSIONS ON SMALL BANKS AND SMALL BUSINESSES OF BANK CAPITAL AND LOAN GUARANTEES
DIANA HANCOCK
Assistant Director, Division of Research and Statistics Mail Stop #153
Board of Governors of the Federal Reserve System Washington, DC 20551
JOE PEEK
Gatton Endowed Chair in International Banking and Financial Economics School of Management – Finance 437C Gatton College of Business
University of Kentucky Lexington, Kentucky 40506-0034
JAMES A. WILCOX
Ψ Kruttschnitt Family Professor of Financial Institutions
Haas School of Business 545 Student Services Building, #1900
University of California, Berkeley Berkeley, California 94720
Small businesses rely on banks for credit more than do large businesses. As a result, small businesses may be more adversely affected when adverse shocks, such as reduced bank capital or higher interest rates, reduce the supply of bank loans. We use annual, state-level data for 1990-2000 to estimate: (1) how much lower bank capital and higher interest rates affected businesses of various sizes, (2) how much SBA-guaranteed loans cushioned small businesses in particular and the economy more generally, and (3) whether the effects were larger during recessions and when interest rates were high.
Lower bank capital and higher interest rates reduced bank lending, economic growth, employment, and payrolls at businesses of all sizes. Furthermore, lower bank capital at small banks impinged more on small businesses than on large businesses. The results also provide strong, but not conclusive, evidence that SBA-guaranteed loans raised economic growth rates, employment, wages and salaries, and nonfarm proprietors’ incomes. SBA-guaranteed loans were less procyclical and less affected by capital pressures on banks than were non-guaranteed loans. As a result, SBA guarantees tended to stabilize the economy, apparently by partially offsetting the reductions in banks’ lending due to recessions and bank capital pressures. In addition, when economic growth was slower or interest rates were higher, the effects on small businesses of a given change in bank capital, loan delinquencies, and SBA-guaranteed loans were larger.
Ψ We thank Allen Berger, Luis Dopico, Charles Ou, Greg Udell, and seminar participants at the Federal Reserve Bank of San Francisco and the University of Kentucky for helpful comments and suggestions. Carolina Marquez and Laura Kawano provided superb research assistance. We thank the Office of Advocacy of the U.S. Small Business Administration for financial support. The views expressed here are those of the authors and do not necessarily reflect the opinions of the Board of Governors of the Federal Reserve System or its staff, the U.S. Small Business Administration or its Office of Advocacy.
2
INTRODUCTION
Governments around the world provide many billions of dollars annually for the
support of small and young businesses (Cressy 2000, 2002). Relative to the rates imposed on
large businesses, tax codes often incorporate provisions that lower the effective average tax
rates on small businesses. Regulations pertaining to labor, health and safety, and the
environment sometimes are tilted in favor of small and young businesses. In the financial
sphere, public sector programs, such as loan guarantees and venture capital trusts, tend to
offer more generous financial terms and conditions to small and young businesses than would
otherwise be available to them from private sector investors and lenders.
Among the justifications that are typically given for public sector financial programs
that support small businesses are the especially large credit market imperfections that are said
to stem from the greater difficulties of ascertaining the quality of smaller borrowers and their
projects. These greater difficulties translate then into greater informational asymmetries
between small and young businesses and their lenders than is the case for large and old
businesses. A second justification is that the public sector wants to spur the innovations by
small businesses, which often provide positive externalities. On this view, since the rents from
such innovations can only partly be captured by the firms themselves, public sector support
for small businesses raises overall economic efficiency by increasing the supply of financing
available to fund innovations. Public sector support for small businesses is further justified
sometimes by appealing to arguments that small businesses disproportionately account for job
creation.
Cressy (2002) observes that there is no consensus among economists that public sector
support for small businesses is clearly desirable. Instead, he concludes that consensus may well
develop around the removal of public sector support of financing small businesses. More
specifically, De Marco (2002) argues that subsidizing credit at small businesses may reduce
economic efficiency and that the inefficiencies are larger when entrepreneurs tend to be overly
optimistic.
Public sector support for small businesses would be difficult to justify in the absence of
evidence that the private sector provides inefficient amounts, terms, and conditions of credit to
small businesses or, at least, in that regard are less efficient than a realistic public sector
alternative. An essential function of banks is to reduce the informational asymmetries between
potential borrowers and lenders. Banks reduce the informational advantages that business owners
3
and managers (insiders) have over lenders (outsiders) in part by developing banking
relationships, which produce information to lenders that is otherwise even more difficulty and
costly to garner about borrowers and their projects. Banking relationships convey information
that emerges over time and over various aspects of borrowers and lenders connections to each
other. Thus, banking relationships often involve not just information about past loan
performance, but also information gleaned from businesses’ deposit and other banking records.
As compared with arms’ length lending, relationship lending tends to rely relatively more on
qualitative, as opposed to quantitative, standards and performance.
Berger and Udell (2002) have been the leading proponents that lending to small
businesses is largely based on the “soft” information that banking relationships often produce.
Such information then allows banks to base their lending more on the credibility of individual
borrowers and qualitative judgments about their projects, as opposed to basing lending decisions
more narrowly on quantifiable lending standards, past performance, and assessments of potential
projects. Cole, Goldberg and White (2004) found that larger banks based their small business
lending decisions on standard criteria derived from business financial statements, while smaller
banks relied far more on appraisals of the character of borrowers. These differences could
importantly contribute to the cyclical patterns in lending to smaller businesses.
Banking relationships are sometimes based on multi-period experiences with borrowers
and often, implicitly or explicitly, involve multi-period terms, conditions, and availability of
credit.1 Thus, banking relationships can help reduce informational asymmetries and thereby
increase the supply of bank credit to small businesses.2 Indeed, we observe that banks are the
chief source of credit from financial institutions for small businesses (Mach and Wolken 2006).
We also observe that small businesses tend to rely more on bank lending for credit than large
firms do.3
Still, the market response to the financing needs of small businesses – relationship
lending – may not completely eliminate credit market imperfections that affect small businesses.
One reason is that younger firms may not be able to fully participate in the benefits of banks’
1 Using U.S. data, Berger and Udell (1998, Table 2) estimate that small businesses have relationships with their banks for over nine years on average. 2 For example, using data from the National Survey of Small Business Finances conducted by the Federal Reserve and the Small Business Administration, Petersen and Rajan (1994) show that the primary benefit of building close ties with an institutional creditor is an increase in the availability of financing. 3 Small businesses are financed in many ways. Important sources of funds are their owners’ savings; loans from family, friends, and financial institutions; and trade credit from larger businesses (Calomiris, Himmelberg, and Wachtel 1995). According to data for 1998, more than four out of five small businesses used some type of formal
4
relationship lending policies. Because lending relationships may require extended periods of time
to develop, young businesses and businesses that had not previously wanted to borrow from
institutional lenders may not have access to terms, conditions, and access that are accorded to
older businesses or to experienced bank borrowers. Further, smaller businesses may not have
sufficient potential even over many periods to be large enough borrowers to warrant banks’
incurring the considerable fixed, or quasi-fixed, costs that arise in producing information. Thus,
as a long-running matter, businesses with less experience borrowing from banks and small
businesses may face reduced supplies of credit. These same considerations that tend to reduce
the supply of bank credit would likely impinge with even greater force on the supply of credit
from capital markets. The resulting dependence of small businesses on banks for credit suggests
that small businesses are likely to be especially vulnerable to adverse shocks to banks and to
tighter monetary policies, which reverberate through banks.
In this study, we use annual, state-level, U.S. data for banks and small businesses for
1990-2000 to estimate: (1) how much lower bank capital and higher interest rates affected small
businesses of various sizes, (2) how much Small Business Administration (SBA)-guaranteed
loans cushioned the real activities of small businesses in particular and the economy more
generally, and (3) whether the sizes of these effects were larger during recessions or when
interest rates were higher.
We present evidence that bank capital had significant effects on small businesses and that
those effects tended to be larger for the smaller of small businesses. Bank capital effects also
tended to be larger for smaller banks. We also present evidence that SBA-guaranteed loans
increase economic growth rates, employment, wages and salaries, and nonfarm proprietors’
incomes. Because SBA-guaranteed loans were less procyclical and less affected by bank
conditions than were non-guaranteed loans, SBA lending programs may have contributed to
stabilizing the economy.
Because their costs and clienteles may differ systematically from those of larger
businesses, small businesses also may be differentially affected by recessions. Although the U.S.
economy suffered only one national recession during the 1990s, the strength of the economies of
individual states varied considerably over the decade. By exploiting the cross-sectional, as well
as time series, variations in economic growth rates for individual states for the years 1990-2000,
credit, with commercial banks being the leading supplier of funds to small businesses (U.S. Small Business Administration 2003a).
5
we can estimate the effects on small and on large businesses of banking conditions, monetary
policy, and other factors.
The effects of banking conditions, monetary policy, economic growth, and SBA-
guaranteed loans on small businesses may change as economic conditions change. If so, their
current (and likely future) effects are likely to depend on the prevailing interest rates and
economic growth rates and thus to differ from their past, average effects. To allow for the
possibility that the magnitudes of these effects vary with economic conditions, we separately
estimate effects for periods when monetary policy was tighter and when national economic
growth was slower. Indeed, the estimated effects did vary considerably with interest rates and
economic growth rates. These differences suggest that estimates of current and future effects of
bank conditions, monetary policy, and of other factors on small businesses improve by allowing
for these differences.
The remainder of the study is organized as follows. Section I reviews the evidence on the
effects of financial sector disruptions on smaller businesses. Section II describes the specific
hypotheses that our estimates address. Section III describes the data, while Section IV reports our
regression estimates. Section V summarizes our findings.
I. LITERATURE REVIEW
FINANCIAL SECTOR DISRUPTIONS, BANKS’ LOAN SUPPLY, AND SMALL BUSINESSES
During the 1990s, a number of studies documented that lending to small businesses and
the economic activity of small businesses were affected by financial sector disruptions, such as
the widespread merging of banks of all sizes and the capital shortfalls occasioned by large loan
losses. Peek and Rosengren (1998a, 1998b) showed that the mergers of commercial banks tended
to reduce lending to small businesses more than to other borrowers. Hancock and Wilcox (1998),
estimating the effects on small businesses of several aspects of the financial sector, found that the
widespread bank capital crunch around 1990 had larger effects on smaller banks than on larger
banks. Since smaller businesses tend to deal more with smaller banks, capital-related reductions
in lending were greater at smaller businesses. Berger and Udell (1996) argued that financial
innovation and changes in bank regulations during the 1980s and 1990s may have made banks
less willing to lend to small firms.
The Federal Reserve’s monetary tightenings that began in the late 1980s, in the middle of
the 1990s, and again in the late 1990s may well have impinged more on small businesses. Small
businesses also may have reacted more than did large businesses to changes in other costs, terms,
6
and availability of bank credit. In fact, small businesses did seem to have been affected more by
shocks to bank capital and by changes in banks’ lending standards during the 1990-1991
recession (see Hancock and Wilcox 1998). In addition, adverse conditions at small banks may
have impinged more on small businesses than on large businesses.
The Hancock and Wilcox (1998) findings are consistent with the findings by Kashyap
and Stein (1994a, 1994b, 2000) that the behavior of smaller banks is more informative about
how banking conditions influence the macroeconomy. Similarly, Kishan and Opiela (2000) find
that the extent to which bank lending responds to changes in monetary policy differs by bank
size and by banks’ capital ratios, with smaller banks and banks with lower capital ratios reducing
loans by larger amounts in response to tightenings of monetary policy during the 1980-1995
period. Hancock and Wilcox (1998) connected such lending patterns to distributional effects on
economic activity, reporting that capital shortfalls at smaller banks restrained real economic
activity more at smaller than at larger businesses during the 1989-1992 period. By their
estimates, the numbers, employment, and payrolls of smaller businesses fell more in response to
capital shortfalls at smaller banks. Concomitantly, the larger the reductions in capital and in
lending at smaller banks in a state, the larger were the reductions in their broadest measure of
local economic activity, gross state product (GSP).
Hancock and Wilcox (1998) also found that, in the face of the bank capital crunch, the
amounts of SBA-guaranteed loans outstanding fell less than did the amounts of loans outstanding
that were not guaranteed by the SBA. Hancock and Wilcox suggested that, in this regard, the
SBA programs served as a shock absorber for small businesses. Furthermore, Craig, Jackson,
and Thomson (2007a, 2007b) present suggestive evidence that SBA-guaranteed lending
stimulates local economic activity.
However, statistical connections between SBA lending and economic activity need to be
interpreted with circumspection. Increased SBA lending during recessions, periods of tight
monetary policy, or times of reduced business lending need not imply that it offset inefficient
reductions in other lending. As Rhyne (1988) noted, if SBA guarantees reduce banks’ incentives
to properly screen and monitor loans, rather than offsetting inefficient reductions in others’
lending, then SBA-guaranteed lending might be funding negative net present value (NPV)
projects.
BANK LENDING STANDARDS AND LOAN RATE MARKUPS
Banks reduce the effective supply of their loans when they impose tighter lending
standards on their loans and borrowers, or when they raise the interest rates that they charge on
7
loans relative to a benchmark rate, such as their cost of funding loans via the federal funds
market. Borrowers are indifferent between increases in banks’ loan rates due to larger markups
of bank loan rates over funding costs and increases due to higher bank funding costs. Regardless
of whether higher interest rates on loans emanate from higher markups or higher funding costs,
higher loan interest rates reduce the quantity of bank loans demanded by businesses.
Lown, Morgan, and Rohatgi (2000) found that aggregate bank lending and output tended
to decline in response to tighter lending standards. Events at the beginning of this decade seem to
follow a qualitatively similar pattern. The Fed’s surveys on lending standards show that large
banks began to tighten their lending standards in earnest early in 2000, after having changed
standards little over the prior half dozen years (Federal Reserve 2003a). Standards applied to
commercial real estate loans rose similarly. Consistent with the results reported by Lown et al.,
in the second half of 2000, the annual growth rate of banks’ business loans outstanding fell
sharply, from about 13 percent to about 3 percent. At the same time, the share of banks that
raised their mark-ups of interest rates on business loans over their cost of funds also rose.
Lending to so-called higher-risk borrowers also plummeted relative to lending to lower-risk
borrowers. Thus, tighter lending standards signaled reductions in bank loan supply, at least by
larger banks. Zandi (2001) claims that by 2000, unlike the early 1990s, because they generally
had quite high capital ratios and quite low loan-to-asset ratios, banks were capable of making
more business loans. Nevertheless, he claimed, banks were unwilling to make many more loans.
That unwillingness affected both the lending standards that banks applied and the interest rate
spreads that they charged.
So far, however, little attention has been directed to the potential differential effects of
changes in bank lending standards or to the extent to which different business segments may be
subject to differential changes in lending standards. Dunkelberg (2001) argues that such
differences were not unusual, although they have not been widely recognized. Such differences
can be substantial. The Fed’s survey indicates that during 2001 about twice as many banks were
raising their standards for lending as was the case during the financial turmoil of 1998. At the
same time, only about half as many small businesses recently reported that credit was more
difficult to come by compared to the 1998 period. Noting the differences in the experiences of
larger borrowers compared to those of smaller borrowers in the recent episode, Dunkelberg
testified before Congress during 2001 that, in effect, the contemporaneous correlation between
changes in the Fed’s measures of lending standards and the National Federation of Independent
8
Businesses (NFIB) measure of the credit problems of small businesses has been quite low
historically.4
Consistent with the Peek-Rosengren and Hancock-Wilcox studies noted above, another
reason might well have been that smaller banks (which are not included in the Fed survey) and
smaller businesses were affected differentially by various financial sector disruptions. As lending
standards tightened near the end of the decade of the 1990s, they may have bound more tightly
on the borrowing of larger firms, either because larger firms were operating closer to various
margins than small firms were, or more likely perhaps, because standards were tightened more at
large banks. In addition, Dunkelberg (2001) noted that the balance sheets of smaller businesses
may have improved considerably relative to those of larger borrowers.5 The increase in larger
businesses’ bond defaults beginning in the late 1990s, the advent of large problems connected to
international banks and trade, and the resulting credit warnings issued then by bank regulators
suggest that the relative quality of large borrowers at (large) banks probably fell then. If so,
tighter standards likely impinged more on larger borrowers.
II. CONSIDERING HYPOTHESES ABOUT SMALL BUSINESSES, SMALL BANKS,
AND LOAN GUARANTEES
We build upon the framework developed and extended by Hancock and Wilcox (1994,
1998). They presented a model and estimated the specifications that it implied. Their estimates
indicate how much and how differently small businesses responded to banking sector difficulties
and aggregate economic conditions during the 1989-1992 period. In their framework, due to
informational asymmetries of the sort discussed above, employment, payrolls, and the number of
firms by firm size, as well as gross state product, rise with the supply of bank loans and
consumer sentiment, and fall when interest rates and loan delinquency rates rise. At the same
time, some variables, such as interest rates, have indirect effects that operate through the supply
of bank credit.6 This framework was not only designed to represent a mainstream approach to
the determinants of economic activity; it was also designed to exploit the availability of annual
4 One reason for the low correlation has been that the NFIB measure has trailed the Fed measure by about six quarters. Thus, it may have been just a matter of time before similarly stiffer lending standards were applied to smaller businesses. 5 When a monetary tightening raises interest rates, financial ratios on the balance sheets of potential borrowers may be depressed, the value of their collateral may be reduced, and/or their credit score may be reduced. Empirical evidence supports the “balance sheet channel” affecting the condition of small businesses (e.g., Bernanke and Gertler 1995; Bernanke et al. 1996).
9
data by state for a number of different measures of small business activity by firm size. For this
study, we make some straightforward modifications of that framework to obtain estimates of the
differential effects of macroeconomic aggregates, such as measures of monetary policy, across
businesses of different sizes.
Although we retain the basic framework of the Hancock and Wilcox (1998) model, we
modify it by adding two variables that measure the spreads of a lending interest rate above that
on a higher quality instrument. Including the spread variables and the federal funds rate
separately allow us to distinguish between two determinants of bank loan supply associated with
changes in the bank loan rates that businesses faced: those due to the effects of monetary policy,
which most directly sets the federal funds rate, and changes in loan rates that arise for other
reasons.
We also include as an explanatory variable each state’s gross state product, which we
assume positively affects both the demand for and the supply of bank loans through its signaling
of current and future economic conditions. We also add as an explanatory variable the dollar
value of disbursements of SBA-guaranteed loans, which may increase the total supply of bank
loans.
We present statistical evidence that bears on several hypotheses about the effects of
banking and economic conditions, the SBA, and monetary policy on small business activity.
First, we hypothesize that, due to the greater informational asymmetries between small
businesses and their lenders, small businesses were affected more than larger businesses were by
shocks to banks’ capital ratios, changes in monetary policy, and fluctuations in economic activity
in their own states. If so, then we should expect to obtain larger estimated effects (in absolute
value) on measures of such shocks in regressions that explain the activities of smaller businesses.
For example, a higher federal funds rate would be expected, ceteris paribus, to reduce economic
activity more at smaller businesses than at larger businesses.
We also hypothesize that small business activity is more sensitive to changes in small
bank’s capital ratios than to changes in the capital ratios of larger banks, insofar as small-banks’
loans are made primarily to smaller firms. We also investigate the role of SBA loan guarantee
programs on small business activity. We hypothesize that SBA-guaranteed lending has had a
6 Both in Hancock and Wilcox (1998) and in this study, as appropriate, variables are adjusted for inflation, expressed in per capita or per firm terms, as a percentage of loans or of gross state product, as levels, growth rates, or as first-differences. Details are provided in sections III and IV below.
10
countercyclical effect on small business activity, insofar as such lending mitigates the procyclical
pattern of bank lending, especially to small businesses.
We further hypothesize that the effects of banks’ capital ratios and SBA loan programs
on businesses of various sizes may vary with economic conditions. In particular, these effects are
hypothesized to have been systematically larger during periods of tight money or during
recessions. In effect, such systematic variation implies that the effects of bank capital and loan
guarantees can be viewed more accurately as being nonlinear in size, in that small banks and
small (nonbank) businesses are affected more than larger ones are.
III. DATA AND VARIABLE SPECIFICATION
Annual data for private sector employment, numbers of employer firms, and payrolls by
state, industry, and by size of firm are available starting in 1988 (U.S. Small Business
Administration 2003b).7 Hancock and Wilcox (1998) used these data for the 1988-1992 period.
This study uses a panel data set of annual observations of those variables for 46 of the 50 states
for the longer and more recent period of 1990 through 2000.8 In addition, our data set also
includes state-level measures of the condition of commercial banks, of the amounts of
(disbursements, i.e., flows, of) SBA-guaranteed loans, and of state-level and national economic
conditions. The variables for individual commercial banks include their loan holdings, loan
delinquencies, and capital positions. As proxies for state-level economic conditions, we use data
for gross state product, personal income, wages and salaries, (nonfarm) proprietors’ incomes,
business failures, and business bankruptcies. We use the nominal federal funds rate and two
interest rate spreads to measure national monetary and financial conditions.
MEASURES OF SMALL BUSINESS ACTIVITY
For research purposes, the SBA’s Office of Advocacy defines a small business as “an
independently owned and operated firm with fewer than 500 employees” (U.S. Small Business
7 Reports and statistics published by the Office of Advocacy of the SBA are available at http://www.sba.gov/advo/stats. 8Data for Alaska, Hawaii, and Nevada were omitted because their real economic activity appeared to be dominated by factors beyond our specification. Delaware was omitted because the portfolios of credit-card banks dominated its state-level banking data. Using first-differences of the data and allowing for time lags effectively truncated the beginning of the estimation period of our sample at 1990. Substantial changes in U.S. banking laws and regulations, especially those that relaxed the prior restrictions on cross-state activities, branching, and ownership such as the Riegle-Neal Act and the Gramm-Leach-Bliley Act, took effect in the late 1990s and early 2000s. The resulting substantial changes in banks’ cross-state operations became empirically relevant in the early 2000s led us to truncate the end of our sample with the year 2000.
11
Administration 2003a). Thus, small businesses range from 499-employee manufacturing firms to
one-employee, part-time businesses. We obtained data for employment, the number of firms, and
annual payrolls by state for firms with less than 20, 20-99, 100-499, and 500 employees or more
from the Statistics of U.S. Businesses, which was published by the SBA in conjunction with the
U.S. Bureau of the Census (2003).9
No single data series available by state seems adequate to summarize all the relevant
aspects of the real economic activity of small businesses. Therefore, we use data for private
sector employment, numbers of firms, annual payrolls, and proprietors’ income. To better focus
on the characteristics of small businesses, we use data that, when available, are disaggregated by
firm size. We obtained data for proprietors’ incomes from the U.S. Bureau of Economic
Analysis. To our knowledge, data for proprietors’ incomes by firm size are not publicly
available. Our assessment is that the overwhelming majority of proprietorships are likely to fall
within the SBA definition of small businesses.
Designating all businesses that have fewer than 500 employees as “small businesses”
means that the overwhelming number of businesses is small. Small businesses employed a little
more than half of all private sector employees and paid a little less than half of the aggregate
dollar payrolls for private sector employment. Thus, like banks, most nonbank businesses are
quite small, while a relatively small number of large businesses accounts for about half of total
employment.
How large a role small businesses play in the economy can be measured in various ways.
But by any measure, the size of that role, or the small business intensity of the economy, has
declined somewhat over the past decade. That decline can be measured by declines in the
proportion of all firms, in the proportion of total employment, and in the proportion of aggregate
dollar payrolls that were paid by small businesses. First, consider firms that have fewer than 100
employees. During the 1990s, the proportion of firms of this size declined by 0.4 percent, from
96.4 to 96.0 percent (Chart 1, top panel). The proportion of total employment accounted for by
firms with fewer than 100 employees declined by 8.4 percent, from 39.2 to 35.9 percent (Chart 1,
middle panel). And the proportion of aggregate dollar payrolls paid by these firms declined by
10.7 percent, from 34.6 to 30.9 percent (Chart 1, lower panel). Next, consider even smaller
9 The main web page for this program is http://www.census.gov/csd/susb/. Similar statistics are available at http://www.census.gov/epcd/www/smallbus.html. All of the subsidiaries within a state that were affiliated with a particular company were considered part of one firm. Firms with operations in more than one state were counted more than once because firms are defined within states. Employment and annual payroll data depended on the location of the firm, not on the location of the residence of the employee.
12
businesses--firms with fewer than 20 employees. The proportion of firms that had fewer than 20
employees declined by 0.7 percent, from 87.3 to 86.8 percent. Their proportion of total
employment declined by 12.2 percent, from 20.3 to 18.1 percent. And their proportion of annual
payroll declined by 14.6 percent, from 17.8 to 15.2 percent. Thus, the decline in small business
intensity was more pronounced in the smallest of small businesses.
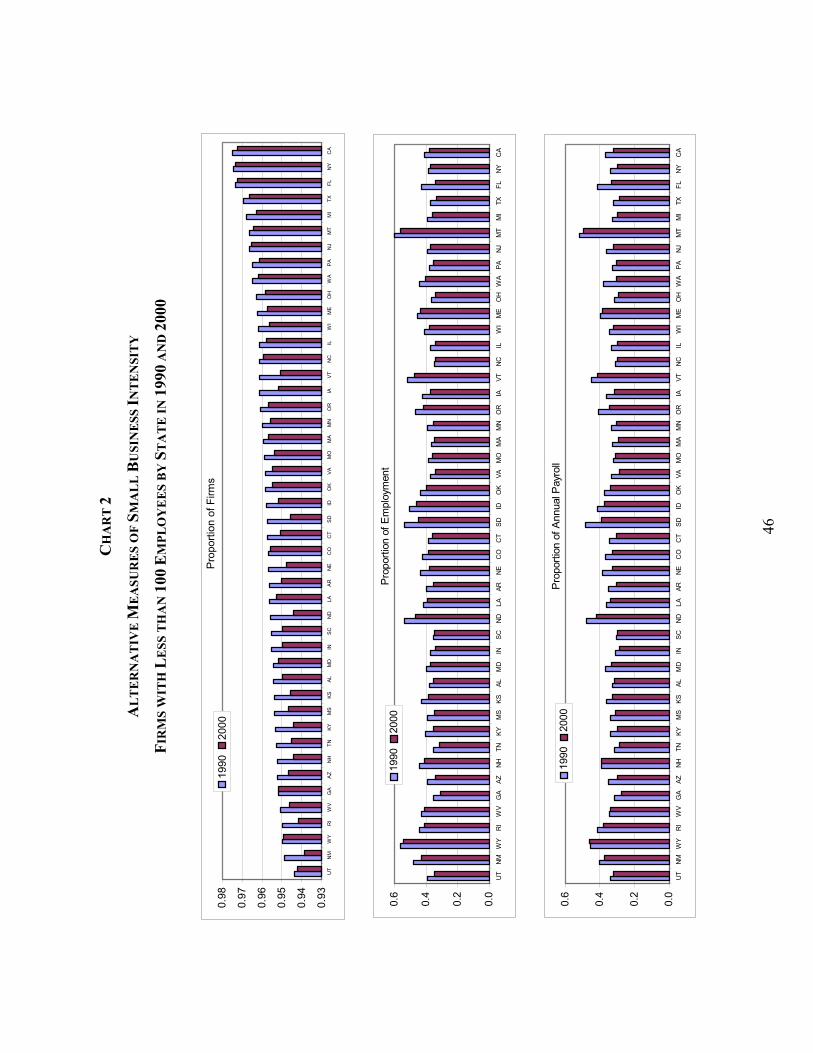
The decline in small business intensity is also evident in state-level data. Chart 2 presents
each of the small business intensity measures for firms with fewer than 100 employees at the
state level in 1990 and in 2000. In Chart 2, states were ranked in ascending order of the
proportion of firms with fewer than 100 employees as of 1990. Interestingly, states with
relatively low proportions of firms with fewer than 100 employees did not always have relatively
low proportions of employment at firms with fewer than 100 employees. That is, the rank order
of states was different for different measures of small business intensity.
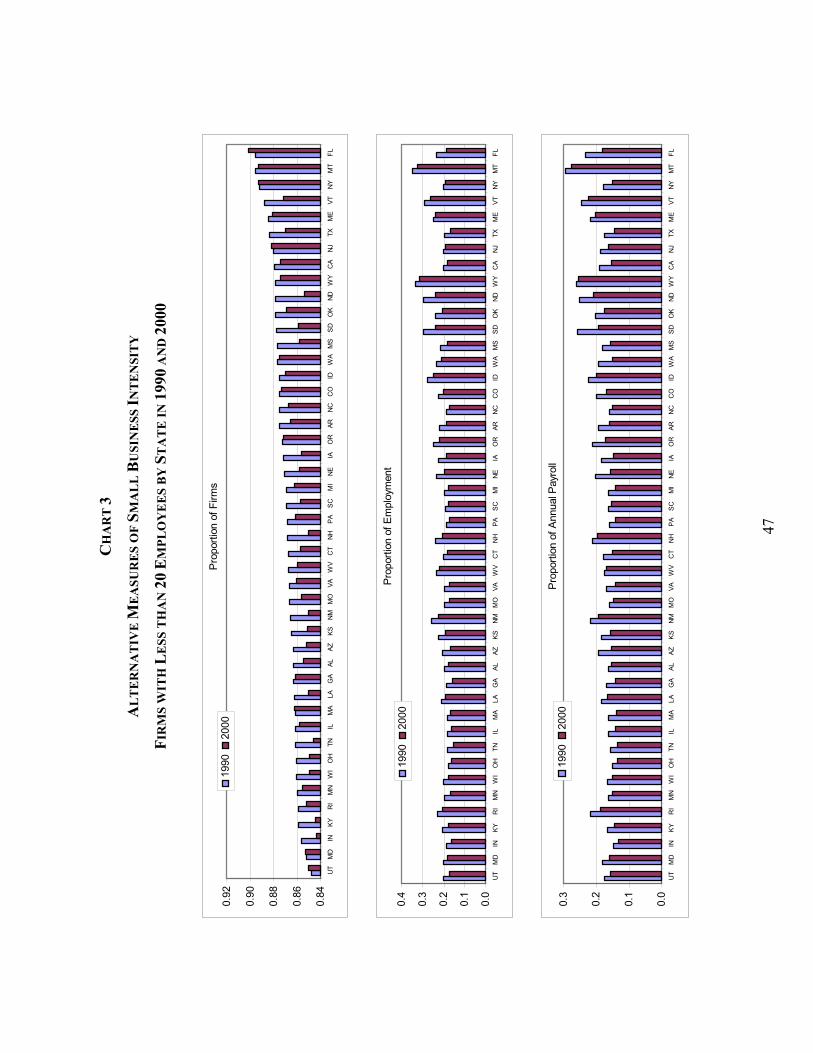
Chart 3 presents the three small business intensity measures for firms with fewer than 20
employees at the state level in 1990 and in 2000, ranked in ascending order of the proportion of
firms with fewer than 20 employees as of 1990. Only six states (Utah, Maryland, Massachusetts,
New Jersey, New York, and Florida) had an increase in the proportion of firms with fewer than
20 employees. Every state had a decline in the proportion of employment and the proportion of
annual payroll at firms with fewer than 20 employees from 1990 to 2000. What differed across
states was the percentage change in these small business intensity measures across time.
MEASURES OF BANKING CONDITIONS
We collected data for individual banks’ (book value) dollar amounts of holdings of loans,
delinquent loans, and equity capital from the Call Reports that they filed with their regulators
(Federal Reserve Bank of Chicago 2003). We use their data for the second quarter of each year
as a proxy for their annual data. We use the consumer price index (CPI) and state population to
convert the nominal dollar series into real, per capita series (U.S. Bureau of Labor Statistics
2003, U.S. Bureau of the Census 2001). We use the second quarter value for the CPI to deflate
nominal series. The sample of banks includes commercial banks with U.S. offices.10 We focus
on total loans, commercial and industrial (C&I) loans, commercial real estate loans, and
consumer loans. We calculate total loans as the sum of C&I loans, real estate loans, loans to
individuals, agricultural loans, and lease financing receivables. We calculate delinquencies as the
10 These banks have entity type 010 and country code 666. Banks in Puerto Rico and the Virgin Islands also have country code 666, but these are not included in the analysis. In addition, bank observations with negative or missing loan data were removed.
13
sum of the amount of loans past due 90 days or more plus the amount of nonaccrual loans. We
calculate delinquency rates both for C&I loans and for real estate loans as the amount of
delinquent loans in each category as a percent of total loans outstanding in that category. We use
the Call Report definition that equity capital is the sum of perpetual preferred stock (including
related surplus), common stockholders’ equity, surplus, undivided profits, and capital reserves
(adjusted for net unrealized losses on marketable equity securities).
We define small banks to be banks that have less than $1 billion of assets. Medium banks
have between $1 billion and $10 billion of assets. Large banks have between $10 billion and $50
billion in assets. We define “megabanks” to be banks that have more than $50 billion of assets.
Call Report data record the loans, loan delinquencies, and capital at each bank (and its
headquarter’s location). They do not record the location of the bank’s branches that originated
loans, of the bank’s borrowers, or the bank’s owners. The Interstate Banking and Branching
Efficiency Act (1994) permits banks to operate branches (as opposed to separate bank
subsidiaries) across state lines. Thus, creating meaningful state-level data for bank loans, capital,
and delinquencies has become increasingly difficult. As a consequence of the extensive cross-
state-border bank consolidation during the mid- and late 1990s, we do not extend our sample
after 2000. Similarly, since the largest banks (1) tended to focus less on small business lending
and (2) were the leading promulgators of interstate branching, we exclude megabanks from our
sample.
Our analysis generally requires that we use differences (from one year to the next) of our
data. Bank mergers make it a challenge to calculate the appropriate first-differences of our state-
level bank measures. In a static market, it would not matter whether the data are aggregated and
then differenced, or, instead, differences are calculated for each bank and then aggregated.
However, bank mergers and the shifting of banks across size categories complicate our task.
To allow for these complications, we calculate differences for each bank first and then
create state-level aggregates by adding up the differences by state and bank size category. As a
result, a bank’s data for any year are included only if the bank reported for both that year and for
the year before. This method prevents de novo banks and bank failures from distorting the
calculated first-differences.
To measure the first-differences when banks merged, we calculate the first-differences of
data for a merged bank as the difference between the data for the surviving bank and the data for
the previous year for the sum of the banks involved in the merger. For example, if banks A and B
merged between the (second quarter) 1990 and 1991 observations, the first difference between
14
1990 and 1991 is calculated as the 1991 data for the surviving, merged bank minus the sum of
the 1990 data for the banks involved in the merger (bank A and bank B). The first-difference for
1992 is calculated as the first-difference of the 1992 and 1991 data for the merged bank.
This procedure is relatively straightforward for mergers that produce a single surviving
bank. However, many mergers were more complicated. Unfortunately, no data in the Call
Reports indicate how non-surviving banks were split up among a group of surviving banks. We
prorated the data of non-surviving banks among multiple surviving banks with shares (for each
data series) that were proportional to the change in the surviving banks’ data from the quarter
prior to the merger to the subsequent quarter.11
An additional challenge is how to allocate merged banks into bank size categories. Two
medium-sized banks in the same state that merge to produce a bank that is still of medium size
present no issue. In that case, it does not matter how differences are calculated or how the data
are categorized. On the other hand, when the merger of a small bank with a medium bank
produces a large bank, it is less obvious how much growth in loans and other variables should be
attributed to each of the size categories. This is a problem any time a bank changes its size
category over time, even in the absence of a merger. In these cases, we allocated the first-
differences of the data to the size category measured in the current period. Therefore, in the
small-medium-large example given above, the first-differences would be included in the large
bank aggregate for the state of the surviving bank.
DATA FOR SBA LOAN GUARANTEES
Data for the number of SBA-guaranteed loans approved, the total dollar amount of loans
approved by lenders, and the dollar amounts of the guarantees provided by the SBA are available
for each SBA office (U.S. Small Business Administration 2003b). We aggregate these data to
form state-level data for “gross loans” approved (i.e., the total amounts of the loans) and for
guarantees approved by the SBA. These data are not the dollar amounts outstanding (i.e., the
stock), but rather are the flows of newly extended loans.
The section 7(a) Loan Guaranty Program is one of the SBA’s primary vehicles for
providing loans to small businesses that are unable to secure financing on reasonable terms
through normal lending channels.12 This program guarantees loans provided by private-sector
11 Surviving (i.e., acquiring) banks with negative growth over the acquisition period are dropped from the merger allocation of the target bank. 12 The SBA operates many other specialized lending-related programs. For instance, the Prequalification Pilot Loan Program assists prospective borrowers in developing viable loan applications. Other programs target specific types
15
lenders to applicants that meet criteria with respect to (1) the type of business, (2) the size of the
business, and (3) the use of the loan proceeds.13 The vast majority of for-profit businesses with
fewer than 500 employees are eligible for financial assistance through this program. The loans
can be used for most business purposes, including the purchase of real estate to house the
business operations, construction, renovation or leasehold improvements; acquisition of
furniture, fixtures, machinery and equipment; purchase of inventory; and working capital. In
each instance, the business must invest a reasonable amount of equity and have first relied upon
alternative financing sources (including personal assets).
Although the Loan Guaranty Program is generally intended to encourage longer-term
small business financing, the actual loan maturities are based on the ability to repay, the purpose
of the loan proceeds, and the useful life of the assets financed. Maximum loan maturities are 25
years for real estate and equipment and 10 years for working capital. Interest rates are negotiated
between the borrower and the lender, but are subject to maximum rates that are pegged to the
prime rate of interest. For fixed-rate loans, the maximum interest rate depends on the prime rate,
the amount of the loan, and the maturity of the loan. Variable rate loans can be pegged either to
the prime rate or to a weighted average of rates the federal government pays for loans with
maturities similar to the average loan that is guaranteed by the SBA. The SBA can guarantee up
to 80 percent of loans up to $100,000, and up to 75 percent of loans above $100,000. There was
no legislated limit to the total amount of the loan that can be requested from the lender, but the
maximum SBA guarantee amount was generally $750,000.
of financing needs. The CommunityExpress program targets low and moderate income areas. The SBALowDoc Loan Program provides loans with streamlined application procedures. The SBAExpress program specializes in loans under $250,000. The Microloan Program specializes in loans under $35,000. The Commercial Adjustment and Investment Program (CAIP) specializes in lending to areas adversely affected by NAFTA. The International Trade Loan Program and the Export Working Capital Program assist exporters and companies facing foreign competitors. The DELTA program specializes in defense-related business. The Qualified Employee Trust Loan Program assists the development of employee stock ownership plans. The CAPlines program provides assistance to businesses with short-term and cyclical working capital needs. The Certified Development Companies (504) loan program assists businesses through long-term fixed-rate finance for major fixed assets such as land and buildings. There are also programs and policies seeking to assist with pollution control and businesses owned by veterans. More information about these programs is available at http://www.sba.gov/financing/fr7aloan.html. 13 The proceeds of a loan guaranteed by the SBA cannot be used to finance floor plan needs, to purchase real estate that will be held for investment purposes, to make payments to owners or pay delinquent taxes, or to pay existing debt unless it can be shown that refinancing will benefit the small business and that the need to refinance is not indicative of imprudent management practices. Special considerations apply to franchises, recreational facilities and clubs, farms and agricultural businesses, fishing vessels, and holding companies. Applications are not accepted from firms whose principals are incarcerated, on parole, or on probation. Businesses with speculative or gambling purposes are ineligible. More information is available at http://www.sba.gov/financing/fr7aloan.html.
16
For each state, we obtain annual data for the state-level gross loan amounts, as well as the
SBA guaranteed amounts, for the Section 7(a) Loan Guaranty Program.14 We convert nominal
dollar amounts to real, per capita values by dividing by the national CPI and each state’s
population.
MEASURES OF AGGREGATE REAL ECONOMIC ACTIVITY
We use several macroeconomic indicators either as dependent variables or as
independent variables to control for state and national economic health. In most instances, we
use four-quarter averages from the third quarter of the previous year to the second quarter of the
current year as our measures of annual values. We obtain data for gross state product, personal
income, and wages and salaries from the U.S. Bureau of Economic Analysis (2003b, 2003a). We
convert data for nominal dollar gross state product to real, per capita values by dividing by the
national CPI and state population.
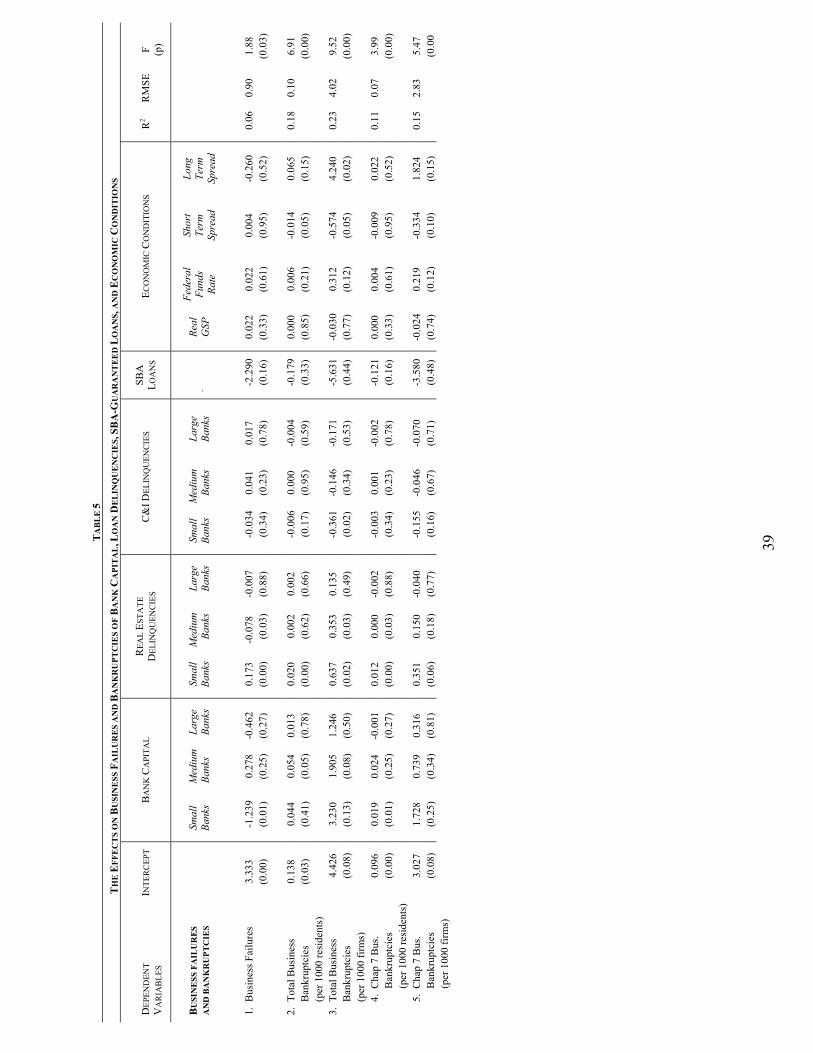
We obtain data for the number of business failures (also called business terminations)
from the annual reports published by the Office of Advocacy of the U.S. Small Business
Administration (2003b). We complement data for failures with data for total business
bankruptcies and Chapter 7 firm bankruptcies, as published by the Administrative Office of the
U.S. Courts (2003).15 A business bankruptcy is a legal recognition that a business is insolvent
and that it must restructure (Chapter 11, or, for farm businesses, Chapter 12) or completely
liquidate (Chapter 7). Bankruptcies were recorded when businesses filed bankruptcy petitions
under Chapters 7, 11, or 12 of the bankruptcy laws. The SBA’s Office of Advocacy (U.S. Small
Business Administration 1994) noted that business bankruptcy data were more likely to include
self-employed persons and new, very small firms than were business failure data. An economic
indicator particularly pertinent to the vitality of de novo businesses is the number of Chapter 7
bankruptcies.
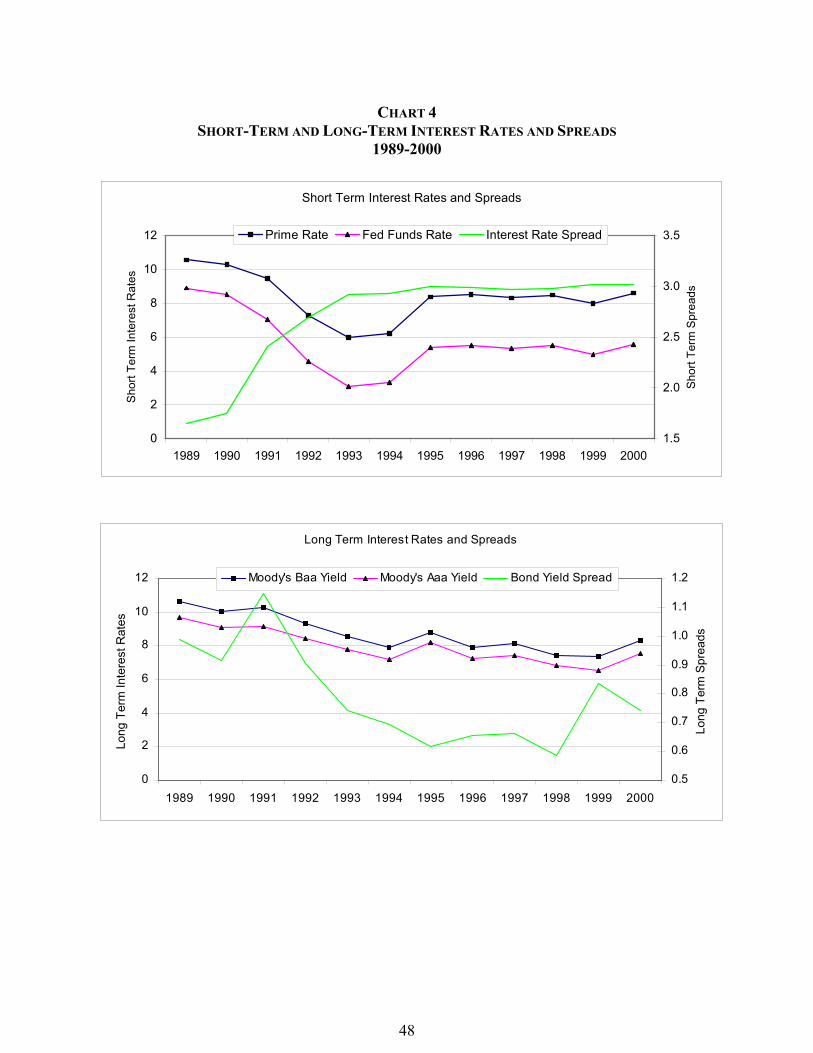
We obtained the data for the federal funds interest rate, the prime (interest) rate, and
Moody’s Aaa and Baa long-term bond yields from the Federal Reserve (2003b). We express all
interest rates in percentage rather than decimal form. The Federal Reserve aggressively reduced
14 The data are publicly available for each branch of the SBA’s Office of Financial Assistance. However, it is not easily collected nor is it aggregated at the state level. We obtained the state aggregates for 1989-2001 from the SBA. 15 Data are from Table F-2 of the Annual Report of the Administrative Office of the United States Courts. This report is also known as the Annual Report of the Director or the report on Judicial Business of the United States Courts. Recent data are available electronically at http://www.uscourts.gov. However, historical data are available only in hard copy.
17
the federal funds rate during the 1990-1991 recession (Chart 4, top panel). Although the federal
funds rate was almost 9 percent in 1989, it was only about 3 percent by 1993. The prime rate also
declined during this period, but less dramatically. As a result, the spread between the prime rate
and the federal funds rate rose through most of the 1990-1991 recession and into the recovery.
Interestingly, this spread did not revert to its 1989 level during the 1990s.
Moody’s Aaa and Baa long-term bond yields trended downward during the 1990s (Chart
4, bottom panel). The spread between these rates increased during the 1990-1991 recession and
then declined modestly during the ensuing national economic expansion. The modest decline in
the spread between long-term rates contrasted sharply with the increase in the spread between the
prime interest rate and the federal funds interest rate.
According to a standard view of the monetary transmission process, monetary policy
affects real economic activity by changing interest rates, particularly long-term interest rates.
Clearly, both the Aaa and Baa long-term rates rose and fell with the Federal Reserve’s setting of
the federal funds rate. But, the responses of long-term yields were smaller than those of short-
term yields. As a result, the spread between the Moody’s Aaa bond yield and the effective funds
rate tended to grow when the Federal Reserve lowered the federal funds rate and to shrink when
the Federal Reserve raised the federal funds rate.
IV. REGRESSION RESULTS
Tables 1-7 present the results of ordinary least squares (OLS) regressions that estimate
the effects of various factors--local and national, real and financial--on small businesses. The
results are based on annual data for each of 46 states for 1991-2000. We use four categories of
explanatory variables: bank capital, loan delinquency rates, (the flow of) SBA-guaranteed
loans, and economic conditions. The following equation shows the specification for the
Each regression includes a different dependent variable (Y), an intercept term (α), and an
error term (ε). This equation denotes the effects of the independent variables on the dependent
variables with numerically subscripted Greek letters (β, γ, δ, η). This core set of explanatory
variables includes three measures of the first-differences of state-level real, per capita bank
capital (expressed as a percentage of lagged real, per capita gross state product), one each for the
set of small (BS), medium (BM) and large (BL) banks operating in the state; measures of (one-
year-) lagged real estate loan delinquency rates for each bank size category (RS, RM, RL); the
18
lagged C&I loan delinquency rate (CS, CM, CL), again measured separately at small, medium and
large banks (with all delinquency rates expressed as a percentage of the respective type of loans);
and four measures of economic conditions. The four measures of economic conditions are the
lagged percentage growth rate of real, per capita gross state product (G), the lagged nominal
federal funds interest rate (F), the lagged spread between the prime rate and the federal funds rate
(short-term spread, S), and the lagged spread between Moody’s Baa and Aaa bond yields (long-
term spread, L).
Tables 2-7 show the results from regressing alternative dependent variables on sets of
explanatory variables that are nearly identical to the core set used in Table 1. The significance
level (p-value) is shown in parentheses under each estimated regression coefficient in Tables 1-7.
The first-differencing (across time within states, but not across states) of the dependent and
independent variables that are included in the regression specification presented above in effect
results in a fixed-effects specification, which helps reduce the impacts of possibly substantial but
unmeasurable state-level effects on lending and other variables.
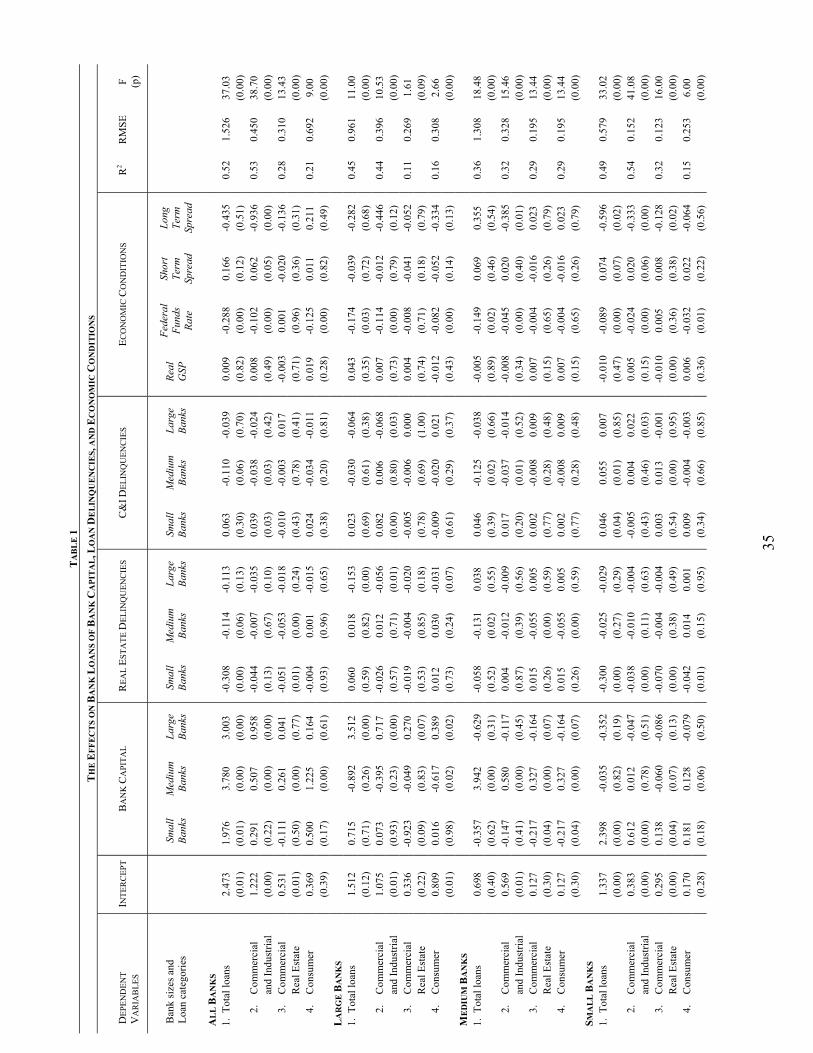
EFFECTS ON BANK LOANS OF BANK CONDITIONS AND ECONOMIC CONDITIONS
As dependent variables, the regressions reported in Table 1 use the first-differences of
real, per capita bank loans (expressed as a percentage of lagged real, per capita gross state
product) for various categories of loans.16 The bank loan regressions provide evidence on the
mechanism through which changes in bank capital and bank loan delinquency rates ultimately
affect real activity--by affecting bank lending.
The results presented in row 1 reaffirm the conventional wisdom that bank loans rose and
fell with bank capital. Row 1 suggests that losses of bank capital reduced holdings of loans in
bank portfolios (Hancock and Wilcox 1998; Peek and Rosengren 1995). The estimated effects
were statistically significant for each bank size. Because both the dependent variable and the
bank capital measures are scaled by lagged, real, per capita gross state product, the interpretation
of the estimated effects is straightforward. A one-dollar increase (decrease) in bank equity capital
at small banks is associated with a $1.98 increase (decrease) in total loans in bank portfolios. The
estimated effect of bank capital is largest at medium-sized banks ($3.78 per dollar change in
bank capital).
16 As noted above, our first-differencing of both the dependent and independent variables in essence removes biases that might otherwise arise from unmeasurable state-level fixed effects. The estimated values of the intercept terms in the first-difference specification then are the coefficients associated with a linear trend term in a non-differenced specification.
19
The estimates in row 1 also suggest that higher loan delinquency rates reduced banks’
holdings of total loans, with five of the six estimated effects being negative, but only one of the
effects is statistically significant at the 5 percent significance level, and two others are significant
at the 10 percent level. Of the four measures of economy-wide conditions, only the (lagged)
federal funds interest rate has a significant (negative, as predicted) estimated effect.
The results for C&I loans, commercial real estate loans and consumer loans are displayed
in rows 2-4, using the same set of explanatory variables as in row 1. For C&I loans, the
estimated effects of the three measures of bank capital are again positive and statistically
significant at medium and large banks. However, the estimates suggest that an additional dollar
of capital at large banks raised C&I loans by nearly one dollar, almost twice the estimated effect
of an additional dollar of capital at medium-sized banks, and more than three times the estimated
effect of an additional dollar of capital at small banks. For both commercial real estate loans and
consumer loans, the magnitudes of the estimated effects across bank size classes vary
substantially. Only capital at medium-sized banks has an effect estimated to be significant. Rows
2-4 show that loan delinquency rates affected the loan categories much like they affected total
loans. Most of their estimated effects are negative. However, only four of the 18 estimated
effects are statistically significant, and C&I loan delinquency rates at small banks raised C&I
loans.
For the full sample period used to obtain the results in Table 1, higher federal funds
interest rates significantly reduce banks’ total holdings of loans, and especially their C&I and
consumer loans. On the other hand, the remaining measures of overall economic conditions,
state-level real income and interest rate spreads, generally did not have consistent effects on bank
loans: Signs alternated and significance was often weak.
We use the same set of explanatory variables in the remainder of Table 1 to obtain the
results for the same four categories of bank loans separately for small, medium, and large
banks.17 As expected, positive effects of bank capital at banks of the same size dominate: Large-
bank loans respond most to large-bank capital, medium-bank loans respond most to medium-
bank capital, and small-bank loans respond most to small-bank capital. Ten of these 12 own-size
effects are statistically significant. In addition, the estimated effects of capital at banks of
17 During the period from 1990 through 2000, many states had no large banks and a small number of states had no medium banks. Our regressions excluded observations for state/years that had no medium or large banks. If no observations had been excluded, the regression coefficients that would have resulted for large bank loans could be inferred almost exactly by subtracting the sum of the reported effects on loans held by small and by medium banks from the effects on loans by all banks.
20
different sizes, the cross-effects, tend to be negative, but only a few of the estimated cross-effects
are statistically significant.
At large banks, each dollar of bank capital raises their total loans by $3.51. That exceeds
the estimated $3.00 effect of large bank capital on total loans at all banks. This suggests that
smaller banks offset the reductions in large banks’ lending when large bank capital declines.
That is borne out by the negative (though insignificant) estimated effect of large bank capital on
total loans held by medium-sized and by small banks. Similarly, the negative cross-effect
appears in the large bank regressions. Increases in medium bank capital tend to decrease loans
held by large banks. Borrowers who were denied loans because their own banks were under
capital pressure may have been able to turn to banks that were under less capital pressure. Of
course, these estimates do not identify borrowers shifting between banks within a size class.
Borrower concentration limits also may have precluded some smaller banks from making
large loans to customers of capital-constrained larger banks. If so, the effects of declines in
capital in one bank size class on the lending by banks in other size classes would not have been
symmetric. In that case, the magnitude of negative cross-effects of smaller banks’ capital on
larger banks’ loans would have been expected to be larger than vice versa. The estimated effects
in Table 1 reveal such an asymmetry.
The estimated effects of the real estate loan delinquency rates match our expectations.
Estimated effects are significantly negative only for real estate loan delinquency rates at banks of
the same size. Thus, delinquency rates at large banks reduce loans at large banks, medium bank
delinquencies reduce medium bank loans, and small bank delinquencies reduce small bank loans.
For C&I loan delinquency rates, the pattern is not quite as clear. Although, large bank C&I
delinquencies have a significant negative effect on large bank C&I loans and medium bank C&I
delinquencies have a significant negative effect on medium bank C&I loans, the negative effect
of small bank C&I delinquencies on small bank C&I loans is not significant. Higher small bank
C&I delinquencies raise large bank C&I loans significantly. This is consistent with small banks’
C&I lending shrinking when their C&I loan portfolio deteriorates and with their borrowers
shifting to larger banks.
Higher federal funds interest rates tend to reduce bank loans. The exception is
commercial real estate loans.18 Nine of the 12 estimated effects of the long-term spread are
18 Changes in real estate loans are likely to be predicted more accurately by long-term interest rates (e.g., 10-year Treasuries), which mirror mortgage rates more closely. The connection between monetary policy and long-term interest rates (e.g., mortgage rates) is likely looser than that between monetary policy and short-term interest rates.
21
negative, with four being statistically significant. Six of the 12 effects are negative for the short-
term spread, although none is significant. The estimated effect of the growth rate of real, per
capita GSP is never significantly positive.
Thus, the patterns in Table 1 generally follow those reported by studies with sample
periods that ended in the early 1990s. The estimated effects of capital on bank loans for 1991-
2000 are consistently statistically significant. Table 1 also rather clearly indicates that, while the
own-size effects are positive, the cross-size effects of capital on bank loans are typically
negative. The negative cross-size effects point to pressures on some banks being partially offset
by increased lending by other banks. Analysis of such effects across locally-competing
individual banks, though well beyond the scope of this study, might provide further evidence
about the “shock-absorbing” effects of competing banks’ extending more credit when a bank is
under capital pressure. While higher federal funds interest rates tend to reduce bank lending of
all types (except that for commercial real estate) at banks of all sizes, state-level income shows
no consistent patterns of raising or lowering lending.
EFFECTS ON GROSS STATE PRODUCT, PERSONAL INCOME, AND SMALL BUSINESS ACTIVITY
The estimates reported in Table 2 bear on the issue of whether the same factors that affect
bank loans also affect real economic activity. Our interest in the effects on bank loans, after all,
stems primarily from our interest in whether these same factors, perhaps operating in large part
through their effects on bank loans, detectably affect overall economic activity.
The dependent variables in Table 2 are gross state product (GSP), personal income, and
two components of personal income: wages and salaries and nonfarm proprietors’ income. We
specify each of these dependent variables as real, per capita first-differences (expressed as a
percentage of lagged real, per capita GSP). With this transformation, the GSP variable becomes
the real, per capita percentage growth rate of GSP. Table 2 uses the same core set of explanatory
variables that we use in Table 1, except that we add SBA-guaranteed loan disbursements and
delete lagged GSP. We specify SBA-guaranteed loan disbursements as the first-difference of
real, per capita SBA-guaranteed loan disbursements (expressed as a percentage of real, per capita
GSP). We then lag that SBA variable by one year.
Table 2 shows that the same variables that affect bank loans also have important effects
on real economic activity. The results in Table 2 show that real, per capita GSP responds
positively to each of the three measures of bank capital. The effects of medium and large banks’
capital on GSP are statistically significant. An additional dollar of bank capital at large banks has
a larger estimated effect on GSP than an additional dollar of capital at either small or medium
22
banks. One dollar of additional capital at large banks raises GSP by $2.50, while an additional
dollar of capital at small or medium banks raises GSP by approximately one dollar less.
This larger estimated effect on real activity of per-dollar bank capital at larger banks
conforms to our estimates in table 1, which showed that the effects of bank capital on loans were
larger at larger banks. By contrast, however, the effects on three components of state-wide
income (personal income, wages and salaries, and nonfarm proprietors’ income) are larger when
capital changed at the smallest banks. In part that may reflect that the share of non-labor income
is larger for gross state product than for the other measures of income and product for which we
have data. To the extent that larger banks tended to make relatively more business and fewer
consumer loans in response to capital pressures (as Table 1 indicates that they do), then capital
shifting from larger to smaller banks might raise GSP, even though it might reduce labor-
oriented income.19
The effects of loan delinquency rates on GSP are mixed. Real estate loan delinquency
rates show no consistent pattern of affecting GSP. In contrast, C&I loan delinquency rates at
large banks significantly reduce GSP. The effect of medium banks’ C&I loan delinquency rates
on GSP is less than half as large as the effect of large banks’ C&I loan delinquency rates, and the
medium banks’ estimated effect is not quite significant at the 5 percent level. Thus, the estimated
effects of C&I loan delinquency rates across bank sizes and across income measures mirror the
effects of bank capital: Large banks’ effects on GSP tended to be larger than the effects of small
and medium-sized banks, while small banks’ effects were more prominent on the components of
GSP, such as personal income and wages and salaries.
Wages and salaries and nonfarm proprietors’ income also reasonably closely track the
performance of small businesses. Small business payrolls largely represent wages paid to non-
owner employees. In contrast, proprietors’ income represents a combination of (1) compensation
for the owners’ labor services and (2) returns on the owners’ capital investments and their
abilities to manage them. Data for wages and salaries, which are published by the U.S. Bureau of
Economic Analysis, are not disaggregated by firm size and include wages paid to employees of
nonprofit and government entities. Below, we report separately on private sector payrolls.
Substituting personal income or one of its components as the dependent variable
produces estimates that shift the relative importance of small banks compared to large banks.
Large bank capital has larger, more significant effects on GSP than on its components, which we
19 Although wages and salaries may be clearly labor income, deciding how much of proprietors’ income is the return to labor and how much is the return to the entrepreneur’s capital is not clear.
23
regard as being more closely tied to small businesses. For example, only small bank capital has
significant effects in each of the three specifications, as well as having a larger effect than does
large bank capital in each instance. Similarly, among the measures of loan delinquencies, only
small bank C&I loan delinquencies have significant effects.
Higher levels of the federal funds interest rate and of the two interest rate spread
variables decisively and negatively affect GSP and each of its three components. Naturally,
given the greater relative importance (as measured, say, by their share of total assets) of larger
banks, the estimated coefficients on the interest rate variables are much larger for larger banks.
Increases in SBA-guaranteed loan disbursements raise GSP, with an estimated effect that
is significant at the 8 percent level. The size of the estimated effect implies that economic
activity by a factor of about six times the increase in SBA-guaranteed loans. Consistent with
effects of that size, SBA-guaranteed loan disbursements have similarly sized effects on three
components of GSP, each of which can be reasonably regarded as being more closely related to
small business activity than is GSP itself. Not surprisingly, then, the results in Table 2 suggest
that SBA-guaranteed loans exert separate, additional effects on real economic activity and that
their largest effects on the real activities of small, rather than large, businesses. In that regard, our
results are consistent with those reported by Craig, Jackson and Thomson (2007). The results
also suggest that SBA-guaranteed loans stimulate not only proprietors’ incomes, but also, more
broadly, wages and salaries and personal income.
EFFECTS ON REAL ECONOMIC ACTIVITY, BY SIZE OF FIRMS AND SIZE OF BANKS
Table 3 takes a more direct look at the effects on economic activities across the sizes of
firms of bank variables and overall economic conditions. Table 3 presents the results of
regressing private sector employment, number of firms, and annual payrolls, each disaggregated
by firm size (as measured by the number of employees). Both employment and the number of
firms are measured per thousand residents of each state and expressed as first-differences.
Annual payrolls are measured as first-differences of real, per capita values (expressed as a
percentage of lagged real, per capita GSP). We use the same explanatory variables to obtain the
estimates in Table 3 that we used for Table 1, except for the addition of the variable for SBA-
guaranteed loan disbursements.
Table 3 shows some of the differential effects across firm and bank sizes of capital and
other variables. As in Table 2, in Table 3 capital tends to consistently affect real economic
activity, while bank loan delinquency rates do not. Table 3 also shows significant effects of the
SBA loan variable on many of the aggregated and disaggregated measures of economic activity.
24
Each of the three measures of bank capital significantly raises total employment,
although medium-size banks’ capital was significant only at the 9 percent level. In contrast to the
relative effects on GSP, each additional dollar of capital at small banks has by far the largest
effect on total employment. This suggests that capital at small banks is in a sense “high-powered
capital,” in terms of stimulating employment. The effect of additional capital at large banks on
employment is only about one-third as large as that at small banks. The effect of medium bank
capital is even smaller.
Less intuitively, the largest difference between the effect of small bank capital and large
bank capital on employment is for firms with 500 or more employees. The next largest difference
is for the smallest firms, as might be expected, since small firms tend to rely more on small
banks for credit. For firms with 20 to 99 employees, the effect on employment of small bank
capital is similar to that of large bank capital. All of the estimated effects of both real estate loan
and C&I loan delinquency rates at large banks are negative, as predicted, although only three are
statistically significant. At medium banks, the results are similar, with all estimated effects but
one being negative. Surprisingly, most of the estimated effects of the delinquency rates at small
banks are positive, with five being statistically significant.
SBA-guaranteed loan disbursements raise employment at firms of all sizes. The effects
for all firms and for the largest firms are statistically significant. Each measure of economic
conditions has a significant estimated effect for total employment. When the firms are
disaggregated by size, the pattern of signs on the estimated effects persists, with only two
exceptions, with most of the effects retaining their statistical significance. However, the
estimated effect of the long-term spread is positive and significant for firms with 100 to 499
employees.
The next rows of Table 3 show that having more capital in small banks significantly
increases the number of firms. While each estimated effect of large bank capital is positive (and
two of the five are significant), they are each much smaller than the small bank capital effects.
The estimated effects of medium bank capital are even smaller, and only one effect is significant.
Consistent with the employment results, small bank capital has a bigger “bang per buck” on the
number of firms, buttressing the notion that capital at small banks is especially “high-powered.”
The estimated effects of loan delinquency rates on the number of firms are mixed, with
only six being significant. Although most of the effects are negative, the small bank delinquency
rate effects are positive and often are significant. The two SBA-guaranteed loan disbursement
effects that are strongly significant are positive, indicating that SBA-guaranteed loans
25
significantly improve the likelihood of survival of small businesses. The general pattern of the
effects of the interest rate variables on the number of firms is similar to those on employment:
Higher rates, whether due to the federal funds rate or spreads being higher, reduce the numbers
of small businesses.
The payroll-based estimates, shown in the bottom rows of Table 3, tell a similar story.
Each of the estimated effects of small bank capital and large bank capital is significantly
positive, but the estimated effects of small banks’ capital are always larger, and on our
interpretation, “high-powered.” Each of the estimated effects of medium bank capital is positive,
but only one is significant. Most estimated effects of the delinquency rates are negative, but only
three are significant. SBA-guaranteed loan disbursements again have positive estimated effects,
with four of the five being significant. The pattern of estimated effects of the economic
conditions variables in terms of signs and significance is quite similar to those for the
employment regressions.
SBA-GUARANTEED LOANS AS ECONOMIC STABILIZERS
A government loan guarantee program might usefully increase the supply of loans when
private-sector banks inefficiently reduce their supply of loans. Inefficiency might arise, for
example, when a bank’s capital requirement became binding or its economic net worth became
negative and the bank could not raise sufficient capital to operate and lend. Banks were under
varying amounts of capital pressure during the 1990s. Tables 1-3 indicate that capital pressures
reduced activity at the firms that relied on banks. On the other hand, Tables 2 and 3 suggest that
SBA-guaranteed loan disbursements stimulate activity. The amounts of SBA-guaranteed loan
disbursements might be determined, not just by economic conditions, but perhaps more
importantly by political considerations. Regardless, it is useful to know what has been the typical
relation of SBA-guaranteed loan disbursements to the factors that affect banks, businesses, and
employees.
To that end, Table 4 presents the results of regressing various measures of SBA Section
7(a) guaranteed loans on the same core set of independent variables that we used for Table 1. We
use the following measures of (the flow of) SBA-guaranteed loans: the number of SBA-
guaranteed loans approved per million residents; the real, per capita SBA gross loan amount
approved (expressed as a percentage of lagged real, per capita GSP); and the real, per capita SBA
loan guarantee amount (expressed as a percentage of lagged real, per capita GSP).
Row 1 shows the results when the dependent variable is the number of SBA-guaranteed
loans approved. We expect that more bank capital would produce more SBA-guaranteed loans to
26
the extent that banks are then less capital-constrained and more willing to take on lending risks.
To the extent that the guarantee associated with SBA-guaranteed loans make them less risky,
banks would find them more attractive. At small banks, precisely those one might expect to be
most involved in small business lending, a reduction in bank capital is associated with an
increase in the volume of SBA-approved loans, although the effect is not statistically significant.
This contrasts sharply with Table 1, where a decline in bank capital is associated with a decline
in bank loans overall. In that sense, the SBA program appears to be countercyclical, providing a
stabilizing influence on small business lending. At large banks, the effect is also negative, but not
statistically significant, and at medium-sized banks the effect is positive and insignificant.
However, even the absence of a decline in SBA-guaranteed loan approvals in the face of a
decline in bank capital could be interpreted as a stabilizing influence.
Four of the six loan delinquency rates have significant effects on SBA-guaranteed loans,
with half the estimated effects being negative and half positive. Interestingly, the positive effects
are for small banks that lend predominately to small firms, suggesting that SBA-guaranteed loans
increase as small bank loan portfolios deteriorate. Increases in both the short-term and the long-
term interest rate spread measures raise the number of SBA-guaranteed loans, suggesting that as
the economic environment deteriorates, the number of loans approved increases, although only
that for the short-term spread is significant. Again, this is consistent with the SBA-guaranteed
loan program stabilizing lending over the business cycle.
Rows 2 and 3 present results for the gross loan amounts and the guaranteed portion of the
loans. The difference between these two variables is the amount of the loan for which the bank is
not guaranteed repayment, i.e., the amount at risk for the lender. Because that amount tends to be
a fairly steady proportion of the gross loan amount, the estimated effects across the two rows are
quite similar. Again, the estimated effects of small and large bank capital are negative; those of
medium bank capital are positive. However, none are statistically significant. Still, the absence
of strong significant positive estimated effects, as in Table 1 for all loans, suggests that the SBA-
guaranteed loan program stabilizes bank lending to small businesses. The majority of the loan
delinquency rates are significant. Small bank delinquency rates raise SBA-guaranteed loan
amounts, while those at large banks lower them. For medium banks, real estate loan
delinquencies lower SBA-guaranteed loan amounts, while C&I loan delinquencies have positive
but insignificant effects. Increases in both the federal funds rate and the short-term interest rate
spread significantly reduce SBA-guaranteed loan amounts, while the long-term spread tends to
raise the SBA-guaranteed loan amount.
27
Thus, these results suggest that SBA-guaranteed loans do not systematically respond to
capital pressures on banks or to state-level real economic growth rates. Indeed, their failing to
respond positively to bank capital and economic growth means that SBA-guaranteed loans likely
kept bank lending and economic growth stronger than they would have been otherwise during
periods of weak bank health or slow economic growth.
EFFECTS ON BUSINESS FAILURES AND BUSINESS BANKRUPTCIES
Table 5 presents the results for business failures and business bankruptcies based on the
explanatory variables used for Table 3. Failures of large businesses account for a minute
proportion of the total numbers of business failures. Thus, we interpret the results in Table 5 as
reflecting the outcomes for small businesses. Row 1 contains the results for business failures per
thousand residents. Rows 2 and 3 contain the results for total business bankruptcies per thousand
residents and per thousand firms, respectively. Rows 4 and 5 contain the results for Chapter 7
business bankruptcies per thousand residents and per thousand firms, respectively.
In Table 5, the most powerful estimated effect of bank capital is that of small banks’
capital on (total) business failures. None of the large banks’ capital effects are significant at close
to the 1 percent level that we estimated for small banks’ capital. The estimated effects of small
bank real estate delinquency rates are each positive, with four of the five being significant, and
the fifth being significant at better than the 10 percent level. In contrast, most estimated C&I loan
delinquency rate effects are negative, but insignificant. Though the estimated effects are never
significant at the conventional 5 percent level, SBA-guaranteed loan disbursements tend to
reduce each of the measures of business failures and bankruptcies in Table 5. But, then, nor did
higher values of the interest rate-related variables raise failures and bankruptcies as consistently
as we might have expected. Perhaps overall economic conditions had effects on failures and
bankruptcies that were long and variable, and thus not effectively captured by our specifications.
SENSITIVITY TO RECESSIONS AND MONETARY POLICY
It is sometimes alleged that small businesses are more vulnerable to overall economic
weaknesses and to higher interest rates than are larger businesses. To provide evidence on these
allegations, Tables 6 and 7 show how differently small business activity responds during periods
of slow growth and during periods of tight monetary policy. Tables 6a and 6b contain results for
years of slower and of faster economic growth. Table 6a uses the 40 percent of the sample that
had the lowest growth rates of GSP; Table 6b uses the 40 percent of the sample that had the
highest GSP growth rates. Table 7a uses only data for 1991 and 1992, the years that had the
highest values (approximately 8 percent) of the (lagged) federal funds rate during our 1991-2000
28
sample period. Table 7b uses only data for 1994 and 1995, the years when the (lagged) federal
funds rate took its lowest values (approximately 3 percent) of the 1991-2000 period.20 Table 7c
uses data for 1993 and 1996-2000, the years when the (lagged) federal funds rate uses the mid-
range values of our 1990-2000 sample period of approximately 5 percent.
Comparison of the results in Tables 6a and 6b indicates that the estimated bank capital
effects on employment, numbers of firms, and annual payrolls tend to be larger, and often
substantially larger, when economic growth is slower. Small banks’ capital tends to have
significant effects in both subperiods. At the same time, some of the largest differences across
the periods of slower and faster economic growth are also obtained for the estimated effects of
small banks’ capital on smaller businesses. The estimated effects of medium and large bank
capital are much more significant in periods of slower growth.
Thus, changes in bank capital have larger effects on real economic activity during
recessions and during periods of slower growth generally. These results suggest that bank capital
effects tended to be “procyclical”, in that bank capital reductions had larger negative effects on
businesses of all sizes when overall economic conditions were weaker. At the same time, the
direct effects of higher GSP and of higher interest rates were more statistically reliable and larger
when GSP was growing more slowly, further buttressing the pro-cyclical effects on businesses of
all sizes.21
Further adding to procyclicality, real estate loan delinquency rates at medium banks
consistently reduce employment, numbers of firms, and annual payrolls during periods of slow
growth. Real estate delinquencies at larger banks generally have insignificant effects. By
contrast, during periods of faster growth as shown in Table 6B, real estate loan delinquency rates
do not consistently affect these measures of real activity. By contrast, however, during neither
the slower nor faster growth periods alone did SBA-guaranteed loan disbursements consistently
affect real activity—despite the often statistically significant effects obtain for the full sample
period.
20 Tables 7a and 7b each include data for only two years, which limited the number of national economic variables to one. One national variable would produce the same fit as if a dummy variable for the second year were included. Table 7a (7b) uses a sample of years with the highest (lowest) interest rates. Thus, we exclude the three interest rate measures from Tables 7a and 7b. 21 In this way, our results tend to conflict with the procyclicality of bank lending promulgated by Berger and Udell (2004). Our findings might emerge, for example, if the average quality of new firms varies countercyclically. Using U.K. data, Cressy (1993) found that the quality of start-ups in a recession was higher than was the quality of start-ups in a boom period. Black et al. (1996) reported that survival rates for U.K. firms were better for firms that started in periods of high interest rates.
29
Table 7 shows that tighter monetary policy, as measured by higher federal funds interest
rates, tends to make the positive effects of bank capital even larger and more significant. Since
tighter monetary policy is usually associated with a weakening economy, these results also
suggest that real economic activity responds more to bank capital in a deteriorating economy.
Loan delinquency rates also are much more likely to have significant negative, and thus more
restraining, effects during these periods.
Larger SBA-guaranteed loan disbursements raise economic activity during periods of
tighter monetary policy. In contrast, the estimated effects of disbursements are often negative
during the periods of lower interest rates: Both of the significant effects in Table 7b and five of
the eight significant effects in Table 7c are negative. The estimated effects of real, per capita
GSP growth are all positive in the high federal funds rate subperiod, with about half being
significant. In the other two tables, the effects are mostly positive, but less likely to be
statistically significant.
Tables 6 and 7 suggest that various factors have larger effects during periods of slower
economic growth or higher interest rates. The estimated effects of bank capital and loan
delinquency rates are larger and more deleterious during recessions. During those same periods,
on the other hand, the estimated effects of offsetting factors are larger. Thus, during periods of
recession and higher interest rates, SBA-guaranteed loans might have stimulated business
activity more.
V. CONCLUSIONS
Since the late 1980s, both the national economy of the United States and its financial
sector have undergone considerable secular changes, have had considerable variation in their
growth rates, and have been struck by shocks of considerable size that emanated from both the
public and private sectors. Still, the national economy enjoyed a very long and vigorous
expansion and weathered two recessions. Similarly, the financial sector prospered (and perhaps
bubbled over) during the long expansion of the 1990s, weathered bouts of banking disruption in
the early 1990s and again in the late 1990s, and counted hundreds of commercial bank mergers.
Small businesses have long been a vital part of the U.S. economy. Firms with fewer than
100 employees accounted for one-third of all private-sector jobs and more than 95 percent of all
firms. During this period, many new small businesses were started, many failed, many continued
to prosper, and many prospered enough to no longer be categorized as “small.” Given their
30
dependence on banks for credit, it would have been remarkable if small businesses had not been
affected by recessions, monetary policy, and other national and local conditions.
We have presented estimates of the effects of bank capital, economic growth, monetary
policy, and a variety of other factors on businesses large and small. Lending at banks of all sizes
declined in response to higher federal funds rates. Lower equity capital and higher loan
delinquency rates at banks reduced their lending; they also reduced real activity at businesses of
all sizes. Interest rate spreads also reduced employment and payrolls at businesses of all sizes.
The fortunes of smaller businesses, in particular, were tied to conditions at smaller banks. This
evidence is consistent with bank-firm relationships that are developed over an extended period of
time in order to reduce the larger informational asymmetries between banks and small
businesses.
We found considerable evidence that loan guarantees raised real economic activities at
small businesses. Larger numbers and amounts of disbursements of SBA-guaranteed bank loans
were associated with more output, employment, and dollar payrolls. Disbursements of SBA-
guaranteed loans also tended to reduce, albeit modestly, business failures and bankruptcies. The
estimated effects of disbursements were particularly stimulative during periods when monetary
policy was tighter and economic growth was slower. In that light, SBA programs might be
regarded as a stabilizing force that can mitigate to some extent the adverse effects on
macroeconomic activity emanating from tighter monetary policy or deteriorations in bank
financial health. In doing so, public sector credit programs provide a reliable and potentially
powerful adjunct to monetary policy to policymakers’ seeking to improve macroeconomic
stability.
***
31
REFERENCES Administrative Office of the U.S. Courts, “U.S. Bankruptcy Courts, Business and Non-Business Filings by State,” 2003. http://www.uscourts.gov Berger, Allen N. and Gregory F. Udell, “Universal Banking and the Future of Small Business Lending,” in A. Saunders and I. Walters, eds., Financial System Design: The Case for Universal Banking. Burr Ridge, Ill. Irwin, 1996. Berger, Allen N. and Gregory F. Udell, “The Economics of Small Business Finance: The Roles
of Private Equity and Debt Markets in the Financial Growth Cycle,” Journal of Banking and Finance, Vol. 22, Issue 6-8 (August 1998) 613-673.
Berger, Allen N. and Gregory F. Udell, “Small Business Credit Availability and Relationship
Lending: The Importance of Bank Organizational Structure,” The Economic Journal, Vol. 112, (February 2002) F32-F53.
Berger, Allen N. and Gregory F. Udell, “The Institutional Memory Hypothesis and the
Procyclicality of Bank Lending Behavior,” Journal of Financial Intermediation, Vol. 13, (2004) 458-495.
Berger, Allen N., Richard S. Rosen, and Gregory F. Udell, “The Effects of Bank Market Size Structure on Bank Competition: The Case of Small Business Lending,” Proceedings of the 37th Annual Conference on Bank Structure and Competition, Federal Reserve Bank of Chicago, 2001.
Bernanke, Ben and Mark Gertler, “Inside the Black-box: The Credit Channel of Monetary Policy Transmission,” Journal of Economic Perspectives, Vol. 9 (Fall 1995) 27-48.
Bernanke, Ben, Mark Gertler, and Simon Gilchrist, “The Financial Accelerator, and the Flight to Quality,” Review of Economics and Statistics, Vol. 78 (February 1996) 1-15.
Black, Jane, David De Meza and David Jeffreys, “House Prices, the Supply of Collateral and the
Enterprise Economy,” The Economic Journal, Vol. 106 (January 1996) 60-75. Calomiris, Charles W., Charles P. Himmelberg, and Paul Wachtel, “Commercial Paper,
Corporate Finance, and the Business Cycle: A Microeconomic Perspective,” Carnegie-Rochester Conference Series on Public Policy, Vol. 42 (June 1995) 203-250.
Cole, Robert A., Lawrence G. Goldberg, Lawrence J. White, “Cookie-Cutter versus Character:
the Micro Structure of Small Business Lending by Large and Small Banks,” Journal of Financial and Quantitative Analysis, Vol. 39, No. 2 (June 2004) 227-251.
Craig, Ben R., William E. Jackson III, and James B. Thomson, “Small Firm Finance, Credit Rationing, and the Impact of SBA-Guaranteed Lending on Local Economic Growth,” Journal of Small Business Management, Vol. 45, No. 1 (2007) 116-132.
Craig, Ben R., William E. Jackson III, and James B. Thomson, “Credit Market Failure Intervention: Do Government-Sponsored Small Business Credit Programs Enrich Poorer Areas?” Small Business Economics, forthcoming.
Cressy, Robert C., The Startup Tracking Exercise: Third Year Report, the Westminster Bank of
Great Britain (November 1993).
Cressy, Robert C., “European Loan Guarantee Schemes: Who has Them, Who Pays, and Who Gains?,” in B. Green, ed., Risk Behaviour and Risk Management in Business Life, Netherlands. Kluwer, 2000.
Cressy, Robert C., “Funding Gaps: A Symposium,” The Economic Journal, Vol. 112 (February 2002), F1-F16.
De Marco, David, “Overlending?,” The Economic Journal, Vol. 112, Vol. 112 (February 2002), F32-F53.
Dunkelberg, William C., “Small Firms Not Feeling the Credit Crunch,” National Federation of
Independent Businesses, May 18, 2001. http://www.nfib.com Federal Reserve Bank of Chicago, “Commercial Bank and Holding Company Database,” 2003.
http://www.chicagofed.org/economicresearchanddata/data/bhcdatabase/index.cfm Federal Reserve Board, “Senior Loan Officer Opinion Survey on Bank Lending Practices.” 2003a. http://www.federalreserve.gov/boarddocs/SnLoanSurvey/ Federal Reserve Board, “Statistics: Releases and Historical Data,” 2003b.
http://www.federalreserve.gov/releases/ Hancock, Diana, and James A. Wilcox, “Bank Capital and the Credit Crunch: The Roles of Risk-
Weighted and Unweighted Capital Regulations,” American Real Estate and Urban Economics Association Journal, Vol. 22 (1994) 59-94.
Hancock, Diana, and James A. Wilcox, “The ‘Credit Crunch’ and the Availability of Credit to
Small Business,” Journal of Banking and Finance, Vol. 22 (1998) 983-1014. Kashyap, Anil K. and Jeremy C. Stein, “Monetary Policy and Bank Lending,” in N. Gregory
Mankiw, ed., Monetary Policy, Chicago, IL: University of Chicago Press (1994a) 221-56. Kashyap, Anil K. and Jeremy C. Stein, “The Impact of Monetary Policy on Bank Balance
Sheets,” Carnegie-Rochester Conference Series on Public Policy, Vol. 42, (June 1994b), 151-95.
Kashyap, Anil K. and Jeremy C. Stein, “What Do a Million Observations on Banks Say about
the Transmission of Monetary Policy?” The American Economic Review, Vol. 90 (June 2000) 407-28.
Kishan, Ruby P., and Timothy P. Opiela, “Bank Size, Bank Capital, and the Bank Lending Channel,” Journal of Money, Credit and Banking, Vol. 32, No. 1, (February 2000) 121-141.
Lown, Cara S., Donald P. Morgan, and Sonali Rohatgi, “Listening to Loan Officers: The Impact
of Commercial Credit Standards on Lending and Output,” Federal Reserve Bank of New York Economic Policy Review, Vol. 6, No. 2 (July 2000) 1-16.
Mach, Traci L., and John D. Wolken, “Financial Services used by Small Business: Evidence
from the 2003 Survey of Small Business Finances,” Federal Reserve Bulletin (October 2006) A167-A195.
Peek, Joe and Eric S. Rosengren, “The Capital Crunch: Neither a Borrower Nor a Lender Be,”
Journal of Money, Credit and Banking, Vol. 27, No. 3 (August 1995) 625-638. Peek, Joe and Eric S. Rosengren, “Bank Consolidation and Small Business Lending: It's Not Just
Bank Size that Matters,” Journal of Banking and Finance (August 1998a) 799-819. Peek, Joe and Eric S. Rosengren, “The Evolution of Bank Lending to Small Business,” New
England Economic Review (March/April 1998b) 27-36.
Petersen, Mitchell and Raghuram Rajan, “The Benefits of Lending Relationships: Evidence from Small Business Data,” The Journal of Finance, Vol. 49, Issue 1 (March 1994) 3-37.
Rhyne, Elisabeth, Small Business, Banks, and SBA Loan Guarantees: Subsidizing the Weak or
Bridging a Credit Gap? New York, New York: Quorum Books, 1988. U.S. Bureau of the Census, “The Statistical Abstract of the United States,” 2001.