1. MFPED;2. Bank of Uganda;3. Uganda Bureau of Statistics;4. Economic Policy Research Centre;5. Capital Markets Authority;6. Uganda Retirements Benefits Authority;7. National Social Security Fund;8. Uganda Development Bank Ltd;9. Uganda Investment Authority;10. Private Sector Foundation;11. Insurance Regulatory Authority; and12. Financial Intelligence Authority
3. Inspectorate of Government;4. Directorate of Ethics
and Integrity
Sustainable Macro Economic Stability
Fiscal Credibility and Sustainability
Value for Money in the utilisation of public Resources
Sector
Thematic Areas
Subsectors
Institutions
Outcomes
THE REPUBLIC OF UGANDA
Accountability Sector Strategic Investment Plan
2017/18 - 2019/20
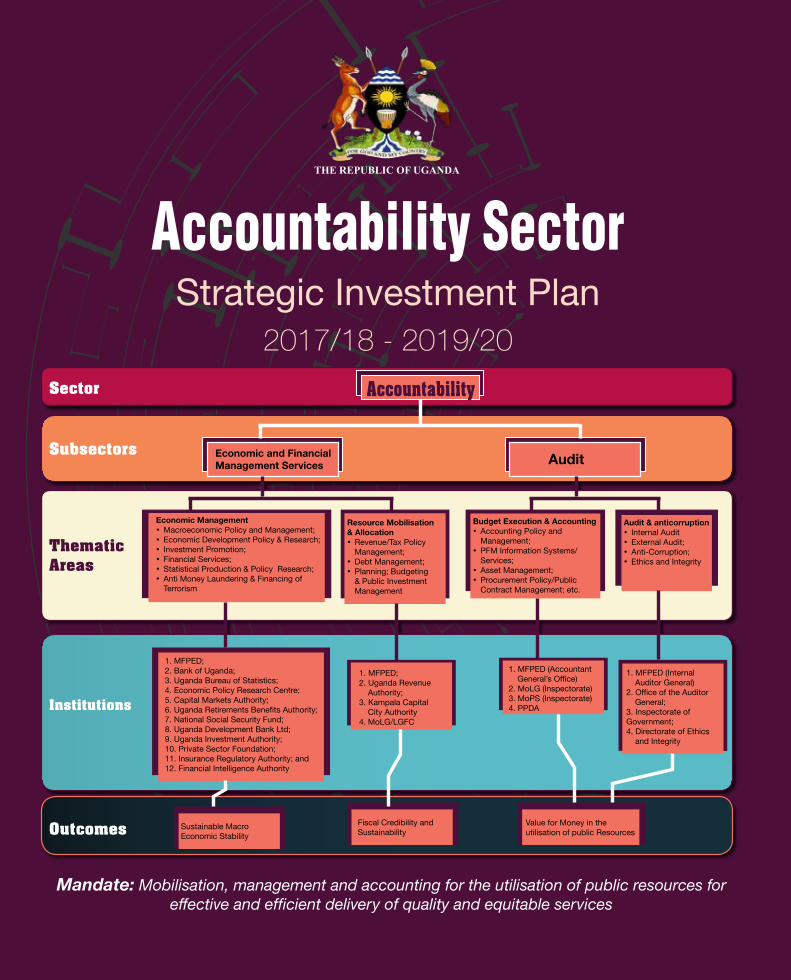
Mandate: Mobilisation, management and accounting for the utilisation of public resources for effective and efficient delivery of quality and equitable services
| i
Accountability Sector Strategic Investment Plan 2017/18 - 2019/20
ContentsForeword ................................................................................................... vAcronyms ................................................................................................. viExecutive Summary .................................................................................. xi
1.0 Introduction and Background ..........................................................11.1 Overview of the Accountability Sector ............................................1
1.1.1 Accountability Sector Mandate and Thematic Areas ............................11.1.2 Accountability Sector Institutions and their mandates ..........................21.1.3 Management of the Accountability Sector .............................................7
1.2 Methodology for ASSIP review ........................................................8
2.2.1 Economic Management ..........................................................................92.2.2 Resource mobilisation and allocation ...................................................192.2.3 Budget Execution, Accounting, Audit and Anticorruption ....................26
2.3 Strength and weaknesses ..............................................................352.3.1 Sector Strategies and Policies .............................................................352.3.2 Sector Management structures ............................................................372.3.3 Staff and Skills ......................................................................................402.3.4 Systems ................................................................................................402.3.5 Financial Resources .............................................................................41
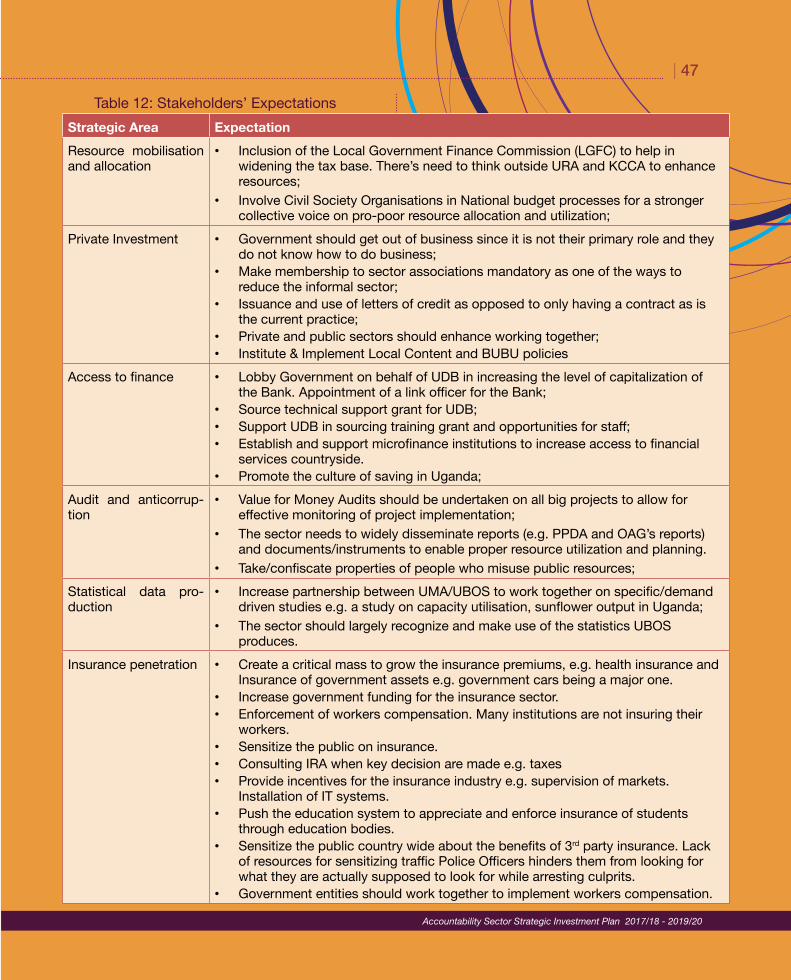
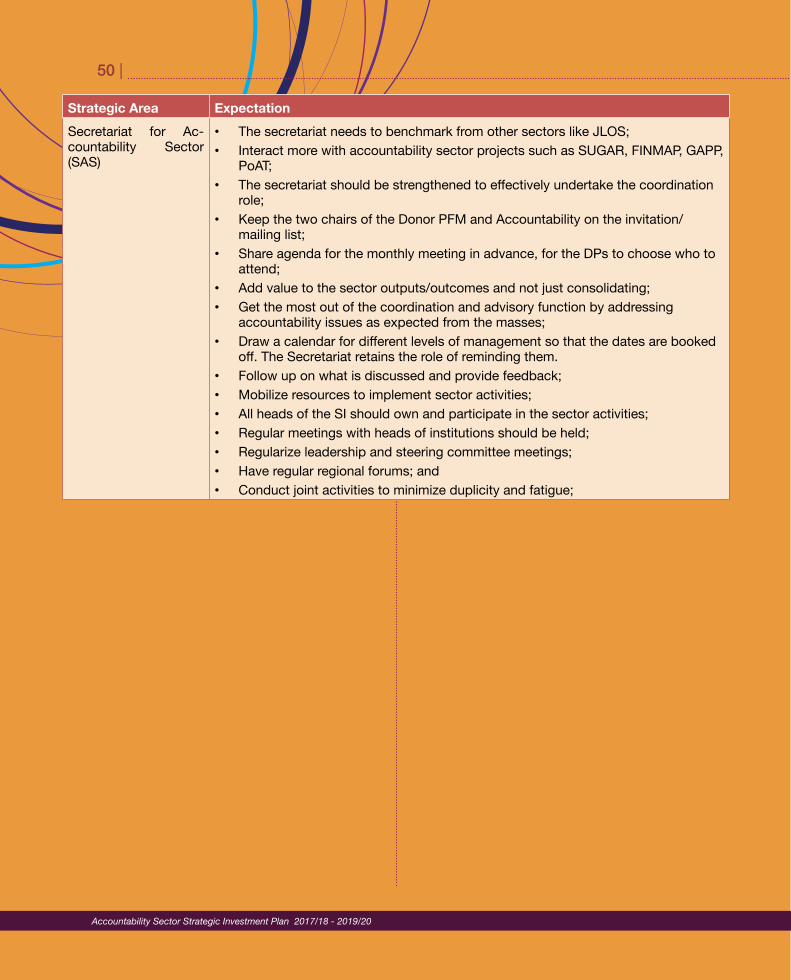
2.4 Opportunities and threats ...............................................................442.5 Stakeholders and their expectations .............................................46
3.0 Strategic Direction ..........................................................................513.1 Strategic Intent ...............................................................................51
3.2 Strategies ........................................................................................523.2.1 Economic Management Strategies ......................................................523.2.2 Resource Mobilisation and Allocation Strategies ................................553.2.3 Budget Execution and Accounting Strategies......................................573.2.4 Audit and Anticorruption Strategies .....................................................593.2.5 Communication and Public Relations Strategy ...................................61
4.0 Institutional Arrangements for Implementing the ASSIP .............654.1 Leadership Committee ...................................................................654.2 Steering Committee ........................................................................654.3 Sector Working Group.....................................................................66
4.3.1 Technical Working Groups ....................................................................684.3.2 Accountability Centres at Local Governments .....................................70
5.1.1 Funding requirements for non-vote accountability sector institutions .74
5.2 Sources of Funds .............................................................................745.2.1 Medium Term Expenditure Framework (MTEF) ....................................745.2.2 Donor Project Support .........................................................................755.2.3 Own Sources ........................................................................................75
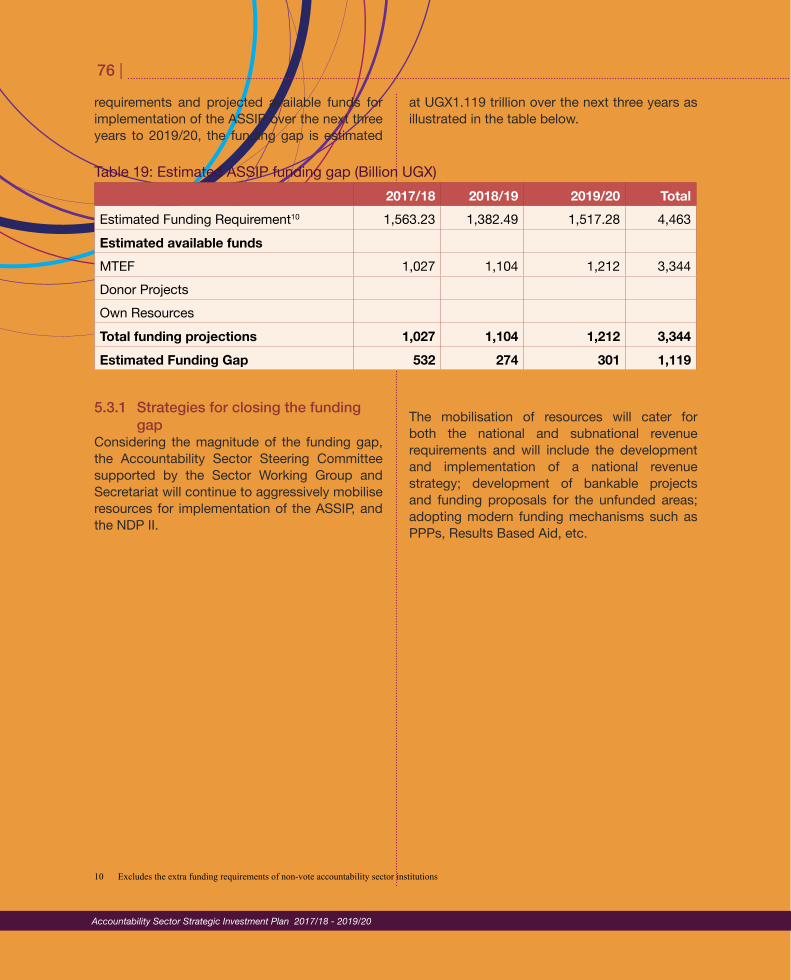
5.3 The Funding Gap .............................................................................755.3.1 Strategies for closing the funding gap .................................................76
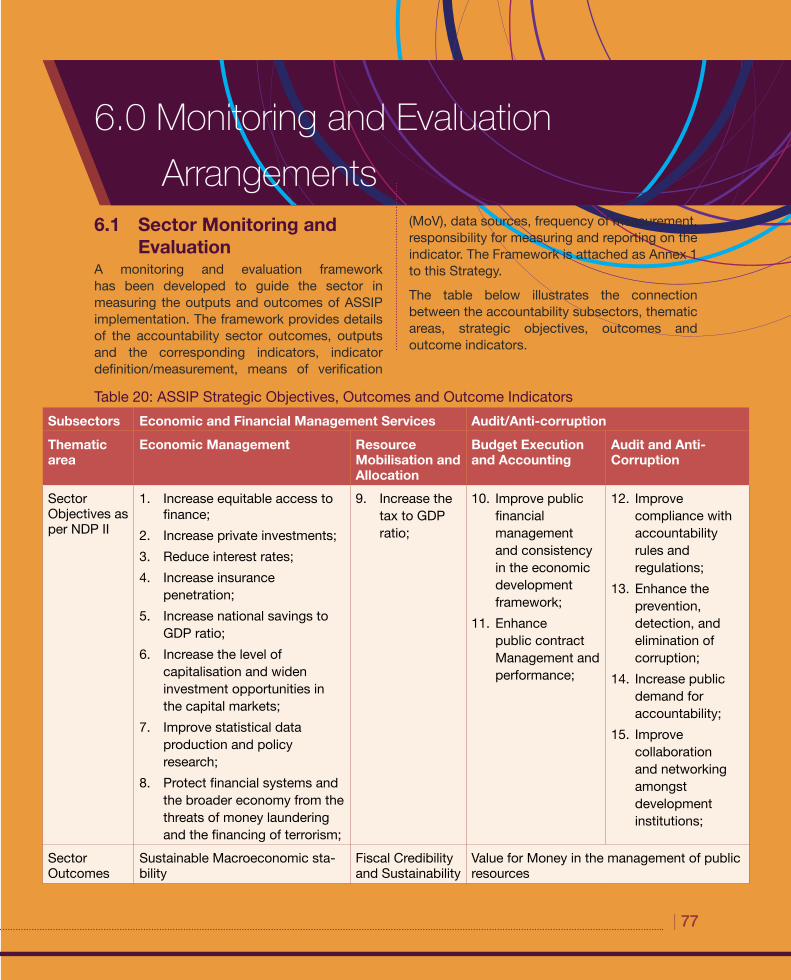
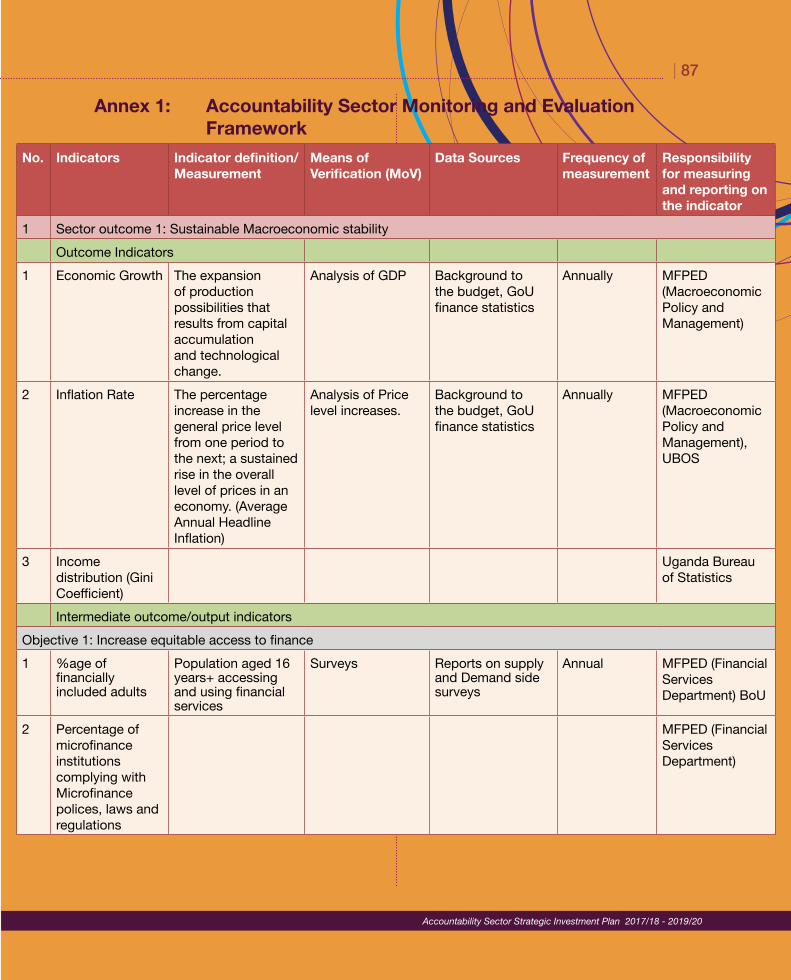
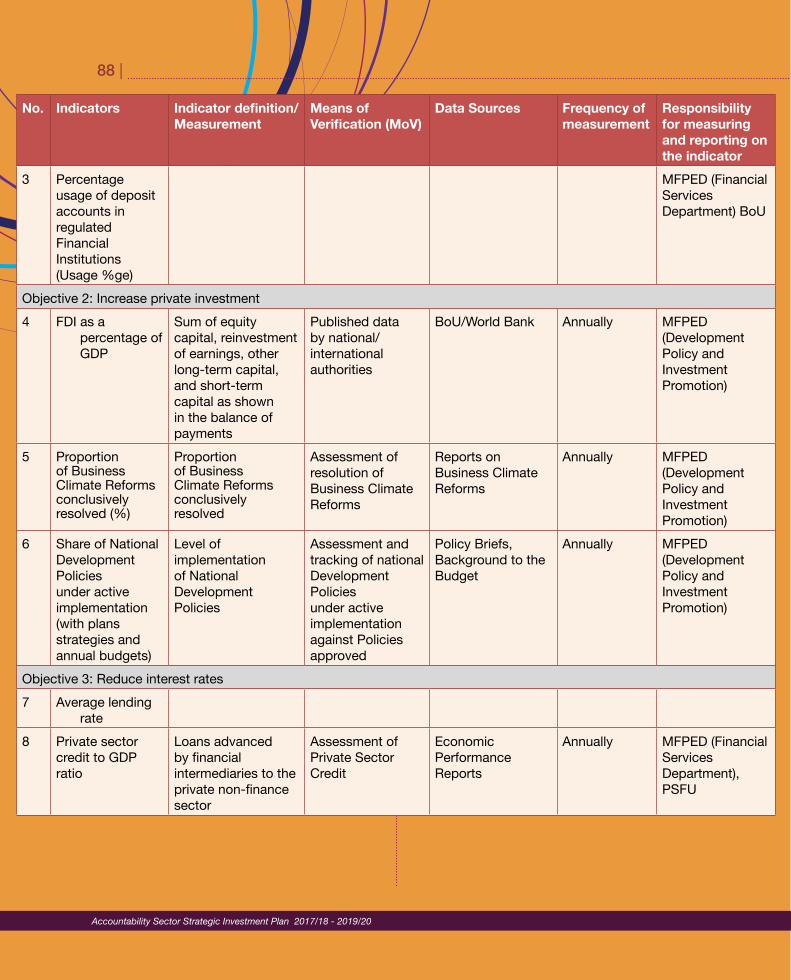
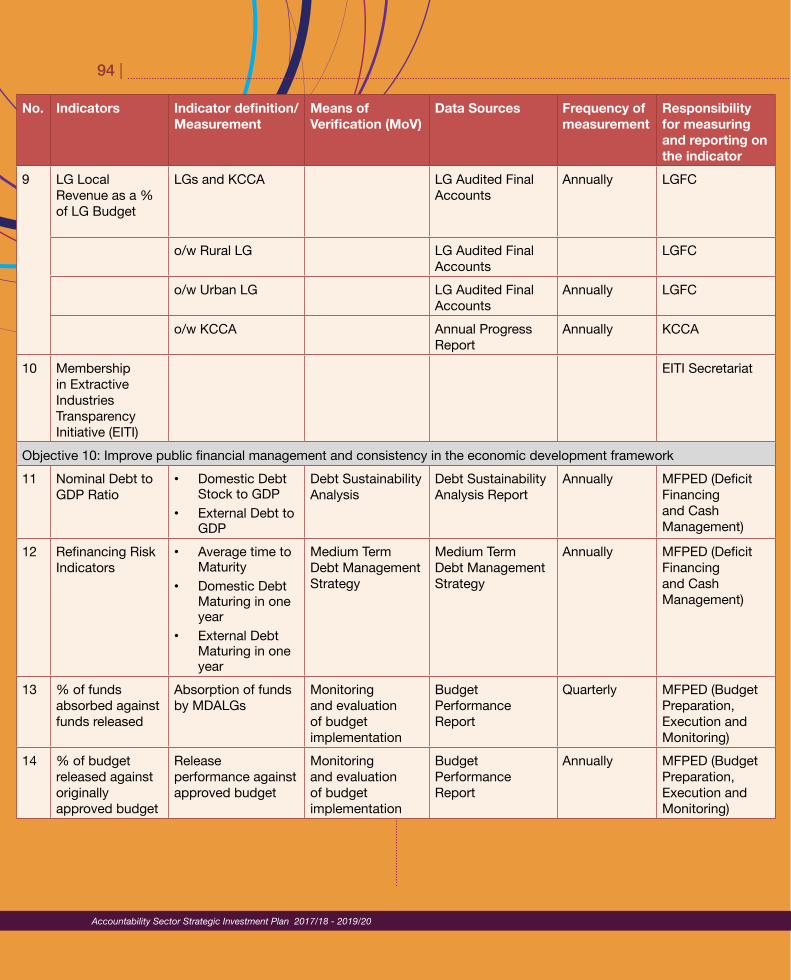
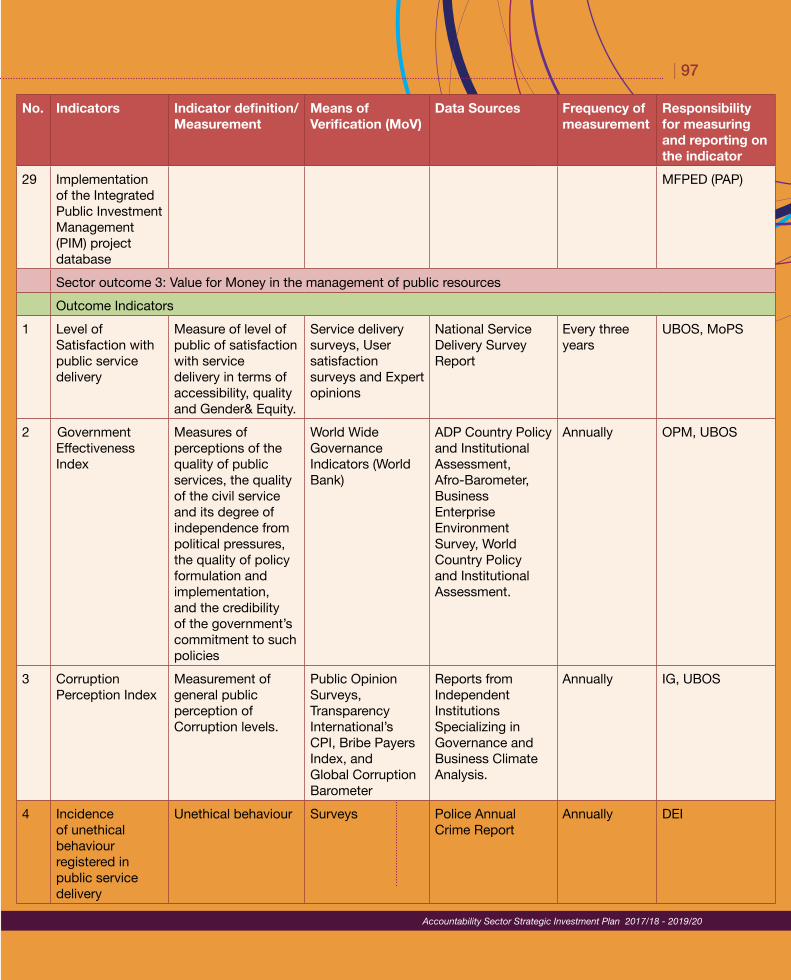
6.0 Monitoring and Evaluation Arrangements ....................................776.1 Sector Monitoring and Evaluation ................................................776.2 Sector M&E plan ..............................................................................78Annex 1: Accountability Sector Monitoring and Evaluation Frame-
work .......................................................................................87Annex 2: List of Organisations/Individuals Consulted ....................104Annex 3: ASSIP Review Taskforce Members ...................................107Annex 4: References ...........................................................................108
| iii
Accountability Sector Strategic Investment Plan 2017/18 - 2019/20
List of FiguresFigure 1: Economic Growth Rate ...........................................................10
Accountability Sector Strategic Investment Plan 2017/18 - 2019/20
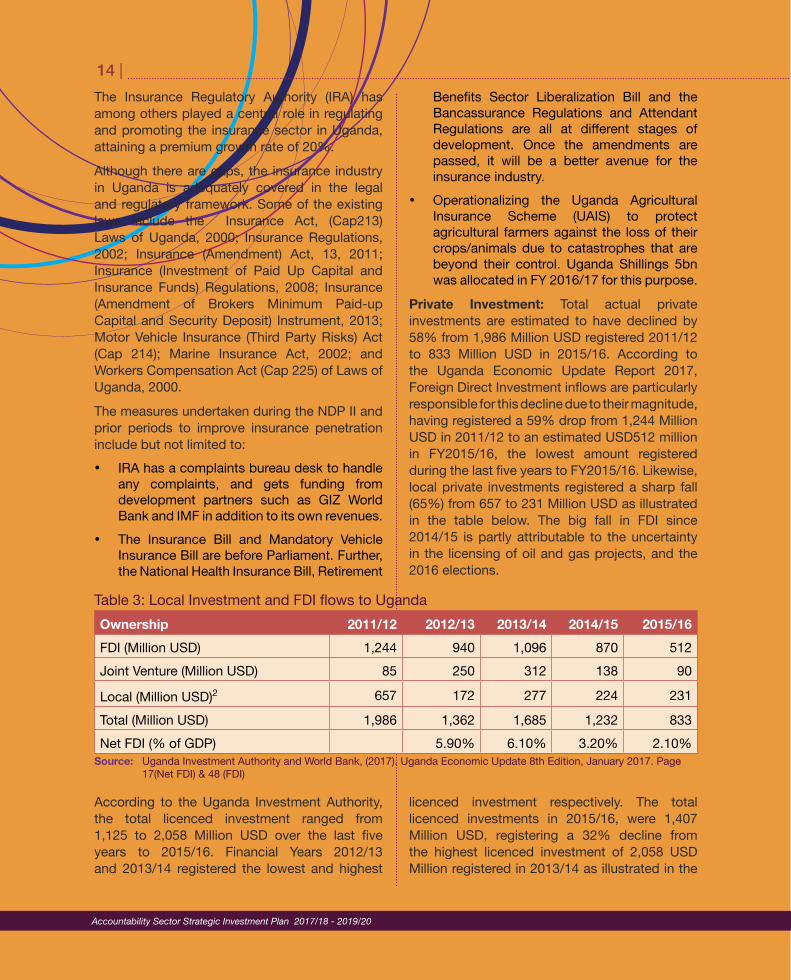
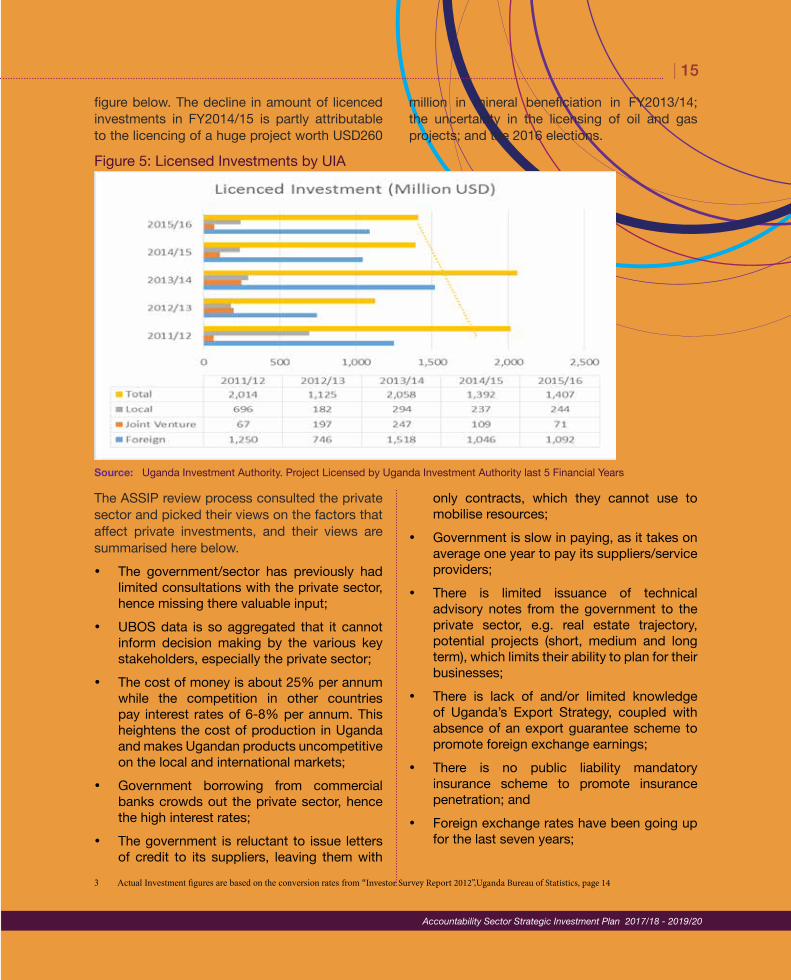
List of TablesTable 1: Accountability Sector Thematic Areas ......................................1Table 2: Insurance Sector Past Performance .......................................13Table 3: Local Investment and FDI flows to Uganda ...........................14Table 4: Uganda Capital Market Summary
Statistics – End December 2016 .............................................17Table 5: Past Performance of selected Revenue Indicators .................20Table 6: Debt to GDP ratios ..................................................................22Table 7: Past performance of selected Public
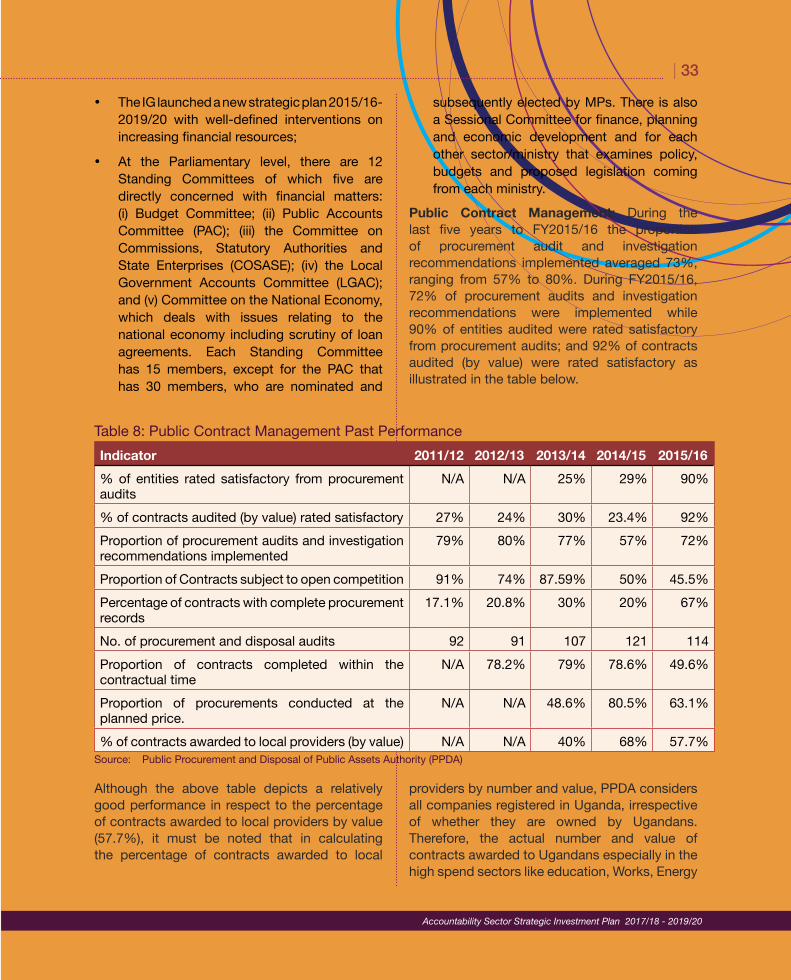
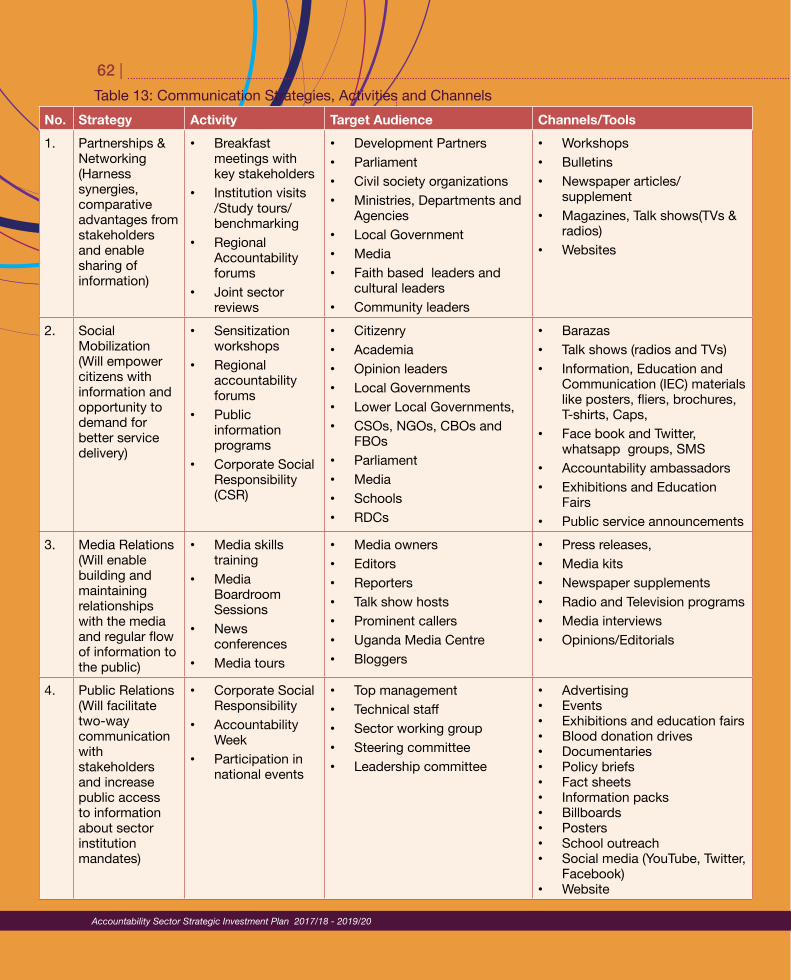
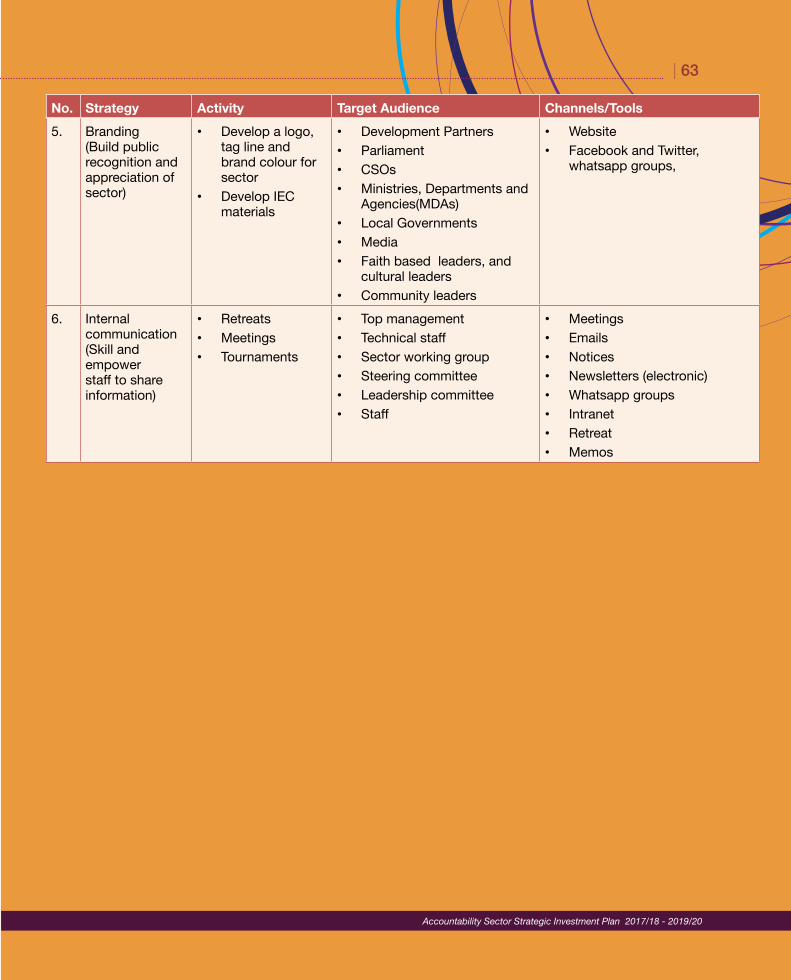
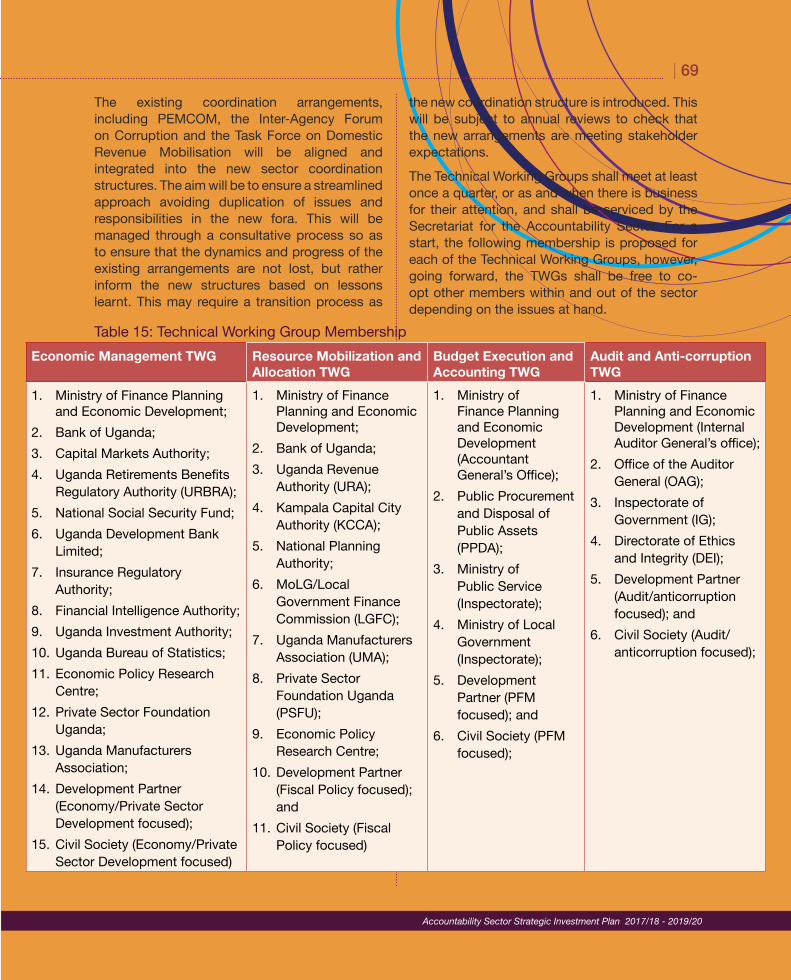
Debt Management Indicators ..................................................22Table 8: Public Contract Management Past Performance ...................33Table 9: Sector Strategies, Policies and Laws......................................36Table 10: Accountability Sector Unfunded Priorities FY 2017/18 ..........43Table 11: Communication and Public Relations SWOT analysis ............46Table 12: Stakeholders’ Expectations ....................................................47Table 13: Communication Strategies, Activities and Channels ..............62Table 14: Accountability Sector Technical Working Groups ...................68Table 15: Technical Working Group Membership ...................................69Table 16: Accountability Sector Funding Requirements (Billion UGX) ...73Table 17: Funding requirements for non-vote
Outcomes and Outcome Indicators ........................................77Table 21: Sector M&E Plan ....................................................................78Table 22: Accountability Sector Outcome and Output Targets ..............79
| v
ForewordThe Accountability Sector is concerned with the mobilisation, management and accounting for the utilisation of public resource for effective and efficient delivery of quality and equitable services. The sector is composed of two subsectors of economic and financial management; and audit; and focuses on four thematic areas covering economic management; resource mobilisation and allocation; budget execution and accounting; audit and anticorruption; all playing a crucial role in creating an enabling environment for Uganda’s inclusive growth and development, and strengthening its competitiveness for sustainable wealth creation and employment. This Strategic Investment Plan is premised on the above mandate and lays down the sector’s achievements over the last five years; and its current strengths, weaknesses, opportunities and threats. The plan further stipulates the Accountability Sector’s vision, mission, goals and objectives; and the strategies the sector will pursue over the next three years to achieve its goals and objectives, as well as those of the NDPII. During the implementation period of this strategic investment plan, the sector will aim to achieve three main outcomes i.e. Sustainable Macroeconomic Stability; Fiscal Credibility and Sustainability; and Value for Money in the management public resources. Accordingly, a monitoring and evaluation framework has been developed to progressively measure the achievement of these outcomes and corresponding outputs.The process of developing this plan was consultative and participatory, involving all the 20 sector institutions, development partners and civil society by way of interviews and participation in retreats and workshops, which were augmented by intensive document reviews, all aimed at fully understanding and appreciating the environment in which the sector operates, and discussing and agreeing strategies to be pursued by the sector to achieve its goals and objectives.The Accountability Sector has over the last three years implemented the first Strategic Investment Plan (ASSIP I), and I am happy to note that commendable strides were made in strengthening public accountability for improved service delivery. However, there are still concerns of lack of value for money in service delivery, inadequate resource mobilisation and slow economic growth which may curtail the realization of both the NDP II and SDG goals. As we implement this Strategic Plan, greater focus shall be put on increased coordination, communication and building synergies amongst the Sector stakeholders.I would like to take this opportunity to extend my sincere appreciation to the Accountability Sector Leadership and Steering Committee, Sector Working Group, ASSIP Review Taskforce, Secretariat for Accountability Sector and everybody that participated in the development of this strategic investment plan. I also wish to recognise and appreciate Mr. Anthony Kintu Mwanje, the Accountability Sector Coordinator for the extra work invested in preparing and finalising this ASSIP. For God and My Country
Hon Matia Kasaija
Minister of Finance, Planning and Economic Development/Chairperson, Accountability Sector Leadership Committee
Accountability Sector Strategic Investment Plan 2017/18 - 2019/20
vi |
Accountability Sector Strategic Investment Plan 2017/18 - 2019/20
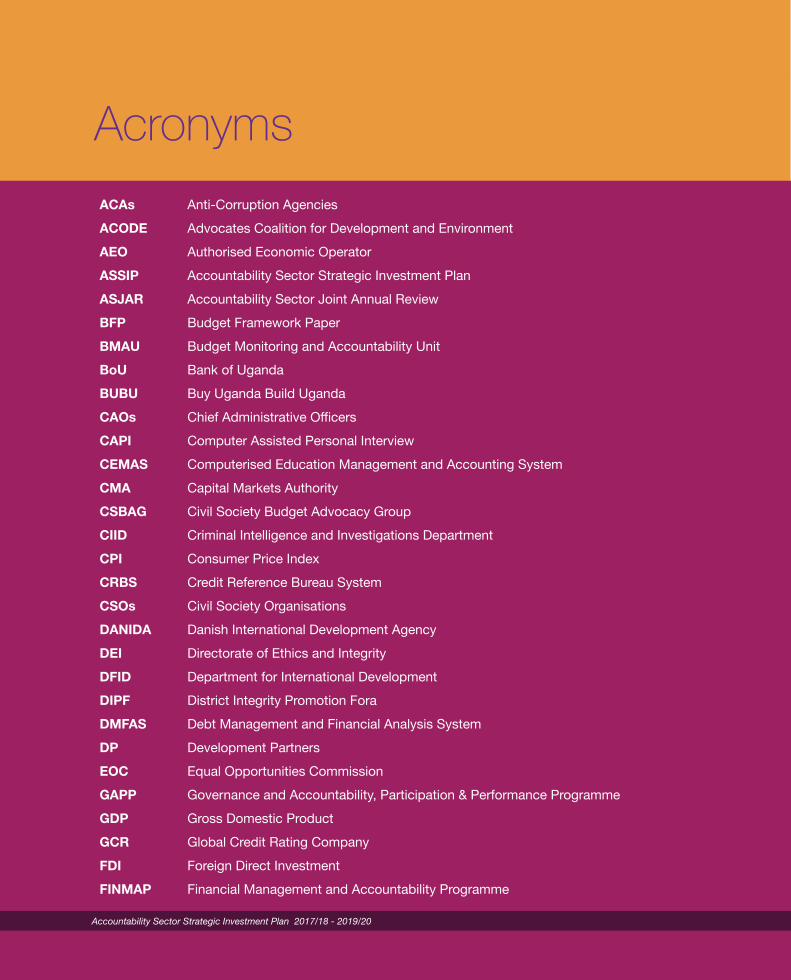
AcronymsACAs Anti-Corruption AgenciesACODE Advocates Coalition for Development and EnvironmentAEO Authorised Economic OperatorASSIP Accountability Sector Strategic Investment PlanASJAR Accountability Sector Joint Annual Review BFP Budget Framework PaperBMAU Budget Monitoring and Accountability UnitBoU Bank of UgandaBUBU Buy Uganda Build UgandaCAOs Chief Administrative OfficersCAPI Computer Assisted Personal Interview CEMAS Computerised Education Management and Accounting SystemCMA Capital Markets AuthorityCSBAG Civil Society Budget Advocacy GroupCIID Criminal Intelligence and Investigations DepartmentCPI Consumer Price IndexCRBS Credit Reference Bureau SystemCSOs Civil Society OrganisationsDANIDA Danish International Development AgencyDEI Directorate of Ethics and Integrity DFID Department for International Development DIPF District Integrity Promotion Fora DMFAS Debt Management and Financial Analysis SystemDP Development PartnersEOC Equal Opportunities CommissionGAPP Governance and Accountability, Participation & Performance Programme GDP Gross Domestic ProductGCR Global Credit Rating Company FDI Foreign Direct InvestmentFINMAP Financial Management and Accountability Programme
| vii
Accountability Sector Strategic Investment Plan 2017/18 - 2019/20
FY Financial Year GIZ Gesellschaft für Internationale ZusammenarbeitHon. Honourable IFMS Integrated Financial Management SystemIG Inspectorate of GovernmentIOSCO International Organization of Securities CommissionsIPFS Indicative Planning FiguresIPPS Integrated Payroll and Pension SystemIPPU Institute of Procurement Professionals of UgandaIPSAS International Public Sector Accounting StandardsIGG Inspector General of GovernmentIMF International Monetary FundIT Information TechnologyKCCA Kampala Capital City AuthorityLG Local GovernmentLGSSP Local Government Sector Strategic PlanMAAIF Ministry of Agriculture, Animal Industry and FisheriesMDAs Ministries, Departments and AgenciesMEMD Ministry of Energy Minerals and DevelopmentMGLSD Ministry of Gender, Labour and Social DevelopmentMoFPED Ministry of Finance Planning and Economic DevelopmentMoLG Ministry of Local GovernmentMoPS Ministry of Public ServiceMoWT Ministry of Works and TransportMPS Ministerial Policy StatementNACS National Anti-Corruption Strategy NCDC National Curriculum Development Centre NDP National Development PlanNEMA National Environment Management AuthorityNIRA National Identification and Registration Authority
viii |
Accountability Sector Strategic Investment Plan 2017/18 - 2019/20
NPA National Planning AuthorityNRM National Resistance MovementNSSF National Social Security FundNSS National Statistical SystemNTR Non Tax RevenueNUSAF Northern Uganda Social Action FundOAG Office of Auditor GeneralODA Organizational Development Assessment OIG Office of Inspector GeneralPAC Public Accounts CommitteePAIPAS Pearl of Africa Institutional Performance Assessment Scorecard PBB Program Based BudgetingPBS Program Based Budgeting SystemPEC Presidential Economic CouncilPCC Pornography Control Committee PEFA Public Expenditure and Financial AccountabilityPEMCOM Public Expenditure Management CommitteePIRT Presidential Investor Round TablePFMA Public Financial Management ActPoAT Promotion of Accountability and Transparency PPDA Public Procurement and Disposal of Public Assets AuthorityPS/ST Permanent Secretary/Secretary to the TreasuryPSFU Public Sector Foundation UgandaPTCs Primary Teachers’ Colleges PUSATI Public Universities and Self Accounting Tertiary InstitutionsRFBO Religious and Faith Based OrganizationsSCT Single Customs Territory SSPs Sector Strategic Plans SWG Sector Working Group
| ix
Accountability Sector Strategic Investment Plan 2017/18 - 2019/20
SUGAR Strengthening Uganda’s Anti-Corruption and Accountability RegimeTAAC Transparency, Accountability, and Anti-corruptionTIN Tax Identification NumberTREP Tax Register Expansion ProgrammeTSA Treasury Single Account UBOS Uganda Bureau Of Statistics UDB Uganda Development BankUG UgandaUIA Uganda Investment AuthorityUNBS Uganda National Bureau of StandardsUNCaC United Nations Convention against CorruptionUNDP United Nations Development ProgrammeUFIA Uganda Financial Intelligence AuthorityURA Uganda Revenue AuthorityURBRA Uganda Retirement Benefits Regulatory AuthorityURSB Uganda Registration Services BureauUSAID United States Agency for International DevelopmentVAT Valued Added TaxVFM Value For Money
Executive Summary
| xi
Accountability Sector Strategic Investment Plan 2017/18 - 2019/20
Executive Summary
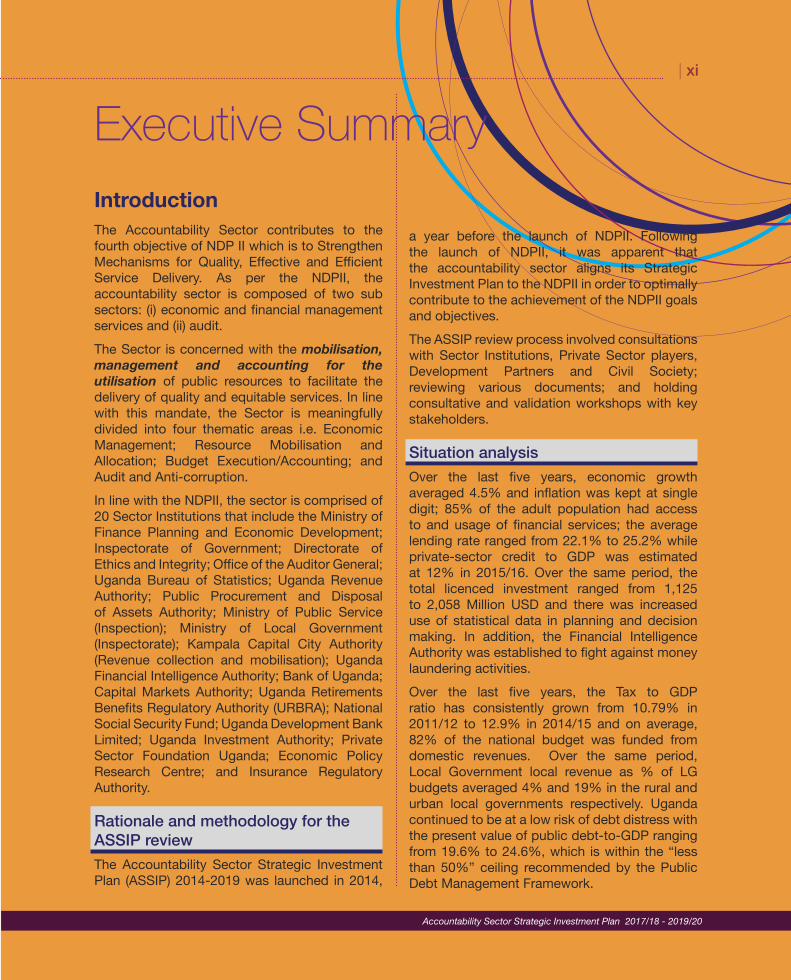
a year before the launch of NDPII. Following the launch of NDPII, it was apparent that the accountability sector aligns its Strategic Investment Plan to the NDPII in order to optimally contribute to the achievement of the NDPII goals and objectives.The ASSIP review process involved consultations with Sector Institutions, Private Sector players, Development Partners and Civil Society; reviewing various documents; and holding consultative and validation workshops with key stakeholders.
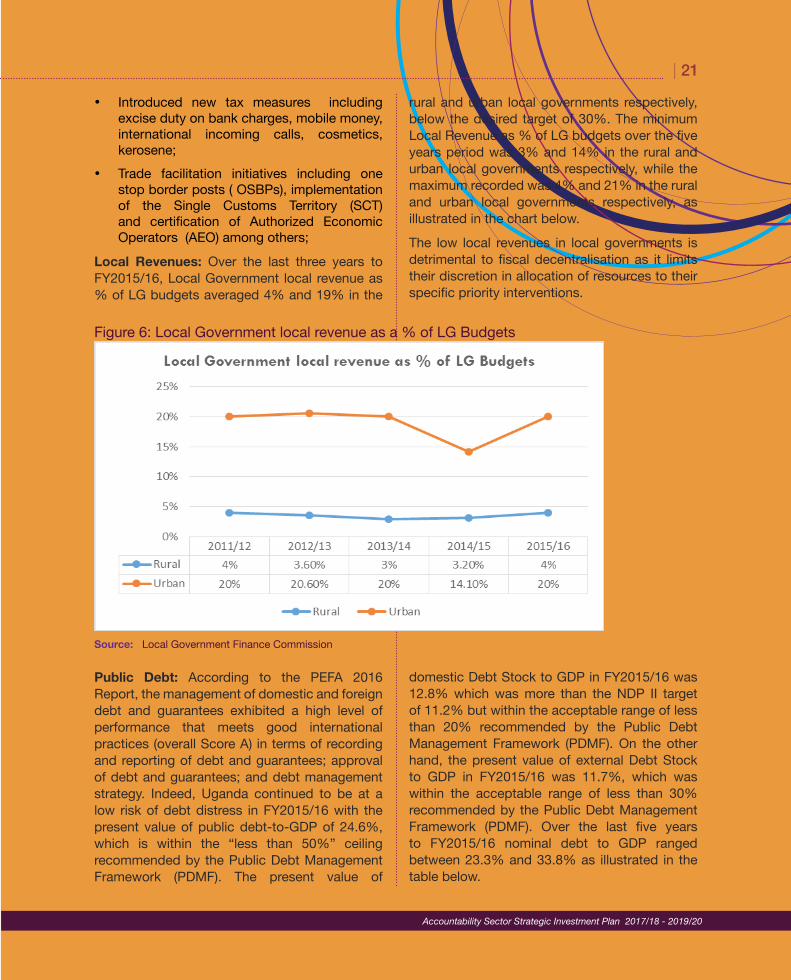
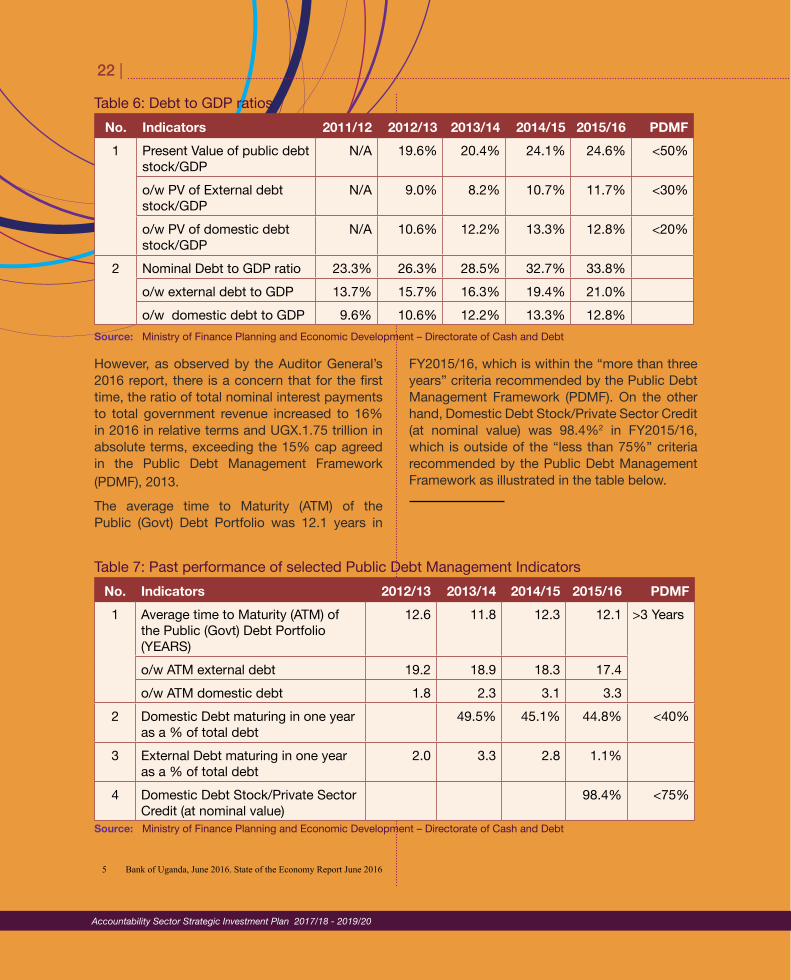
Situation analysisOver the last five years, economic growth averaged 4.5% and inflation was kept at single digit; 85% of the adult population had access to and usage of financial services; the average lending rate ranged from 22.1% to 25.2% while private-sector credit to GDP was estimated at 12% in 2015/16. Over the same period, the total licenced investment ranged from 1,125 to 2,058 Million USD and there was increased use of statistical data in planning and decision making. In addition, the Financial Intelligence Authority was established to fight against money laundering activities.Over the last five years, the Tax to GDP ratio has consistently grown from 10.79% in 2011/12 to 12.9% in 2014/15 and on average, 82% of the national budget was funded from domestic revenues. Over the same period, Local Government local revenue as % of LG budgets averaged 4% and 19% in the rural and urban local governments respectively. Uganda continued to be at a low risk of debt distress with the present value of public debt-to-GDP ranging from 19.6% to 24.6%, which is within the “less than 50%” ceiling recommended by the Public Debt Management Framework.
IntroductionThe Accountability Sector contributes to the fourth objective of NDP II which is to Strengthen Mechanisms for Quality, Effective and Efficient Service Delivery. As per the NDPII, the accountability sector is composed of two sub sectors: (i) economic and financial management services and (ii) audit. The Sector is concerned with the mobilisation, management and accounting for the utilisation of public resources to facilitate the delivery of quality and equitable services. In line with this mandate, the Sector is meaningfully divided into four thematic areas i.e. Economic Management; Resource Mobilisation and Allocation; Budget Execution/Accounting; and Audit and Anti-corruption. In line with the NDPII, the sector is comprised of 20 Sector Institutions that include the Ministry of Finance Planning and Economic Development; Inspectorate of Government; Directorate of Ethics and Integrity; Office of the Auditor General; Uganda Bureau of Statistics; Uganda Revenue Authority; Public Procurement and Disposal of Assets Authority; Ministry of Public Service (Inspection); Ministry of Local Government (Inspectorate); Kampala Capital City Authority (Revenue collection and mobilisation); Uganda Financial Intelligence Authority; Bank of Uganda; Capital Markets Authority; Uganda Retirements Benefits Regulatory Authority (URBRA); National Social Security Fund; Uganda Development Bank Limited; Uganda Investment Authority; Private Sector Foundation Uganda; Economic Policy Research Centre; and Insurance Regulatory Authority.
Rationale and methodology for the ASSIP reviewThe Accountability Sector Strategic Investment Plan (ASSIP) 2014-2019 was launched in 2014,
xii |
Accountability Sector Strategic Investment Plan 2017/18 - 2019/20
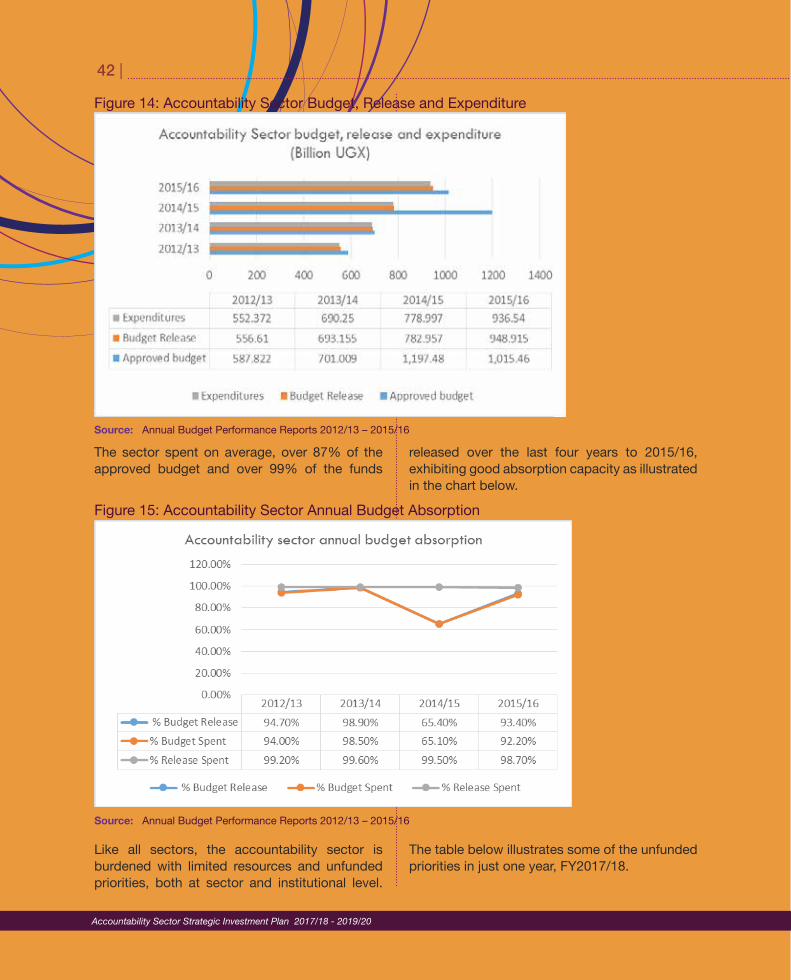
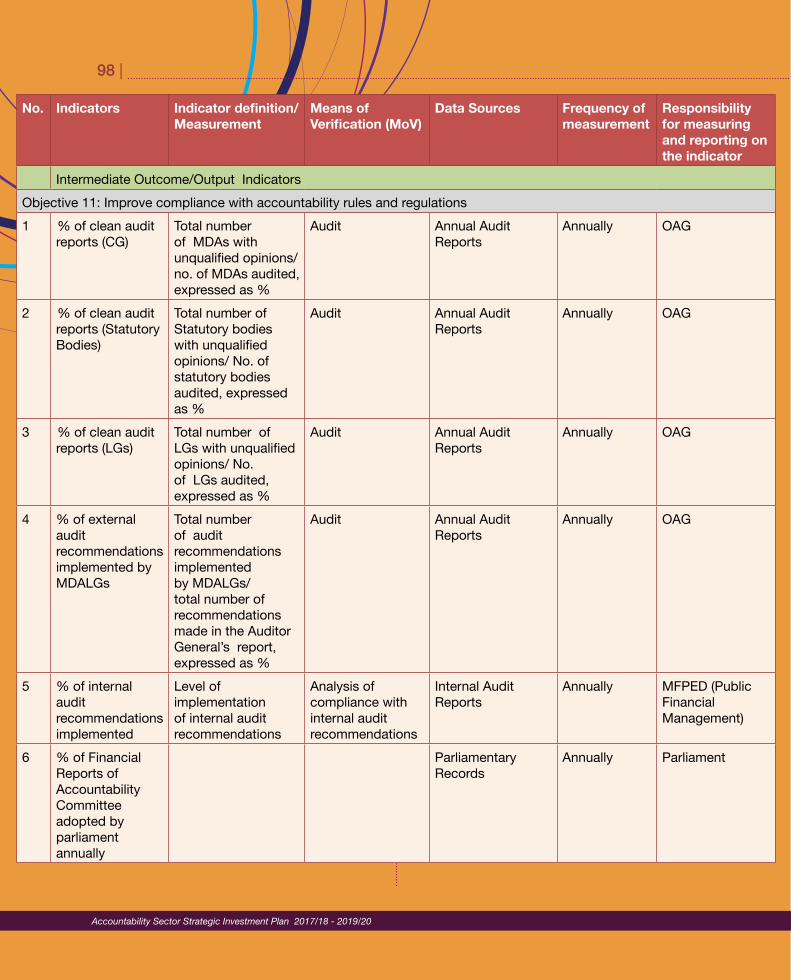
Fiscal Balance (% of GDP) ranged between 2.5% and 4.7% over the last five years, exceeding the 3% ceiling recommended by the macroeconomic convergence criteria of the EAC monetary union. The approved national budget grew by 71% over the last five years, from UGX9.794 trillion in 2011/12 to UGX16.735 trillion in 2015/16. Likewise, the amount of the approved national budget released has grown by 53% from 8.525 trillion in 2011/12 to UGX13.054 trillion in 2015/16.The percentage of central government entities, statutory bodies and local governments with clean audit reports has greatly and steadily improved, from 45%, 41% and 32% in 2011/12 to 77%, 79% and 85.7% in 2015/16 respectively. There was a steady growth in the percentage of internal audit recommendations implemented by MDALGs annually, from 54.45% in 2012/13 to 66.2% in 2015/16. Nonetheless, the percentage of external audit recommendations implemented by MDALGs remains low at 27.88% for FY2015/16. To enhance prevention, detection, and elimination of corruption, there have been measures to strengthen anti-corruption institutional and legal framework in an attempt to domesticate the provisions of the UNCaC. 50% and 35% of the anticorruption and ombudsman recommendations respectively were implemented.The proportion of procurement audit and investigation recommendations implemented averaged 73%, while 72% of procurement audits and investigation recommendations were implemented during FY2015/16. 90% of entities audited were rated satisfactory from procurement audits; and 92% of contracts audited (by value) were rated satisfactory.The sector’s current strength are manifested in the availability of sector and institutional strategies, policies and laws; existence of well-defined accountability sector management structures; automated systems; steady funding from the consolidated fund; good working relationship with Development Partners and the Civil Society.The weaknesses within the sector include the slow
implementation of policies, laws and regulations; lukewarm functionality of sector management structures; inadequate representation of Sector Institutions in the sector management structures; limited participation of sector institutions and some key stakeholders in the sector events or activities; absence of technical working groups; human and financial resources limitations; Inadequate training of Planers in MDALGs; limited knowledge of, and experience in PPPs; and limited public awareness about the sector.The sector faces a number of opportunities, some of which are the political willingness to fight corruption, and the global attention to accountability; existence and willingness of development partners to support accountability interventions; advances in technology; under/unexploited mineral deposits with a potential to enhance revenue and service delivery; potential revenue collections from Uganda’s oil and gas value chain; etc.On the other hand, the sector faces threats such as the inadequate legal coverage of the SWAP arrangement; increasing cost of public administration; unpredictable Parliamentary business which leads to delays in discussion and passing of the necessary Bills; high cost of doing business; expensive power tariffs; high cost of money; volatile exchange rates; rising cybercrime rate; global warming; and the fact that Uganda is landlocked with a poorly functioning railway network, which in itself raises the cost of doing business.
Strategic DirectionThe Accountability Sector’s Vision is transparency and accountability in public service delivery. The mission is to promote efficiency and effectiveness in the mobilization, management and accounting for the utilization of public resources. The sector’s goal is to achieve a transparent, responsive and accountable public sector that delivers value for money services. The sector objectives under the Economic Management thematic area are to increase equitable access to finance; increase private investments; reduce interest rates; increase
| xiii
Accountability Sector Strategic Investment Plan 2017/18 - 2019/20
insurance penetration; increase national savings to GDP ratio; increase the level of capitalisation and widen investment opportunities in the capital markets; improve statistical data production and policy research; and protect financial systems and the broader economy from the threats of money laundering and the financing of terrorism.The sector objectives under the Resource Mobilisation and Allocation thematic area are to increase the tax to GDP ratio; and improve public financial management and consistency in the economic development framework.The objectives under the Budget Execution, Accounting, Audit and Anti-Corruption thematic areas are to enhance public contract management and performance; improve compliance with accountability rules and regulations; enhance the prevention, detection, and elimination of corruption; increase public demand for accountability; and improve collaboration and networking amongst development institutions. The core values of the accountability sector are integrity, honesty, transparency, accountability, professionalism, commitment, teamwork, gender equality and equity. The Accountability Sector’s Critical Success Factors include adopting a consultative and consensus based approach to strategy and policy development and implementation; agreeing the strategic priorities and mobilising resources as a sector; leading by example in planning, budgeting, execution, reporting, monitoring and evaluating the utilisation of public resources; and accomplishing the sector objectives.
StrategiesIn order to increase access to finance and reduce interest rates, the sector plans to capitalise UDBL to avail medium to long term development finance; fully operationalize Islamic Banking; review the current financial institutions regulatory and policy framework to enhance financial inclusion; and develop capacity of micro and small enterprises to prepare bankable projects. Further, the sector shall leverage on securities to raise capital, both by the private & public sector; leverage domestic resources to
attract private capital using PPPs; reduce barriers to setting up and doing business in Uganda; establish an asset reconstruction company; liberalise the pension sector and fast-track the Pension Liberalisation Bill; strengthen the CRBS and develop a collateral registry to reduce defaulter rates; and integrate data systems for TIN, Identity Cards, Utilities; and Uganda Registration Services Bureau.In order to increase private investment, the sector shall review policies relevant to investment climate and implement policy recommendations arising from the Presidential Investor Round Table and Presidential Economic Council; facilitate linkage of FDIs that require local partners through web portals, e-marketing; make industry membership association mandatory; develop and enhance a network of serviced business, science, technology and industrial parks; strengthen the implementation of strategies to increase investor confidence; and promote the public and private sectors to work together.In regard to increasing Insurance Penetration, the sector plans to develop and implement a national Policy on Insurance to provide guidance on insurance of government assets and insurance in key sectors of the economy; fast track the implementation of the National Health Insurance Scheme; enforce workers compensation policy and engage the education system to appreciate and promote insurance of students; develop and implement a sector sensitive financial literacy programme and sensitize the public on insurance; and increase government involvement and funding to the insurance sector.In regard to increasing domestic savings, the sector plans to improve the regulation and supervision of the Retirement Benefits Sector by reviewing the regulatory framework; fast tracking the implementation of the pension sector reforms; enabling long term savings by introducing pension pay out options and investment products such as annuities; and transforming the public service pension into a savings contributory scheme.In order to Increase the level of capitalisation and widen investment opportunities in the capital markets, the sector will revise and amend
xiv |
Accountability Sector Strategic Investment Plan 2017/18 - 2019/20
the legal and regulatory framework for capital markets to ease issuance of securities, eliminate duplicative procedures and allow for innovation and product development; impose mandatory listing for companies in specific and strategic sectors by instituting policies that require the listing of companies where government holds shares and Tier 1 Banks, telecommunication companies, insurance companies and energy companies; create access to government bond markets in the primary market and widen participation; and widen investor base by undertaking aggressive investor education on the benefits of raising capital through capital markets.In order to improve statistical data production and policy research, the sector plans to strengthen partnerships between UBoS and other sector institutions to generate quality statistics; increase demand and usability of statistics by undertaking relevant surveys and censuses and increasing data and research findings dissemination; strengthen administrative data systems for statistics; enhance institutional capacity to deliver quality statistics and research; develop and enhance data quality assurance systems; and introduce measures to strengthen statistical coordination and capacity for management statistics.In regard to increasing the Tax to GDP Ratio, the sector plans to develop and implement a policy on mandatory association and membership for informal sector players; build strategic partnerships with other government agencies and integrate e-tax; strengthen the capacity of relevant staff in critical functions of revenue management, audit, forensics, investigations and legal affairs; develop and implement an integrated national revenue strategy; and facilitate trade through extension of the Electronic Cargo tracking to the region, and implementation of the Electronic Single Window.In order to improve public financial management and consistency in the economic development framework, the sector plans to strengthen budget planning and prioritization across sectors by establishing a mechanism to ensure that sectoral plans are consistent with the NDP;
synchronizing the national budget and the sector budget; fully operationalizing the Programme Based Budgeting; enhancing budget consultation at national level through enhanced participation in the budgeting cycle; enhancing budget analysis, monitoring and evaluation through building capacity and supporting continuous professionalization of economic management cadre across government; conducting and implementing the recommendations of budget monitoring.The sector shall strengthen the capacity of MDALGs to prepare and manage projects; establish a project facilitation fund and develop guidelines for management of the fund; establish a data base of existing bankable projects and assess the capacity of the existing systems for incorporation of the data bank; introduce measures to strengthen the capacity of sectors to prepare, implement and monitor bankable projects; and leverage domestic revenue through use of PPP.Further, the sector plans to develop a well-functioning and vibrant domestic financial market through awareness creation on the financial market; simplify the process of auction; ensure borrowing at the lowest costs by building the capacity to negotiate loans; periodically carry out debt sustainability analysis and regular debt monitoring; and ensure new borrowing is in line with the threshold.The sector shall develop a roadmap for implementation of IPSAS accrual basis of accounting, and a policy framework for accounting and reporting on non-current assets; sensitise stakeholders on the PFM Act 2015 and PFM Regulations 2016; develop and disseminate Treasury Instructions and operational guidelines; harmonise the PFMA 2015 and PFMR 2016 with other laws; support public corporations and state enterprise in transitioning to the Government financial reporting calendar; and ensure comprehensive capture and appropriation of all donor funds including grants and loans.Further, the sector shall focus on integrating and enhancing the security of PFM Systems in Central and Local Government entities; build
| xv
Accountability Sector Strategic Investment Plan 2017/18 - 2019/20
technical capacity to sustain these systems in terms of both infrastructure and human resource; adopt new practices such as e-cash to minimise opportunities for fraudulent practices; improve efficiency in public financial management; finalize extension of IFMS Fixed Assets Management module to remaining CG sites; and implement recommendations arising from the NITAU system integration study, among others.In regard to enhancing Public Contract Management and Performance, the sector plans to increase transparency and accountability in public procurement by acquiring, piloting and rolling out e-government procurement system; engage and strengthen the capacity of MDALGs and non-state actors in contract management and performance; strengthen contract monitoring, reporting mechanisms and follow-up audits and recommendations; support the development of the Institute of Procurement Professionals of Uganda; and develop a National Local Content Policy.In regard to improving compliance with accountability rules and regulations, the sector shall support joint inspections; review and update the inspection tools; build the capacity to conduct joint inspections; review and update the performance assessment and reward systems. We also plan to build the capacity of Accountability Institutions to conduct compliance inspections; provide tools and equipment to conduct compliance inspection; among others. Further, the sector will conduct national service delivery surveys; support institutions to develop and implement service delivery standards; monitor compliance with service delivery standards; sensitize the public/citizens on service delivery standards; and support accountability institutions to develop and implement client charters.In the audit area, the sector will introduce measures to improve timeliness, audit coverage and quality reporting by recruiting additional staff and providing equipment to increase audit coverage; conducting trainings to improve audit reporting; and follow up on the audit recommendations. The sector will develop a risk
management strategy across Government to help mitigate the risks and improve on efficiency and effectiveness of reporting by the IAG and other offices. The Value for Money (VFM) audit functions will be strengthened by supporting Parliament to clear the backlog of VFM audit reports; building the capacity of Audit institutions to undertake VFM audits to increase audit coverage. The IAG office will also be strengthened in conducting IT and performance audits in specialized areas. In regard to enhancing the prevention, detection, and elimination of corruption, the sector plans to strengthen the enforcement of the existing legal framework; and strengthen the capacity of investigation and prosecution, ombudsman, ethics and integrity functions.On increasing public demand for accountability, the sector plans to strengthen the capacity of the public to demand for accountability; and build CSOs’ capacity to detect and report corruption and anti-money laundering; sensitize CSOs on government projects; and develop and implement information sharing protocols. The sector will implement a communication strategy and some of the strategies will include but not limited to partnerships and networking with like institutions; media relations; social mobilisation; internal communication; branding; and public relations.
Institutional framework The accountability sector management structures shall include the Leadership Committee; Steering Committee; Sector Working Group; Technical Working Groups; Sector Institutions; the secretariat and accountability centres at local governments.The Leadership Committee is chaired by the Minister of Finance, Planning and Economic Development and shall comprise of the political heads of sector institutions; Governor Bank of Uganda; and the Permanent Secretary/ Secretary to Treasury MFPED.The leadership committee shall provide strategic direction to the sector; guide policy formulation for the sector; articulate sector vision and develop
xvi |
Accountability Sector Strategic Investment Plan 2017/18 - 2019/20
policy at Executive and Legislature levels; oversee the development trend of the Accountability Sector; provide political leadership and support; promote highest standards of accountability to key stakeholder groups; promote sectoral coordination and filter accountability systems among the political echelons. The Committee shall meet at least twice a year. The Steering Committee shall comprise of Accounting Officers and Chief Executive Officers of the Sector Institutions; Executive Director National Planning Authority; Bank of Uganda representative; and a Development Partners’ representative. The Steering Committee shall be chaired by any one of the Accounting Officers of the Sector Institutions on a rotational basis for the tenure of the Accountability Sector Strategic Investment Plan.The roles of the Steering Committee are to approve, monitor and evaluate the Accountability Sector Strategic Investment Plan; consider reports and recommendations from the Accountability Sector Working Group; provide high level policy discussion and technical and financial management guidance and direction to the Sector; advise Leadership Committee on matters of policy as required; formulate policy and set priorities for the sector; and identify and mobilize resources for the sector. The Steering Committee shall meet once a quarter.The Accountability Sector Working Group shall comprise staff at Director/Head of Department level and above from Sector Institutions; representatives from the Office of the Prime Minister, National Planning Authority; Development Partners and Civil Society Organisations. The Accountability Sector Working Group shall be chaired by the Accountant General and shall meet at least once a quarter. Its responsibilities include: • Discussion of issues of policy and strategic
nature from Sector Institutions; • Formulation and coordination of sector
strategies for long, medium and short term investments plans and budgets;
• Reviewing and critical analysis of submissions and reports from the Technical Working
Groups and evaluating their consistency with the objectives of sector development plans;
• Development of indicators; monitoring and evaluating sector performance, policies and programs;
• Prioritisation of expenditure within the available resources and mobilisation of resources for funding identified gaps during the course of implementation of SDP projects and programmes; and
• Approval of sector development plansThe Accountability Sector Working Group shall constitute itself into four Technical Working Groups in line with the sector thematic areas i.e. Economic Management TWG; Resource Mobilisation and Allocation TWG; Budget Execution and Accounting TWG; and Audit/Anticorruption TWG. The TWG shall be chaired by staff at Director/Head of Department level and above and co-chaired by a Development Partner/Civil Society representative. The Technical Working Groups shall among others duties be responsible for: • Analysing thematic area technical issues and
produce papers and reports with conclusions and recommendations for discussion and endorsement by the SWG, Steering and Leadership committee.
• Supporting and participating in the planning, budgeting, monitoring and evaluation, report and document lessons learnt during implementation;
• Be the think-tank for the accountability sector and particularly, the thematic areas;
• Engaging the public on key emerging and existing policy issues to get their perspective and satisfaction with the various accountability sector policies and interventions;
The sector will support the operationalisation of Accountability Centres in Local Governments. The centres will be the first point of contact for the accountability sector at Local Government level, and shall oversee the implementation of accountability sector programmes, projects and activities at district level. The centres will further
| xvii
Accountability Sector Strategic Investment Plan 2017/18 - 2019/20
promote and disseminate accountability reforms, developments and news, and shall play both the District integrity Forum and accountability centre role.
FinancingThe accountability sector will require an estimated UGX4.463 trillion over the next three years to FY2019/20, to deliver its objectives as envisaged in the NDPII. The main source of funding shall be from the Government of Uganda as projected by the Medium Term Expenditure Framework (MTEF); Donor Project Support; and Own Resources. The Accountability Sector’s MTEF projections including wage, non-wage recurrent, development (domestic) and external financing (donor budget support) for the next three years total UGX3.344 trillion. Going by the sector’s estimated funding requirements and MTEF projections, the funding gap is estimated at UGX1.119 trillion over the next three years 2019/20.The sector shall thus focus on improving national and local revenue mobilisation to meet the funding requirements of the sector and economy at large; develop bankable projects and funding proposals for the unfunded areas; improve prioritisation of interventions within and out of the accountability sector; build capacity in, and adopt modern funding mechanisms such as PPPs, Results Based Aid, etc.
Monitoring and evaluationMonitoring and evaluating ASSIP implementation shall be undertaken by the sector institutions and the secretariat, and will mainly involve routine monitoring and inspection; midterm review; holding accountability forums and joint reviews; undertaking surveys (baseline, satisfaction, awareness, service delivery, etc.); and end line studies.During the next three years, the sector will focus on achieving its three main outcomes i.e. Sustainable Macroeconomic Stability; Fiscal Credibility and Sustainability; and Value for Money in the management of public resources. The outcome indicators for the Sustainable Macroeconomic Stability outcome shall be the economic growth rate; and Inflation rate; while the outcome indicators for the Fiscal Credibility and Sustainability outcome shall be the Tax to GDP Ratio; Fiscal Balance; and Present Value of Public Debt Stock/GDP. The key outcome indicators for the Value for Money in the management of public resources outcome shall be the Government Effectiveness Index; Level of Satisfaction with public service delivery; and Corruption Perception Index.
xviii |
Introduction and Background
| 1
1.0 Introduction and Background
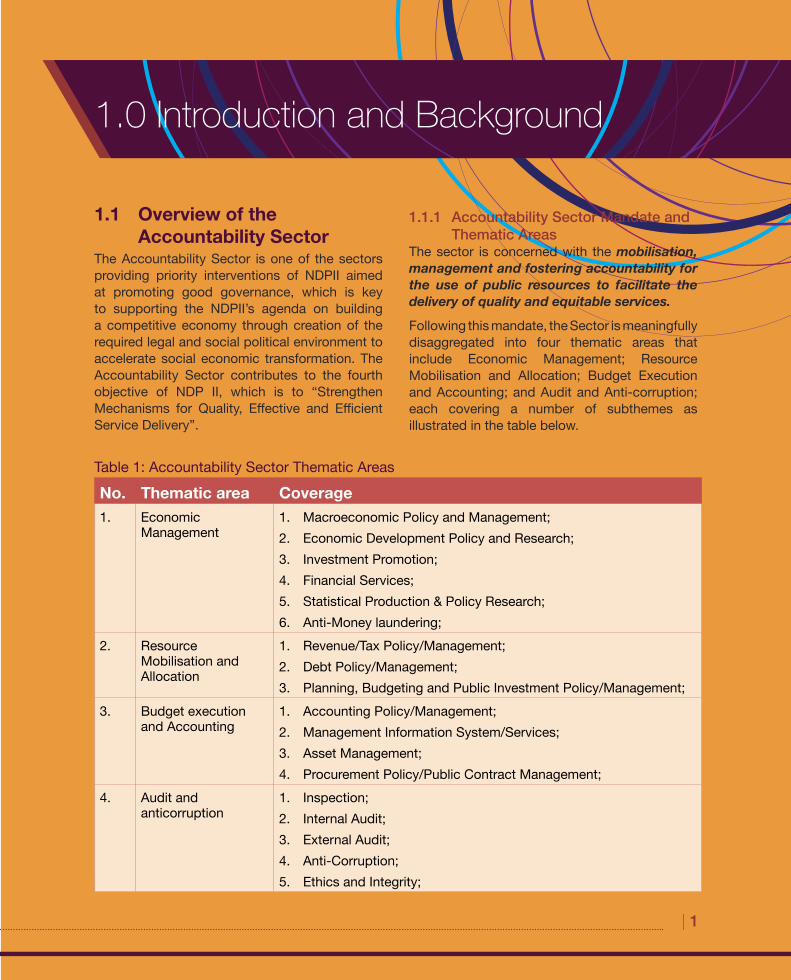
1.1.1 Accountability Sector Mandate and Thematic Areas
The sector is concerned with the mobilisation, management and fostering accountability for the use of public resources to facilitate the delivery of quality and equitable services.
Following this mandate, the Sector is meaningfully disaggregated into four thematic areas that include Economic Management; Resource Mobilisation and Allocation; Budget Execution and Accounting; and Audit and Anti-corruption; each covering a number of subthemes as illustrated in the table below.
1.1 Overview of the Accountability Sector
The Accountability Sector is one of the sectors providing priority interventions of NDPII aimed at promoting good governance, which is key to supporting the NDPII’s agenda on building a competitive economy through creation of the required legal and social political environment to accelerate social economic transformation. The Accountability Sector contributes to the fourth objective of NDP II, which is to “Strengthen Mechanisms for Quality, Effective and Efficient Service Delivery”.
Table 1: Accountability Sector Thematic Areas
No. Thematic area Coverage1. Economic
Management1. Macroeconomic Policy and Management; 2. Economic Development Policy and Research; 3. Investment Promotion;4. Financial Services;5. Statistical Production & Policy Research;6. Anti-Money laundering;
2. Resource Mobilisation and Allocation
1. Revenue/Tax Policy/Management;2. Debt Policy/Management;3. Planning, Budgeting and Public Investment Policy/Management;
1. Inspection;2. Internal Audit;3. External Audit;4. Anti-Corruption;5. Ethics and Integrity;
2 |
Accountability Sector Strategic Investment Plan 2017/18 - 2019/20
1.1.2 Accountability Sector Institutions and their mandates
The sector brings together state and non-state actors for the purpose of planning, developing, and implementing policies and regulations for a stable macroeconomic environment, transparent and accountable systems to facilitate economic growth. The accountability sector institutions include:1. Ministry of Finance Planning and Economic
Development;2. Inspectorate of Government;3. Directorate of Ethics and Integrity;4. Office of the Auditor General;5. Uganda Bureau of Statistics;6. Uganda Revenue Authority;7. Public Procurement and Disposal of Assets
Authority;8. Ministry of Public Service (Inspection);9. Ministry of Local Government (Inspectorate);10. Kampala Capital City Authority (Revenue
collection and mobilisation); and11. Uganda Financial Intelligence Authority;12. Bank of Uganda;13. Capital Markets Authority;14. Uganda Retirements Benefits Regulatory
Authority (URBRA);15. National Social Security Fund;16. Uganda Development Bank Limited;17. Uganda Investment Authority;18. Private Sector Foundation Uganda;19. Economic Policy Research Centre; and20. Insurance Regulatory Authority; Other players include capital markets, financial institutions, insurance companies, professional bodies, business associations, development partners and CSOs. The composition of the sector is based on the respective institutional contributions to the accountability cycle as mandated by the relevant legislation.
All the above institutions contribute to the achievement of the accountability sector’s
mandate of mobilisation, management and accounting for the use of public resources to facilitate the delivery of quality and equitable services.
In executing their mandates, the sector institutions are expected to work in collaboration to implement complementary accountability programmes to achieve sector objectives. The mandates of the various accountability sector institutions are presented here below.
Ministry of Finance, Planning and Economic Development (MFPED): The ministry is mandated to formulate policies that enhance stability and development; mobilize local and external financial resources for public expenditure; regulate financial management and ensure efficiency in public expenditure; oversee national planning and strategic development initiatives for economic growth.
The Ministry plays a critical role in fulfilling the accountability sector’s mandate, covering economic management (macroeconomic policy, financial services, development policy and investment promotion, research and monitoring); mobilisation of resources (tax policy, debt management, budget preparation, execution and monitoring and project management); and accounting for the of resources (accounting policy/management, procurement policy, and internal audit).
Uganda Bureau of Statistics (UBOS): The Bureau is mandated by the UBOS Act 1998 to produce, co-ordinate, supervise, and disseminate official statistics. UBOS also plays a dual role in the development and maintenance of the National Statistical System (NSS).
UBOS plays a critical role in fulfilling the accountability sector’s mandate, mainly addressing the accountability sector objective of improving statistical data production and policy research.
Uganda Revenue Authority (URA): URA is mandated by the Uganda Revenue Authority Act No. 6 of 1991 to assess, collect and account for all Central Government tax revenue (including
| 3
non-tax revenue) and to advise Government on revenue implications, tax administration and aspects of policy changes relating to all taxes as spelt out in the URA Act.
Uganda Revenue Authority plays a critical role in fulfilling the accountability sector’s mandate, mainly covering the mobilisation and management of tax and nontax revenues and specifically, addressing the accountability sector objective of increasing the tax to GDP ratio.
Office of the Auditor General (OAG): Article 163 (3) of the Constitution of the Republic of Uganda establishes the Office of the Auditor General and its mandate as detailed in Section 13(1) and 18 of the National Audit Act 2008 is to audit and report to Parliament on the public accounts of all public offices including the courts, the central and local government administrations, universities and public institutions of like nature, and any public corporations or other bodies established by an Act of Parliament.
The Office of the Auditor General plays a critical role in fulfilling the accountability sector’s mandate, mainly covering accounting for the utilisation of public resources through financial audits, value for money audits and specialised audits.
Public Procurement and Disposal of Public Assets Authority (PPDA): The PPDA derives its mandate from the PPDA Act, 2003. The PPDA mandate is to ensure the application of fair, competitive, transparent, non-discriminatory and value for money public procurement and disposal standards and practices; harmonization of procurement and disposal policies, systems and practices of the Central Government, Local Governments and Statutory bodies; setting standards for the public procurement and disposal systems in Uganda; monitoring compliance of Procuring and Disposing Entities; and building procurement and disposal capacity in Uganda.
PPDA plays a critical role in fulfilling the accountability sector’s mandate, mainly addressing the accountability sector objective
of enhancing public contract management and performance.
Inspectorate of Government (IG): The Inspectorate is the lead anti-corruption agency in Uganda, mandated in three broad categories under Article 225 of the Constitution as the Ombudsman (Mostly proactive); Anti-corruption (Reactive and coercive); and Leadership Code (Ethics Body; proactive and coercive).
The Inspectorate of Government plays a critical role in fulfilling the accountability sector’s mandate, mainly addressing the accountability sector objective of enhancing the prevention, detection, and elimination of corruption through the following functions of the IG stipulated under Article 225 of the Constitution:a. Promote and foster strict adherence to the
rule of law and principles of natural justice in administration;
b. Eliminate and foster the elimination of corruption, abuse of authority and of public office;
c. Promote fair, efficient and good governance in public offices;
d. Supervise the enforcement of the Leadership Code of Conduct;
e. Investigate any act, omission, advice, decision or recommendation by a public officer or any other authority to which this article applies, taken, made, given, or done in exercise of administrative functions;
f. Stimulate public awareness about the values of constitutionalism in general, IG activities in particular, through media or other means
Directorate for Ethics and Integrity (DEI), Office of the President: The directorate is the Policy Arm of Government in the fight against corruption and the rebuilding of ethics and integrity in the Ugandan society.
The Directorate for Ethics and Integrity plays a critical role in fulfilling the accountability sector’s mandate, mainly addressing the accountability sector objective of enhancing the prevention, detection, and elimination of corruption through the following functions of DEI:
Accountability Sector Strategic Investment Plan 2017/18 - 2019/20
4 |
a. To adopt a sector by sector approach to coordinate the anti-corruption agencies and ensure that they effectively perform.
b. Create a policy and legal framework that can prevent and fight corruption. This entails establishing and reviewing policies and laws that relate to or provide for anti-corruption and immorality and ensure their enforcement.
c. Sensitize and mobilize the public to play its vital role in combating corruption, by reporting corrupt officials and increasing pressure on leaders to be transparent and accountable.
d. Strengthen ethical values in society in a bid to fight immorality in society.
e. Promote the creation of a National Integrity Movement at national and grass roots levels.
f. Inculcate an anti-corruption culture in the youth by introducing courses on ethics and integrity in the school curricula.
g. Enhance the collaboration between government and Religious and Faith Based Organizations to effectively inculcate the National Ethical Values of Uganda.
Ministry of Public Service: The inspection department of the ministry is mandated to inspect the entire service on the attainment of set targets and monitor very closely the performance of Public Service Institutions and public officers.
The Ministry of Public Service (Inspectorate) plays a critical role in fulfilling the accountability sector’s mandate, mainly covering accounting for the utilisation of public resources through the setting of targets and monitoring the performance of Public Service Institutions and public officers. It contributes to the achievement of the accountability sector objective of improving compliance with accountability rules and regulations.
Ministry of Local Government (Inspectorate): The overall mandate of the ministry is to inspect, monitor, and where necessary offer technical advice/assistance, support supervision and training to all Local Governments; coordinate and advise Local Governments for purposes of harmonization and advocacy; act as a Liaison/
Linkage Ministry with respect to other Central Government Ministries and Departments, Agencies, Private Sector, Regional and International Organizations; and research, analyse, develop and formulate national policies on all taxes, fees, levies, rates for Local Governments.
In fulfilling its mandate, the Ministry of Local Government (Inspectorate) plays a critical role in contributing to the achievement of the accountability sector’s mandate, mainly addressing the accountability sector objective of improving compliance with accountability rules and regulations.
Kampala Capital City Authority (KCCA): In 2010, Government took over management of Kampala District from a Local Government setting, and created the Kampala Capital City Authority with the overall responsibility of streamlining operations, improving service delivery and restoration of good urban governance in the City.
Kampala Capital City Authority plays a critical role in fulfilling the accountability sector’s mandate, mainly covering the mobilisation and management of local revenues.
Bank of Uganda: The Bank of Uganda is mandated by the Bank of Uganda Act, 2000 to formulate and implement monetary policy directed to economic objectives of achieving and maintaining economic stability. The bank shall:a. maintain monetary stability;b. maintain an external assets reserve;c. issue currency notes and coins;d. be the banker to the Government;e. act as financial adviser to the Government
and manager of public debt;f. advise the Government on monetary policy
as is provided under section 32(3) of the Bank of Uganda Act, 2000;
g. where appropriate, act as agent in financial matters for the Government;
h. be the banker to financial institutions;i. be the clearinghouse for cheques and other
financial instruments for financial institutions;
Accountability Sector Strategic Investment Plan 2017/18 - 2019/20
| 5
j. supervise, regulate, control and discipline all financial institutions and pension funds institutions;
k. where appropriate, participate in the economic growth and development programmes;
In fulfilling its mandate, the Bank of Uganda plays a critical role in contributing to the achievement of the accountability sector’s mandate and maintaining sustainable macroeconomic stability, mainly addressing the sector’s objectives of increasing access to finance, reducing interest rates, increasing national savings.
Uganda Financial Intelligence Authority (FIA): The mandate of FIA is given by the Anti-Money Laundering Act, 2013, which provides the objectives of the authority as to: • enhance the identification of the proceeds
of crime and the combating of money laundering;
• ensure compliance with the Anti-Money Laundering Act, 2013;
• enhance public awareness and understanding of matters related to money laundering;
• make information collected by Uganda Financial Intelligence Authority available to competent authorities and to facilitate the administration and enforcement of the laws of Uganda; and
• exchange information with similar bodies whose countries have treaties, agreements or arrangements with the Government of Uganda regarding money laundering and similar offences;
In fulfilling its mandate, FIA plays a critical role in contributing to the achievement of the accountability sector’s mandate, mainly addressing the sector’s outcome of sustainable macroeconomic stability.
Uganda Retirements Benefits Regulatory Authority (URBRA): URBRA is mandated by the Uganda Retirement Benefits Regulatory Authority Act, 2011 to:
a. regulate and supervise the establishment, management and operation of retirement benefits schemes in Uganda, in both the public and private sectors;
b. license retirement benefits schemes in Uganda;
c. license custodians, trustees, administrators and fund managers of retirement benefits schemes;
d. approve an actuary or auditor of any retirement benefit scheme;
e. protect the interests of members and beneficiaries of retirement benefits schemes including the promotion of transparency and accountability;
f. improve understanding and promote the development of the retirement benefits sector;
g. promote the stability and integrity of the financial sector through ensuring stability and security of retirement benefits schemes;
h. ensure sustainability of the retirement benefits sector with a view to promoting long term capital development;
i. advise the Minister on all matters relating to the development and operation of the retirement benefits sector;
j. implement Government policy relating to retirement benefits schemes; and
k. promote public awareness of the retirement benefits sector;
In fulfilling its mandate, URBRA plays a critical role in contributing to the achievement of the accountability sector’s mandate, mainly addressing the sector’s objective of increasing national savings.
National Social Security Fund (NSSF): The NSSF is mandated by Government through the National Social Security Fund Act, Cap 222 (Laws of Uganda) to provide social security services to employees in Uganda. It was established by an Act of Parliament (1985) to provide for its membership, payment of contributions to, and payment of benefits out of the Fund. NSSF is a provident fund (pays out contributions in lump sum). It covers all employees in the private sector
Accountability Sector Strategic Investment Plan 2017/18 - 2019/20
6 |
Accountability Sector Strategic Investment Plan 2017/18 - 2019/20
including Non-Governmental Organizations that are not covered by the Government’s pension scheme. It is a scheme instituted for the protection of employees against the uncertainties of social and economic life.
In fulfilling its mandate, NSSF plays a critical role in contributing to the achievement of the accountability sector’s mandate, mainly addressing the sector’s objective of increasing national savings.
Uganda Development Bank Limited (UDBL): UDBL is a public enterprise wholly owned by the Government of Uganda and carrying on business as a Development Finance Institution (DFI). The bank, a successor company to Uganda Development Bank, was incorporated as a limited liability company under the Public Enterprises Reform and Divestiture Act, Cap.98, Laws of Uganda and it is mandated to finance enterprises in key growth sectors of the economy.
In fulfilling its mandate, Uganda Development Bank Limited plays a critical role in contributing to the achievement of the accountability sector’s mandate, mainly addressing the sector’s objective of increasing access to finance.
Capital Markets Authority (CMA): CMA is mandated by the Capital Markets Authority (Amendment) Act 2016, to: • approve prospectuses and other offering
documents under which securities are offered to the public and to approve information memorandum;
• develop all aspects of the capital markets with particular emphasis on the removal of impediments to, and the creation of incentives for, long term investments in productive enterprises;
• create, maintain and regulate, through implementation of a system in which the market participants are self-regulatory to the maximum practicable extent, of a market in which securities can be issued and traded in an orderly, fair and efficient manner;
• cooperate with, provide information to, conduct any investigation or inquiry for,
or otherwise assist any foreign regulatory authority in the performance of its duties;
• implement regional and international standards and best practice in securities markets, securities regulation and supervision;
• protect investor interests; and • operate the Investor Compensation Fund
established by section 81;
In fulfilling its mandate, the capital Markets Authority plays a critical role in contributing to the achievement of the accountability sector’s mandate, mainly addressing the sector’s objective of increasing the level of capitalisation and widening investment opportunities in the capital markets.
Uganda Investment Authority (UIA): Set up under the Investment Code 1991, UIA is a statutory agency mandated to initiate and support measures that enhance investment in Uganda and advise Government on appropriate policies conducive for investment promotion and growth. Uganda Investment Authority is a semi-autonomous government agency which drives national economic growth and development in partnership with the private sector. As an Investment Promotion Agency, UIA mainly: markets investment opportunities; promotes packaged investment projects; ensures local and foreign investors have access to information, especially about the business environment so as to make more informed business decisions; and offers business support, advisory and advocacy services.
In fulfilling its mandate, Uganda Investment Authority plays a critical role in contributing to the achievement of the accountability sector’s mandate, mainly addressing the sector’s objective of increasing private investments.
Private Sector Foundation Uganda (PSFU): PSFU is Uganda’s apex body for the private sector. It is made up of over 200 business associations, corporate bodies and the major public sector agencies that support private sector growth. Since its founding in 1995, PSFU
| 7
Accountability Sector Strategic Investment Plan 2017/18 - 2019/20
has served as a focal point for private sector advocacy as well as capacity building and continues to sustain a positive policy dialogue with Government on behalf of the private sector. The mandate of PSFU covers: • Carrying out policy research and advocacy
on behalf of the Private Sector; • Providing a forum for the discussion of policy
issues, and the impact of those policies on the Private sector in Uganda;
• Maintaining a dialogue with Government on behalf of the Private Sector;
• Undertaking capacity building for the private sector through training and the provision of business development services
In fulfilling its mandate, Private Sector Foundation Uganda plays a critical role in contributing to the achievement of the accountability sector’s mandate, mainly addressing the sector’s objective of increasing private investments and improving policy research.
Economic Policy Research Centre (EPRC): EPRC is Uganda’s leading think tank in economics and development policy oriented research and policy analysis. The Economic Policy Research Centre was established in 1993 as an autonomous not-for-profit organization limited by guarantee to fill fundamental voids in economics research, policy analysis, and capacity building for effective in-country contributions to Uganda’s policy processes.
EPRC’s mission is to foster sustainable growth and development of the Ugandan economy by advancing the role of research in policy processes through provision of high quality applied research; practical policy analysis and advice; and policy focused dissemination and discourse. EPRC also undertakes capacity building activities through intellectual and scholar exchange, networking with accredited national and international institutions and scholars and hands on skills sharpening for young professionals, technocrats and policy makers.
In fulfilling its mandate, the Economic Policy Research Centre (EPRC) plays a critical
role in contributing to the achievement of the accountability sector’s mandate, mainly addressing the sector’s objective of improving statistical data production and policy research.
Insurance Regulatory Authority (IRA): IRA is the Supervisor and Regulator of the Insurance Industry in Uganda. It was established under the Insurance Act, (Cap 213) Laws of Uganda, 2000 (as amended) with the main objective of “ensuring Effective Administration, Supervision, Regulation and Control of the business of insurance in Uganda”.
In fulfilling its mandate, the Insurance Regulatory Authority plays a critical role in contributing to the achievement of the accountability sector’s mandate, mainly addressing the sector’s objective of increasing insurance penetration.
1.1.3 Management of the Accountability Sector
The Governance structure of the accountability sector provides for three committees namely the Leadership Committee, Steering committee and the Sector Working Group, which are served by a Secretariat for Accountability Sector.
The Leadership Committee provides political leadership and policy guidance to the sector and is comprised of the Minister of Finance Planning and Economic Development (Chair); Minister of Ethics and Integrity; Minister of Public Service; Minister of Local Government; Minister for Kampala; Inspector General of Government; The Auditor General; and The Permanent Secretary/Secretary to the Treasury.
The Steering committee formulates sector policies and priorities, and is comprised of the Secretary, Directorate for Ethics and Integrity, Office of the President; Secretary Inspectorate of Government; Permanent Secretary, Ministry of Public Service; Permanent Secretary, Ministry of Local Government; Executive Director, PPDA; Executive Director, UBOS; Commissioner General, URA; Under Secretary/Accounting Officer MFPED; Executive Director, KCCA; and Development Partner representative (on invitation).
8 |
Accountability Sector Strategic Investment Plan 2017/18 - 2019/20
The Sector Working Group (SWG) implements sector policies in line with the Accountability Sector Strategic investment plan (ASSIP), and as guided by the Leadership and Steering committees. According to the Sector Development Planning Guidelines by the NPA, the SWG is supposed to be comprised of technical officials at Director/Head of Department level from the sector institutions and representatives of development partners, private sector and civil society.
The day to day operations of the sector are coordinated by the Secretariat for Accountability Sector, based at the Ministry of Finance Planning and Economic Development. The secretariat is headed by a Coordinator who is supported by a Program Manager, two Research Assistants, a Data Analyst, Administrative Assistant, Accounts Assistant, Office attendant and a driver.
1.2 Methodology for ASSIP review
The ASSIP review process involved a combination of methodologies including undertaking wide consultations with key stakeholders; review of various documents; and holding consultative and validation workshops with the key stakeholders.
The consultations undertaken with key sector stakeholders covered sector institutions, private sector, development partners and civil society organisations, to ensure full coverage and understanding of the key issues affecting the implementation of the ASSIP.
The organisations consulted include the Financial Intelligence Authority; Ministry of Public Service; Civil Society Budget Advocacy Group (CSBAG); Danish Embassy; Directorate of Ethics and Integrity (DEI); DFID; Democratic Governance Facility (DGF); European Union (EU); GIZ; KfW; Inspectorate of Government (IG); Insurance Regulatory Authority (IRA); Justice Law and Order Sector (JLOS); Ministry of Finance Planning and Economic Development (MOFPED); Ministry of Health (MoH); Ministry of Local Government (MoLG); National Planning Authority (NPA); National Social Security Fund
(NSSF); Office of the Auditor General (OAG) Office of the Prime Minister (OPM); Public Procurement and Disposal of Public Assets (PPDA); Private Sector Foundation Uganda (PSFU); Transparency International Uganda; Uganda Bureau of Statistics (UBOS); Uganda Development Bank Limited (UDBL); Uganda Debt Network (UDN); Uganda Manufacturer’s Association (UMA); Uganda Revenue Authority (URA); Uganda Retirements Benefits Authority (URBRA); Economic Policy Research Centre (EPRC), USAID Uganda as illustrated in Annex 2.
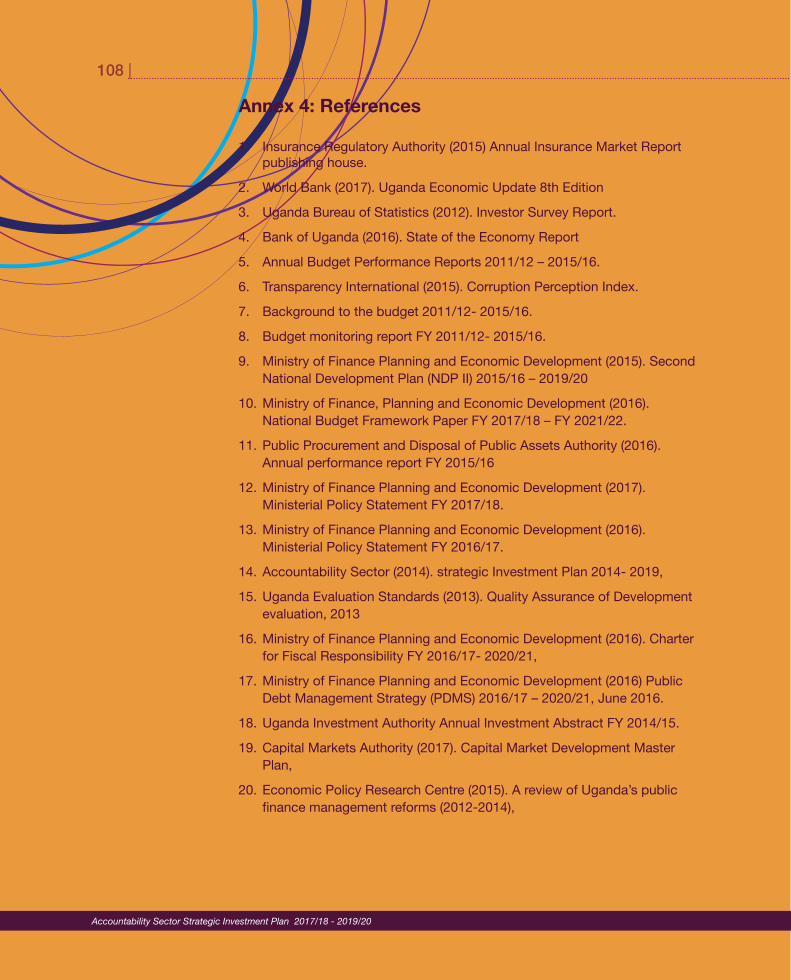
The relevant documents and reports reviewed to understand the current situation and performance of ASSIP include but not limited to the Uganda NDP II, ASSIP 2014-2019, Strategic Investment Plans of Accountability Sector Institutions; Annual Budget Performance Reports; Statistical Abstracts; State of the Economy Reports; Uganda Economic Update Reports; Background to the Budget Reports; and other relevant documents as detailed in Annex 4.
The data collected through the consultations and document reviews was analysed to develop evidence of the current situation and performance of ASSIP, and the stakeholders’ expectations of the accountability sector. This informed the strategic interventions included in this revised ASSIP.
The revised ASSIP went through a series of reviews and approvals, first by the Sector Working Group whose comments were considered to produce the second Version. This was then presented to the Steering Committee for discussion and approval.
Comments of the Steering Committee were considered to produce the third Version of ASSIP, which was tabled to the Joint Steering/Leadership Committee for discussion and approval. Following approval by the Leadership Committee, the revised ASSIP was printed and presented to the National Planning Authority for clearance. Upon NPA’s clearance, the ASSIP was published and disseminated to the various stakeholders for information and implementation.
| 9
2.0 Accountability Sector Situation Analysis
2.2 Past Achievements
2.2.1 Economic ManagementThis section presents the accountability sector’s achievements for the last five years specifically in the thematic area of economic management, focusing on economic growth, inflation, access to finance, savings mobilisation, Interest rates, insurance penetration, private investments, capital markets, statistical production and policy research.
Economic Growth: Over the past five years to 2015/16, Uganda’s economic growth averaged 4.5%, the highest being 5.2% in 2013/14 and the lowest 3.6% in 2012/13. During FY2015/16, the economy grew by 4.8%, a level of growth higher than the average Sub-Saharan Africa economic growth estimated at 3% in 2016, but lower than the NDP II target growth rate of 5.5% and 6.3% in 2015/16 and 2019/20 respectively. However, Uganda’s GDP growth rates for the last five years have been relatively lower than those of its East African counterparts as illustrated in the chart below.
2.1 Overview To inform the accountability sector strategic investment plan, a review and analysis of the sector’s achievements to date and the environment in which the sector operates was undertaken. The environmental analysis looked at the internal and external environment factors affecting the sector, and the stakeholders’ expectations of the sector and its secretariat.
Past performance is analysed by thematic area i.e. economic management; resource mobilisation and allocation; and accounting, audit and anti-corruption. The internal environment analysis focuses on the strength and weaknesses of the sector in the areas of staff, skills, shared values, strategies, structures and leadership styles; while the external environment analysis focuses on the opportunities and threats as presented by the political, economic, social, technological and natural environment factors. The following subsections present the accountability sector past achievements, situation analysis and stakeholders’ expectations.
10 |
Accountability Sector Strategic Investment Plan 2017/18 - 2019/20
Figure 1: Economic Growth Rate
Source: UBOS, 2016. Statistical Abstract. Page 85. GDP estimates were deflated using the rebased CPI figures, which is now based on COICOP classification providing a more detailed and specific deflator indices. Bank of Uganda 2016. State of the Economy Report June 2016.
the macro-economic convergence criteria of the EAC monetary union1.
Core inflation has similarly fluctuated over the last five years, registering a high of 19.5% in 2011/12 and a low of 2.7% in 2013/14. Except for the years 2013/14 and 2014/15, core inflation was above the 5% ceiling required by the indicative convergence criteria of the EAC monetary union. The chart below illustrates the trend in annual average headline inflation and core inflation over the last five years.
The slowdown in the economy is attributed to a fall in international commodity prices, a decline in private sector credit and depreciation of the shilling as a result of negative sentiments and uncertainty in the run-up to the 2016 general elections. The major driver of this economic growth was the services sector, specifically the information and communication sub-sector, which grew by 16.7% in FY2015/16 from a contraction of 2.5% in FY2014/15.
Inflation: Except for the financial year 2011/12 where the annual average headline inflation hit a high of 21%, inflation has been kept at single digit over the last five years to 2015/16, the lowest rate being 3% in 2014/15. The annual average headline inflation rate during FY2015/16 was 6.6%, above the target rate of 5% but within the expected range of 5-10% during the NDP II period, and below the ceiling of 8% required by
1 Protocol on the establishment of the East African Community Monetary Union. Particularly; Article 2 (b) attain the macroeconomic convergence criteria in article 6 (2) and maintain the criteria for at least 3 consecutive years.
| 11
Accountability Sector Strategic Investment Plan 2017/18 - 2019/20
Figure 2: Uganda’s Annual Inflation
Source: 2016 Statistical Abstract. Page 253 (UBoS)2016; and Financial Institutions (Amendment) Act 2016 were enacted during the NDP II period. The Laws among others provide for Islamic Financing. The other measures being undertaken to increase access to finance include: • Establishing the Sharia Board to
operationalize Islamic Banking and finalising the amendment of MDI Act 2003 to provide for Islamic Banking;
• Developing regulations for the implementation of Tier IV Microfinance & Money Lender’s Act 2016;
• Recapitalising the Development Bank and Microfinance Support Centre; and
• Strengthening the regulatory framework to provide for Agent Banking;
Savings mobilisation: Savings in Uganda are currently insufficient, and domestic savings are not well funded. According to the World Bank Uganda Economic Update, gross domestic savings (% of GDP) in Uganda have been increasing, from 17.7% in 2011/12 to 24.3% in 2015/16 (see chart below). Uganda’s 2015/16 domestic savings to GDP ratio is within the average of 23.6% for low income countries, and below 28.6%, the average domestic savings to GDP ratio for lower middle income countries.
Access to finance: According to the 2016 Statistical Abstract, Financial services activities comprising of the Central Bank, Commercial Banking, Insurance, Foreign Exchange Bureaus and other Activities Auxiliary to Financial Intermediation are estimated to have grown by 4.3 percent in 2015/16, which is a slowdown by 3.7 percentage points from the stronger growth of 7.0 percent achieved in the previous year.
The services sector has continued to make the most significant contribution to overall GDP growth. This sector expanded by 6.5 percent, with the ICT and financial and insurance services sub-sectors being the most significant contributors. Financial services contribution to total GDP is estimated at 2.9 percent in 2015/16, from 2.7 percent in 2014/15. Moreover, the ICT and financial and insurance services sub-sectors were the most significant contributors to the 6.5 percent growth registered by the services sector which made the most significant contribution to overall GDP growth.
According to the Uganda 2013 FinScope III Survey Report findings, overall, 85 percent of the adult population had access to and usage of financial services in 2013 while 15 percent were financially excluded.
In a bid to increase access to finance and savings, the Tier IV Microfinance and Money Lenders’ Act
12 |
Accountability Sector Strategic Investment Plan 2017/18 - 2019/20
Figure 3: Gross Domestic Savings as a % of GDP
Source: The World Bank, (2017). Uganda Economic Update 8th Edition, January 2017. Page 48
receipts. According to the World Bank (Uganda Economic Update 8th Edition), the average lending rate was 23.7% in FY2015/16 and over the last five years, it ranged from 22.1% to 25.2%. On the other hand, private-sector credit to GDP was estimated at 12% in 2015/16, the lowest recorded in the last five years to FY2015/16 as illustrated in the chart below.
According to the Uganda Retirements Benefit Authority (URBA) the sector is characterised by a low response rate to the regulatory framework and poor enforcement in terms of getting people to contribute. URBA’s over dependency on government funding also limits the nature and scope of its interventions and activities.
Interest rates: The cost of doing business in Uganda is high, hence the dwindling export
Figure 4: Cost of Lending and Private Sector Credit
Source: The World Bank. Uganda Economic Update 8th Edition, January 2017. Page 48, 51
| 13
Accountability Sector Strategic Investment Plan 2017/18 - 2019/20
According to the NDP II, it is observed that the interest rates’ spread remained as wide as 22%, which could be hampering savings mobilization. Whereas there have been attempts by the Central Bank to influence the reduction of lending rates through the reduction of the CBR, the response from the commercial banks is rather weakly elastic that it takes a long time for the commercial banks to reduce lending rates.
The ASSIP review consultations found that NSSF is sitting with billions of UGX (about USD2 billion) which, if well channelled to the Ugandan borrowers can help increase access to finance and reduce the cost of doing business. For example, NSSF currently lends to the Equity bank of Kenya which, subsequently lends to the Ugandan business community, which arrangement bears multiple margins hence, raising the cost of lending.
The measures undertaken during the NDP II and prior periods to reduce interest rates include but are not limited to: • Passing the Financial Institutions
(Amendment) Act, 2016; and Tier 4 Microfinance and Money Lenders’ Act 2016, all of which provide for the use of Islamic Financing.
• Fast-tracking the national ID project to make it easier for banks to track their clients;
• Operationalizing the Agriculture Credit Facility (ACF);
• Procuring an Islamic MF Consultant (IRADA) to develop & train the Islamic MF Products and modules 2016. Work on this has already commenced.
• Sensitizing the Cooperative Sector about advantages of Islamic Microfinance; and the Microfinance Support Centre has already applied for disbursement of Islamic microfinance funds.
• Recapitalizing Uganda Development Bank Limited (UDBL), where close to UGX130 Billion has already been issued out;
Insurance penetration: According to the Annual Insurance Market Report 2015, the ratio of premiums underwritten to the GDP ranged from 0.65% to 0.85% during the last five years, registering a performance of 0.764% in FY 2015/16. This is far below that of Kenya (3.4%), South Africa (15.4%), and Uganda’s targeted penetration rate goal of 3% by 2025. Further, the Total Industry Gross Written Premium hit UGX612.1Billion, in FY2015/16 the highest registered during the last five years as illustrated in the table below:
Table 2: Insurance Sector Past Performance Indicator 2010 2011 2012 2013 2014 2015Total Industry Gross Written Premium (UGX. Billions)
As illustrated in the table above, Insurance penetration has remained below 1%, an indication of the huge potential in the market. The insurance market potential is further evidenced by the fact that the market continues to attract
new entrants, hence the rapid growth overtime. The current low insurance coverage provides room for growth, and there is goodwill from government to promote insurance penetration.
2 Rebasing of GDP from the Base year of 2002 to 2009 had a significant impact on the GDP which is a denominator to the computation of Insurance Penetration. In fact, as a result of rebasing which was done in Nov. 2014, the 2013/14 GDP went up by 13 percentage points. Using the rebased GDP for 2014 and 2015, penetration increases from 0.697% in 2014 to 0.764% in 2015.
14 |
Accountability Sector Strategic Investment Plan 2017/18 - 2019/20
The Insurance Regulatory Authority (IRA) has among others played a central role in regulating and promoting the insurance sector in Uganda, attaining a premium growth rate of 20%.
Although there are gaps, the insurance industry in Uganda is adequately covered in the legal and regulatory framework. Some of the existing laws include the Insurance Act, (Cap213) Laws of Uganda, 2000; Insurance Regulations, 2002; Insurance (Amendment) Act, 13, 2011; Insurance (Investment of Paid Up Capital and Insurance Funds) Regulations, 2008; Insurance (Amendment of Brokers Minimum Paid-up Capital and Security Deposit) Instrument, 2013; Motor Vehicle Insurance (Third Party Risks) Act (Cap 214); Marine Insurance Act, 2002; and Workers Compensation Act (Cap 225) of Laws of Uganda, 2000.
The measures undertaken during the NDP II and prior periods to improve insurance penetration include but not limited to: • IRA has a complaints bureau desk to handle
any complaints, and gets funding from development partners such as GIZ World Bank and IMF in addition to its own revenues.
• The Insurance Bill and Mandatory Vehicle Insurance Bill are before Parliament. Further, the National Health Insurance Bill, Retirement
Benefits Sector Liberalization Bill and the Bancassurance Regulations and Attendant Regulations are all at different stages of development. Once the amendments are passed, it will be a better avenue for the insurance industry.
• Operationalizing the Uganda Agricultural Insurance Scheme (UAIS) to protect agricultural farmers against the loss of their crops/animals due to catastrophes that are beyond their control. Uganda Shillings 5bn was allocated in FY 2016/17 for this purpose.
Private Investment: Total actual private investments are estimated to have declined by 58% from 1,986 Million USD registered 2011/12 to 833 Million USD in 2015/16. According to the Uganda Economic Update Report 2017, Foreign Direct Investment inflows are particularly responsible for this decline due to their magnitude, having registered a 59% drop from 1,244 Million USD in 2011/12 to an estimated USD512 million in FY2015/16, the lowest amount registered during the last five years to FY2015/16. Likewise, local private investments registered a sharp fall (65%) from 657 to 231 Million USD as illustrated in the table below. The big fall in FDI since 2014/15 is partly attributable to the uncertainty in the licensing of oil and gas projects, and the 2016 elections.
Table 3: Local Investment and FDI flows to Uganda Ownership 2011/12 2012/13 2013/14 2014/15 2015/16FDI (Million USD) 1,244 940 1,096 870 512Joint Venture (Million USD) 85 250 312 138 90
Local (Million USD)2 657 172 277 224 231
Total (Million USD) 1,986 1,362 1,685 1,232 833Net FDI (% of GDP) 5.90% 6.10% 3.20% 2.10%
Source: Uganda Investment Authority and World Bank, (2017). Uganda Economic Update 8th Edition, January 2017. Page 17(Net FDI) & 48 (FDI)
According to the Uganda Investment Authority, the total licenced investment ranged from 1,125 to 2,058 Million USD over the last five years to 2015/16. Financial Years 2012/13 and 2013/14 registered the lowest and highest
licenced investment respectively. The total licenced investments in 2015/16, were 1,407 Million USD, registering a 32% decline from the highest licenced investment of 2,058 USD Million registered in 2013/14 as illustrated in the
| 15
Accountability Sector Strategic Investment Plan 2017/18 - 2019/20
figure below. The decline in amount of licenced investments in FY2014/15 is partly attributable to the licencing of a huge project worth USD260
The ASSIP review process consulted the private sector and picked their views on the factors that affect private investments, and their views are summarised here below. • The government/sector has previously had
limited consultations with the private sector, hence missing there valuable input;
• UBOS data is so aggregated that it cannot inform decision making by the various key stakeholders, especially the private sector;
• The cost of money is about 25% per annum while the competition in other countries pay interest rates of 6-8% per annum. This heightens the cost of production in Uganda and makes Ugandan products uncompetitive on the local and international markets;
• Government borrowing from commercial banks crowds out the private sector, hence the high interest rates;
• The government is reluctant to issue letters of credit to its suppliers, leaving them with
only contracts, which they cannot use to mobilise resources;
• Government is slow in paying, as it takes on average one year to pay its suppliers/service providers;
• There is limited issuance of technical advisory notes from the government to the private sector, e.g. real estate trajectory, potential projects (short, medium and long term), which limits their ability to plan for their businesses;
• There is lack of and/or limited knowledge of Uganda’s Export Strategy, coupled with absence of an export guarantee scheme to promote foreign exchange earnings;
• There is no public liability mandatory insurance scheme to promote insurance penetration; and
• Foreign exchange rates have been going up for the last seven years;
million in mineral beneficiation in FY2013/14; the uncertainty in the licensing of oil and gas projects; and the 2016 elections.
Figure 5: Licensed Investments by UIA
Source: Uganda Investment Authority. Project Licensed by Uganda Investment Authority last 5 Financial Years
3 Actual Investment figures are based on the conversion rates from “Investor Survey Report 2012”,Uganda Bureau of Statistics, page 14
16 |
Accountability Sector Strategic Investment Plan 2017/18 - 2019/20
A number of measures have been undertaken during the NDP II period to increase private investments, among which is the transformation of Uganda Investment Authority into a One Stop Centre for investors, offering free services where investors can register their businesses and get guidance/support on all relevant licences to their businesses under one roof. Currently, the core agencies at the One Stop Centre include the Uganda Registration Services Bureau (URSB); Uganda Revenue Authority (URA); National Environment Management Authority (NEMA); Directorate of Citizen and Immigration Control (DCIC); Ministry of Lands, Housing and Urban Development; Uganda National Bureau of Standards (UNBS); and Uganda Investment Authority (UIA).
Further, the Competitiveness and Enterprise Development Project (CEDP), a World Bank financed project coordinated by the Private Sector Foundation Uganda (PSFU) has begun to bear fruits to mention but a few:-
• The time taken to register a business has reduced significantly from 33 days in 2013 to 7 hours.
• URSB has opened offices in the 4 regions – Gulu, Arua, Mbale and Mbarara which are linked electronically and 3 new outlets have also been opened in Kampala: Posta; UIA offices and Nakivubo closer to the business community.
• Name search and reservations can now be done online.
• With collaboration under Tax Registration Enhancement Programme, 4 institutions URA, URSB, KCCA and NSSF are working together to ensure that upon registration of business, an enterprise immediately gets a TIN-number, trading licence and NSSF registration. This is already making the dream for the one stop Centre (OSC) for business facilitation a reality.
• On top of the improvement in service delivery, there has been an improvement in NTR collections without change in the fees structure from 6.5bn in 2011/2012 to 19.5bn in 2014/2015 a percentage increase of 67%.
Capital Markets: Capital markets development in Uganda started with the introduction of the Capital Markets Act Cap 84 and the establishment of the Capital Markets Authority in 1996 as a semi-autonomous body responsible for promoting, developing and regulating capital markets in Uganda. According to the Capital Markets Development Master Plan Uganda (February 2017), the measures undertaken during the NDP II and prior periods to increase the level of capitalization and widen investment opportunities in the capital markets include but not limited to developing the legal and regulatory frameworks for the issuance of securities and investments including collective investment schemes; public education; development of securities markets infrastructure and frameworks for cross border securities markets activities. Lately, the Parliament passed the Capital Markets Authority (Amendment) Bill 2015 into law.
Further, the Uganda Securities Exchange (USE) was established in 1998 and the first bonds listed in the same year, while the first shares were listed in the year 2000. As at the end of the year 2016, there were 16 companies listed on the USE, 8 of which are primary domestic listings and 8 are cross listed from the Nairobi Stock Exchange. Other achievements include the harmonisation of capital markets regionally; and admission of Uganda Capital Market to IOSCO, a global body that controls capital markets, which increases investors’ confidence in the stock market. Domestic market capitalisation was UGX4.31 trillion which comprised 4.6% of GDP. Statistics on the Uganda Capital Market as at the end of 2016 are provided in the table below.
| 17
Accountability Sector Strategic Investment Plan 2017/18 - 2019/20
Source: Capital Markets Development Master Plan Uganda, February 2017
presence of few institutional investors. The narrow domestic institutional investor base is attributed to the slow progress of implementing pension reforms, low insurance penetration and disincentives to the development of institutional savings and investment vehicles.
• The small pool of market intermediaries is not in a position to make a major contribution to capital markets development.
• Market infrastructure is adequate but duplicative comprising of the USE, the ALTX, the Bank of Uganda Central Securities Depository (for government securities), the ALTX and USE Central Securities Depository.
• Very limited information availability due to poor enforcement of financial reporting standards for companies as prescribed in the Companies Act. With the exception of regulated sectors such as banking, insurance, pensions and capital markets, most companies are not required and have no capacity to report in accordance with International Financial Reporting Standards.
Statistical Data Production: Over the years, the Uganda Bureau of Statistics has built public trust and increasing use of UBOS statistical data in planning and decision making. The measures
Despite the above developments, a number of factors still impede the development of the capital markets. According to the Capital Markets Development Master Plan Uganda the factors include: • The legal and regulatory framework for
capital markets is not suitable to Uganda’s present needs due to onerous issuance requirements, duplicative procedures and lack of flexibility to allow innovation and product development;
• There is a limited supply of securities or few issuers due to several factors. These include: a nascent private sector dominated by family controlled companies; most businesses prefer to remain private because of the reporting requirements and disclosures that are a prerequisite for listing; insufficient issuer education; slowing economic growth; and the costs of issuance are rather high for small cap issuers.
• In addition, there are several constraints to public sector issuance of securities including the heavy reliance on concessional loans, financial management and reporting challenges in public sector agencies and local governments.
• Only a narrow range of investors exist due to a heavily- retail oriented market and
18 |
Accountability Sector Strategic Investment Plan 2017/18 - 2019/20
undertaken during the last three years to improve statistical data production and policy research include but not limited to: • Increasing access to statistical products,
data, and information through dissemination of the 2014 Population and Housing Census; production of sub county profiles from the NPHC; etc.;
• Increasing the provision of planning figures by rebasing series for GDP from 2002 to 2009/10; rebasing series for the Consumer Price Index from FY2005/6 to FY2009/10; producing the Indicative Planning Figures (IPFS) to inform budgeting at sub national levels for FY 2016/17; providing planning figures for monitoring the performance of the economy i.e. quarterly GDP and Preliminary Annual GDP; weekly and monthly CPI; monthly Producer Price Index – manufacturing, Producer Price Index - Hotels & Restaurants, Construction Sector Indices, and Index of Production;
• Conducting the National Malaria Indicator Survey 2015; National Service Delivery Survey 2015; Urban Labour Force Survey 2015; and School to Work Transition Survey 2015;
• Increasing the capacity within MDALGs to produce statistics by improving institutional framework for statistics (Ratification of African Charter on Statistics approved by Cabinet); strengthening MDA Manpower to enhance statistical production; building statistical capacity in MDAs in the conduct of Surveys and data analysis etc.; supporting LGs to produce statistics including the Harmonized Database;
• Streamlining statistics production through the development of Sector Strategic Plan for Statistics (SSPS) and embracing the use of Computer Assisted Personal Interview (CAPI) in survey data collection; and
• Drafting Regulations governing the conduct of Statistics in Uganda; and developing the National Statistical Indicator Framework together with NPA, MFPED and OPM;
Policy Research Production: Over the years, the Economic Policy Research Centre (EPRC) has become a credible and reputable policy think tank with a strong policy outreach network. The research generated at EPRC is demand driven in that its research agenda is aligned to Uganda’s development strategy. EPRC has continuously produced policy oriented research in line with the NDP II and is positioned to support evidence based processes in Uganda as well as monitoring the Government programmes. Furthermore, EPRC has managed to bring together different stakeholders to discuss topical policy related issues and is currently the secretariat for the Uganda Economic Association (UEA). However, according to the PEFA 2016 report, “EPRC has the responsibility for conducting PETS, though these have not been carried out to any significant degree in the last 3 years. The last significant PETS was in the agricultural sector in 2012”.
The measures undertaken during the last three years to increase evidence based research uptake include: • Technical/policy support to various
Government MDAs (MoFPED, MAAIF, MTII, EAC, Ministry of Gender, OPM and Parliament) and non-state actors like Development Research & Training, PSFU. This has been through participation on committees, sector working group, National Technical working groups.
• Strengthening of the capacity of senior and middle level officials in MDAs (MAAIF, MEMD, MoES, Parliament Commission and Ministry of Public Services) to conceptualise research uptake; describe the role and importance of research in decision making and demonstrate how research uptake works in practice.
• Strengthening of the capacity of the Academia in terms of closing the gap between research and academic findings.
• Leveraged on EPRC’s convening power to convene public dialogues or joint dissemination with development partners (WB, UNDP, GIZ), Government (MAAIF, MEMD).
| 19
Accountability Sector Strategic Investment Plan 2017/18 - 2019/20
• Signed MOUs with authorities like UFZA with a purpose to strengthen their research capacity and use of data;
• EPRC has a resource centre (UDIC) equipped with materials based on research by EPRC and her partners like IMF, World Bank, UNICEF to mention but a few;
Anti-Money Laundering and Combating the Financing of Terrorism (AML/CFT): Money laundering can broadly be defined as the process of disguising the financial earnings of crime. It is an underground operation, which does not easily lend itself to empirical research. Criminals go to great lengths to hide the proceeds of their crimes and to disguise their money laundering activities.
The impact of money laundering activities in developing countries is significant due to relatively small or fragile financial systems or weak economies that are particularly susceptible to disruption as a result of illicit activities. They damage critical financial sector institutions as it undermines the integrity of the financial system and the entire society, distorts competition between businesses and entrepreneurs, rewards corruption and crime, undermines democracy and the rule of the law and a country’s reputation for weak AML or influence by organized crime can reduce or scare away foreign investors and reduce a country’s access to both foreign investments and foreign markets. Banking institutions and other financial institutions such as insurance companies, securities firms, or financial investment management firms are particularly vulnerable to the adverse consequences of ML. ML erodes these important financial institutions and impairs their development. Financial institutions in a developing country play an important role in investment decisions and capital flows.
The measures undertaken by the government to address money laundering and combat financing of terrorism include the enactment of the Anti-money Laundering Act (AMLA) 2013; and establishing the Financial Intelligence Authority on July 1, 2014 under Section 18 of the Anti-Money Laundering Act, 2013, to coordinate the implementation of the country’s Anti-Money
Laundering and Combating the Financing of Terrorism.
The following weaknesses in respect of AML/CFT exist, and need to be addressed in the fight against money laundering and financing of terrorism. • Uncoordinated implementation mechanism
of AML/CFT framework across the different stakeholders;
• Inadequate verification for ownership of legal entities;
• Inadequate Regulatory Oversight and Enforcement of AML/CFT Compliance requirements in Banks and Non-Bank financial institutions;
• Inadequate skilled human resource and financial resources in AML/CFT;
• Inadequate awareness of AML/CFT as a criminal offence by many stakeholders;
• Inadequate equipment and tools to detect and trace proceeds of crime;
• Cash based and parallel economy; • Large informal sector; • Cross-border transportation of cash; and • The lack of an asset management unit for
asset recovery; acute shortage of financial and forensic investigations and limited resources continue to impact FIA’s ability to efficiently and effectively deliver its mandate.
2.2.2 Resource mobilisation and allocationThis section presents the accountability sector’s achievements for the last five years specifically in the thematic area of Resource Mobilisation and Allocation, focusing on revenue management, public debt management, budget credibility and public investment management.
Revenue Management: During the last 5 years to 2015/16, the Tax to GDP ratio has consistently grown from 10.79% in 2011/12 to 13% in 2015/16, above the NDP II target of 12.92%. However, the Tax to GDP ratio in 2015/16 was below the sector target of 13.7%. The below
20 |
Accountability Sector Strategic Investment Plan 2017/18 - 2019/20
target performance is partly attributable to the slowdown of the global economy. Domestic tax collections were among others affected by the reduced profitability in the financial sector due to depreciation of the shillings, increased interest and lending rates, reduced sales and production in the key sub sectors of sugar, cigarettes and soft drinks. Nevertheless, the country remains on course in attaining the NDP II target of tax to GDP ratio of 16% by FY2019/20. On a regional basis, Uganda’s tax to GDP ratio is still far below the 25% required by the indicative convergence criteria of the Protocol on the establishment of the East Africa Community Monitory Union.
Uganda registered consistent growth of its domestic revenue to GDP ratio over the last
five years, from 11.2% in 2011/12 to 13.08% in 2015/16. However, according to the World Bank (Uganda Economic Update, January 2017), Uganda’s domestic revenue to GDP ratio in FY2015/16 was lower than that of its neighbours i.e. Kenya (23%), Tanzania (17.6%), Rwanda (14.3%), and Burundi (14.8%).
During FY 2015/16, non-tax revenue to GDP was 0.52% and this has consistently grown from 0.11% in 2011/12. However, there is still a need for better strategies to consistently grow non tax revenues. Overall, 82.5% of the national budget was funded from domestic revenues, while 17.5% was from external sources as illustrated in the table below.
Table 5: Past Performance of selected Revenue IndicatorsNo. Indicators Actual
2011/12 2012/13 2013/14 2014/15 2015/161 Tax to GDP Ratio 10.79% 11.20% 11.70% 12.8% 13.00%2 Domestic revenues to GDP4 11.2% 11.5% 11.9% 12.86% 13.08%3 Domestic revenue as a % of GDP
(excluding domestic Oil and Gas revenues)
10.5% 11.5% 11.9%
4 Non-tax revenue to GDP 0.11% 0.14% 0.16% 0.29% 0.52%5 External resource envelope as a
percentage of the National budget25.4% 11% 13.2% 18.2% 17.5%
6 International trade taxes to GDP 4.9% 4.8% 5.0% 5.6% 5.7%7 Domestic taxes to GDP 5.84% 6.69% 6.63% 7.13% 7.77%
Source: Ministry of Finance Planning and Economic Development – Tax Policy Department; and Annual Budget Performance Report (External resource envelope as a percentage of the National budget)
The measures undertaken during the NDP II and prior periods to improve Uganda’s Tax to GDP Ratio include but not limited to: • The relevant tax laws were streamlined during
FY 2014/15 to get rid of exemptions both in the Income Tax Act and VAT Act. Further, a number of laws were reviewed and updated including the Stamps Act, Excise duty Act and the Lotteries and Gaming Act;
• Implementation of the E-registration system enforcing mandatory TINs to access payments on IFMS. URA now has direct connection to IFMS for tracking government payees;
• Collaboration between URA, KCCA and URSB through the TREP initiatives to enhance registration of tax payers and raise revenue;
4 Annual Budget Performance Report FY 2014/15
| 21
Accountability Sector Strategic Investment Plan 2017/18 - 2019/20
• Introduced new tax measures including excise duty on bank charges, mobile money, international incoming calls, cosmetics, kerosene;
• Trade facilitation initiatives including one stop border posts ( OSBPs), implementation of the Single Customs Territory (SCT) and certification of Authorized Economic Operators (AEO) among others;
Local Revenues: Over the last three years to FY2015/16, Local Government local revenue as % of LG budgets averaged 4% and 19% in the
rural and urban local governments respectively, below the desired target of 30%. The minimum Local Revenue as % of LG budgets over the five years period was 3% and 14% in the rural and urban local governments respectively, while the maximum recorded was 4% and 21% in the rural and urban local governments respectively, as illustrated in the chart below.
The low local revenues in local governments is detrimental to fiscal decentralisation as it limits their discretion in allocation of resources to their specific priority interventions.
Figure 6: Local Government local revenue as a % of LG Budgets
Source: Local Government Finance Commission
Public Debt: According to the PEFA 2016 Report, the management of domestic and foreign debt and guarantees exhibited a high level of performance that meets good international practices (overall Score A) in terms of recording and reporting of debt and guarantees; approval of debt and guarantees; and debt management strategy. Indeed, Uganda continued to be at a low risk of debt distress in FY2015/16 with the present value of public debt-to-GDP of 24.6%, which is within the “less than 50%” ceiling recommended by the Public Debt Management Framework (PDMF). The present value of
domestic Debt Stock to GDP in FY2015/16 was 12.8% which was more than the NDP II target of 11.2% but within the acceptable range of less than 20% recommended by the Public Debt Management Framework (PDMF). On the other hand, the present value of external Debt Stock to GDP in FY2015/16 was 11.7%, which was within the acceptable range of less than 30% recommended by the Public Debt Management Framework (PDMF). Over the last five years to FY2015/16 nominal debt to GDP ranged between 23.3% and 33.8% as illustrated in the table below.
22 |
Accountability Sector Strategic Investment Plan 2017/18 - 2019/20
Table 6: Debt to GDP ratiosNo. Indicators 2011/12 2012/13 2013/14 2014/15 2015/16 PDMF1 Present Value of public debt
stock/GDPN/A 19.6% 20.4% 24.1% 24.6% <50%
o/w PV of External debt stock/GDP
N/A 9.0% 8.2% 10.7% 11.7% <30%
o/w PV of domestic debt stock/GDP
N/A 10.6% 12.2% 13.3% 12.8% <20%
2 Nominal Debt to GDP ratio 23.3% 26.3% 28.5% 32.7% 33.8%o/w external debt to GDP 13.7% 15.7% 16.3% 19.4% 21.0%o/w domestic debt to GDP 9.6% 10.6% 12.2% 13.3% 12.8%
Source: Ministry of Finance Planning and Economic Development – Directorate of Cash and Debt
However, as observed by the Auditor General’s 2016 report, there is a concern that for the first time, the ratio of total nominal interest payments to total government revenue increased to 16% in 2016 in relative terms and UGX.1.75 trillion in absolute terms, exceeding the 15% cap agreed in the Public Debt Management Framework (PDMF), 2013.
The average time to Maturity (ATM) of the Public (Govt) Debt Portfolio was 12.1 years in
FY2015/16, which is within the “more than three years” criteria recommended by the Public Debt Management Framework (PDMF). On the other hand, Domestic Debt Stock/Private Sector Credit (at nominal value) was 98.4%2 in FY2015/16, which is outside of the “less than 75%” criteria recommended by the Public Debt Management Framework as illustrated in the table below.
Table 7: Past performance of selected Public Debt Management IndicatorsNo. Indicators 2012/13 2013/14 2014/15 2015/16 PDMF1 Average time to Maturity (ATM) of
Source: Ministry of Finance Planning and Economic Development – Directorate of Cash and Debt
5 Bank of Uganda, June 2016. State of the Economy Report June 2016
| 23
Accountability Sector Strategic Investment Plan 2017/18 - 2019/20
Domestic Arrears: According to the Annual Performance Report of the Auditor General for the period ending December 2016, the arrears
amount has grown by 70% from UGX1.325 trillion in 2014/15 to UGX2.254 trillion in FY 2015/16 as illustrated in the chart below.
Figure 7: Domestic Arrears
Source: Auditor General Annual Performance Report
Moreover, whereas the consolidated financial statements put the figure of domestic arrears at UGX2.254 trillion, the audited position of the Internal Auditor General puts the amount at UGX2.700 trillion as at 30th June 2016, leading to a variance of UGX.446Bn. This calls for more strategic interventions to control and manage arrears.
The PEFA 2016 particularly measured the extent to which there is a stock of arrears, and the extent to which the systemic problem is being brought under control and addressed. The findings indicate a less than the basic level of performance (D) in respect to the stock of expenditure arrears and their monitoring. The report further identifies some of the major causes of arrears as budget resource shortfalls (budget provisions are insufficient - especially for utilities); contribution (membership fees) to international
organizations; court awards; compensations for major construction projects; Presidential pledges; pensions (veterans); and indiscipline by Accounting Officers – including bypassing the IFMIS commitment control system.
Fiscal Deficit: The macro-economic convergence criteria of the EAC monetary union requires member countries to meet a ceiling on the fiscal deficit of 3 percent of GDP (including grants) and 6 percent of GDP (excluding grants); and a reserve cover of 4.5 months of imports as agreed in the Policy Support Instrument (PSI) of the IMF. According to the Annual Budget Performance Report for FY 2015/16 the fiscal deficit as a percentage of GDP for FY2015/16 is estimated at 4.7%, up from 4.2 in FY2014/15. Over the past five years to 2015/16, the fiscal deficit as a percentage of GDP ranged between 2.5% and 4.7% as illustrated in the chart below.
24 |
Accountability Sector Strategic Investment Plan 2017/18 - 2019/20
Figure 8: Fiscal Deficit
Source: Ministry of Finance Planning and Economic Development – Directorate of Cash and Debt
Budgeting: According to the preliminary findings of the PEFA 2016, macroeconomic and fiscal forecasting was assessed as sound (score B+) as regards macroeconomic forecasts; fiscal forecasts and macro-fiscal sensitivity analysis. Likewise, sound performance was registered in respect of the fiscal strategy (B), mainly attributed to the adoption of the fiscal strategy; and reporting on fiscal outcomes. However there was no sufficient evidence to confirm that all (over 75%) policy proposals are subjected to fiscal impact analysis (score D), which pulled down the overall performance of the fiscal strategy indicator. Further, the PEFA 2016 findings indicate a high level of performance (A) in respect to the budget preparation process,
focusing on the budget calendar; guidance on budget preparation; and budget submission to the legislature. Sound performance (B) was also registered in respect to the predictability of in year resource allocation, mainly focusing on consolidation of cash balances; cash forecasting and monitoring; information on commitments ceilings; and significance of in year budget adjustments.
On the other hand, Uganda’s approved national budget has grown by 71% over the last five years, from UGX9.794 trillion in 2011/12 to UGX16.735 trillion in 2015/16. Likewise, the amount of the approved national budget released has grown by 53% from 8.525 trillion in 2011/12 to UGX13.054 trillion in 2015/16 as illustrated in the chart below.
| 25
Accountability Sector Strategic Investment Plan 2017/18 - 2019/20
Figure 9: National Budget, Releases and Expenditure
It is also observed that over the last five years to 2015/16, on average, 85% of the approved national annual budget was released, the percentage released ranging from 78% to 88.3%. In the same period, on average 98% of the
funds released were absorbed, the absorption rate ranging from 96.7% to 98.7%. Further, on average 83% of the approved budget was spent over the last 5 years to FY2015/16 as illustrated in the chart below.
Accountability Sector Strategic Investment Plan 2017/18 - 2019/20
The measures undertaken during the NDP II and prior periods to improve Budget Credibility include but not limited to:
• Developing an integrated planning and resource allocation framework to ensure alignment of the planning and budgeting instruments;
• Implementing the programme based budgeting to effectively focus on national and sectoral budgets on achieving results. Programme Based Budgeting brings the sector institutions together to focus on sector outcomes, and presents an opportunity to allocate resources at sector outcome level. To this end, a new automated Programme Based Budgeting System was finalised and effective FY2016/17 there is a shift from Output to Programme Based Budgeting;
• The enactment of the PFMA that enforces effective collaboration between MoFPED and NPA to align annual plans to NDP and Vision 2040. A certificate of budget compliance is issued by NPA and all sectors are required to have SIPs aligned to NDP II.
Public Investment Management: According to PEFA Report 2016, the sector continued to perform below the basic level of performance (D) in regard to Public Investment Management as there was no evidence to demonstrate that:a. over 25% of the major projects undergo
economic analysis;b. guidelines are used during investment project
selection; c. recurrent costs were part of budget
documentation; and d. standard rules and procedures are followed
during investment project monitoring;The Ministry of Finance Planning and Economic Development is working on strengthening the Public Investment Management System and has finalized the Public Investment Management Framework for Uganda to guide project preparation and implementation. One of the actions is to put in place an integrated Bank
of Projects aimed at improving coordination and accountability during project preparation and implementation. Further, the ministry has strengthened the capacity of the development committee, and for all infrastructural projects, no approvals are granted to projects without ready pre- feasibility studies. The Ministry has further ensured that Project Management Units PMUs are in place before project implementation.
2.2.3 Budget Execution, Accounting, Audit and Anticorruption
This section presents the accountability sector’s achievements during the last five years, specifically in the thematic area of Accounting, Audit and Anticorruption, focusing on compliance with accountability rules and regulations; prevention, detection and elimination of corruption; public contract management; pubic demand for accountability; and anti-money laundering.
As per the NDP II, the Government Effectiveness index was -0.57 (-2.5 weak; 2.5 strong) in 2012/13 with a target of -0.36 and 0.01 in 2015/16 and 2019/20 respectively. Statistics on the past and current actual performance in respect of the Government Effectiveness Index are however scanty, hence the need for this strategic plan to be specific on the responsibility and frequency of measuring this indicator going forward.
Compliance with accountability rules and regulations:
According to the Annual Budget Performance Report FY2015/16, in terms of Financial Management, there was 95% compliance with set financial reporting standards; 100% compliance with Treasury Single Account Requirements; 85% compliance of Donor Financed Projects with financing agreements Terms of Reference. These were all on target while only 63% of MDAs submitted reports on time, below the target of 100%. Under the Management and Reporting on Government Accounts, only 12 out of the targeted 25 reports registered satisfactory ranking in Statutory Corporations while 38 Local Authorities were satisfactory beyond the target of
| 27
Accountability Sector Strategic Investment Plan 2017/18 - 2019/20
37. In the same line, 12 out of the target 15 Central Government MDA were ranked satisfactory.
Despite the relatively good performance, non-compliance with PFM procedures, regulations, and standards remains the number one obstacle to effective and efficient service delivery.
Over the last five years, the percentage of central government entities, statutory bodies and local
governments with clean audit reports has greatly and steadily improved, from 45%, 41% and 32% in 2011/12 to 77%, 79% and 85.7% in 2015/16 respectively. The most remarkable improvement came from local governments as they started with the lowest percentage of clean audit reports and gradually increased to the highest percentage in the last two years to FY2015/16 as illustrated in the chart below.
Figure 11: Percentage of Clean Audit reports
Source: Annual Office of the Auditor General Reports
The percentage of external audit recommendations implemented by MDALGs remains low at 27.88% for FY2015/16. As one of the measures to improve compliance, Accounting Officers in Ministries have to explain qualified opinions, otherwise reappointment is questioned by the PS/ST. This has contributed to the improved performance however, it should be noted that clean audit reports do not necessarily
indicate that all is well. There may be other issues that affect the citizen which need attention.
The Internal Auditor General (IAG) office has continued to play a critical role in the process of reappointment of Accounting Officers on an annual basis by tracking the status of implementation of the recommendations in OAG and IAG reports and advising the PS/ST accordingly. This
28 |
Accountability Sector Strategic Investment Plan 2017/18 - 2019/20
Figure 12: Percentage of Internal Audit Recommendations Implemented
Source: Consolidated Internal Audit Annual Reports on internal audit
The above achievements are attributed to a number of measures that have been undertaken during the NDP II and prior periods to improve compliance with accountability rules and regulations. Some of the interventions in the accounting and audit areas include but not limited to:
Accounting • Enactment of the Public Finance Management
Act 2015 and issuance of the new Public Finance and Management Regulations in 2016 by the Hon Minister of Finance, Planning and Economic Development. The Act and Regulations adopted best practice in PFM and new PFM reforms, and some of the best
practices adopted include approval of the National Budget by the start of the financial year; the Charter of Fiscal responsibility is approved by Parliament to guide fiscal management of the economy; alignment of the Budgeting with NDP II among others. The PFM Act, 2015 and the Regulations are now being implemented and have provided a robust framework for planning, allocation, control and management of public finances to enhance service delivery;
• Mainstreaming recommendations from the PEFA report of 2012 in the PFM reform strategy, now under implementation;
has helped in improving compliance as most Accounting Officers are now keen to ensure that all recommendations in the two reports are timely addressed. On average, 60% of internal audit recommendations were implemented annually across MDALGs over the last four years to FY2015/16. There is also a steady growth in the percentage of internal audit recommendations
implemented by MDALGs annually, from 54.45% in 2012/13 to 66.2% in 2015/16 as illustrated in the chart below. However, disaggregated data on the implementation of internal audit recommendations by central government, statutory bodies and local authorities is scanty, hence the need for a clear strategy on how to report on this in the future.
| 29
Accountability Sector Strategic Investment Plan 2017/18 - 2019/20
• Upgrading and rolling out the Integrated Financial Management System (IFMS) to MDAs. The IFMS is now operational in all the 22 Ministries and 16 Referral Hospitals, 47 out of the 55 central government agencies, 33 out of the 35 Ugandan Missions abroad and 73 out of 155 Local Governments (14 IFMS Tier I and 59 IFMS Tier II). Further, the warranting, release and payment processing is integrated on the IFMS and linked to the Central Banking system. These have greatly improved efficiency and effectiveness in public financial management leading to better accountability and transparency in the management of public resources;
• Government also implemented Electronic Funds Transfer and Straight Through Processing. These reforms have enabled accurace and timely processing of Government payments to beneficiaries.
• Every end of a financial year, a Board of survey is constituted to take stock of all public assets at central and local governments. The Consolidated Board of Survey report for the year ended 30th June 2015 and status report on implementation of recommendations from the Board of Survey was produced, while the Consolidated Board of Survey report for the year ended 30th June 2016 is being compiled;
• With effect from October 2013, Government implemented the Treasury Single Account for Central and Local Government on IFMS to enable monitoring of government cash resources and as a modern and efficient cash management practice. The framework was extended to an additional 45 Local Governments on the IFMS Tier II solution. Government also restricted cash withdraws to the maximum of UGX40M per month in order to reduce the amount of public funds exposed to fraudulent abuse. Further, the government strengthened the reconciliation of all Government transactions between MoFPED, BoU and Accounting Officers; and
sanctioning of non-compliant Accounting Officers; all of which provide better cash management and aggregate control over public resources, hence the improved public finance management.
• The Computerised Education Management and Accounting System (CEMAS) was piloted at Mbarara University of Science and Technology and implementation is ongoing at Makerere University Business School and Makerere University Main Campus;
• Decentralization of payment of salaries, pension and gratuity to MDAs and LGs, and enabling the interface between the IPPS and IFMS to facilitate payroll processing across Government. By June 2016, 193 sites in Central and Local Governments were connected on the IFMS-IPPS interface.
• Government through the Treasury inspectorate function undertakes regular review and monitoring of financial management practices within Government. A Compliance monitoring unit has been established to offer quality assurance on every day transaction processing by Treasury in close collaboration with votes.
• To date, Government has 171 out of 616 qualified accountants and 71 out of 136 qualified procurement staff. This has been achieved through the Professional sponsorship scheme and continuous professional development courses provided by the professional institutes for accountants and procurement cadre;
• Government harmonised the Chart of Accounts for Central and Local Governments which is used for both budgeting and accounting. This is based on the international classification of government fiscal statistics;
30 |
Accountability Sector Strategic Investment Plan 2017/18 - 2019/20
Audit: • The Office of the Auditor General has
implemented measures to enhance effectiveness and efficiency of external audit and these include: rolling out International Standards for Supreme Audit Institutions (ISSAIs); construction of Audit house and opening up regional offices to enhance the physical independence of the OAG office; establishing a Wide Area Network to link regional offices and improve coverage; publishing of reports on the OAG website; promptly disseminating reports to all key stakeholders and production of abridged versions of the annual audit report.
• The audit function has further been strengthened through creation of an office of the Internal Auditor General; putting in place audit committees; audit automation; creation of three departments handling Internal Audit Management, Forensics and Risk Advisory, and IT and Performance Audit; and empowerment through the PFMA 2015.
• There is an internal audit function at every central government vote which focuses on adequacy and effectiveness of internal controls and adherence to professional standards however, quality assurance seems to be inadequate.
• The IAG Office conducted a number of Special/Advisory Engagements besides the normal audits in FY 2015/16 in key Government entities and this has helped identify and address a number of gaps in the existing operations, thereby improving compliance with the existing regulations.
Prevention, detection, and elimination of corruption: Transparency International’s 2016 Corruption Perceptions Index ranked Uganda 151 out of 176 countries with a score of 25 out of 100, the lowest since 2012. This score is much lower than that of Rwanda (54%), South Africa (44%) and Tanzania (30%), but similar with Kenya (25%), indicating a perception of widespread and endemic corruption. The chart below illustrates Uganda’s performance in respect of the Corruption Perception Index over the years 2012 to 2016.
Figure 13: Uganda’s Corruption Perception Index
Source: Transparency International Corruption Perception Index
| 31
Accountability Sector Strategic Investment Plan 2017/18 - 2019/20
Further, Uganda has consistently scored poorly in the World Bank Worldwide Governance Indicators (WGI). In 2011, it scored 19.9 on control of corruption, on a scale of 0 to 100 and it has shown no improvements across the years. Corruption is still seen as the most problematic factor for doing business in the country according to nearly 19% of business people surveyed under the 2012 Enterprise survey (World Economic Forum, 2013). According to respondents to the National Integrity Survey conducted by the Inspectorate of Government in 2008, the most recurrent forms of corruption in the country include the payment of bribes (66% of the respondents); embezzlement of public money (15%), nepotism (5%), and favouritism (3%).
During FY2015/16, only 50% and 35% of the anticorruption and ombudsman recommendations respectively were implemented. There is therefore a need for more stringent measures to hasten the implementation of oversight recommendations by entities. Further, the absence of a Leadership Code Tribunal contributes to this poor performance.
Despite the poor performance as illustrated above, in FY2015/16 the different parameters used to measure the effectiveness of anti-corruption enforcement indicate some success in terms of the number of complaints received, investigations conducted, prosecutions and conviction cases registered by the IGG. The measures undertaken during the NDP II and prior periods to further improve the prevention, detection, and elimination of corruption include but not limited to:
• The National Anti-Corruption Strategy (NACS) was developed and adopted. The NACS is a five year planning framework that guides anti-corruption efforts in Ministries, Departments, Agencies and Local Governments (MDA&LGs). The Fifth Cycle of the National Anti-Corruption Strategy (NACS 2014-2019) was launched in 2014. As a result, a number of Sectors, MDA&LGs and CSOs have developed and are implementing their anti-corruption action plans.
• A number of laws and policies have been developed and reviewed to facilitate the fight against corruption. These include the National Ethical Values Policy 2013; Whistleblowers’ Protection Regulations, 2015; and the Online Assets Declaration Regulations 2016. Further, the Leadership code (Declaration Form) Regulations 2016 were approved by Cabinet; the Leadership code (Amendment) Bill, 2016 was redrafted to incorporate the directives of Cabinet; drafted Zero Tolerance to Corruption Policy; disseminated the Anticorruption laws; and consultative meetings were carried out in developing of the law on Asset Recovery and Mutual Legal Assistance.
• The DEI partners with Local Governments to improve coordination of anti-corruption efforts, effective leadership, accountability and good governance at the district level. This has been done through the establishment of District Integrity Promotion Fora (DIPF), a replica of the IAF at Local Government level. Through the DIPF the DEI builds the capacity of senior officials and representatives of selected CSOs at the districts with an aim of promoting accountability at the Local Government level. So far over 80 DIPFs have been established countrywide.
• Government, through the DEI established a structural collaboration with the Anti-Corruption CSOs and Religious and Faith Based Organisations (R&FBOs) called the Anti-Corruption Public, Private Partnership. The ACPPP framework brings together members of the IAF, and Anti-Corruption SCOs to work jointly in areas of Policy review and formulation, advocacy, capacity building and research. The main aim of this collaboration is to mobilize CSOs right from National, Regional, District and Community level to monitor service delivery in their respective areas. So far nine (9) Annual Review meetings have been held and this has registered a number of success stories
32 |
Accountability Sector Strategic Investment Plan 2017/18 - 2019/20
basing on the testimonies given by the stakeholders as far as responding to the demand for service delivery is concerned.
• In pursuance of its mission of empowering the Ugandan society to uphold moral values and principles, the DEI works closely with schools to rebuild ethics and integrity. The DEI has partnered with the National Curriculum Development Centre (NCDC) to introduce ethical values in the revised Primary School Curriculum. The process of integrating the same in the Secondary School Curriculum is on-going. In addition, a training program for Primary Teachers’ Colleges (PTCs) to integrate ethical values in school activities is in place.
• The DEI works with Professional Bodies to ensure that professional code of Conduct is enforced to improve work ethics and promote transparency and accountability in the delivery of public service.
• The National Ethical Values Policy (NEVP) was developed and launched in 2013 as a framework for rebuilding and sustaining a morally upright society with national integrity for the fulfilment of Uganda’s aspirations and ideas. The ten National Ethical Values are: Integrity, Honesty, Transparency, Accountability, National Unity, Justice and Social Harmony, Unity and Respect, Creativity, Hard work and Patriotism. All stakeholders are urged to effectively popularize these values.
• The DEI is the Secretariat for the Inter Agency Forum (IAF) against corruption. The IAF is a coordinating mechanism for institutions that are mandated to enhance accountability and fight corruption at the Central Government level. It provides the policy and strategic direction to the anti-corruption agenda. Currently the IAF constitutes of the Directorate for Ethics and Integrity (DEI); Inspectorate of Government (IG); Office of the Auditor General (OAG); Public Procurement
and Disposal of Public Assets Authority (PPDA); Directorate for Public Prosecutions (DPP); Ministry of Finance Planning and Economic Development (MoFPED); Uganda Revenue Authority (URA); Ministry of Public Service-Inspection (MPS-I); Ministry of Local Government-Inspection (MLG-I); Inspectorate of Courts; Criminal Investigations Directorate (CID); Ministry of Internal Affairs; Local Government Finance Commission; Public Service Commission; Education Service Commission; Health Service Commission; Judicial Service Commission; and the Anti-Corruption Court.
• The IG carried out a census to establish the status of the backlog at the Head and the Regional Offices so that appropriate strategies can be designed to address the backlog from an informed point of view;
• The online declaration system (IG-ODS) which is intended to boost the compliance of leaders’ declaration was developed and piloted;
• Anti-Corruption Agencies working with the SUGAR project are undertaking a number of initiatives across the Anti-Corruption Chain e.g. development of information sharing protocols and embedding them into internal processes between IG and FIA, Audit institutions, Attorney General, and MoFPED;
• The IG established a Directorate of Special Investigations to expeditiously carryout Investigations of grand and syndicated corruptions for prosecution and punitive administrative sanctions.
• Domesticated most of the provisions of UNCaC through development of anti-corruption institutional and legal framework to tackle the increasing corruption.
• The CSOs in partnership with the IG are implementing the citizen engagement framework and Community empowerment interventions under NUSAF III;
| 33
Accountability Sector Strategic Investment Plan 2017/18 - 2019/20
• The IG launched a new strategic plan 2015/16-2019/20 with well-defined interventions on increasing financial resources;
• At the Parliamentary level, there are 12 Standing Committees of which five are directly concerned with financial matters: (i) Budget Committee; (ii) Public Accounts Committee (PAC); (iii) the Committee on Commissions, Statutory Authorities and State Enterprises (COSASE); (iv) the Local Government Accounts Committee (LGAC); and (v) Committee on the National Economy, which deals with issues relating to the national economy including scrutiny of loan agreements. Each Standing Committee has 15 members, except for the PAC that has 30 members, who are nominated and
Table 8: Public Contract Management Past PerformanceIndicator 2011/12 2012/13 2013/14 2014/15 2015/16% of entities rated satisfactory from procurement audits
N/A N/A 25% 29% 90%
% of contracts audited (by value) rated satisfactory 27% 24% 30% 23.4% 92%Proportion of procurement audits and investigation recommendations implemented
79% 80% 77% 57% 72%
Proportion of Contracts subject to open competition 91% 74% 87.59% 50% 45.5%Percentage of contracts with complete procurement records
17.1% 20.8% 30% 20% 67%
No. of procurement and disposal audits 92 91 107 121 114Proportion of contracts completed within the contractual time
N/A 78.2% 79% 78.6% 49.6%
Proportion of procurements conducted at the planned price.
N/A N/A 48.6% 80.5% 63.1%
% of contracts awarded to local providers (by value) N/A N/A 40% 68% 57.7%Source: Public Procurement and Disposal of Public Assets Authority (PPDA)
subsequently elected by MPs. There is also a Sessional Committee for finance, planning and economic development and for each other sector/ministry that examines policy, budgets and proposed legislation coming from each ministry.
Public Contract Management: During the last five years to FY2015/16 the proportion of procurement audit and investigation recommendations implemented averaged 73%, ranging from 57% to 80%. During FY2015/16, 72% of procurement audits and investigation recommendations were implemented while 90% of entities audited were rated satisfactory from procurement audits; and 92% of contracts audited (by value) were rated satisfactory as illustrated in the table below.
Although the above table depicts a relatively good performance in respect to the percentage of contracts awarded to local providers by value (57.7%), it must be noted that in calculating the percentage of contracts awarded to local
providers by number and value, PPDA considers all companies registered in Uganda, irrespective of whether they are owned by Ugandans. Therefore, the actual number and value of contracts awarded to Ugandans especially in the high spend sectors like education, Works, Energy
34 |
Accountability Sector Strategic Investment Plan 2017/18 - 2019/20
etc. (Karuma, Isimba, Standard Gauge Railway, etc.) is lower than what is reported above.
Despite the good performance as illustrated in the above table, the 2016 Procurement Integrity survey undertaken by PPDA found an increase in corruption in public procurement with over 86% of service providers and 51% of officials openly admitting that corruption influences procurement decisions. Conflict of interest with officials favouring friends or relatives also appears a growing aspect of corruption. 24% of service providers admit to paying bribes to win contracts often and a further 35.5% sometimes. The amount paid is negotiated between contractors and officials as a percentage of contract value, with the most common amount paid between 10-20%.
Public contract management is further challenged by: • Lack of Local Government PPDA regulations
and guidelines, which affects compliance to the Procurement Law and implementation. Additionally, the guidelines to Foreign Missions are inapplicable and need to be reviewed to take into consideration the uniqueness of environment in which these mission operate.
• a number of users are yet to appreciate and comprehend the PPDA Amended Act;
• weak procurement and disposal entities due to untrained staff and high staff turnover, poor record keeping, poor procurement planning and budgeting; use of wrong procurement methods; non adherence to procurement methods; poor contracts supervision and management, etc.; and
• low capacity of procurement cadre especially in local governments, lack of market assessment and applicability, and political interference;
A number of measures undertaken are responsible for the relatively good performance, while others are intended to address the gaps in public contract management especially the areas of underperformance. These include:
• At the time of drafting this Strategy, a National Public Sector Procurement Policy had been finalized by the Ministry of Finance, and was before Cabinet for consideration and approval. The Policy provides strategic guidance on the public procurement system in Uganda focused on attaining value for money in the acquisition and disposal system. In addition, the Ministry of Finance was finalizing a spend analysis which will provide input in design of appropriate procurement strategies in government.
• Established the PPDA Appeals Tribunal to handle appeals emerging from disputed procurement processes. A Chairperson and members of the tribunal were appointed by the Minister responsible for Finance;
• The evaluation of bids has been finalised for acquiring the e-Government Procurement which is expected to ‘Go Live’ in July 2018; amendment of the LG (PPDA) regulations commenced; and guidelines on local content have been issued by PPDA with the objective to increase the input of local labour, goods and services in the procurement of public projects, goods and services in the country.
• Mainstreaming Local Content unlocks the potential for economic growth, and has helped giant economies. To this effect, the PPDA Act provides for preferential schemes and a local content implementation strategy for Uganda has been drafted.
• A Public Procurement Performance Measurement tool was developed and utilised to assess procurement system at PDE level. This informs the periodic reports on the performance of votes.
• A three year fellowship programme for capacity building of procurement cadre in public procurement policy and practices was secured under the Korean International Cooperation Agency (KOICA). So far, 30 officers have benefited from the study.
• Enactment of the Public Private Partnerships Act and development of the corresponding Regulations; and
| 35
Accountability Sector Strategic Investment Plan 2017/18 - 2019/20
• Developing a draft Bill for the Institute of Procurement Professionals of Uganda (IPPU).
Public demand for accountability: The public has continued to demand for accountability through various fora however, the demand is weak and sometimes not informed and focused on real issues affecting service delivery.
According to the PEFA 2016 Report, the dimensions on resources received by service delivery units; and performance evaluations for service delivery scored below the basic level of performance (D), reasons being that no service delivery surveys had been carried out in the last three years; no ministry’s service delivery had been evaluated in total; and information is not readily available on resources received by service delivery units.
The measures undertaken by the sector and individual sector institutions during the NDP II and prior periods to improve Public demand for accountability include but not limited to: • The budget website and call centre have
been established and all budget information uploaded onto www.budget.go.ug. In addition, quarterly releases are published for central and local governments in the newspapers;
• The Sector held 2 Joint Annual Reviews and 2 regional accountability forums in Gulu and Soroti where pertinent issues effecting service delivery were deliberated upon and recommendations and undertakings taken;
• The PPDA is conducting regional procurement Barazas to engage citizens on procurement matters;
• The Directorate of Ethics and Integrity (DEI) is responsible for the mobilization of the public and enlisting its involvement in the fight against corruption and consequences of moral decadence. This is done through Public awareness and education programs in collaboration with partners under the ACPPP arrangement.
• It’s now mandatory for MDALGs to have procurement and Disposal Notice Boards in visible and easily accessible places within their premises;
• The IG is working with the Transparency, Accountability, and Anti-corruption (TAAC) component under NUSAF III to involve the citizens in the entire accountability process i.e. from initiation to closure of projects.
• Civil Society are normally included in the entire budget process from planning to oversight;
• Developed, disseminated, and monitored the implementation of Client Feedback tools in MDAs and DLGs and Urban Authorities;
• Developed and implemented Pearl of Africa Institutional Performance Score Card and Guidelines for Service Delivery Standards (SDS) to MDAs and DLGs;
• The MoLG has institutionalised the National Assessment of Minimum Conditions and Performance Measures of LGs, and developed the Framework for Promoting Good Governance and Anti-Corruption in Local Governments. The Ministry also developed a Downward Social Accountability Framework which empowers citizens to demand for accountability in the service delivery;
2.3 Strength and weaknesses
2.3.1 Sector Strategies and PoliciesThe sector has thus far been guided by the Accountability Sector Strategic Investment Plan 2014-2019 which was launched in 2014, just before the launch of the NDPII. It was observed that ASSIP 2014-2019 only covered two thirds of the sector objectives, as it is more inclined to Public Financial Management (PFM) and anti-corruption, with less coverage of the economic management area. This strategic investment plan is therefore an enhancement of ASSIP 2014-2019 to harmonise it with the NDP II and emerging policy directives which were hitherto not covered.
36 |
Accountability Sector Strategic Investment Plan 2017/18 - 2019/20
All sector institutions have their own Strategic Investment Plans, some of which are already aligned to the NDP II, while others are in the process of being reviewed to comply with the
national planning guidelines. In addition, the sector has a number of Policies, Strategies and Laws being implemented under the different thematic areas as illustrated below.
Table 9: Sector Strategies, Policies and Laws
Policies Strategies Laws and RegulationsEconomic Management Thematic Area• Microfinance Policy
and Regulatory Framework in Uganda;
• Financial Inclusion Strategy;
• Capital Markets Development Master Plan Uganda
• The Uganda Bureau of Statistics Act, No. 2/1998 as amended
• Tier IV Microfinance and Money Lenders’ Act 2016;
of Uganda, 2000;• Insurance Regulations, 2002;• Insurance (Investment of Paid Up Capital and
Insurance Funds) Regulations, 2008;• Insurance (Amendment of Brokers Minimum
Paid-up Capital and Security Deposit) Instrument, 2013;
Resource Mobilisation and Allocation Thematic Area• Public Debt
Management Framework (2013)
• Public-Private Partnership Policy
• Policy on double taxation agreement (Currently with cabinet Awaiting parliamentary approval)
• Oil and Gas Revenue Management Policy;
• Uganda Development Cooperation Policy (in draft)
• Public Debt Management Strategy (PDMS) 2016;
• Budget act 2001• The PFM Act 2015• Finance Commission Act 2003• The Uganda Revenue Authority Act, Cap. 196
vol. 8 Laws of Uganda.• Kampala Capital City Authority Act, 2010• National Lottery Act, 1967 as amended;• Stamps Act,• Excise duty Act;• Lotteries and Gaming Act;• Local Governments Act 1997;
| 37
Accountability Sector Strategic Investment Plan 2017/18 - 2019/20
Policies Strategies Laws and RegulationsBudget Execution and accounting Thematic Area• National Public
Sector Procurement Policy (in draft);
• Guidelines for Cash Management in government;
• Cash Management Policies and Procedures in Uganda (in draft)
• EGP Implementation Strategy;
• Local Content Implementation Strategy (in draft);
Auditing and anti-corruption Thematic Area• National Ethical
Values Policy (NEVP);
• Zero Tolerance to Corruption Policy (in draft);
• Religious Faith based Organisations policy (in draft);
• National Anti-Corruption Strategy (NACS 2014-2019);
• Local government Act CAP 243• Leadership Code Act 2002• Inspectorate of Government Act 2002• Access to information Act 2005• Anti-Corruption Act 2009• National Audit Act 2008• Whistle blower’s Protection Act, No. 6/2010;• Computer Misuse Act, 2011• Electronic Transfer Act, 201;• Anti-Pornography Regulations, 2014;• Online Assets Declaration Regulations 2016; • Whistle blowers’ protection Regulations, 2015;• Public Service Standing Orders;
the Accountability Sector is well positioned to deliver. However, this can only happen if the sector is well linked, integrated, coordinated, working together and pulling in the same direction.
The Leadership Committee provides political direction to the sector and is composed of the political heads of the sector institutions, chaired by the Minister of Finance Planning and Economic Development. Having MFPED as the lead sector institution is in itself a strength as the Ministry has the potential to direct macroeconomic policy and sanction poorly performing sectors in regards to service delivery.
However, the leadership committee seldom meets, having held no more than three meetings in the last four years despite the fact that it is expected to sit at least twice a year. The limited number of meetings affect and slows down decision making.
Despite having good laws, policies and strategies, the sector has not performed very well in their implementation, while other countries with almost similar strategies, policies and laws have successfully implemented theirs and are reaping the benefits.
Further, the lack/inadequacy of service delivery standards by sectors was identified as a bottleneck to the effective implementation of the Accountability Sector Strategic Investment Plan and NDP II.
2.3.2 Sector Management structuresThe sector has well-defined management structures covering the leadership committee, steering committee, sector working group and a secretariat housed at the Ministry of Finance Planning and Economic Development, and over 20 sector institutions. In its current membership,
38 |
Accountability Sector Strategic Investment Plan 2017/18 - 2019/20
The Steering Committee is composed of Accounting Officers and Chief Executives of the sector institutions. The committee is chaired on a rotational basis, the current chairperson being the Secretary, Inspectorate of Government. The Steering Committee is responsible for formulating sector policies, coordinating, quality assurance and mobilising resources for the implementation of the Accountability Sector Strategic Investment Plan.
Although the steering committee is expected to sit every quarter, it seldom meets and held no more than four meetings in the last four years to 2016/17. Moreover, during the previous meetings a number of Steering Committee members were absent and many of the delegated staff were members of the Sector Working Group, making the Steering Committee meetings look like an extension of the Sector Working Group meeting. This definitely slowed down business and killed the morale of committed members.
The continued inadequacy of the leadership and steering committee meetings probably explains the current practice where, instead of agreeing priorities and negotiating for funds as a sector, sector institutions prefer to focus on their individual priorities and negotiate their allocations directly with the Ministry of Finance, a practice that undermines the Sector Wide Approach spirit, and with the potential to breed sub-optimism.
Further, in its current membership, a number of heads of sector institutions are not represented on the Steering Committee. These include the Bank of Uganda; Capital Markets Authority; Uganda Retirements Benefits Regulatory Authority (URBRA); National Social Security Fund; Uganda Development Bank Limited; Uganda Investment Authority; Private Sector Foundation Uganda; Economic Policy Research Centre; and Insurance Regulatory Authority. The non-representation of these institutional heads leads to the sector missing their critical views and analysis when it comes to discussing and agreeing matters within their jurisdiction.
The Sector Working Group is comprised of senior technical staff from the sector institutions, private sector and civil society and is chaired by the Accountant General. This group regularly meets on a monthly basis and mainly drives the sector planning, budgeting and reporting.
However, the monthly SWG meetings are not very attractive especially to some key stakeholders as the content and focus of the discussions many times tend to be more administrative than strategic. There are limited discussions on the technical issues affecting and impacting the sector, and possible solutions. Moreover, the SWG faces a problem of the absence of key members and/or sometimes delegating junior staff to the meeting. In many cases the junior staff hesitate to make decisions, and do not have the history and background of the ongoing discussions, which definitely slows down business and kills the morale of committed members.
In its current membership, a number of sector institutions are not represented on the Sector Working Group. These include the Bank of Uganda; Capital Markets Authority; Uganda Retirements Benefits Regulatory Authority (URBRA); National Social Security Fund; Uganda Development Bank Limited; Uganda Investment Authority; Economic Policy Research Centre; and Insurance Regulatory Authority. Again, the non-representation of these institutions on the Sector Working Group leads to the sector missing their critical views and analysis, especially when it comes to discussing and agreeing matters within their jurisdiction.
Further, there are no established and functional technical working groups under the accountability sector working group to discuss and distil thematic technical issues and produce reports with conclusions and recommendations for the SWG to consider and where need be, escalate to the Steering and Leadership committee for endorsement. It is therefore necessary that technical working groups and their composition are agreed, Terms of Reference drafted, giving their scope of work, frequency of meetings, leadership and reporting structure, facilitation, etc.
| 39
Accountability Sector Strategic Investment Plan 2017/18 - 2019/20
The accountability sector has a functional Secretariat coordinating the sector activities; advising the leadership, steering committee and sector working group and documenting proceedings of their meetings; consolidating the sector Budget Framework Papers, Semi Annual and Annual Reports; organising the sector joint annual reviews, regional and national accountability forums; etc.
The secretariat structure as envisaged in the ASSIP 2014-2019 provides for a Coordinator, PFM Specialist; Planning and Budgeting Specialist; Economist/Statistician; Monitoring and Evaluation Specialist and Anticorruption Specialist. However, in its current state the secretariat has a Coordinator and a Program Manager, and its structure as envisaged in the ASSIP 2014-2019 remains largely unfilled. In fact, over 90% of the technical staff are not yet recruited, which limits the secretariat’s capacity to undertake all its activities, especially its advisory role to the leadership and steering committee, and the sector working group.
Currently, the setting of the secretariat is focused on coordinating budgeting and reporting (GAPR and sector reviews) with limited engagement and focus on technical issues affecting the sector.
Furthermore, a number of the sector activities that would be undertaken by the Secretariat are not adequately funded while others are fully unfunded. These include but not limited to provision of technical advice to the sector (employing technical advisors), undertaking national and regional accountability fora, supervision and monitoring missions; etc.
The accountability sector is comprised of 20 Sector Institutions (as illustrated in section 1.1.2) with variant mandates, sizes, capacity and capability i.e. some are votes while others receive subventions.
During the consultations, it was reported that some Sector Institutions like MFPED, IG, OAG, URA & PPDA stand out while others seem to be at the periphery and at the moment, there seems to be a big disconnect among the many Sector
Institutions, with no common thread and a clearly defined common goal/point of convergence as a sector. If the sector is able to articulate that binding product, then the sector institutions should know that they are linked to support each other to deliver the mandate of the sector. This strategic Investment plan has illustrated this link.
The consultations further point to the fact that there is a conflict of roles in some sector institutions, as some are doing the work of others either intentionally or inadvertently, leading to duplication of effort. In addition, some sector institutions feel and seem to fit better in other sectors.
On the other hand, the National Planning Authority is classified under the Public Sector Management sector despite the very close linkage between planning, budgeting, reporting, monitoring and evaluation. The current classification of NPA outside the accountability sector therefore disconnects the planning function from the budgeting and finance functions, which are expected to work together for better results/impact. As a result, some sectors and institutions don’t fully comply with planning and impact evaluation guidelines, while others do not have plans at all. In addition, many sector indicators do not measure actual outputs and outcomes but processes such as workshops and meetings attended/held, while targets are often set unrealistically and without clear basis and guidance from NPA. This has resulted in duplication of efforts, waste of resources and poor data quality.
Further, some Sector Institutions like the MoPS (Inspectorate) and MoLG (Inspectorate) report to the accountability sector yet their plans and budget are housed under the Public Sector Management sector. These institutions have no direct access to the accountability sector budget despite the fact that they belong to and work with the sector. There is also an overlap in other institutions like DEI, which reports to the Accountability Sector in terms of the Budget Framework Paper (BFP) but Public Administration in terms of the Ministerial Policy Statement (MPS). Managing constitutional
40 |
Accountability Sector Strategic Investment Plan 2017/18 - 2019/20
agencies and departments which belong to other sectors therefore presents a challenge of resource allocation and allegiance.
The accountability centres at local governments as envisaged under the ASSIP 2014-2019 have never been implemented. Except for the District Integrity Fora being promoted by the IAF in some districts, at the moment there is no clearly defined linkage between the accountability sector at the centre, and the local governments.
Further, the existence and operation of parallel structures within the accountability sector, e.g. PEMCOM, IAF, etc. has led to fatigue and duplication of effort and has weakened some structures like the Sector Working Group, Steering and Leadership Committee. Through the consultations, it emerged that for some key stakeholders, it is not clear how the coordination arrangements and roles fit together in the sector.
2.3.3 Staff and SkillsAlthough all the sector institutions have capable staff with the requisite skills, they have a human capital capacity limitation mainly manifested by the low staff numbers, which varies by institution. At the local Government level, it is estimated that the staffing levels go as low as less than 60%. In practice, many of the sector institutions are unable to perform their duties effectively and efficiently because they are understaffed and lack sufficient resources.
Although there has been commendable and considerable efforts in skilling the accounting cadre across the public sector with professional skills, less has been done for other disciplines like the economists and statisticians in the planning departments all over the country. Further, there are new disciplines such as Public Private Partnerships (PPP) that require highly skilled, specialised and knowledgeable negotiators if the country is to ever benefit from them. The absence of such specialised people may result in government missing out on key developments or losing a lot of money through PPPs due to the limited influence and experience in managing
PPPs. When a PPP fails, the blame is in most cases put on government. The human capital capacity limitation in government is therefore a national problem which requires both a national and sector strategy and solution.
In its current state the Secretariat for the Accountability Sector has less than 10% of the technical staff envisaged in the ASSIP 2014-2019 which limits the secretariat’s capability and capacity to undertake all its activities, especially its advisory role to the leadership and steering committee, and the sector working group.
2.3.4 SystemsThe sector and its institutions have taken advantage of the IT opportunities to automate their services and this has eased and quickened service delivery. Where applicable sector institutions have adopted government systems e.g. planning, budgeting, accounting, reporting, etc. Specifically, the sector institutions operate various inter and intra systems such as the IFMS, e-procurement, IPPS, PBS, etc. URA for example has robust systems and processes, that are used for revenue collection but they have also streamlined institutions and made them efficient. The systems in the sector were developed over time, others are being enhanced, while others are still under development.
The sector further embraced a participatory approach where it interacts and works with civil society and the private sector to champion reforms that have contributed to national development.
Effective monitoring and supervision of service delivery centres by responsible officers is very crucial for improving service delivery outcomes. Although undertaken by individual sector institutions, the sector has hardly had joint monitoring and supervision missions except the two regional accountability fora and joint annual reviews. To this end, the accountability sector joint annual reviews tended to focus more at institutional as opposed to sector performance. Impact evaluations are within the mandate of the National Planning Authority however, they are
| 41
Accountability Sector Strategic Investment Plan 2017/18 - 2019/20
rarely carried out partly due to Institutional fights.
The sector has no formally approved Monitoring and Evaluation framework and performance indicators, and monitoring and supervision at sector level is poor in both the central and local governments. The absence of clear monitoring and evaluation framework and systems means it is not clear what each sector institution is expected to contribute towards the attainment of the sector goals and objectives. Further, the inadequacy of the M&E framework denies the sector learning and useful information on policy implementation and best practices.
It is also noted that government (including the sector) monitoring is mainly post-mortem, which has favoured the emergency of scandals, e.g. Katosi Road, pension scam etc., hence the need to put emphasis on ex-ante and routine monitoring activities.
There is poor communication and coordination within and outside the sector institutions/departments e.g. internal and external audit in central and local government; etc. Further, public awareness of the accountability sector, its mandate, roles, activities, achievements and plans is still very low. The environment analysis also noted that the majority of the sector information on the various websites of sector institutions is in English hence covering a narrow target.
Civil Society Partnership with the sector: The increased appreciation and acceptance of Civil Society Organisations by the national and subnational governments has led to their gradual involvement, participation and adoption of citizens’ concerns in plans, budgets and service delivery. However, more effort is needed to harmonize and rationalize synergies and build stronger ties with civil society in planning, budgeting, accounting, monitoring and evaluation to benefit from the independence of non-state actors.
Development Assistance: Currently, the sector and sector institutions have a number of collaborative and supportive arrangements with development partners like Austria, DANIDA, DFID, EU, Germany (GIZ), IGC, IMF, Ireland, KfW, Netherlands, Norway, Sweden, Trademark EA, USAID and the World Bank. However, there is still low absorption of external financing and sometimes, Development Partners do not speak one voice, leading to duplication and less synergy in the implementation of accountability sector issues.
2.3.5 Financial ResourcesFunding to the accountability sector has increased by over 70% over the last four years, jumping from UGX556.610 Billion released in 2012/13 to UGX948.915 released in 2015/16 as illustrated in the chart below.
42 |
Accountability Sector Strategic Investment Plan 2017/18 - 2019/20
Figure 14: Accountability Sector Budget, Release and Expenditure
Like all sectors, the accountability sector is burdened with limited resources and unfunded priorities, both at sector and institutional level.
The table below illustrates some of the unfunded priorities in just one year, FY2017/18.
| 43
Accountability Sector Strategic Investment Plan 2017/18 - 2019/20
Sector Institution
Priority Output Narration
Cost (Billion
UGX)Ministry of Finance, Planning & Economic Development
Capitalization of Institutions and Financing Schemes
Capitalization of Uganda Development Bank is a strategy to provide long term financing for ease of access of credit aimed at private sector development
80
Government Buildings and Administrative Infrastructure
The additional allocation is to enable full operationalization of the Pilot Banana Plant. This will further business development and improve research and create market for produce of local farmers.
35
Policy, planning, monitoring and consultations
Following approval of the New Ministry Structure, there’s need for funding of the establishment through recruitment of staff and provision of adequate tools to enable smooth operations.
15
Accountability Sector Secretariat Services
The funding is required to strengthen the coordination of the Accountability Sector. This will help the Sector in coordination action geared towards achievement of the NDP and Sector targets.
2.628
Ethics and Integrity
Formulation and monitoring of Policies, laws and strategies (DEI)
When established, the Department of Religious Affairs (DRA), requiring 2.2bn; and the Leadership Code Tribunal will both enhance good morals in society.
5.500
Financial Intelligence Authority (FIA)
Ensure safety and integrity of FIA information (FIA)
Public Awareness programme of AML/CFT as required by the AML Act 2013; Capacity building programme for FIA and the accountable institutions UGX2Bn; International Cooperation engagements UGX2.34Bn
5.540
Auditor General Value for Money Audits (Auditor General)
In line with Article 63 of the 1995 Constitution, Objective 4 of the NDP II and Section 13 of the National Audit Act 2008, the office requires UGX12.718Bn to address the expanding audit scope and public demand for Value for Money as shown below: • Establishment of forensic investigations (UGX 5.343Bn);• Audit of Karuma and Isimba projects (UGX5Bn);• Audit of PPPs, Compensations and other special audits
(UGX2.375Bn)
12.718
PPDA Government Buildings and Administrative Infrastructure (PPDA)
This is part of the Project 492 in the NDP II (1225 – Support to PPDA) aimed at constructing an office block for PDA which will cater for the current and future office space needs of PPDA. This will go a long way in strengthening thecapacity of PPDA to deliver its mandate by providing adequate and conducive working environment for its staff and clients
Accountability Sector Strategic Investment Plan 2017/18 - 2019/20
At the moment, the sector secretariat gets a subvention from the Ministry of Finance however, there is no clear policy on resource allocation to the secretariat, which limits its capacity to facilitate and undertake joint sector activities e.g. regional sensitisation and consultative workshops, facilitating joint inspections, monitoring and evaluation. It is also observed that the continued funding of the sector secretariat solely by the Ministry of Finance may promote its allegiance to the MFPED at the cost of the other sector institutions, hence compromising its independence. It is therefore recommended that the sector secretariat should have a basket fund contributed to by all the sector institutions and where possible/available, development partners.
2.4 Opportunities and threatsThe following opportunities and threats were identified for the accountability sector to exploit and mitigate respectively.
Political environment: There is political willingness to fight corruption, coupled with the increasing global attention to accountability, transparency, anti-corruption, ethics and integrity. The regional integration within East Africa, Comesa, and the African Union also presents political, economic, social, environmental and legal opportunities and threats.
At the moment resource allocations are made to sector institutions as opposed to sectors, limiting the sector’s ability to negotiate and allocate resources to the agreed key sector priority areas. This is a disincentive to the Sector Wide Approach, with the potential to kill innovation, thinking and working together as a sector. In some cases, grants are discussed and agreed before going through the formal procedures and scrutiny, which end up overstretching the available capacity in the sector. All the same, there are acute funding shortages to sectors and sector institution priorities. For example, URA needed 300bn following a series of prioritizations until they could not prioritize any more, and this applies to other sectors and sector institutions.
There is a threat of the ever increasing pressure on financial resources and service delivery due
to the expanding cost of public administration. These need to be better managed to improve service delivery.
At the moment, there is limited inter-sectoral linkages, which situation denies sectors an opportunity to create and promote synergies. It is recommended that deliberate effort is taken to link the accountability sector with other sectors (local and international) and fully participate in their activities.
The unpredictability of Parliamentary Business is another threat the sector needs to mitigate, its effects mainly being the delayed discussion and passing or resolution of bills and reports. This also relates with the competing mandates in MDALGs which limit them from achieving their goals and subsequently, the sector and national goals. Bureaucracy in some government offices is also seen as a threat to the attainment of the accountability sector’s goals and objectives.
Economic environment: Because of the perceived delays by government in settling domestic suppliers, service providers have a tendency to overcharge government as they factor in the delay in payments. The sector therefore faces this threat and needs to mitigate it by among others ensuring that payments are made on time.
According to the Uganda manufacturer’s Association (UMA), manufacturing in Uganda is largely dominated by conversion of imported inputs to produce the products, necessitating a vast outflow of resources to acquire inputs. Manufacturing is also largely challenged by limited (load-shedding) and very expensive power supply i.e. the unit cost ranges between 13-15 US Cents while the competition in other countries pays between 3-5 US Cents per Unit. Further, the findings of a recent study by UMA shows that the manufacturing sector currently uses about 53% of the installed capacity, which is attributable to the above factors. These are threats the accountability sector must address in order to create an enabling environment for manufacturing, which in turn will increase employment, the tax base/revenue, economic growth and development.
| 45
Accountability Sector Strategic Investment Plan 2017/18 - 2019/20
Uganda’s manufacturing and trade industry continues to be dominated by a large informal sector, which makes it difficult to support, say by extending credit facilities, and at the same time mobilise savings and taxes from them. The Ugandan community is also still prone to a poor loan repayment culture, hence a threat to the accountability sector.
The above, coupled with the rising inflation, volatile exchange rate and low consumption levels present real threats to the accountability sector and nation at large.
Sociological factors: Uganda has one of the highest population growth rates in the World (3% in 2015) and a high fertility rate. In addition, a number of Ugandan youth are migrating from the rural to urban areas in search of greener pastures, many of whom end up providing motorcycle (boda-boda) transport services. There are still pockets of inefficiency through absenteeism and lack of vigilance by civil servants and local leaders, a threat that the accountability sector should mitigate as it promotes accounting for the utilisation of resources for effective service delivery.
Technology: Technology is fast advancing and keeping pace with its rapid advancement is increasingly becoming costly and challenging. Improvements in technology have presented better banking technology in the market and at the same time facilitated the rising rate of hackers and cybercrime among others, which has made institutions vulnerable to thefts and corruption. In fact, technology has aided the increasing complexity of corruption in the public and private sector. This strategic investment plan therefore aims to have a deliberate strategy to mitigate against the use of technology to negatively affect the delivery of the accountability sector mandate.
Natural Environmental: Uganda has tested and will soon be realising more revenue from oil, which is an opportunity for the sector and nation at large. In order to optimise this opportunity the country needs to develop and grow industries within/around the oil and gas value chain.
The country is also endowed with a variety of
natural minerals however, efforts to officially exploit them seem to be minimal. The mining of minerals presents another rich source of government revenue, and therefore their continued unofficial exploitation denies the country resources that would otherwise be utilised in service delivery. It is also estimated that the value of Uganda’s mineral deposits is far greater than the oil and gas value, hence the need to exploit this potential to boost domestic revenues, expedite and sustain economic growth and development. The wide gap between the value of minerals mined and exported is evidence of a revenue loss/leakage to the sector and nation. The sector needs to support further studies on these leakages and come up with watertight measures to prevent them.
Global warming is a big threat which has among others caused droughts and the changing/unpredictable weather patterns which have negatively affected food security. Further, Uganda is a landlocked country with a poorly functioning railway network, which in itself rises the cost of doing business. The sector therefore needs to provide for mitigation measures against the effects of these threats in its policies, strategies, plans and budgets.
Legal and regulatory environment: At the moment, the Sector Wide Approach (SWAP) is not well covered in the legal and regulatory framework yet sectors are expected to develop, discuss, agree and own plans, priorities, projects, budgets and reports; monitor and evaluate their performance; all of which are not adequately catered for in the legal framework. The Public Finance Management Act, 2015 only defines a sector and mentions the roles of the accounting officers, sectoral committees of Parliament and sector audit committees in budgeting and auditing. It was also observed that the legal regime for loan defaulters is non-supportive as there is always a rush for court injunctions.
Although there are still gaps, the sector institutions’ mandates, functions and policies are adequately covered in the legal and regulatory framework. There is also a fairly stable legal regime in the financial sector. As observed by
46 |
Accountability Sector Strategic Investment Plan 2017/18 - 2019/20
the Inspectorate of Government, 2011 Global Corruption Report, overall, Uganda’s anti-corruption legal framework is assessed as strong, but the country is still lacking effective implementation and enforcement of the rules in place.
Communication and public awareness: Although the Secretariat is supposed to provide
a central coordination role for public relations, awareness creation and education among the public, it has limited communicative capacity, which has led to the information gap hence wide public ignorance about government interventions in accountability matters. Specifically, the following communication strength, weaknesses, opportunities and threats were identified.
Table 11: Communication and Public Relations SWOT analysisStrength Weakness• Majority of the sector institutions have
communication/public relations officers;• The presence of a Secretariat to coordinate activities
of sector institutions;• The Secretariat has established an editorial team in
charge of sector bulletin and other communications matters;
• Goodwill from Finance ministry that has housed and funded the Secretariat;
• Absence of a communication specialist/officer at the Secretariat;
• Lack of a documented communication strategy for the Secretariat;
• Limited involvement of the Secretariat in the activities of sector institutions;
• Reactive communication within some sector institutions;
• Inadequate dissemination of information on sectoral activities;
• Poor communication and coordination within and outside the sector institutions;
• Low public awareness on accountability sector mandate;
• Misinformation on government accountability interventions; and
• inadequate budget for the communication function at the Secretariat and within sector institutions;
Opportunities Threats• Increased public interest in accountability issues;• Presence of the strategic investment plan (guides
implementation strategies/ funding tool)• Presidential Directive to institutionalize the
communication function within Government MDAs• Availability of free government airtime on some radio
and television stations • Technological advances that enable two-way
communication at minimal cost • Government Citizen Interaction Centre
• Minimal appreciation of the communication function in MDAs
• Negative perception of the public towards issues of accountability
• Lack of coherence within the sector institutions
2.5 Stakeholders and their expectations
The accountability sector has a number of stakeholders including but not limited to government ministries, departments, agencies and local governments; development partners;
civil society and private sector organisations; and the academia. The ASSIP review consultative process interviewed a sample of these stakeholders to understand their expectations of the accountability sector. In the table below, we summarise and present the stakeholders’ expectations in the various strategic areas.
| 47
Accountability Sector Strategic Investment Plan 2017/18 - 2019/20
Table 12: Stakeholders’ ExpectationsStrategic Area ExpectationResource mobilisation and allocation
• Inclusion of the Local Government Finance Commission (LGFC) to help in widening the tax base. There’s need to think outside URA and KCCA to enhance resources;
• Involve Civil Society Organisations in National budget processes for a stronger collective voice on pro-poor resource allocation and utilization;
Private Investment • Government should get out of business since it is not their primary role and they do not know how to do business;
• Make membership to sector associations mandatory as one of the ways to reduce the informal sector;
• Issuance and use of letters of credit as opposed to only having a contract as is the current practice;
• Private and public sectors should enhance working together;• Institute & Implement Local Content and BUBU policies
Access to finance • Lobby Government on behalf of UDB in increasing the level of capitalization of the Bank. Appointment of a link officer for the Bank;
• Source technical support grant for UDB;• Support UDB in sourcing training grant and opportunities for staff;• Establish and support microfinance institutions to increase access to financial
services countryside.• Promote the culture of saving in Uganda;
Audit and anticorrup-tion
• Value for Money Audits should be undertaken on all big projects to allow for effective monitoring of project implementation;
• The sector needs to widely disseminate reports (e.g. PPDA and OAG’s reports) and documents/instruments to enable proper resource utilization and planning.
• Take/confiscate properties of people who misuse public resources;Statistical data pro-duction
• Increase partnership between UMA/UBOS to work together on specific/demand driven studies e.g. a study on capacity utilisation, sunflower output in Uganda;
• The sector should largely recognize and make use of the statistics UBOS produces.
Insurance penetration • Create a critical mass to grow the insurance premiums, e.g. health insurance and Insurance of government assets e.g. government cars being a major one.
• Increase government funding for the insurance sector. • Enforcement of workers compensation. Many institutions are not insuring their
workers.• Sensitize the public on insurance.• Consulting IRA when key decision are made e.g. taxes• Provide incentives for the insurance industry e.g. supervision of markets.
Installation of IT systems.• Push the education system to appreciate and enforce insurance of students
through education bodies.• Sensitize the public country wide about the benefits of 3rd party insurance. Lack
of resources for sensitizing traffic Police Officers hinders them from looking for what they are actually supposed to look for while arresting culprits.
• Government entities should work together to implement workers compensation.
48 |
Accountability Sector Strategic Investment Plan 2017/18 - 2019/20
Strategic Area ExpectationSavings mobilisation • Break the NSSF requirement of compulsory registration for organisations with at
least 4 employees; to include all employers irrespective of staff numbers. This will widen savings and subsequently reduce interest costs;
Sector Management • Clearly define membership and the role of each accountability sector institution. Need to spot out the efficiency gain of sector institutions being in the sector.
• Focus on the accountability sector institutions and consult affiliated institutions where need arises.
• Sector Institutions should take charge of sector processes, speak as accountability sector and plan together.
• The sector needs to work as an ambassador for its institutions to promote institutional business.
• The sector should efficiently and effectively use the available resources to achieve its objective.
• Ensure that the leadership of the sector buys into the sector concept and owns the activities of the sector. Hold substantive members at different levels accountable and insist on their attendance of meetings. Minimise delegation of junior officers who cannot make decisions;
• Fully integrate FINMAP and other donors into the accountability sector activities;• The role of PEMCOM should be considered in the accountability sector
institutions;• Create a basket of funds for the support from DPs to streamline their funding to
avoid duplication. Share information with them;• Set the agenda accordingly and let general activities be discussed at the
SWG, Policy issues at Steering Committee level and Political decisions at the Leadership Committee level. Share the agenda well in advance;
• Promote inter sectoral linkages by connecting different sectors together. Let sectors buy in programmes that are inter linked. This should be done in liaison with the coordination unit under OPM;
• NPA should be co-opted as one of the accountability sector institutions;• Strengthen the coordination role and structure of the secretariat;
Communication and public relations
• The sector should identify, regularly publish and market its products/services and outputs within and out for the sector.
• The sector should sensitize the public on the mandate and activities of its institutions to increase awareness and confidence in the public.
• The sector should introduce and promote breakfast meetings and regular bulletins;
• Communicate and update membership regularly on what’s going on in the sector; • Improved level of coordination and communication within the accountability
sector;• Enhance effective communication and make the sector visible;• Increase access to simplified Budget Information;
| 49
Accountability Sector Strategic Investment Plan 2017/18 - 2019/20
Strategic Area ExpectationMonitoring, supervi-sion, inspection and evaluation
• Undertake regular annual performance reviews based on the ASSIP common result areas not institutions, and reporting should reflect performance of the sector;
• Need to strengthen and regularly carry out regional Accountability Sector forums;• The sector should conduct midterm review and ex-ante reviews of the ASSIP to
enhance the preparation of the subsequent sector strategic plan.• Need to harmonize inspection across government;
Sector Strategies • Come up with common sector vision, mission and strategic objectives and focus on sector outcomes. Ensure these attract sectors institutions to sector;
• Identify and focus on 3 – 4 issues as priorities to be undertaken by the sector for a given time period;
• Leave/avoid institutional mandates and objectives to the Ministerial Policy Statements;
• Come up with a strategy that covers the entire planning and budgeting process and aligns donor funding to the ASSIP and NDP II;
• The sector should focus on improving service delivery. Come up with innovative ways of improving service delivery;
• The sector should be able to discuss challenges and come up with lasting solutions;
• Come up with clear and defined sub themes;• Address the existing loopholes in the policies and laws;• Accountability Sector should be able to oversee other sectors;• Need to identify human resource capacity gaps in the sector;• The sector should have strategic partners;
Sector planning and budgeting
• The sector institutions should proportionately contribute resources to focus and fund secretariat activities;
• There should be alignment of DPs activities and institutional work plans with the Accountability Sector Investment Plan (ASSIP);
• Come up with a strategy to enhance integrated planning units in MDALGs;• Allocate more resources to inspections;• Strengthened the capacity of the Development Committee (DC);
50 |
Accountability Sector Strategic Investment Plan 2017/18 - 2019/20
Strategic Area ExpectationSecretariat for Ac-countability Sector (SAS)
• The secretariat needs to benchmark from other sectors like JLOS;• Interact more with accountability sector projects such as SUGAR, FINMAP, GAPP,
PoAT;• The secretariat should be strengthened to effectively undertake the coordination
role;• Keep the two chairs of the Donor PFM and Accountability on the invitation/
mailing list;• Share agenda for the monthly meeting in advance, for the DPs to choose who to
attend;• Add value to the sector outputs/outcomes and not just consolidating;• Get the most out of the coordination and advisory function by addressing
accountability issues as expected from the masses;• Draw a calendar for different levels of management so that the dates are booked
off. The Secretariat retains the role of reminding them.• Follow up on what is discussed and provide feedback;• Mobilize resources to implement sector activities;• All heads of the SI should own and participate in the sector activities;• Regular meetings with heads of institutions should be held;• Regularize leadership and steering committee meetings;• Have regular regional forums; and• Conduct joint activities to minimize duplicity and fatigue;
| 51
The strategic direction covers the accountability sector’s vision, mission, goals, objectives, core values, critical success factors, strategies and tactics to be employed in order to effectively and efficiently deliver its goals and objectives.
3.1 Strategic Intent
3.1.1 Vision The Accountability Sector’s vision is “Transparency and accountability in public service delivery”
3.1.2 MissionThe mission of the Accountability Sector is to promote efficiency and effectiveness in mobilization and utilization of public resources.
3.1.3 GoalThe Accountability Sector’s goal is to achieve a transparent, responsive and accountable public sector that delivers value for money services.
3.1.4 ObjectivesAs per the NDP II, the Accountability Sector is composed of two subsectors i.e. Audit; and Economic and Financial Management Services with a number of objectives. The ASSIP review process categorised the sector objectives under each of the four thematic areas as illustrated below.
5. Increase national savings to GDP ratio;6. Increase the level of capitalisation and widen
investment opportunities in the capital markets;
7. Improve statistical data production and policy research; and
8. Protect financial systems and the broader economy from the threats of money laundering and the financing of terrorism.
Resource Mobilisation and Allocation Objectives9. Increase the tax to GDP ratio;10. Improve public financial management and
consistency in the economic development framework6
Budget Execution and Accounting Objectives11. Enhance public contract management and
performance;
Audit and Anti-Corruption Objectives12. Improve compliance with accountability rules
and regulations;13. Enhance the prevention, detection, and
elimination of corruption;14. Increase public demand for accountability;15. Improve collaboration and networking
amongst development institutions;
3.1.5 Core valuesThe accountability sector core values include Integrity, Honesty, Transparency, Accountability, Professionalism, Commitment, Teamwork, Gender equality and equity.
3.0 Strategic Direction
6 This objective is shared by both the resource mobilisation and allocation; and the budget execution thematic area.
52 |
Accountability Sector Strategic Investment Plan 2017/18 - 2019/20
3.1.6 Critical Success FactorsThe following factors are considered critical for the success of the accountability sector. • Adopting a consultative and consensus based
approach to strategy and policy development and implementation;
• Agreeing the strategic priorities and mobilising resources as a sector, and leading by example in planning, budgeting, execution, reporting, monitoring and evaluating the utilisation of public resources; and
• Accomplishment of the sector objectives;
3.2 Strategies During the three years strategy implementation period, the accountability sector intends to achieve three main outcomes which correspond with the thematic areas i.e. “sustainable macroeconomic stability” for the economic management thematic area; “fiscal credibility and sustainability” for the resource mobilisation and allocation thematic area; and “value for money in the management of public resources” for the budget execution and accounting; and audit and anticorruption thematic areas. The following sections present the strategies to be deployed to achieve the objectives and outcomes for each of the thematic areas.
3.2.1 Economic Management StrategiesThe Economic Management thematic area seeks to achieve sustainable macroeconomic stability as its main outcome. This section presents the strategies that will be pursued for each of the objectives of increasing access to finance; increasing private investments; reducing interest rates; increasing insurance penetration; increasing national savings; and increasing the level of capitalisation and investment opportunities in the capital markets.
The following strategies aimed at increasing access to finance and reducing interest rates will be pursued:1. diversify and promote financial products and
services that are tailored to the needs of the population;
2. establish commonly accepted, industry-wide curricula and mandatory certification for professional banking staff;
3. strengthening financial literacy programmes and financial consumer protection;
4. promote e-Payments and e-Banking; 5. develop a regulatory framework for protection
of consumers of financial services;6. focus on availing medium to long-term
development finance by capitalising UDBL through issuing treasury bonds and corporate bonds; lobbying for increased budget allocation to UDBL and sourcing funds to help UDBL upgrade its core banking system; and conceptualising and presenting recapitalising proposals for potential fund managers;
7. Establish the Sharia Board to operationalize Islamic Banking and finalise the amendment of MDI Act 2003 to provide for Islamic Banking; roll out Islamic and Agency Banking; develop and implement a regulatory policy and supervisory framework for the implementation of Tier IV Microfinance & Money Lender’s Act 2015; operationalize the Uganda Micro finance Regulatory Authority (UMRA); capitalise micro-finance institutions; fast-track the establishment of an asset reconstruction company; fast-track the establishment of Uganda mortgage re-financing company; expand the agricultural insurance products; reform the banking sector to separate bank regulation and consumer protection; and target interest rates similar to those in comparable trading partners in the EAC region.
8. Review the current financial institutions regulatory and policy frame work to enhance financial inclusion by amending the micro-finance deposit taking institutions Act; finalising the financial institutions Act regulation; finalising the tier 4 microfinance institutions and money lenders Act regulation; and developing a national financial sector policy and strategy;
| 53
Accountability Sector Strategic Investment Plan 2017/18 - 2019/20
9. Nurture the capacity of micro and small enterprises to be able to access credit by preparing bankable projects;
10. Leverage on securities/capital markets for raising capital by government issuing infrastructure bonds through security markets; developing capacity of local companies to list on the stock exchange market through IPOs; and developing capacity of the market intermediaries;
11. Leverage domestic resources to attract Private Capital using PPP and Financing for Development approaches by building government capacity to structure and manage PPP projects; and partnering with private sector to develop Special Purpose Vehicles (SPVs) for priority investment projects;
12. Reduce barriers to setting up and doing business by establishing a one stop centre and integrating management information systems of URA, URSB, UIA, Immigration, KCCA, Ministry of Lands, NEMA, NIRA, UNBS e.tc.;
13. Liberalise the pension sector by fast-tracking the Pension Liberalisation Bill;
14. Strengthen the CRBS and develop a collateral registry to reduce default rates and increase the pool of new borrowers;
15. Integrate data systems for TIN, National Identity Card, Uganda Registration Services Bureau and Utilities etc.
16. Limit government domestic borrowing;17. Implement the bankruptcy reform legislation
to boost commercial banks’ willingness to lower their lending rates and improve loan recovery; and
18. Create specialized funds at low interest rates targeting NDPII prioritized areas and channelled through Uganda Development Bank Limited (UDBL) and Uganda Development Corporation (UDC);
The following strategies aimed at increasing private investment shall be pursued:1. Improve investment climate by reviewing
policies relevant to investment climate; implementing policy recommendations arising out of Presidential Investor Round Table (PIRT) and Presidential Economic Council (PEC); fast tracking the establishment of online registration (e-registry) of business licenses;
2. Facilitate the linkage of FDIs that require local partnerships with the local business firms e.g. through web portals; e-marketing of companies in FDI target markets; inward and outward missions; developing a local business firms’ data base with their respective profiles (investment interests, legal status & contacts);
3. Make industry association membership mandatory as one of the ways to reduce the informal sector by developing the policy on mandatory association membership; identifying the Industry Associations; and piloting the policy under the leadership of PSFU.
4. develop and enhance a network of serviced business, science, technology and industrial parks by working in partnership with private sector developers to implement infrastructure development in all industrial and business parks through PPP; establishing a land bank to assist investors to access industrial land for agricultural and industrial investment; and developing relevant public infrastructure and utilities in industrial parks using funding from government consolidated fund and other sources.
5. Avail medium to long-term development finance.
6. Strengthen the implementation of strategies to increase investor confidence;
7. Enhance the Private and public sectors to work together; and
8. Put in place strategies for monitoring funds coming into and leaving the country;
54 |
The following strategies aimed at increasing insurance penetration will be pursued:1. Create a critical mass to grow the insurance
premiums by developing and implementing a National Policy on insurance to provide appropriate guidance on insurance of government assets e.g. cars, and insurance in key sectors of the economy such as agriculture; fast-tracking the implementation of the National Health Insurance Scheme and developing systems to ensure operational efficiency; enforcing of workers compensation; and engaging the education system to appreciate and promote insurance of students through education bodies.
2. Increase public awareness in the Insurance Industry by developing and implementing a sector-sensitive financial literacy program; sensitizing the public on insurance e.g. about the benefits of 3rd party insurance, etc.;
3. Increase government involvement and funding to the insurance sector by securing financial back up from government on awareness and sensitization programs; promoting active engagement with government, IRA and other key stakeholders when key decision are being made e.g. taxes that effect the insurance industry; fast-tracking the review of the IRA Act by Parliament; providing incentives for the insurance industry e.g. supervision of markets, installation of IT systems etc.
The following strategies aimed at increasing domestic savings will be pursued:1. Improve regulation and supervision of the
Retirement Benefits Sector by reviewing the regulatory framework to widen coverage of the informal and formal sectors, and for the informal sector to come together and save by breaking the NSSF requirement of “compulsory registration for organisations with at least 4 employees” to include all employers irrespective of staff numbers; fast-tracking the implementation of the pension sector reforms to attract more institutional investors e.g. the passing of the Pension Act Amendment Bill; and the Retirement Benefit Sector Industrialisation Bill;
2. Reform the regulatory framework in the retirement benefits sector to enable long term saving by introducing pension pay-out options and investment products such as annuities.
3. Transform the public service pension into a savings contributory scheme.
The following strategies aimed at increasing the level of capitalisation and widening investment opportunities in the capital markets will be pursued:1. Improve access to long term finance to
the public and private sector by revising and amending the legal and regulatory frameworks for capital markets to ease issuance of securities, eliminate duplicative procedures and allow for innovation and product development; conducting Corporate Governance training for private sector to spread its benefits to businesses including listing on stock exchange.
2. Structural reform: Impose mandatory listing for companies in specific and strategic sectors by lobbying government to institute policies that require the listing of companies where government still holds shares and Tier 1 banks, telecommunication companies, insurance companies and large energy companies.
3. Create access to government bond markets in the primary market and widen participation by improving debt market operations and increase trading of government securities in the secondary markets.
4. Widen investor base by undertaking aggressive investor education on the benefits of raising capital through capital markets; and remove tax disincentives in order to encourage companies to raise capital and list on the main or growth markets. (E.g. remove withholding tax on bonds of five years and above;
5. Modernize the stock market trading system by developing a single integrated trading, settlement and payment system;
Accountability Sector Strategic Investment Plan 2017/18 - 2019/20
| 55
Accountability Sector Strategic Investment Plan 2017/18 - 2019/20
6. Develop a mechanism for local credit rating;7. Introduce long term infrastructure bonds;8. Introduce the growth enterprise market
segment on the Uganda security exchange;The following strategies aimed at improving statistical production and policy research will be pursued:1. Strengthen Partnership between UBOS and
other sector institutions to generate quality statistics by among others undertaking an assessment and prioritization of user needs;
2. Increase demand and usability of statistics by undertaking surveys and censuses and increasing data and research findings dissemination;
3. Strengthen data development and management in the National Statistical System by among others strengthening administrative data systems for statistics;
4. Develop and enhance data quality assurance systems;
5. Introduce measures to strengthen statistical coordination and capacity for management of statistics;
6. Introduce measures to support Institutional capabilities to carryout policy Research by undertaking assessment and prioritization of capacity needs; continuing to conduct research that is effective and relevant to NDP II; enhancing capacities to deliver quality Research; continuing to consolidate the technical/policy support to Government MDAs; increasing data & research findings dissemination; and utilisation of massive data collected by UBOs to inform policy oriented research;
The following strategies aimed at protecting financial systems and the broader economy from the threats of money laundering and the financing of terrorism and proliferation, thereby strengthening financial sector integrity and contributing to safety and security, will pursued:
1. enhance integrity, transparency and effectiveness of the financial and non-financial businesses and professionals to detect, disrupt, prevent and report financial crimes;
2. strengthen and develop legal framework and instruments to prevent and combat Money Laundering and Terrorism Financing;
3. improve Analysis, information sharing and collaboration with law enforcement agencies/accountable institutions to support prosecution and confiscation of proceeds of crime generated by ML/FT activities;
4. enhance Anti-Money Laundering Regulatory Oversight and Enforcement
5. enhance public awareness in matters related to money laundering and CFT;
6. undertake studies to identify typologies and impact of ML/CFT on the economy such as Trade-based Money Laundering domestically and abroad and corruption;
7. support Anti-Money Laundering Capacity Building Programme for the FIA and accountable institutions in the area of ML/FT;
8. target control of cross border Flow of Illicit Bulk Cash Out of the country;
9. enhance international cooperation; and10. strengthen Monitoring and Evaluation to
improve how to measure Progress and report outcomes;
3.2.2 Resource Mobilisation and Allocation Strategies
The Resource Mobilisation and Allocation thematic area seeks to achieve fiscal credibility and sustainability as its main outcome. This section presents the strategies that will be pursued for each of its objectives of increasing the tax to GDP ratio; and Improving public financial management and consistency in the economic development framework, focusing on Debt Management, Budget Credibility and Public Investment Management.
The following strategies aimed at increasing the tax to GDP ratio will be pursued:
56 |
1. Develop and implement a policy on mandatory association membership for informal sector players. This will involve developing the strategy for implementing the policy; piloting the implementation of the policy; conducting stakeholder’s engagement; and simplifying procedures for tax administration. This will be supported by a comprehensive tax education strategy that includes all stakeholders.
2. Build strategic partnerships with other government agencies and integrate e-tax. This will involve reviewing the existing initiatives; developing linkages with utility agencies and government; information sharing and effective communication; reviewing the existing internal processes; identifying the linkages and ensuring alignment; including the LGFC to widen the tax base; integrating the URA IT system with other systems say IFMS, IPPS, NWSC, UMEME , NIRA; creating a legal mechanism for registering businesses; developing guidelines and criteria for registration; standardizing the processes of business registration; and encouraging registration of businesses by respective associations;
3. Making National Identity mandatory for all government services such as medical, water, electricity, passport, salary, supplies, taxes, bank loans etc. This would reduce requirement of reregistration in different government bodies, it would support ensuring accuracy of the tax register and thus expansion of the tax base. Promote automated linkage of all government databases.
4. Strengthen the capacity of relevant staff in critical functions of revenue management, audit, forensics, investigations, legal affairs, data analysis and risk management among others. This will also include development of a mechanism for exploiting capital gains tax; mop out the informal sector; and enhancing TREP;
5. Develop and implement an integrated national revenue strategy, coordinate all
the stakeholders; this would include all government bodies and their respective contribution to revenues.
6. Trade facilitation through extension of the Electronic Cargo tracking to the region, implementation of the Electronic Single Window, increase of the Authorised Economic Operators (AEOs) and enhance the Single Customs Territory (SCT) activities.
7. Link the local budget advocacy to National budget processes for stronger collective voice on pro-poor resources allocation and utilization. We’ll Conduct research to ascertain how much citizens tax contribute; and strengthen the oversight institutions and local advocacy groups; and
8. Combating international tax evasion schemes in complex sectors to raise more tax e.g. corporate tax;
The following strategies for Improving public financial management and consistency in the economic development framework with a focus on Budget Credibility and Public Investment Management and Debt Management shall be pursued.
Budget Credibility and Public Investment Management1. Strengthen budget planning and prioritization
across sectors by establishing a mechanism to ensure that Sectoral plans are consistent with NDP; synchronizing the national budget and the sector budget; and fully operationalizing the Programme Based Budgeting;
2. Enhance budget consultation at national level through enhancing participation in the budgeting cycle;
3. Enhance budget analysis, monitoring and evaluation through building capacity and supporting continuous professionalization of economic management cadre across government and partner institutions in planning, budget analysis; conducting budget monitoring; and implementing the recommendations of budget monitoring;
Accountability Sector Strategic Investment Plan 2017/18 - 2019/20
| 57
4. Strengthen the Sector Wide Approach (SWAp) through Multiannual Budgeting; coordination between MoFPED and sector working groups; empowering sectors to allocate resources to sector priorities; strengthening the legal framework on SWAp; developing a national coordination strategy for proper management of the budget; and operationalizing the contingency fund;
5. Strengthen the capacity of PAP department to spear head the preparation of bankable projects and build the capacity of MDALGs to prepare and manage projects. This will involve conducting a capacity needs assessment to identify gaps and come up with recommendations; establishing a centre of excellence in public universities in public investment management; filling up the approved structure of the department; and training staff both short and long term;
6. Establish a project facilitation fund and develop guidelines for management of the fund;
7. Establish a data base for the existing bankable projects and assess the capacity of the existing systems for incorporation of the data bank; conduct a feasibility study of proposed projects of the sectors and identify those which should be included in the PIP; and set up a data base of bankable projects
8. Introduce measures to strengthen the capacity of sectors to prepare, implement and monitor bankable projects;
9. Leverage domestic revenue through use of PPP and Financing for Development approaches;
Debt Management1. Develop a well-functioning and vibrant
domestic financial market through awareness creation on the financial market; reduce on domestic borrowing; and simplifying the process of auction;
2. Ensure borrowing at the lowest costs by building the capacity to negotiate loans;
conduct analysis of loan terms; developing a risk assessment strategy; streamlining the process map on approval; and reengineering the processes;
3. Ensure debt sustainability though carrying out debt sustainability analysis periodically; new borrowing is in line with the threshold; and carrying out regular debt monitoring;
3.2.3 Budget Execution and Accounting Strategies
The Budget Execution and Accounting thematic area contributes to the outcome of achieving value for money in the utilisation of public resources. This section presents the strategies that will be pursued for each of its objectives of improving public financial management and consistency in the economic development framework and enhancing public contract management and performance.
The following strategies for Improving public financial management and consistency in the economic development framework with a focus on accounting policy standards and PFM Systems shall be pursued.
Accounting Policy Standards1. develop a roadmap for implementation of
IPSAS accrual basis of accounting and develop a policy framework for accounting and reporting on non-current assets;
2. continue sensitisation of stakeholders on the PFM Act 2015 and PFM Regulations 2016 and develop Treasury Instructions and operational guidelines to guide government entities in the application of the provisions of the legislation;
3. continue harmonising the PFMA 2015 and PFMR 2016 with other laws particularly the Local Government Act and related LG financial and accounting relations;
4. support public corporations and state enterprise in transitioning to the Government financial reporting calendar to ease consolidated reporting on government performance;
Accountability Sector Strategic Investment Plan 2017/18 - 2019/20
58 |
Accountability Sector Strategic Investment Plan 2017/18 - 2019/20
5. strengthen the Treasury Inspectorate function with standard procedures and capacity development in order to effectively carry out its function;
6. ensure comprehensive capture, and appropriate all donor funds including grants and loans to facilitate consolidated management of all public resources;
PFM Systems7. focus on PFM system integration and
security enhancement in Central and Local Government entities, build technical capacity to sustain these systems in terms of both infrastructure and human resource;
8. strengthen the security of the system and adopt new practice such as e-cash to minimise opportunities for fraudulent practices and improve efficiency in public financial management;
9. finalize extension of IFMS Fixed Assets Management module to remaining CG sites;
10. implement recommendations arising from the NITAU system integration study e.g. The rolling out of 29 Local Governments onto IFMS Tier I;
11. extend the Treasury Single Account to cover Local Governments, Externally Financed Projects, and any remaining entities;
12. ensure Board of Survey recommendations are implemented and also ensure up to date registers of assets and investments are maintained to safeguard public money and assets;
13. continue rolling out the IFMS to the remaining LGs and enhance security of the automated system;
14. implement Oracle Payments function to all IFMS sites;
15. integrate with mobile money platforms (e-cash) to minimize cash requests for activities such as workshops and enhance accountability for advances;
16. finalize the implementation of CEMAS in Makerere University and Makerere University Business School and activating of IFMS and Program Based Budgeting System (PBS) at eight (8) PUSATIs;
17. develop an interface between IFMS, PBS and DMFAS to reduce duplication of work and improve data quality;
18. enhance the data centre through the implementation of a roadmap for ICT infrastructure to support the increasing demand from PFM systems;
19. implement Oracle Governance Risk and Compliance (GRC) tools and the Database Firewall Audit Vault to enhance system security and quality assurance;
20. continue with professional certification sponsorship and capacity building for accountants, procurement and stores staff at Treasury and MALGs;
21. build the capacity of the sectors to estimate their cash projections accurately; develop systems for effective cash management; and develop a policy for effective cash management;
The following strategies aimed at enhancing public contract management and performance will be pursued:1. Finalize development of the implementation
strategy for the National Public Sector Procurement Policy;
2. Undertake spending surveys in selected Government entities to inform public procurement policy;
3. Increase transparency and accountability in public procurement by acquiring, piloting and rolling out e-government procurement system; enforcing the implementation of blacklisted firms; engaging non-state actors in contract monitoring; implementing e-procurement and establishing a monitoring system for high value contracts in the NDPII; reviewing and updating public procurement complainant handling mechanism;
| 59
Accountability Sector Strategic Investment Plan 2017/18 - 2019/20
developing and disseminating contract management manual; disseminating contract information to all stakeholders including beneficiaries; and supporting PPDA to create a local chapter of procurement professionals.
4. Strengthen the capacity of MDALGs and non-state actors in contract management and performance by conducting training of users in contract management across government entities; establishing a monitoring system and tools for contract monitoring; developing and implementing a mechanism for obtaining feedback on contract performance; creating and updating a database of contracts being implemented in MDALGs; and supporting OAG and PPDA to conduct joint planning for Auditing of high spending entities/sectors.
5. Sponsor staff for professional development and pursue partnerships with the Professional Institutes to build capacity.
6. Expedite the approval of the Institute of Procurement Professionals of Uganda Bill and thereafter, support the institute to oversee procurement professionals in Uganda in promotion of integrity and ethical practice as a fight against corruption and malpractice in public expenditure management.
7. Strengthen contract monitoring, reporting mechanisms and follow-up audits and recommendations by disseminating monitoring findings to all relevant stakeholders; and
8. Develop a National Local Content Policy/legal framework;
3.2.4 Audit and Anticorruption StrategiesThe audit and anticorruption thematic area contributes to the outcome of achieving value for money in the utilisation of public resources. The following strategies will be pursued for each of its objectives of improving compliance with accountability rules and regulations; enhancing the prevention, detection and elimination of corruption; increasing public demand for accountability; and increasing collaboration and networking amongst development institutions.
The following strategies for improving compliance with accountability rules and regulations with a focus on inspection and audit will be pursued:
Inspection and enforcement1. streamline and strengthen inspection function
in the sector by developing a framework to support joint inspections; reviewing and updating inspection tools; building the capacity to conduct joint inspections; reviewing and updating the performance assessment and reward systems;
2. strengthen the capacity to effectively monitor and enforce compliance by building the capacity of Accountability institutions to conduct compliance inspections; providing tools and equipment to conduct compliance inspection; disseminating accounting rules, laws and regulations; and supporting OAG to conduct compliance Audits;
3. strengthen the enforcement of the regulatory framework and service delivery standards by conducting the national service delivery survey; supporting institutions to develop and implement service delivery standards; monitoring compliance with service delivery standards; sensitize the public/citizens on service delivery standards; and supporting accountability institutions to development and implement client charters;
4. Ensure follow up and implementation of recommendations made by oversight institutions by conducting joint quarterly follow-up on recommendations; sensitization meetings for political leaders to follow-up and advocate for implementation of oversight recommendations; providing technical support to districts, PAC and audit Committees on management of Audit reports;
Audit1. Introduce measures to improve timeliness,
audit coverage and quality reporting by recruiting additional staff and providing
60 |
Accountability Sector Strategic Investment Plan 2017/18 - 2019/20
equipment to increase audit coverage; conducting trainings to improve audit reporting; and follow up on the recommendations by Accounting Officers for purposes of reappointment by PS/ST on the advice of IAG.
2. Develop a risk management strategy across Government to help mitigate the risks and improve on efficiency and effectiveness of reporting by the IAG and other offices;
3. Strengthen the Value for Money (VFM) audit functions by supporting Parliament to clear the backlog of VFM audit reports; building the capacity of Audit institutions to undertake VFM to increase audit coverage; and conducting key actors on value for money audit (Parliament, end users and beneficiaries);
4. Strengthen IAG office in conducting IT and performance audits in specialized areas;
The following strategies aimed at enhancing the prevention, detection and elimination of corruption will be pursued:1. Strengthen the enforcement of the existing
legal framework by reviewing and harmonizing the policy, legal and organizational framework to fight corruption; and creating awareness on the existing framework;
2. Strengthen the capacity of investigation and prosecution function by undertaking compliance investigations; building capacity to conduct investigations and gather intelligence; providing equipment and tools and supporting the media to conduct investigative journalism; building capacity of MDALGs to establish internal mechanisms to resolve complaints at source; and supporting IG to conduct systemic interventions;
3. Strengthen the ombudsman function by conducting boardroom sessions to resolve ombudsman issues;
4. Strengthen Ethics and Integrity functions by designing programmes to strengthen the
ombudsman function to safeguard the rights of individuals against maladministration, abuse of power or office by the public authorities; and developing policies and systems for fighting corruption across MDALGs;
5. Expeditiously draft the Zero Tolerance to Corruption Policy to scale up the war against corruption in Uganda. This policy will foster the effective coordination of efforts to eliminate corruption in all sectors of the economy, and ensure the participation of the public.
6. Establish and operationalize the Leadership Code Tribunal that will sanction and punish errant leaders in public office.
7. Monitor the implementation of recommendations of Inspectorate of Government.
8. Strengthen Anti-corruption Interagency Forum (IAF) activities in the fight against corruption;
9. Strengthen the District Integrity Promotion Forums (DIPFs) to enhance accountability and effective service delivery at Local Government level;
10. Strengthen the capacity of oversight function to effectively detect, investigate, report and prosecute corruption cases;
11. Design and implement capacity building programmes for DEI to engage and fully coordinate ethics and integrity issues in Uganda;
12. Strengthen the human resources capacity of the DEI to effectively execute its mandate (operationalize the new DEI Structure); and
13. popularise and inculcate of the National Ethical Values among the youth to curb the escalating levels of immorality;
The following strategies aimed at increasing public demand for accountability will be pursued:
| 61
1. strengthening the capacity of the public to demand for accountability by developing, disseminating and implementing national service delivery standards, client charters and citizen engagement framework; training the community to use social accountability tools (Community Score Card);
2. training and supporting the community to monitor development programmes; and building the capacity of CSOs to monitor budget implementation and performance;
3. promoting active communication between implementers of programmes and the public by building CSOs’ capacity to detect and report corruption and anti-money laundering; sensitizing the population on government projects; and developing and implementing information sharing protocol;
The following strategies aimed at improving collaboration and networking amongst development institutions will be pursued:1. Strengthen capacity for intra and inter-
sectoral collaborations, partnerships and networks in the fight against corruption and money laundering by identifying and mapping up appropriate collaboration opportunities with Audit, Ethics and Anti-Corruption Institutions at Regional and International levels; developing and implementing a collaboration framework;
2. Strengthen the collaboration between the government and faith based/religious organisations to enhance their participation in the fight against corruption and other offshoots of moral decadence; and
3. Strengthen the collaboration between CSOs, Media and Government in the fight against corruption (Anticorruption Public Private Partnership Collaboration framework);
3.2.5 Communication and Public Relations Strategy
The overall goal of this communication strategy is to increase public understanding and demand for accountability. The objectives of the strategy are to:1. strengthen the accountability secretariat and
the sector’s communication capacities; 2. improve public awareness of the
accountability sector and its mandate;3. strengthen the accountability sectors
engagement with key stakeholders; and4. promote timely, balanced and accurate
reporting about the government accountability interventions;
The key strategies to be deployed to achieve the communication goals and objectives include partnership and networking; media relations; social mobilization; internal communication; branding; and public relations as illustrated in the table below.
Accountability Sector Strategic Investment Plan 2017/18 - 2019/20
62 |
Accountability Sector Strategic Investment Plan 2017/18 - 2019/20
Table 13: Communication Strategies, Activities and ChannelsNo. Strategy Activity Target Audience Channels/Tools1. Partnerships &
Networking(Harness synergies, comparative advantages from stakeholders and enable sharing of information)
• Breakfast meetings with key stakeholders
• Institution visits /Study tours/benchmarking
• Regional Accountability forums
• Joint sector reviews
• Development Partners• Parliament• Civil society organizations• Ministries, Departments and
Agencies• Local Government• Media • Faith based leaders and
cultural leaders• Community leaders
• Workshops• Bulletins• Newspaper articles/
supplement• Magazines, Talk shows(TVs &
radios)• Websites
2. Social Mobilization(Will empower citizens with information and opportunity to demand for better service delivery)
• Sensitization workshops
• Regional accountability forums
• Public information programs
• Corporate Social Responsibility (CSR)
• Citizenry• Academia• Opinion leaders• Local Governments• Lower Local Governments,• CSOs, NGOs, CBOs and
FBOs• Parliament• Media• Schools• RDCs
• Barazas• Talk shows (radios and TVs)• Information, Education and
Communication (IEC) materials like posters, fliers, brochures, T-shirts, Caps,
• Face book and Twitter, whatsapp groups, SMS
• Accountability ambassadors• Exhibitions and Education
Fairs• Public service announcements
3. Media Relations(Will enable building and maintaining relationships with the media and regular flow of information to the public)
• Media skills training
• Media Boardroom Sessions
• News conferences
• Media tours
• Media owners• Editors • Reporters• Talk show hosts• Prominent callers • Uganda Media Centre• Bloggers
• Press releases,• Media kits• Newspaper supplements• Radio and Television programs• Media interviews• Opinions/Editorials
4. Public Relations (Will facilitate two-way communication with stakeholders and increase public access to information about sector institution mandates)
• Corporate Social Responsibility
• Accountability Week
• Participation in national events
• Top management • Technical staff • Sector working group• Steering committee• Leadership committee
• Advertising • Events • Exhibitions and education fairs• Blood donation drives• Documentaries • Policy briefs• Fact sheets • Information packs• Billboards• Posters• School outreach• Social media (YouTube, Twitter,
Facebook)• Website
| 63
Accountability Sector Strategic Investment Plan 2017/18 - 2019/20
Institutional Arrangements for Implementing the ASSIP
| 65
As earlier observed, the accountability sector has well-defined management structures covering the leadership committee, steering committee, sector working group and a secretariat housed at the Ministry of Finance Planning and Economic Development, and 20 sector institutions. The following strategies for enhancing the functionality of these management structures will be pursued.
4.1 Leadership CommitteeThe Leadership Committee is the top most organ of the accountability sector, providing political guidance and direction to the sector. The Committee is chaired by the Minister of Finance Planning and Economic Development and its composition shall be enhanced to include the Governor Bank of Uganda. The full membership shall thus be as follows.1. Minister of Finance, Planning and Economic
Development;2. Minister of Ethics and Integrity;3. Minister of Public Service;4. Minister of Local Government;5. Minister for Kampala;6. Governor Bank of Uganda;7. Inspector General of Government;8. The Auditor General; and9. The Permanent Secretary/ Secretary to
Treasury;
The detailed roles of the leadership committee are to provide strategic direction to the sector; guide policy formulation for the sector; articulate sector vision and develop policy at Executive and Legislature levels; oversee the development trend of the Accountability Sector; provide political leadership and support; promote highest standards of accountability to key stakeholder groups; promote sectoral coordination and filter accountability systems among the political echelons.
The Leadership Committee shall meet quarterly, of which two of the meetings will be held jointly with the Steering Committee. The Leadership committee shall be served and facilitated by the Secretariat for the Accountability Sector.
4.2 Steering CommitteeThe Steering Committee shall be responsible for formulating sector policies, coordinating, quality assurance and mobilising resources for the implementation of the Accountability Sector Strategic Investment Plan.
In order to be fully representative, the membership of the Steering Committee shall be enhanced by including the Chief Executives of the Sector Institutions that have hitherto not been represented. The full membership shall thus be as follows.
4.0 Institutional Arrangements for Implementing the ASSIP
66 |
Accountability Sector Strategic Investment Plan 2017/18 - 2019/20
1. Secretary, Inspectorate of Government;2. Secretary, Directorate for Ethics and
Integrity, Office of the President;3. PS, Ministry of Public Service; 4. PS, Ministry of Local Government;5. Commissioner General, Uganda Revenue
Authority6. Under Secretary/Accounting Officer;
MOFPED 7. Accountant General8. Assistant Auditor General – Corporate/
Accounting Officer9. Executive Director, Public Procurement and
Disposal of Public Assets Authority10. Executive Director, Uganda Bureau of
Statistics11. Executive Director, KCCA;12. Executive Director Uganda Financial
Intelligence Authority;13. BoU Representative
14. Executive Director Capital Markets Authority;15. Executive Director Uganda Retirements
Benefits Regulatory Authority (URBRA);16. Executive Director Uganda Development
Bank Limited;17. Executive Director Uganda Investment
Authority;18. Executive Director Private Sector Foundation
Uganda;19. Executive Director Insurance Regulatory
Authority;20. Director Economic Policy Research Centre; 21. Executive Director National Planning
Authority; and 22. Development Partner Representative (on
invitation)
The Steering Committee shall be chaired by any one of the Permanent Secretaries of the Sector Ministries (with the exception of PS/ST MFPED) on a rotational basis, for the tenure of the Accountability Sector Development Plan. The current chairperson, the Secretary, Inspectorate of Government, will remain in office until the end of this strategic plan period i.e. 2019/20.
The detailed roles of the Steering Committee are to approve, monitor and evaluate the Accountability Sector Strategic Investment Plan; consider reports and recommendations from the Accountability Sector Working Group; provide high level policy discussion and technical and financial management guidance and direction to the Sector; advise Leadership Committee on matters of policy as required; formulate policy and set priorities for the sector; and identify and mobilize resources for the sector.
The Committee shall meet at least once a quarter, and two of the meetings shall be held jointly with
the Leadership Committee. The quorum for the Steering Committee meetings shall be 60% of the members; and the committee shall be served and facilitated by the Secretariat for the Accountability sector.
4.3 Sector Working GroupThe role of the Accountability Sector Working Group is to harmonise, coordinate, monitor, evaluate and report on the sector vision and goals, policy frameworks, plans, and performance of all Sector Institutions. The specific ToRs of the SWG include among others: • Discussion of issues of policy and strategic
nature from Sector Institutions with a view to give a sense of direction to the sector;
• Formulation and coordination of sector strategies for long, medium and short term investments plans and budgets;
• Reviewing reports from Sector Technical Working Groups and evaluating their
| 67
Accountability Sector Strategic Investment Plan 2017/18 - 2019/20
consistency with the objectives of sector development plans;
• Development of indicators and monitoring and evaluating sector performance;
• Critical analysis of submissions of the technical working groups to ensure that implementation of the programs remains focused;
• Prioritisation of expenditure within the available resources and mobilisation of resources for funding identified gaps during the course of implementation of SDP projects and programmes;
• Harmonisation and monitoring and evaluation of sector policies and programs;
• Approval of ToRs for Technical Assistance; and • Approval of sector development plans.
The Accountability Sector Working Group shall be comprised of senior technical staff at Director
or Head of Department/Programme level from the Sector Institutions, Local Governments, Private Sector and Civil Society, and is chaired by the Accountant General.
The Sector Working Group shall meet at least twice in a quarter, the quorum for the meetings being 60% of the members. The group shall be served and facilitated by the Secretariat for the Accountability sector.
In order to be fully representative and gain technical clout, the current membership of the Accountability Sector Working Group shall be enhanced by including technical staff from the Sector Institutions that have hitherto not been represented. The full membership shall thus be as follows.
1. Inspectorate of Government2. Office of the Auditor General3. Directorate for Ethics and Integrity, Office of
the President4. Ministry of Public Service5. Ministry of Local Government6. Uganda Revenue Authority7. MOFPED8. Public Procurement and Disposal of Public
Assets Authority9. Uganda Bureau of Statistics10. KCCA11. Uganda Financial Intelligence Authority
12. Private Sector Foundation Uganda;13. Development Partner Representatives14. Civil Society Representatives15. Bank of Uganda16. Capital Markets Authority17. Uganda Retirements Benefits Regulatory
Authority (URBRA)18. Uganda Development Bank Limited;19. Uganda Investment Authority20. Insurance Regulatory Authority21. Economic Policy Research Centre22. National Planning Authority23. Internal Auditor General
68 |
Accountability Sector Strategic Investment Plan 2017/18 - 2019/20
4.3.1 Technical Working GroupsThe Accountability Sector Working Group shall constitute four Technical Working Groups (TWGs),
covering Economic Management; Resource Mobilisation and Allocation; Budget Execution and Accounting; and Audit and Anticorruption as illustrated below.
Table 14: Accountability Sector Technical Working GroupsTechnical Working Group CoverageEconomic Management TWG
1. Macroeconomic Policy and Management; 2. Economic Development Policy and Research; 3. Investment Promotion;4. Financial Services;5. Anti-Money laundering;6. Statistical Production & Policy Research;
Resource Mobilisation and Allocation TWG
1. Revenue/Tax Policy/Management;2. Debt Policy/Management;3. Planning, Budgeting and Public Investment Policy/Management;
Budget Execution and Accounting TWG
1. Accounting Policy/Management;2. Management Information System/Services;3. Asset Management (Including Cash);4. Public Policy/Contract Management
Audit and anticorruption TWG
1. Inspection;2. Internal Audit;3. External Audit;4. Anti-Corruption;5. Ethics and Integrity;
The Technical Working Groups shall among others: • Analyse thematic area technical issues and
produce papers and reports with conclusions and recommendations for discussion and endorsement by the SWG, Steering and Leadership committee.
• Support and participate in the planning, budgeting, monitoring and evaluation, report and document lessons learnt during implementation;
• Be the think-tank for the accountability sector and particularly, the thematic areas;
• Engage the public on key emerging and existing policy issues to get their perspective
and satisfaction with the various accountability sector policies and interventions;
• Disseminate key findings of their work and other related reports.
The Technical Working Groups shall comprise of technical staff from Sector Institutions at Principal or above level, and shall be chaired a Director or above level, and co-chaired by Development Partners. For a start, the Sector Working Group shall facilitate the appointment of the chairperson (from the government side) for each of the Technical Working Groups and the Development Partners shall choose amongst themselves the co-chairpersons.
| 69
Accountability Sector Strategic Investment Plan 2017/18 - 2019/20
The existing coordination arrangements, including PEMCOM, the Inter-Agency Forum on Corruption and the Task Force on Domestic Revenue Mobilisation will be aligned and integrated into the new sector coordination structures. The aim will be to ensure a streamlined approach avoiding duplication of issues and responsibilities in the new fora. This will be managed through a consultative process so as to ensure that the dynamics and progress of the existing arrangements are not lost, but rather inform the new structures based on lessons learnt. This may require a transition process as
the new coordination structure is introduced. This will be subject to annual reviews to check that the new arrangements are meeting stakeholder expectations.
The Technical Working Groups shall meet at least once a quarter, or as and when there is business for their attention, and shall be serviced by the Secretariat for the Accountability Sector. For a start, the following membership is proposed for each of the Technical Working Groups, however, going forward, the TWGs shall be free to co-opt other members within and out of the sector depending on the issues at hand.
Table 15: Technical Working Group MembershipEconomic Management TWG Resource Mobilization and
Allocation TWGBudget Execution and Accounting TWG
Audit and Anti-corruption TWG
1. Ministry of Finance Planning and Economic Development;
2. Bank of Uganda;3. Capital Markets Authority;4. Uganda Retirements Benefits
Regulatory Authority (URBRA);5. National Social Security Fund;6. Uganda Development Bank
Limited;7. Insurance Regulatory
Authority;8. Financial Intelligence Authority;9. Uganda Investment Authority;10. Uganda Bureau of Statistics;11. Economic Policy Research
Centre;12. Private Sector Foundation
Uganda;13. Uganda Manufacturers
Association;14. Development Partner
(Economy/Private Sector Development focused);
15. Civil Society (Economy/Private Sector Development focused)
1. Ministry of Finance Planning and Economic Development;
2. Bank of Uganda;3. Uganda Revenue
Authority (URA);4. Kampala Capital City
Authority (KCCA);5. National Planning
Authority;6. MoLG/Local
Government Finance Commission (LGFC);
7. Uganda Manufacturers Association (UMA);
8. Private Sector Foundation Uganda (PSFU);
9. Economic Policy Research Centre;
10. Development Partner (Fiscal Policy focused); and
11. Civil Society (Fiscal Policy focused)
1. Ministry of Finance Planning and Economic Development (Accountant General’s Office);
2. Public Procurement and Disposal of Public Assets (PPDA);
3. Ministry of Public Service (Inspectorate);
4. Ministry of Local Government (Inspectorate);
5. Development Partner (PFM focused); and
6. Civil Society (PFM focused);
1. Ministry of Finance Planning and Economic Development (Internal Auditor General’s office);
2. Office of the Auditor General (OAG);
3. Inspectorate of Government (IG);
4. Directorate of Ethics and Integrity (DEI);
5. Development Partner (Audit/anticorruption focused); and
6. Civil Society (Audit/anticorruption focused);
70 |
4.3.2 Accountability Centres at Local Governments
This strategic plan intends to enhance the activities, presence and awareness of the accountability sector in local governments, considering their role in service delivery. It is therefore proposed that accountability centres be established and operationalized in all districts to serve the district, Municipal, sub county and town councils within the districts.
Accountability centres at local governments shall be the first point of contact for the accountability sector and specifically, the centres shall be expected to: • Oversee the implementation of the
accountability sector programmes, projects and activities at district level;
• Identify and deal with accountability related issues at their level and where need be, forward the issues to the Sector Working Group for consideration; and
• Promote and disseminate accountability reforms, developments, news etc.
Accountability centres at local governments shall be comprised of the Resident District Commissioner; District Chairperson; Chief Administrative Officer; Chairperson District Public Accounts Committee; and Heads of Finance, Procurement, Internal Audit, Production, Planning; District NGO and Private Sector Forum.
The Accountability Centres shall be chaired by the Resident District Commissioner and shall meet at least twice a year. Initially, they will be formed by the districts and where possible facilitated by the accountability sector secretariat in the initial stages.
Where a district already has a District Integrity Forum, the ToRs of the forum shall be updated to play both the roles of the accountability centre, and the District Integrity Promotion Forum.
4.4 Sector InstitutionsAs per the NDP II, The accountability sector is currently comprised of 20 Sector Institutions that make a direct contribution to the achievement of the sector’s outcomes. This strategy shall
reinforce this membership by taking steps to include the National Planning Authority as one of the accountability sector institutions, considering the fact that planning goes hand in hand with economic management, resource mobilisation and allocation. NPA coming on Board will among others enhance MDALGs compliance with planning, monitoring and impact evaluation guidelines.
4.5 Accountability Sector Secretariat
The accountability sector Secretariat is mainly responsible for:1. Providing technical advice to the
Accountability Sector Leadership Committee, Steering Committee, Sector Working Group, Technical Working Groups and Sector Institutions;
2. Analysing Sector Institution’s BFPs, Development Plans and MPS to ensure alignment with the ASSIP, NDPII and other relevant policy frameworks and advising on way forward;
3. Facilitating and supporting the development and implementation of the Accountability Sector Development Plans, Budget Framework papers, Monitoring and Evaluation Framework and Communication Strategy;
4. Organising the leadership, steering committee, sector working group and technical committee meetings; documenting, disseminating and keeping custody of the proceedings of the meetings;
5. Consolidating the Sector Budget Framework Papers, Quarterly, Semi Annual and Annual Reports;
6. Organising joint sector activities e.g. inspections, annual reviews, regional and national accountability forums;
7. Supporting the mobilisation of resources for the accountability sector;
8. Promoting close cooperation, learning
Accountability Sector Strategic Investment Plan 2017/18 - 2019/20
| 71
Accountability Sector Strategic Investment Plan 2017/18 - 2019/20
and synergies within and outside the accountability sector institutions;
9. Undertaking detailed studies to understand the impact of the various reforms, interventions and services; and
10. Coordinating any other sector activities;
In order to effectively and efficiently deliver the above services, the secretariat structure shall provide for a Coordinator and 4 Technical Specialist including the Economic Management Specialist; Revenue/Budgeting Expert; PFM Specialist; and Anticorruption Specialist as illustrated below.
Accountability Sector Secretariat Structure
Sector Coordinator
AccountsAssistant
Revenue/Budget Specialist
Economic Management
Specialist
Technical Assistants (4)
Public Financial Management
Specialist
Anti-CorruptionSpecialist
ASSIP Financing Strategy
| 73
This section presents the funding requirements for implementing the strategic interventions identified in the previous chapters; expected source of funds; and the funding gap for the remaining three years of the Accountability Sector Strategic Investment Plan.
5.1 Funding RequirementsThe accountability sector will require an estimated UGX4.463 trillion over the next three years to FY2019/20, to deliver its objectives as envisaged in the NDPII. The table below illustrates the funding requirements per financial year.
7 The funding requirement for MoFPED provides for subventions to none vote sector institutions such as CMA, URBRA, UIA, EPRC and UDBL.8 The funding requirements for Bank of Uganda were not provided as they are yet to approve the strategic plan covering that period.9 This is mainly attributable to the funding requirements for Vote 008-MoFPED and 130-Treasury Operations, which were not broken down into recurrent
(wage and non-wage) and development at the time of drafting this ASSIP.
74 |
Accountability Sector Strategic Investment Plan 2017/18 - 2019/20
5.1.1 Funding requirements for non-vote accountability sector institutions
Although some non-vote accountability sector institutions are provided for and receive subventions from the Ministry of Finance, their funding requirements are diverse and enormous,
and have not been fully accommodated in the Ministry of Finance Budget illustrated in table 16. Considered separately, their funding requirements over the next three years are estimated at UGX2.239 trillion as illustrated in the table below.
5.2 Sources of FundsThe main source of funding for the implementation of ASSIP shall be the Government of Uganda through the Medium Term Expenditure Framework (MTEF); Donor Project Support and Own Resources as illustrated in the following sections.
5.2.1 Medium Term Expenditure Framework (MTEF)
The Accountability Sector’s MTEF projections including wage, non-wage recurrent, development (domestic) and external financing (donor budget support) for the current year and next three years are presented in the table below.
| 75
Accountability Sector Strategic Investment Plan 2017/18 - 2019/20
Source: Ministry Of Finance, Planning and Economic Development. National Budget Framework Paper FY 2017/18 – FY 2021/22, December 2016. Page 398-399
5.2.2 Donor Project SupportDonor project support shall remain a key funding source for the sector, and the Accountability Sector shall continue harnessing and leveraging on the already existing good funding arrangements and relationships with development partners like Austria, DANIDA, DFID, EU, Germany (GIZ), IGC, IMF, Ireland, KfW, Netherlands, Norway, Sweden, Trademark EA, USAID and the World Bank, who are funding a number of projects.
However, the breakdown of the total committed donor project support to the accountability sector by either sector objective or recurrent and development expenditure for each of the next three years to 2019/20 is scanty, so were unable to provide proper estimates of the committed funding over the remaining three years of the NDP II and Revised ASSIP.
5.2.3 Own SourcesIn addition to the non-tax revenues generated by sector institutions and remitted to the consolidated fund, the accountability sector will also fund the implementation of ASSIP through own resources generated and used at source by its sector institutions such as the Private Sector Foundation Uganda, Economic Policy Research Centre, Insurance Regulatory Authority, Uganda Development Bank, Uganda Investment Authority, National Social Security Fund, etc.
5.3 The Funding GapThe estimated total funds available to the accountability sector during the next three years to FY2019/20 is UGX3.344 trillion as illustrated in table 18 above. Going by the estimated funding
76 |
Accountability Sector Strategic Investment Plan 2017/18 - 2019/20
requirements and projected available funds for implementation of the ASSIP over the next three years to 2019/20, the funding gap is estimated
at UGX1.119 trillion over the next three years as illustrated in the table below.
Table 19: Estimated ASSIP funding gap (Billion UGX)2017/18 2018/19 2019/20 Total
The mobilisation of resources will cater for both the national and subnational revenue requirements and will include the development and implementation of a national revenue strategy; development of bankable projects and funding proposals for the unfunded areas; adopting modern funding mechanisms such as PPPs, Results Based Aid, etc.
5.3.1 Strategies for closing the funding gap
Considering the magnitude of the funding gap, the Accountability Sector Steering Committee supported by the Sector Working Group and Secretariat will continue to aggressively mobilise resources for implementation of the ASSIP, and the NDP II.
10 Excludes the extra funding requirements of non-vote accountability sector institutions
| 77
6.1 Sector Monitoring and Evaluation
A monitoring and evaluation framework has been developed to guide the sector in measuring the outputs and outcomes of ASSIP implementation. The framework provides details of the accountability sector outcomes, outputs and the corresponding indicators, indicator definition/measurement, means of verification
(MoV), data sources, frequency of measurement, responsibility for measuring and reporting on the indicator. The Framework is attached as Annex 1 to this Strategy.
The table below illustrates the connection between the accountability subsectors, thematic areas, strategic objectives, outcomes and outcome indicators.
6.0 Monitoring and Evaluation Arrangements
Table 20: ASSIP Strategic Objectives, Outcomes and Outcome IndicatorsSubsectors Economic and Financial Management Services Audit/Anti-corruptionThematic area
Economic Management Resource Mobilisation and Allocation
capitalisation and widen investment opportunities in the capital markets;
7. Improve statistical data production and policy research;
8. Protect financial systems and the broader economy from the threats of money laundering and the financing of terrorism;
9. Increase the tax to GDP ratio;
10. Improve public financial management and consistency in the economic development framework;
11. Enhance public contract Management and performance;
12. Improve compliance with accountability rules and regulations;
13. Enhance the prevention, detection, and elimination of corruption;
14. Increase public demand for accountability;
15. Improve collaboration and networking amongst development institutions;
Sector Outcomes
Sustainable Macroeconomic sta-bility
Fiscal Credibility and Sustainability
Value for Money in the management of public resources
78 |
Accountability Sector Strategic Investment Plan 2017/18 - 2019/20
Subsectors Economic and Financial Management Services Audit/Anti-corruptionThematic area
Economic Management Resource Mobilisation and Allocation
Budget Execution and Accounting
Audit and Anti-Corruption
Outcome In-dicators
1. Economic growth rate;2. Inflation rate;3. Income Distribution (Gini
Coefficient)
1. Tax to GDP Ratio;
2. Fiscal Balance (% of GDP);
3. Present Value of public debt stock/GDP;
1. Government Effectiveness Index;2. Level of Satisfaction with public service
delivery;3. Corruption Perception Index;
6.2 Sector M&E planMonitoring and evaluating ASSIP implementation shall be undertaken by the sector institutions and secretariat, and will mainly involve routine monitoring and inspection missions; midterm
review; holding accountability forums and joint reviews; undertaking surveys (satisfaction, awareness, service delivery, etc.); and final reviews as illustrated in the table below.
The Accountability Sector M&E plan is premised on the agreed outcome and output indicators and targets for the various sector outcomes and objectives as illustrated in the table below.
| 79
Accountability Sector Strategic Investment Plan 2017/18 - 2019/20
Table 22: Accountability Sector Outcome and Output TargetsNo. Indicators Baseline
4 Income distribution (Gini Coefficient) 44.3(2013) 45 45.2Intermediate outcome/output IndicatorsObjective 1: Increase equitable access to finance1 % of financially included adults 85% 86% 87% 89% 91% 93%2 Percentage of microfinance
institutions complying with Microfinance polices, laws and regulations
0 6.3% 7% 8% 9% 10%
3 Percentage usage of deposit accounts in regulated Financial Institutions (Usage %ge)
16% 18.5% 20% 22% 24% 26%
Objective 2: Increase private investment1 FDI as a percentage of GDP (%)12 3.8% 4.0% 4.1% 4.3% 4.4%2 Proportion of Business Climate
Reforms conclusively resolved (%)39% 45% 75% 95%
Objective 3: Reduce interest rates1 Average lending rate 23.7%2 Private-sector credit to GDP 12% 12% 13% 15% 15%3 Non-Performing Loans to Gross
Loans5.3% 4.5% 2% 2% 2%
Objective 4: Increase Insurance Penetration 1 Insurance penetration 0.76% 1% 1.3% 1.4% 1.6% 1.8%Objective 5: Increase national savings to GDP Ratio1 Savings to GDP ratio13 13.3% 16.9% 18.9% 20.3% 20.3%Objective 6: Increase the level of capitalisation and widen investment opportunities1 Domestic Equity market capitalization
to GDP ratio4.8% 5.0% 4.8% 4.8% 5.0% 5.0%
11 Consumer Price index June 2013 (UBoS)12 Data for 2015 is from World Bank Statistics. Projections for 2016 to 2020 are based on the average growth for the period 2010 to 2015 (i.e. 4%) 13 Data for 2016 to 2019 are IMF Projections. Growth averaged 15% between 2010 and 2015
80 |
Accountability Sector Strategic Investment Plan 2017/18 - 2019/20
No. Indicators Baseline 2015/16
Target2015/16 2016/17 2017/18 2018/19 2019/20
Objective 7: Improve statistical data production and policy research1 Established and functional statistical
structures in MDA & HLGs36 25 40 45 50 55
2 MDAs and HLGs with Statistical Plans 22 25 35 60 85 1003 No. of skilled statistical personnel in
MDAs & HLGs.200 81 210 220 230 240
Objective 8: Protect financial systems and the broader economy from the threats of money laundering and the financing of terrorism:1 Accumulated Total of registered
accountable Persons/Entities in terms of AMLA
NA NA 3 8 14 15
2 Proportion of eligible reporting agencies registered with FIA in terms of AMLA 2013
20% 100% 100%
3 Number of suspicious Transaction Reports received
210 303 360 400 500 550
4 Number of suspicious Transactions Reports Analysed
82 168 85 150 480 540
5 Number of Large Cash Transactions Reports received
NA 480,000 500,000 500,000 500,000 500,000
6 Number of cases disseminated for investigations
32 49 42 60 80 120
7 Number of sites using GOAML Electronic Reporting System
NA NA NA 15 20 33
8 % of Accounting Persons/ reporting entities compliant with AML/CFT standards
NA NA 30% 50% 80% 100%
9 Number of AML/CFT Awareness programmes conducted
NA 6 15 25 40 50
10 Number of courses attended by FIA staff to build capacity in AML/CFT
NA 6 15 30 35 45
11 Number of mandatory International and regional activities participated
2 6 6 6 5 5
2 Sector Outcome 2: Fiscal Credibility and SustainabilityOutcome Indicators
1 Tax to GDP Ratio 13% 13.4% 13.4% 13.9% 14.4% 14.9%2 Fiscal Balance (% of GDP) 4.8% 4.5% 6.0% 5.3% 4..7% 3.7%
| 81
Accountability Sector Strategic Investment Plan 2017/18 - 2019/20
Intermediate outcome/output IndicatorsObjective 9: Increase the tax to GDP ratio1 Domestic revenue as a % of GDP 13.08% 13.7% 14.08% 14.72% 15.36% 16%2 Domestic taxes to GDP 7.2% 7.39% 7.3% 7.5% 7.5% 7.7%3 International trade taxes to GDP 5.7% 6% 6.0% 5.7% 5.7% 5.7%4 Non-tax revenue to GDP 0.3% 0.32% 0.4% 0.4% 0.4% 0.4%5 External resource envelope as a
percentage of the National budget17.5% 24% 30.56% 32.00% 31.8% 29.2%
6 % of tax revenue collected against target
96.52% 100% 100% 100% 100% 100%
7 Average filing ratio 86.7% 89% 89% 87% 88% 89%8 Percentage growth in taxpayer
register18% 30% 10% 10% 10% 10%
9 Rural LG revenue collection as a percentage of LG budgets;
4% 5% 6% 9% 11%
10 Urban LG revenue collection as a percentage of LG budgets;
20% 22% 25% 28% 30%
11 KCCA revenue collection as a percentage of LG budgets;
20% 17% 23% 28%
12 Membership in Extractive Industries Transparency Initiative (EITI)
Commit-ment(May 2013)
Applica-tion
Compli-ance
Objective 10: Improve Public Financial Management and consistency in the economic development frameworkPublic Debt Management1 Nominal Debt to GDP ratio 33.8 37.0 40.3 41.7 42.6
o/w external debt to GDP 21.0 24.1 27.7 29.9 31.6o/w domestic debt to GDP 12.8 12.9 12.6 11.8 11.0
2 Average time to Maturity (ATM) of the Public (Govt) Debt Portfolio (YEARS)
3 Domestic Debt maturing in one year as a % of total debt
82 |
Accountability Sector Strategic Investment Plan 2017/18 - 2019/20
No. Indicators Baseline 2015/16
Target2015/16 2016/17 2017/18 2018/19 2019/20
4 External Debt maturing in one year as a % of total debt
5 Stock of domestic arrears as % of total expenditure
13% 3.5% 10% 9% 8% 7%
6 Net change in the stock of domestic arrears (Billion UGX)
-40 -110 -110 -110 -110 -110
7 Proportion of disbursed funds in Uganda’s external public debt exposure
72.7% 74.7%
Budget Credibility8 % of funds absorbed against funds
released 96% 100% 100% 100% 100% 100%
9 % of budget released against originally approved budget
102% 95% 100% 100% 100% 100%
10 % of funds utilized against originally approved budget
96% 97% 100% 100% 100% 100%
11 Supplementary budget as a % of the initial budget
4.6% 3% <3% <3% <3% <3%
12 Ratio of annual investment expenditure to consumption expenditure (release outturn)
60:40 53:49 70:30 70:30 70:30
13 % Deviation of approved annual Budget from initial MTEF projections
30% 10% 5% 5% 5%
14 Proportion of central- and local government agencies (MDAs) that are using programme based budgeting
100% 100% 100%
15 Proportion of votes attaining ministerial policy statement certification for gender and equity budget compliance
53% (2016/17)
90% 95% 100%
16 Green Economy (GE) Public Expenditure Review (PER)
No Green Economy PER ever conducted
GE-PER complet-ed & ap-
provedPublic Investment Management
20 % of projects implemented on time 100% 100% 100% 100%21 % of projects implemented on budget 80% 82% 88% 95%
| 83
Accountability Sector Strategic Investment Plan 2017/18 - 2019/20
No. Indicators Baseline 2015/16
Target2015/16 2016/17 2017/18 2018/19 2019/20
22 Public Investment Management Index (PIMI = IMF measure of Public Investment efficiency)
1.44 (2011) 2.05 2.26
23 Implementation of the Public Investment Management System (PIMS)
All PIMS elements
operation-al
24 Implementation of the Integrated Public Investment Management (PIM) project database
Project database
operation-al
3 Sector outcome 3: Value for Money in the management of public resourcesOutcome Indicators
1 Level of Satisfaction with public service delivery
TBD TBD TBD TBD TBD TBD
2 Government Effectiveness Index TBD TBD TBD TBD TBD TBD3 Corruption Perception Index 25 25 26 28 30
Intermediate outcome/output IndicatorsObjective 11: Improve compliance with accountability rules and regulations.1 % of clean audit reports (CG) 77% 66% 82% 85% 88% 90%2 % of clean audit reports (Statutory
Bodies)79.41% 66% 83% 85% 87% 90%
3 % of clean audit reports (LG) 85.7% 50% 87% 88% 89% 90%4 % of external audit recommendations
implemented by MDALGs27.88% 62% 35% 40% 45% 50%
5 % of internal audit recommendations implemented
69% 75% 68% 70% 72% 74%
6 % of Financial Reports of Accountability Committee adopted by Parliament annually.
40% 50% 60% 80% 80%
7 % of Financial Reports of Accountability Committee adopted by Parliament submitted to the Executive.
30% 75% 50% 70% 80% 80%
8 No of VFM reports adopted by Parliament and submitted to the executive as a % of reports tabled in the plenary
10% 75% 30% 40% 60% 80%
84 |
Accountability Sector Strategic Investment Plan 2017/18 - 2019/20
No. Indicators Baseline 2015/16
Target2015/16 2016/17 2017/18 2018/19 2019/20
9 % of MDAs with Financial Reports in compliance with Public Finance Management Act and regulations
87% 100% 97% 98% 99% 99%
10 % of Treasury Memoranda issued against reports adopted by Parliament
4 100% 100% 100% 100%
11 No of MDAs audited 109 120 96 128 128 13212 No. of Statutory Authorities audited 85 67 100 80 85 8813 No. of projects audited 132 180 141 155 158 16014 No. of Higher Local Governments
audited320 320 367 367 367
15 No. of Lower Local Governments audited (including schools)
1488 1786 1489 1703 1703 1713
16 No. of Value for Money Audits conducted
15 16 14 16 16 16
17 No. of Forensic Investigations and Special audits conducted
45 66 56 46 50 56
18 % of MDA Budgets executed using automated Financial Management Systems
62% 75% 85% 95% 100%
Objective 12: Enhance public contract management and performance1 % of entities rated satisfactory from
procurement audits90% 50% 95% 95% 100% 100%
2 % of contracts audited (by value) rated satisfactory
92% 50% 95% 95% 100% 100%
3 % of contracts delivered within contract value
N/A14 100% 100% 100% 100% 100%
4 Proportion of procurement audits and investigation recommendations implemented
72% 85% 85% 85% 90% 90%
5 Proportion of Contracts subject to open competition
45.5% 80% 80% 80% 80%
6 Number of procurement investigations conducted
62 60 60 60 80 80
7 Number of procurement audits conducted
114 102 120 140 150 160
14 Performance Monitoring now tracks an indicator on % of contracts awarded at market price
| 85
Accountability Sector Strategic Investment Plan 2017/18 - 2019/20
No. Indicators Baseline 2015/16
Target2015/16 2016/17 2017/18 2018/19 2019/20
8 Number of follow-ups undertaken on procurement audits and investigations recommendations
109 120 120 120 140 150
9 Average No of bids received per contract
2.1 5 5 5 5
Objective 13: Enhance the prevention, detection, and elimination of corruption1 % of anticorruption
1 Economic Growth The expansion of production possibilities that results from capital accumulation and technological change.
Analysis of GDP Background to the budget, GoU finance statistics
Annually MFPED (Macroeconomic Policy and Management)
2 Inflation Rate The percentage increase in the general price level from one period to the next; a sustained rise in the overall level of prices in an economy. (Average Annual Headline Inflation)
Analysis of Price level increases.
Background to the budget, GoU finance statistics
Annually MFPED (Macroeconomic Policy and Management), UBOS
3 Income distribution (Gini Coefficient)
Uganda Bureau of Statistics
Intermediate outcome/output indicatorsObjective 1: Increase equitable access to finance1 %age of
financially included adults
Population aged 16 years+ accessing and using financial services
Surveys Reports on supply and Demand side surveys
Annual MFPED (Financial Services Department) BoU
2 Percentage of microfinance institutions complying with Microfinance polices, laws and regulations
MFPED (Financial Services Department)
88 |
Accountability Sector Strategic Investment Plan 2017/18 - 2019/20
No. Indicators Indicator definition/Measurement
Means of Verification (MoV)
Data Sources Frequency of measurement
Responsibility for measuring and reporting on the indicator
3 Percentage usage of deposit accounts in regulated Financial Institutions (Usage %ge)
MFPED (Financial Services Department) BoU
Objective 2: Increase private investment4 FDI as a
percentage of GDP
Sum of equity capital, reinvestment of earnings, other long-term capital, and short-term capital as shown in the balance of payments
Published data by national/international authorities
BoU/World Bank Annually MFPED (Development Policy and Investment Promotion)
5 Proportion of Business Climate Reforms conclusively resolved (%)
Proportion of Business Climate Reforms conclusively resolved
Assessment of resolution of Business Climate Reforms
Reports on Business Climate Reforms
Annually MFPED (Development Policy and Investment Promotion)
6 Share of National Development Policies under active implementation (with plans strategies and annual budgets)
Level of implementation of National Development Policies
Assessment and tracking of national Development Policies under active implementation against Policies approved
Policy Briefs, Background to the Budget
Annually MFPED (Development Policy and Investment Promotion)
Objective 3: Reduce interest rates7 Average lending
rate8 Private sector
credit to GDP ratio
Loans advanced by financial intermediaries to the private non-finance sector
revenue as a % of GDP (excluding domestic Oil and Gas revenues)
This is revenue collected from taxable goods and services (but excluding oil and gas revenues) expressed as percentage of GDP.
Analysis of revenue performance
Revenue Performance Report
Annually MFPED (Macroeconomic Policy and Management), URA
2 Domestic taxes to GDP
Domestic tax revenue expressed as percent of nominal GDP
Analysis of revenue performance
Revenue Performance Report
Annually MFPED (Macroeconomic Policy and Management), URA
3 International trade taxes to GDP
International trade taxes expressed as percentage of nominal GDP
Analysis of revenue performance
Revenue Performance Report
Annually MFPED (Macroeconomic Policy and Management), URA
| 93
Accountability Sector Strategic Investment Plan 2017/18 - 2019/20
No. Indicators Indicator definition/Measurement
Means of Verification (MoV)
Data Sources Frequency of measurement
Responsibility for measuring and reporting on the indicator
4 Non-tax revenue to GDP
All revenue other than taxes accruing to Government through Ministries, Departments and Agencies (MDAs) from their operations. Non-tax revenue expressed as percent of nominal GDP
Analysis of revenue performance
Revenue Performance Report
Annually MFPED (Macroeconomic Policy and Management), URA
5 External Resources Mobilised as % of the National Budget
The ratio of Resources Mobilized from external sources including loans and grants to the National Budget
Analysis of Official Development Assistance
Background to the budget
Quarterly MFPED (Deficit Financing and Cash Management)
6 % of customs tax revenue collected against target
Use Etax Annual Revenue reports , UBOS statistical reports; divide total customs revenue with the GDP and multiply by 100%
Annual Progress Report
Annually URA
7 Average filing ratio
Using Etax reports; establish the number of compliant filers of each tax head and divide their sum by the total number of eligible filers x 100%
Annual Progress Report
Annually URA
8 Percentage growth in taxpayer register
Using Etax reports; establish the increase in number of tax payers on the register for the year of analysis using the previous as a baseline statistics, divide the increase by the number of taxpayers of the previous year x100%
Annual Progress Report
Annually URA
94 |
Accountability Sector Strategic Investment Plan 2017/18 - 2019/20
No. Indicators Indicator definition/Measurement
Means of Verification (MoV)
Data Sources Frequency of measurement
Responsibility for measuring and reporting on the indicator
9 LG Local Revenue as a % of LG Budget
LGs and KCCA LG Audited Final Accounts
Annually LGFC
o/w Rural LG LG Audited Final Accounts
LGFC
o/w Urban LG LG Audited Final Accounts
Annually LGFC
o/w KCCA Annual Progress Report
Annually KCCA
10 Membership in Extractive Industries Transparency Initiative (EITI)
EITI Secretariat
Objective 10: Improve public financial management and consistency in the economic development framework11 Nominal Debt to
GDP Ratio• Domestic Debt
Stock to GDP• External Debt to
GDP
Debt Sustainability Analysis
Debt Sustainability Analysis Report
Annually MFPED (Deficit Financing and Cash Management)
12 Refinancing Risk Indicators
• Average time to Maturity
• Domestic Debt Maturing in one year
• External Debt Maturing in one year
Medium Term Debt Management Strategy
Medium Term Debt Management Strategy
Annually MFPED (Deficit Financing and Cash Management)
13 % of funds absorbed against funds released
Absorption of funds by MDALGs
Monitoring and evaluation of budget implementation
Budget Performance Report
Quarterly MFPED (Budget Preparation, Execution and Monitoring)
14 % of budget released against originally approved budget
Release performance against approved budget
Monitoring and evaluation of budget implementation
Budget Performance Report
Annually MFPED (Budget Preparation, Execution and Monitoring)
| 95
Accountability Sector Strategic Investment Plan 2017/18 - 2019/20
No. Indicators Indicator definition/Measurement
Means of Verification (MoV)
Data Sources Frequency of measurement
Responsibility for measuring and reporting on the indicator
15 % of funds utilised against originally approved budget
Outturn against Budget
Monitoring and evaluation of budget implementation
Budget Performance Report
Annually MFPED (Budget Preparation, Execution and Monitoring)
16 Stock of domestic arrears as a % of total expenditure
Stock of accumulated domestic arrears/Budget FY N-2
Monitoring and evaluation of budget implementation
Annual Budget Performance Report
Quarterly MFPED (Budget Preparation, Execution and Monitoring), LGs
17 Net change in the stock of domestic arrears (Billion UGX)
Reduction in arrears every FY
Annual Budget Performance Report
Annually MFPED (Budget Preparation, Execution and Monitoring)
18 Proportion of disbursed funds in Uganda’s external public debt exposure
Value for Money Audit Reports
OAG
19 Total value of supplementary appropriations as a % of approved budget
Level of Supplementary expenditure against the approved budget
Analysis of Supplementary Expenditure
Annual Budget Performance Report
Annually MFPED (Budget Preparation, Execution and Monitoring)
20 Ratio of annual investment expenditure to consumption expenditure (release outturn)
Proportion of releases allocated to investment spending Vis-à-vis consumption spending
Monitoring and evaluation of budget implementation
Annual Budget Performance Report
Annually MFPED (Budget Preparation, Execution and Monitoring)
21 % Deviation of approved annual Budget from initial MTEF projections
Variation of the annual Budget from the MTEF
Monitoring and evaluation of budget implementation
Annual Budget Performance Report
Annually MFPED (Budget Preparation, Execution and Monitoring)
22 Proportion of central- and local government agencies (MDAs) that are using programme based budgeting
MFPED (Budget Preparation, Execution and Monitoring)
96 |
Accountability Sector Strategic Investment Plan 2017/18 - 2019/20
No. Indicators Indicator definition/Measurement
Means of Verification (MoV)
Data Sources Frequency of measurement
Responsibility for measuring and reporting on the indicator
23 Proportion of central- and local government agencies (MDAs) that are using programme based budgeting
EOC Assessment Reports
BMAU
24 Proportion of votes attaining ministerial policy statement certification for gender and equity budget compliance
25 Green Economy (GE) Public Expenditure Review (PER)
26 %age of projects implemented on time
MFPED (PAP)
%age of projects implemented on budget
MFPED (PAP)
27 Public Investment Management Index (PIMI = IMF measure of Public Investment efficiency)
IMF MFPED (PAP)
28 Implementation of the Public Investment Management System (PIMS)
MFPED (PAP)
| 97
Accountability Sector Strategic Investment Plan 2017/18 - 2019/20
No. Indicators Indicator definition/Measurement
Means of Verification (MoV)
Data Sources Frequency of measurement
Responsibility for measuring and reporting on the indicator
29 Implementation of the Integrated Public Investment Management (PIM) project database
MFPED (PAP)
Sector outcome 3: Value for Money in the management of public resourcesOutcome Indicators
1 Level of Satisfaction with public service delivery
Measure of level of public of satisfaction with service delivery in terms of accessibility, quality and Gender& Equity.
Service delivery surveys, User satisfaction surveys and Expert opinions
National Service Delivery Survey Report
Every three years
UBOS, MoPS
2 Government Effectiveness Index
Measures of perceptions of the quality of public services, the quality of the civil service and its degree of independence from political pressures, the quality of policy formulation and implementation, and the credibility of the government’s commitment to such policies
World Wide Governance Indicators (World Bank)
ADP Country Policy and Institutional Assessment, Afro-Barometer, Business Enterprise Environment Survey, World Country Policy and Institutional Assessment.
Annually OPM, UBOS
3 Corruption Perception Index
Measurement of general public perception ofCorruption levels.
26 Number of follow-ups undertaken on procurement audits and investigations recommendations
Follow up visits made to Entities
Follow up visits PPDA Annual Follow up Report
Annually PPDA
27 Average No of bids received per contract
Average number of bids submitted per contract
GPP report Government procurement Portal
Annually PPDA
Objective 13: Enhance the prevention, detection, and elimination of corruption 28 % of anti-
corruption recommendations implemented.
Number of recommendations arising from investigation of corruption cases implemented divided by the total recommendations made.
Directorate Reports, IG Report to Parliament, IG Performance Reports and Policy Statements
Investigation Files, Case Management System and Closure of File Forms
Annually IG
29 % of Ombudsman recommendations implemented.
Sum of Ombudsman recommendations implemented divided by total sum of recommendations.
Directorate Reports, IG Report to Parliament, IG Performance 3.14Reports and Policy Statements.
Directorate Reports, IG Report to Parliament, IG Performance Reports and Policy Statements, MDA performance reports.
Annually IG
102 |
Accountability Sector Strategic Investment Plan 2017/18 - 2019/20
No. Indicators Indicator definition/Measurement
Means of Verification (MoV)
Data Sources Frequency of measurement
Responsibility for measuring and reporting on the indicator
30 Number of grand or syndicated corruption cases registered.
Sum of grand or syndicated corruption cases recorded by the Inspectorate of Government.
Directorate Reports, IG Report to Parliament, IG Performance Reports and Policy Statements.
Case Registers, Complaint and Case Management System (CMS), Auditor General’s report and PPDA reports
Annually IG
31 Number of sanctions successfully carried out.
Sum of IG recommendations for sanctions in organized and high profile corruption cases implemented by MDAs divided by total sum of sanctions.
Directorate Reports, IG Report to Parliament, IG Performance Reports and Policy Statements
Investigation Files, Case Management System and Closure of File Forms.
Annually IG
32 Number of improvements in public administration as a result of Ombudsman actions.
Sum of recommendations and suggestions to improve public administration that were implemented by public authority.
Directorate Reports, IG Report to Parliament, IG Performance Reports and Policy Statements
Investigation Files, Case Management System and Closure of File Forms
Annually IG
33 No of sensitisation activities on NEVS conducted by Region
Creating public awareness on National Ethical Values
Reports The DEI progress report
Annually DEI
34 No. of capacity building interventions to strengthen DIPFs conducted by Region
Functionality of DIPF Reports and Minutes of DIPFs
The DEI progress report
Annually DEI
35 No. of gender and equity responsive Meetings/ Workshops of the IAF technical Working Groups
Functionality of the 4 IAF Technical Working Groups; Legal, Planning and Budgeting, Communication and ACPPP
Minutes of meetings and field reports
The DEI progress report
Annually DEI
| 103
Accountability Sector Strategic Investment Plan 2017/18 - 2019/20
No. Indicators Indicator definition/Measurement
Means of Verification (MoV)
Data Sources Frequency of measurement
Responsibility for measuring and reporting on the indicator
36 No of gender and equity responsive interventions conducted in the Implementation of NACS in MDAs & LGs.
Capacity building programs, Monitoring and workshops
Monitoring and Workshop Reports
The DEI progress report
Annually DEI
37 No of Dissemination activities equitably conducted on Anti-Corruption Laws and Policies.
Public awareness of anti-corruption laws and policies
Dissemination Reports
The DEI progress report
Annually DEI
38 No of consultative workshops equitably conducted in the development of Anti-corruption laws and policies
Stakeholders’ consultations and technical sessions on Policy and Law formulation.
Consultation Reports
Draft policy/Draft Bill
Annually DEI
39 No of sessions on implementation of Regional and International Legal Instruments participated in, taking social inclusion into account
Review of Uganda’s compliance with Regional and International Ant-Corruption legal instruments
Review Reports Publications on Website
Annually
40 Constitution of the Leadership Code Tribunal
DEI Annual Report DEI
41 Proportion of asset declarations verified by the IG
42 Proportion of asset recovery orders executed
104 |
Accountability Sector Strategic Investment Plan 2017/18 - 2019/20
Annex 2: List of Organisations/Individuals Consulted No. Name Title Institution1 Godfrey Ssemugooma Ag. Asst. Acct General MFPED2 Fixion Akonya Okonye Ag. Chief Internal Auditor MFPED3 Margaret Kakande Head BMAU MFPED4 Ester Akullo H/PME FINMAP MFPED5 Nick Roberts PFM Adviser FINMAP MFPED6 Joseph Muvawala ED NPA7 Catherine Musingwiire PS MoPS8 Wyclife Ahimbisiibwe Senior Statistician MoPS9 George Bamugemereire DIGG IG10 Fred Andema DD/Revenue KCCA11 Samuel Wandera Director FIA12 Michael Olupot Tukei D/ED FIA13 Manyire Odo Director FIA14 Joseph Mwandha Accountant FIA15 Doris Akol Commissioner General URA16 Milly Nalukwago ACRPD URA17 David .N. Bonyi CEO URBRA18 Susan M Nyatia HR Manager URBRA19 Ritah Nansasi Wasswa Manager Legal Services URBRA20 Dan N Badebye D/F&A URBRA21 Banjamin Mukiibi Senior Officer Research and Sector
development URBRA
22 Ronald Azairwe Manager ICT URBRA23 Martin .A. Nsubuga D/Supervision and compliance URBRA24 Nelly Busingye Board member CSBAG25 David Walakira Budget policy specialist CSBAG26 John Akora Ebirugt Budget policy specialist CSBAG27 Iganatious Byaruhanga Program Assistant CSBAG28 Carol Namagense Program Assistant CSBAG29 Imelda Namagga Board Member CSBAG30 Francis Masuba AGG OAG31 F.B. Busingye MF&A OAG
| 105
Accountability Sector Strategic Investment Plan 2017/18 - 2019/20
No. Name Title Institution32 William Tukamuhebwa s/planner OAG33 Paul Sekiboobo planner OAG34 Hans Twinomugisha M/ES/ SPA OAG35 Patricia Ojangole Chief Executive Officer UDBL36 Francis Abibi Banking Economist UDBL37 Sebaggala M Kigozi ED UMA38 Mubaraka Nkuuta Director Membership Services UMA39 Richard Mubiru Director UMA UMA40 Allan Senyondwa Asst. Policy UMA41 Robert Mawanda Communication Manager UMA42 Michael. L. Oketcho Head Policy UMA43 Ahabwe John UMA44 Melissa Brill Component Manager DGF45 Harriet. Muwanga Governance Specialist USAID46 Lise. Abildgaard Sovense Councilor Danish Embassy47 Christian Raitz Von Frientz EU48 Cate Najjuma Economist Danish Embassy49 Paul Rwabutara Technical Advisor GIZ50 Bhavana Sharma Senior Governance Adviser DFID51 Ann-Christin Damm Junior PFM Consultant KFW52 Martin Ssenkungu Economist OPM53 Hadard Arinaitwe Economist OPM54 Ibrahim Wandera Ag. Senior Economist OPM55 Edward Kasato Kangave Manager IRA56 Florence Nviri Director/Finance IRA57 Diana Atwine PS MoH58 Ronald Ssegawa US MoH59 Wycliff Mwambu AC/A MoH60 Racheal Odoi Musoke Senior Technical Advisor JLOS61 Sam Wairagala D/Senior Technical Advisor JLOS62 Patrick Ayota Chief Finance Officer NSSF63 Lawrence Byensi Ag. ED UIA
106 |
Accountability Sector Strategic Investment Plan 2017/18 - 2019/20
No. Name Title Institution64 Godfrey Ssemukula Deputy Director UIA65 Barbrara Kabuchu Deputy Director F&A UIA66 Benjamin Kumumanya PS MoLG67 Ismail Ahmad PI MoLG68 Christopher Magezi SI MoLG69 Nicholas Abola DD/MIS DEI70 Alfred Oyo PAS DEI71 Patrick Serwada SPL DEI72 Sarah .N. Ssewanyana ED EPRC73 Mary Tusaba Kivunike FM EPRC74 Swaibu Mbowa SRF EPRC75 Keith Kalyegira CEO CMA76 Peace Piwang Director/Corp. Services CMA77 Isaac Sekitoleko RMDO CMA78 Francis Kisirinya D/Finance PSF79 H.G.K. Nyakoojo Technical Coordinator PSF80 Ben .P. Mungyereza ED UBOS81 Imelda Musana DED/SPD UBOS82 Kato Mulindwa DED/CS UBOS83 Chris .N. Mukiza DMES UBOS84 Norah Madaya DS/SC UBOS85 Peter Kaujju Ag. DD Public Relations KCCA86 Patricia Kunobwa DA MFPED87 Sylvia Kirabo SPRO PPDA88 Ceali Namakula PRO DEI89 Maria Muzaaki CO MFPED
| 107
Accountability Sector Strategic Investment Plan 2017/18 - 2019/20
Annex 3: ASSIP Review Taskforce MembersNo. Name Designation InstitutionCore Team1 Maxwell Ogentho Director OAG2 Bradford Ochieng Director PPDA3 James Muwonge Director UBOS4 Samuel Wandera Director FIA5 Stephen Ojiambo C/TIPD MFPED6 Anthony Kintu Mwanje Coordinator-SAS MFPED7 Charles Twinomugisha Commissioner MoPS8 James Tibenkana Head Planning Unit MFPED9 Catherine Mayanja SPDP NPA10 Tereza Namwach Senior Economist MFPED11 Epiphany Berocan Senior Economist MFPED12 Rashid Nguma Economist OPM13 Joseph Pinycwa PPA IG14 Sheena Namitala Manager Strategy URASupport Team15 Robert Mukobi PM MFPD16 Anne Niyonzima AA MFPED17 Valeria Bamanya RA MFPED18 Patricia Kunobwa DA MFPED19 Florence Namiwanda RA MFPED20 Nichodemus Nayebare RA MFPED
108 |
Accountability Sector Strategic Investment Plan 2017/18 - 2019/20