Q3 2019 performance + stock recommendations inside this issue ESG investing gathers increasing interest Investing in a low interest rate environment The Research Monitor December Quarter 2019
Transcript
Q3 2019 performance
+ stock recommendations
inside this issue
ESG investing gathers increasing interestInvesting in a low interest rate environment
The Research MonitorDecember Quarter 2019
2 | Research Monitor | Dec 2019
The Australian Share Market, as measured by the S&P/ASX 300 Index, recorded another positive quarter following in the footsteps of a 7.5% in price terms (8.0% including dividends) return in the June quarter. The September quarter saw returns of 1.2% in price terms and 2.6% including dividends, making up in excess of 20% accumulation returns since the start of the year.
The Australian market was more volatile in the September quarter than in previous periods this year, being up 2.96% in July, down 2.97% in August before recovering to be up 1.34% in September.
Bond yields continued to fall to record lows, with the Australian 10-year bond ending the quarter at 1.00%, down from 1.32% at the end of March and having been as low as 0.875% at one stage in August - and a full 1.3% below where they were at the start of the year.
Among Australian equity sectors, Energy, Materials and Capital Goods all posted negative returns during the quarter. Leading the charge to the upside were the Retail and Food and Staples Retailing sectors in somewhat of a triumph of the optimists over the realists due to expectations of an improvement in Australian consumer spending following a cocktail of stimuli including a lower dollar, higher export prices, tax cuts, lower interest rates and easier credit.
Telecommunication Services was a poor performer for the quarter, falling 8.6% in price terms, as the Australian Competition and Consumer Commission threatens to derail the proposed TPG Telecommunications merger. The four sectors to post negative returns comprise 28% of the Australian share market and collectively detracted 1.2% from returns.
Q3 2019 Performance
Sector Performance Market Cap
Food & Staples Retailing 15.2% 69,141
Retailing 14.8% 64,252
Pharmaceuticals, Biotech & Life Sciences 8.9% 110,012
Media & Entertainment 7.8% 17,021
Software & Services 5.8% 47,457
Food Beverage & Tobacco 5.4% 38,016
Health Care Equipment & Services 4.2% 57,473
Diversified Financials 4.0% 91,506
Transportation 3.5% 88,938
Banks 3.3% 424,577
Consumer Services 3.2% 52,983
Insurance 2.7% 68,862
Utilities 1.6% 34,015
Real Estate 1.1% 131,431
Energy 0.1% 92,942
Commercial & Professional Services -2.4% 44,640
Materials -3.5% 319,421
Capital Goods -6.0% 14,832
Telecommunication Services -6.8% 48,781
Given the continued fall in 10-year government bond yields and also the easing stance of the Reserve Bank, it was not surprising to see those stocks considered as “bond proxies” continue to do well.
Food and Staples Retailing stocks that are exposed to consumer non-discretionary spending were the best performers (Woolworths (WOW) up 12.2% and Coles (COL) up 15.4%), whereas those companies exposed to Energy prices did poorest (Woodside Petroleum (WPL) down 10.9% and Worley Parsons (WOR) down 11.6%).
The largest component of the S&P/ASX 300 Index is the Banks Sector (23.1% index weight), which rose 2.2% in price terms and 3.3% including dividends, building on the strong relative returns in the June quarter and extending the period over which banks have outperformed the index. Most of this performance came immediately post the Federal Election outcome as both clarity around the treatment of franking credits and a move by bank regulator APRA to lower the stress test interest rates on loans signalled more accommodative macroprudential controls on credit growth.
Research Monitor | Dec 2019 | 3
The second largest sector, Materials (17.4% index weight) fell 3.5% including dividends, with bellwether BHP down 10.8%.
There were dramatically different outcomes in the September quarter between two stocks which were often compared against each other, Lend Lease (LLC) and CIMIC (CIM). LLC rose 35.1% in the quarter as investors stopped assuming the worst from the company’s construction and engineering business, whereas with CIMIC the opposite took place. Investors became increasingly nervous about the profitability of the company’s engineering work and marked the stock down 29.8%.
There were once again some spectacular returns amongst small companies, even as the broader Small Ordinaries Index rose only 3.11%, with gold miner Dacian Gold (DCN) up 160% and healthcare products distributor BWX Group (BWX) up over 110% in three months!
Global equity markets performed somewhat more modestly than Australian markets in the September quarter, with the MSCI World ex Australia Index in Australian dollars up only 0.6%. World share markets also moved in an “up-down-up” pattern in the quarter as the market oscillated between focusing on lower interest rates and then on trade war between the United States and China.
Bond markets rallied on the back of lower long-term interest rates with the Bloomberg AusBond Composite (0+Y) index up 2.0% and Bank Bills returning 0.3%.
The spread between 90-day bank bills and cash remained at negative 5 points at the end of September – a strong sign of easing credit conditions and expectations that the RBA will continue to cut rates. Long term interest rates in Australia hit a record low of 0.875%.
There were once again some spectacular returns amongst small companies.
Market measures of risk or volatility, rose sharply in August and have subsequently retreated to June levels, suggesting investors have become less uncomfortable with the likely path of inflation, interest rates, growth and trade.
4 | Research Monitor | Dec 2019
Investing in a low interestrate environment
Martin CrabbChief Investment Officer
0.60
0.70
0.80
0.90
1.00
1.10
1.20
1.30
2019
2021
2022
2024
2025
2027
2028
2030
2031
2033
2034
1.00
2.00
3.00
4.00
5.00
6.00
7.00
8.00
1992
1994
1996
1998
2000
2002
2004
2006
2008
2010
2012
2014
2016
2018
Investors need to face a harsh truth: “Carry” (another name for the cash yield) is dead. As this chart from the Bank of England shows, interest rates are the lowest in history and markets are suggesting that they will stay low for quite a while.
Typically, investors try to do better than cash by investing in “duration” – or having your money tied up for a period of time. In recent years, specifically since the GFC, term deposits have offered a return in excess of the cash rate. But historically, this is not the case.
With term deposit rates likely to fall below 1%, perhaps investors can invest for longer periods of several years and pick up some interest that way? Unfortunately not, as the longest tradeable government bond of ten year’s duration is also yielding less than 1%. Even as far as fifteen years from now, interest rates are only just above 1%.
Bank of England Bank Rate since 1694
Swap Interest Rates
RBA Cash Rate
Retail deposit and investment rates; Banks’ term deposits ($10000); 3 months
0.00
2.00
4.00
6.00
8.00
10.00
12.00
14.00
16.00
1694
1703
1712
1721
1730
1739
1748
1757
1766
1775
1784
1793
1802
1811
1820
1829
1838
1847
1856
1865
1874
1883
1892
1901
1910
1919
1928
1937
1946
1955
1964
1973
1982
1991
2000
2009
2018
6 | Research Monitor | Dec 2019
Investing in a lowinterest rate environment.
In order to generate income, investors will have to seek higher risk sources of return notably “credit” and “equity”. This involves buying investments which derives part of their return via the premium investors demand to give up certainty of return.
In credit markets, as an example we look to the Bank Hybrid market where Shaw and Partners have significant expertise and where we manage many hundreds of millions of dollars on behalf of our clients. A well-diversified portfolio of bank hybrids is currently expected to deliver a yield to call of approximately 3.25% including franking.
It should be stressed, however, that investing in hybrids is not without risk and readers are encouraged to read the disclosure of this report which pertains to investing in hybrid securities.
If this potential return from bank hybrids fails to excite investor interest, investors can seek equity for income.
They key here is not just the dividend yield and franking credits on the shares, but the expected total shareholder return (including capital gains or losses) and the degree of certainty investors have about the cash flows supporting the dividend payments.
Research Monitor | Dec 2019 | 7
3.00%
3.50%
4.00%
4.50%
5.00%
5.50%
1991
1993
1995
1997
1999
2001
2003
2005
2007
2009
2011
2013
2015
2017
2019
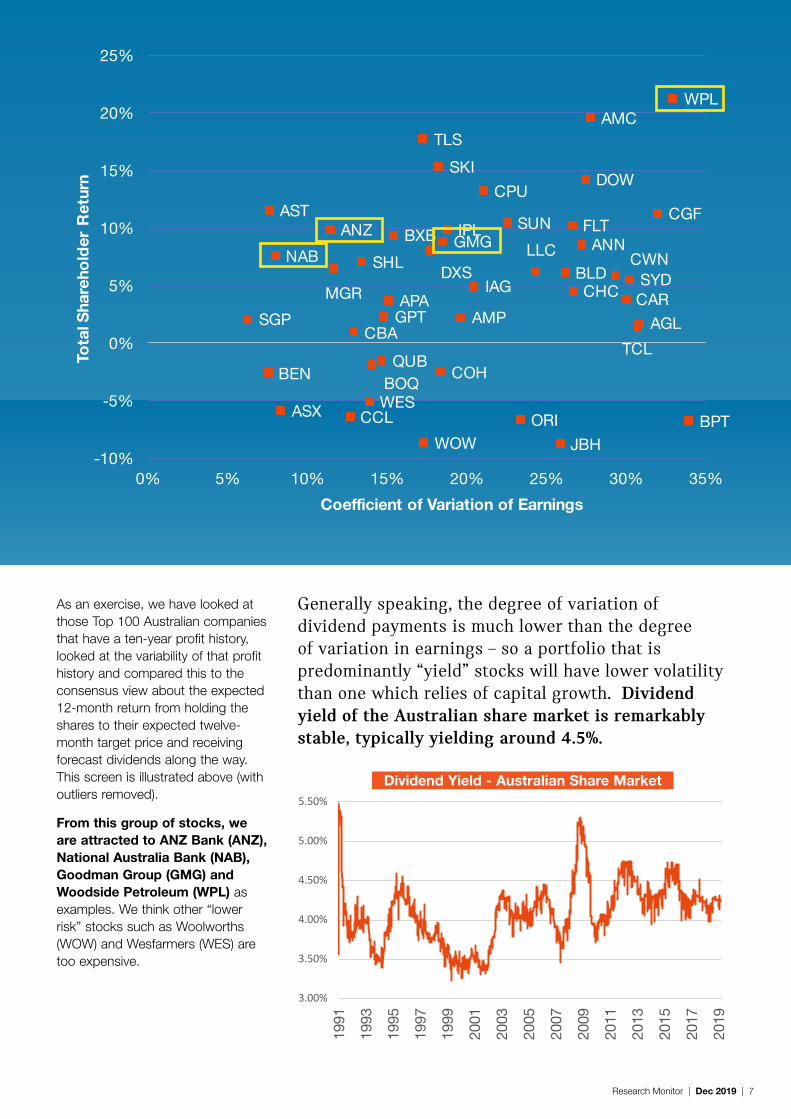
Generally speaking, the degree of variation of dividend payments is much lower than the degree of variation in earnings – so a portfolio that is predominantly “yield” stocks will have lower volatility than one which relies of capital growth. Dividend yield of the Australian share market is remarkably stable, typically yielding around 4.5%.
As an exercise, we have looked at those Top 100 Australian companies that have a ten-year profit history, looked at the variability of that profit history and compared this to the consensus view about the expected 12-month return from holding the shares to their expected twelve-month target price and receiving forecast dividends along the way. This screen is illustrated above (with outliers removed).
From this group of stocks, we are attracted to ANZ Bank (ANZ), National Australia Bank (NAB), Goodman Group (GMG) and Woodside Petroleum (WPL) as examples. We think other “lower risk” stocks such as Woolworths (WOW) and Wesfarmers (WES) are too expensive.
ESG (Environmental, Social and Governance) investing or sustainability/responsible investments have gathered increasing interest from asset managers, their clients, shareholders and society at large.
Shaw and Partners is part of EFG International, a global private banking group headquartered in Zurich. www.efginternational.com
EFG Asset Management (EFGAM) has been committed to integrating ESG considerations into its investment approach, as evidenced by the fact we are signatories to the PRI, as well as being involved with Swiss Sustainable Finance and CDP (Carbon Disclosure Projects). We believe that it is worthwhile to explain the reasoning behind our approach.
Investing is a question of risk and reward and one of the duties of every investor is to consider all the available information before making investments. By adding an ESG approach to traditional financial analysis, it can help to better evaluate opportunities and mitigate the risks associated with the investments. On the one hand we believe companies are in a better position to prosper when their activity creates value for all stakeholders, not only for shareholders. It’s our responsibility to accompany them in this direction. On the other, their stronger “licence to operate” improves the resilience to risks such as reputational, governance, social or operational ones.
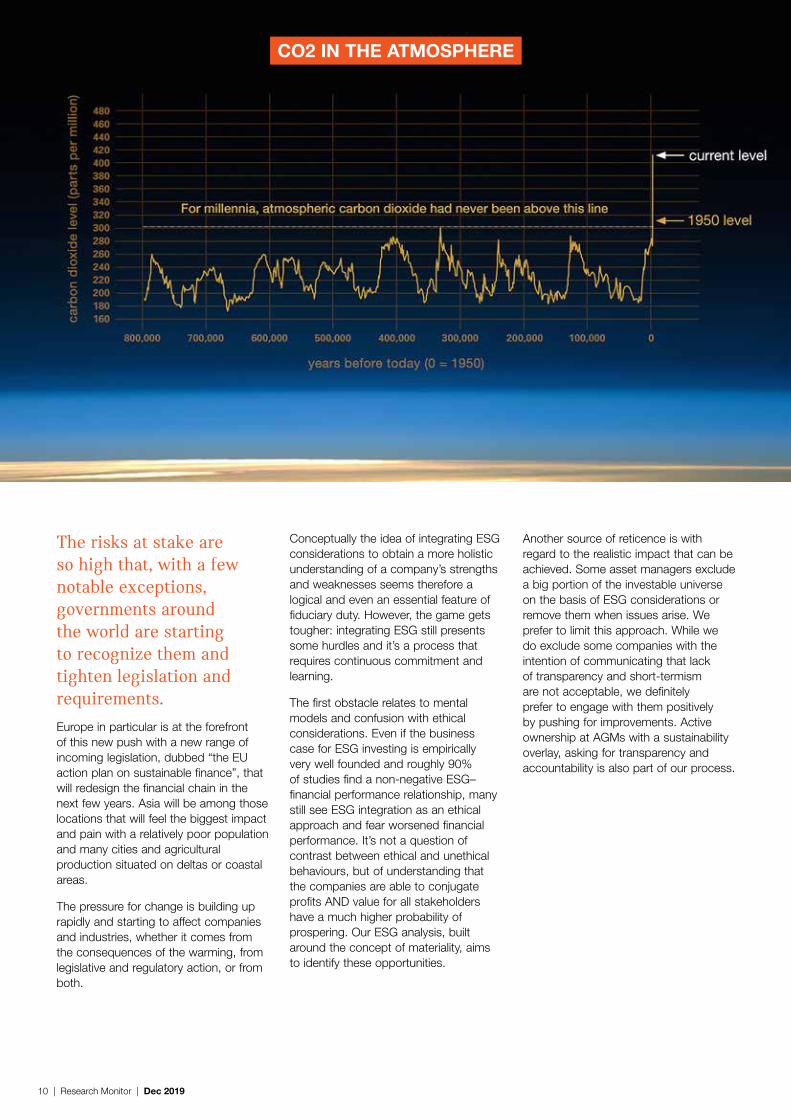
When thinking about particular risks, it is difficult not to consider the changing climate. For the last few decades the scientific community has been increasingly highlighting this danger, comparing its outcome with a nuclear conflict. Ignoring the warning is neither sensible nor correct.
As a consequence of human activity, CO2 in the atmosphere has substantially increased, causing temperatures to rise. Through a series of concatenated events this risks decimating biodiversity, putting our food supply at risk, exacerbating conflicts for water, land and forcing hundreds of millions of people to migrate with incalculable social and economic consequences.
Signatories to the Principle for Responsible Investments (PRI)
10 | Research Monitor | Dec 2019
CO2 IN THE ATMOSPHERE
The risks at stake are so high that, with a few notable exceptions, governments around the world are starting to recognize them and tighten legislation and requirements. Europe in particular is at the forefront of this new push with a new range of incoming legislation, dubbed “the EU action plan on sustainable finance”, that will redesign the financial chain in the next few years. Asia will be among those locations that will feel the biggest impact and pain with a relatively poor population and many cities and agricultural production situated on deltas or coastal areas.
The pressure for change is building up rapidly and starting to affect companies and industries, whether it comes from the consequences of the warming, from legislative and regulatory action, or from both.
Conceptually the idea of integrating ESG considerations to obtain a more holistic understanding of a company’s strengths and weaknesses seems therefore a logical and even an essential feature of fiduciary duty. However, the game gets tougher: integrating ESG still presents some hurdles and it’s a process that requires continuous commitment and learning.
The first obstacle relates to mental models and confusion with ethical considerations. Even if the business case for ESG investing is empirically very well founded and roughly 90% of studies find a non-negative ESG–financial performance relationship, many still see ESG integration as an ethical approach and fear worsened financial performance. It’s not a question of contrast between ethical and unethical behaviours, but of understanding that the companies are able to conjugate profits AND value for all stakeholders have a much higher probability of prospering. Our ESG analysis, built around the concept of materiality, aims to identify these opportunities.
Another source of reticence is with regard to the realistic impact that can be achieved. Some asset managers exclude a big portion of the investable universe on the basis of ESG considerations or remove them when issues arise. We prefer to limit this approach. While we do exclude some companies with the intention of communicating that lack of transparency and short-termism are not acceptable, we definitely prefer to engage with them positively by pushing for improvements. Active ownership at AGMs with a sustainability overlay, asking for transparency and accountability is also part of our process.
Research Monitor | Dec 2019 | 11
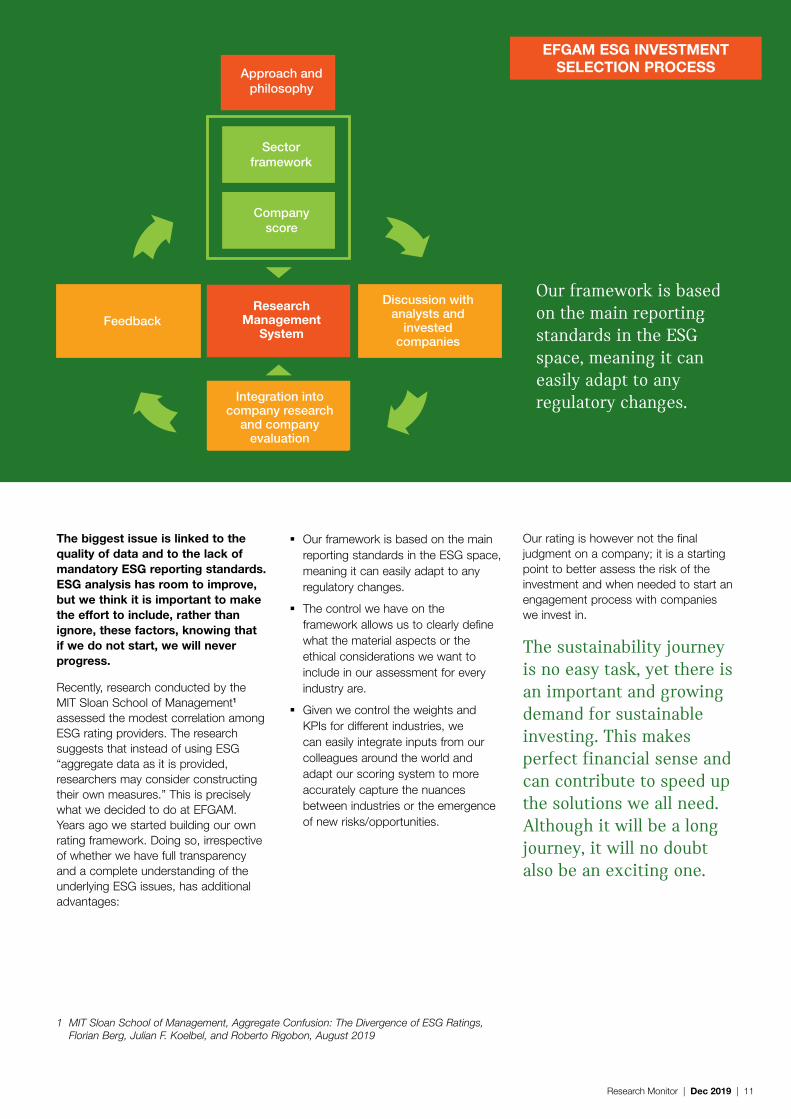
EFGAM ESG INVESTMENT SELECTION PROCESS
The biggest issue is linked to the quality of data and to the lack of mandatory ESG reporting standards. ESG analysis has room to improve, but we think it is important to make the effort to include, rather than ignore, these factors, knowing that if we do not start, we will never progress.
Recently, research conducted by the MIT Sloan School of Management1 assessed the modest correlation among ESG rating providers. The research suggests that instead of using ESG “aggregate data as it is provided, researchers may consider constructing their own measures.” This is precisely what we decided to do at EFGAM. Years ago we started building our own rating framework. Doing so, irrespective of whether we have full transparency and a complete understanding of the underlying ESG issues, has additional advantages:
Our framework is based on the main reporting standards in the ESG space, meaning it can easily adapt to any regulatory changes.
The control we have on the framework allows us to clearly define what the material aspects or the ethical considerations we want to include in our assessment for every industry are.
Given we control the weights and KPIs for different industries, we can easily integrate inputs from our colleagues around the world and adapt our scoring system to more accurately capture the nuances between industries or the emergence of new risks/opportunities.
Our rating is however not the final judgment on a company; it is a starting point to better assess the risk of the investment and when needed to start an engagement process with companies we invest in.
The sustainability journey is no easy task, yet there is an important and growing demand for sustainable investing. This makes perfect financial sense and can contribute to speed up the solutions we all need. Although it will be a long journey, it will no doubt also be an exciting one.
Our framework is based on the main reporting standards in the ESG space, meaning it can easily adapt to any regulatory changes.
1 MIT Sloan School of Management, Aggregate Confusion: The Divergence of ESG Ratings, Florian Berg, Julian F. Koelbel, and Roberto Rigobon, August 2019
Approach and philosophy
Sectorframework
Companyscore
ResearchManagement
System
Discussion with analysts and
invested companies
Feedback
Integration into company research
and company evaluation
12 | Research Monitor | Dec 2019
Perth office has moved toThe Shaw and Partners
YEARS IN THE MAKING
OFFICES IN SYDNEY MELBOURNE BRISBANE ADELAIDE CANBERRA PERTH
30+ 6OF ASSETS UNDER ADVICE
$18bn
INVESTMENT ADVISERS & FINANCIAL PLANNERS IN AUSTRALIA
STAFF AUSTRALIA WIDE
180+300
WATCH OUR CORPORATE VIDEO
Shaw and Partners is one of Australia’s preeminent investment and wealth management firms. With a national presence and over $18 billion of assets under advice, Shaw and Partners offers the intimacy of a boutique investment firm, backed by the resources and scale of a major financial group, EFG International.
Level 20, 108 St Georges TerracePerth WA 6000 Tel: 08 9263 5200
has the pleasure of inviting you to a global economic and market outlook
Developments in global capital markets, key convictions and themes for the coming months.
LIMITED SEATS AVAILABLE
Places are not guaranteed unless confirmed by your Shaw and Partners adviser. For any enquiries please contact us at www.shawandpartners.com.au/contact/email-us
Investing in a world with low interest rates.
CLICK HERE TO REGISTER YOUR INTEREST TO ATTEND
Please join Shaw and Partners for an evening of insights and thought provoking investment opportunities with our expert Research Analysts: Martin Crabb CIO, Peter O’Connor, Leanne Truong and Brett Le Mesurier.
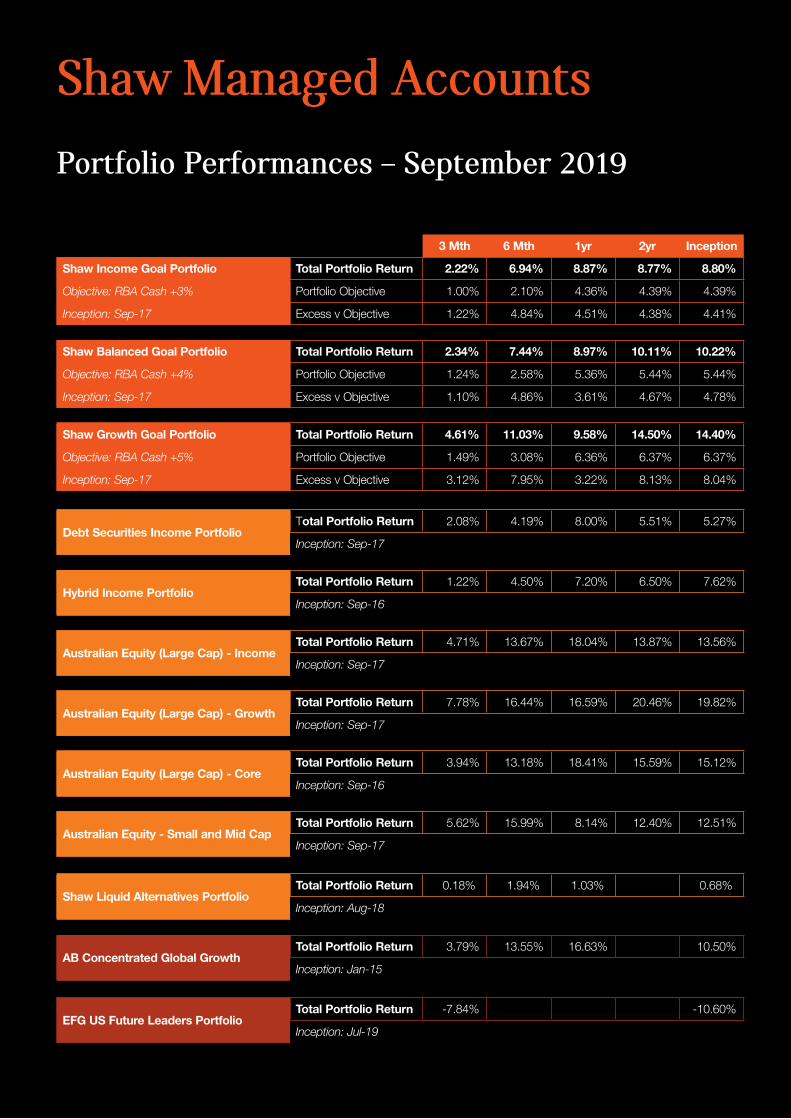
AB Concentrated Global GrowthTotal Portfolio Return 3.79% 13.55% 16.63% 10.50%
Inception: Jan-15
EFG US Future Leaders PortfolioTotal Portfolio Return -7.84% -10.60%
Inception: Jul-19
Shaw Managed Accounts
Research Monitor | Dec 2019 | 15
Click on the images below to download the marketing brochure and SMA Portfolio Factsheets. Download the marketing brochure here.
Shaw Managed Accounts
GOAL BASED PORTFOLIO
Shaw Income Goal Portfolio
Investment objective The primary objective of the Shaw Income Goal Portfolio is to provide a regular and sustainable income stream over the medium term (3–5 years) whilst minimising risk to capital. It achieves this by investing in a diversified portfolio of asset classes and strategies.
The strategy is designed to have a medium level of risk.
Investment Strategy and Approach The investment process combines quantitative and qualitative criteria and analysis to identify asset classes, markets, securities and strategies which have a focus toward producing sustainable income as opposed to capital growth.
The portfolio construction is based on macro-economic and thematic views of Shaw’s Research in order to best meet the risk and return objectives of the investment strategy.
The portfolio is a blend of the Shaw and Partners SMA strategic portfolios based on their suitability to the income objective. Each goals based portfolio has effectively its own asset and risk allocation managed by the Shaw Portfolio Strategies Team.
Asset classes and strategies may include cash, Australian debt securities, and Australian equities including property securities, international equities and alternative strategies (ETF and or managed funds).
Continual assessment and risk management of bottom-up and top-down parameters is a core component of the model. Changes to the portfolio will be made as deemed appropriate by the investment team in order for the portfolio to have a high probability of meeting its objectives in all market conditions. The investment process takes into consideration the risk around asset classes and the underlying securities, maintaining their income characteristics whilst ensuring that the risk of a drawdown is adequately managed. The Portfolio Managers however manage the capital value of the portfolio to minimise the risk of the portfolio failing to achieve its risk and return objectives.
Designed for investors who Seek income as the primary objective
and some capital appreciation from a broad range of Australian and Global asset classes and strategies
Have an investment horizon of three years or more
Accept the risk of volatility in their investment return.
Model Portfolio Details
Model Portfolio Manager Shaw and Partners Limited
Benchmark IndexRBA Cash rate +3% (Gross Income and Total Return)
Indicative Number of Securities, Stocks and/or Funds (ETF and Managed)40–100
Minimum Suggested Investment Time Frame3 years
Asset Allocation RangesShaw Debt Securities Income 0%–30%Shaw Hybrid Income 0%–35%Shaw Australian Equity Income (Large Cap) 0%–60%International Equity 0%–40%Liquid Alternatives 0%–40%Cash 0%–100%
Indicative Cash Holding3%
Minimum Model Investment$100,000
Management FeeInvestment Fee NilIndirect Cost Ratio 0.34% p.a.Performance Fee Nil
Shaw Managed Accounts
MODEL PORTFOLIO CODE
SP0009
Shaw Income Goal
ASSET CLASS PORTFOLIO
Shaw Debt Securities Income Portfolio
Investment objective The model invests in a portfolio of ASX listed debt and shorter dated hybrid securities, debt based ETFs and debt specialist managed funds. These products offer potential diversification benefits to both Australian equities and cash or term deposits.
The model’s return will be generated from a combination of interest payments and capital growth (realised and unrealised) from an actively managed portfolio strategy.
The Shaw Debt Income Portfolio seeks to provide investors with a predictable level of income whilst minimising risk to capital.
Investment Strategy and Approach The model manager aims to achieve the investment objectives via a qualitative and quantitative investment process. Key criteria and areas of focus are:
Credit quality of the issuer
Sector/Industry
Call dates and final maturity details
Structure of instrument
Timing and composition of cash flows
Relative valuation of sector as a whole and between relevant securities, including the inclusion of new issues
Liquidity and potential changes in liquidity.
The portfolio will be diversified across the above criteria. A key focus of the portfolio will be the mix of fixed and floating rate exposure in order to meet the portfolios’ objectives. The portfolio will be monitored against the manager’s expectations of equity returns, credit market implied volatilities and underlying interest rates in order to ensure it is invested across a range of market cycles to meet its return objective, while adhering to the risk tolerances set.
The model manager has access to new issues of listed debt securities and is able to include these in the portfolio as it deems appropriate.
Designed for investors who Seek a sustainable income stream over
a 3 year + time frame, with a lower risk of loss than equities, and a higher rate of return than cash like investments
Focus on minimising risk to capital and low volatility of returns.
Shaw Managed Accounts
Model Portfolio Details
Model Portfolio Manager Shaw and Partners Limited
Benchmark IndexRBA Cash rate +1.5%
Indicative Number of Securities, Stocks and/or Funds (ETF and Managed) 15–25
Minimum Suggested Investment Time Frame3 years
Asset Allocation RangesDebt and hybrid securities 70%–100%Cash 0%–100%
Indicative Cash Holding2%
Minimum Model Investment$5,000
Management FeeInvestment Fee NilIndirect Cost Ratio 0.28% p.a.Performance Fee Nil
MODEL PORTFOLIO CODE
SP0003
Shaw Debt Securities Income
ASSET CLASS PORTFOLIO
Shaw Australian Equity (Large Cap) Growth
Investment objective The primary objective of the Shaw Australian Equity (Large Cap) Growth Portfolio is to provide a level of capital appreciation over the longer term (5–7 years). The portfolio is tilted towards stocks that have superior earning growth capacity and focus is on the total return of each stock rather than the dividend income as the prime objective.
Investment Strategy and Approach The investment process combines quantitative and qualitative criteria and analysis to identify stocks which have a favourable outlook are likely to produce above average earnings growth with positive valuation characteristics.
The portfolio construction is based on macro-economic and thematic views of Shaw and Partners’ Research in order to best meet the risk and return objectives of the investment strategy.
Continual assessment and risk management of bottom-up and top-down parameters is a core component of the model. Changes to the portfolio will be made as deemed appropriate by the investment team in order for the portfolio to have a high probability of meeting its objectives.
The investment process takes into consideration the primary objective of capital growth. Although the portfolio will generate income, income focused stocks will be included if their total return criteria fits the portfolios objective.
Volatility of returns will be managed with the objective of a lower standard deviation of returns than the benchmark index.
Designed for investors who Seek long term capital growth as the
primary objective from an Australian equities portfolio and some income
Those investors in the accumulation phase
Have an investment horizon of five years or more
Accept the risk of share price volatility.
Model Portfolio Details
Model Portfolio Manager Shaw and Partners Limited
Benchmark IndexS&P/ASX 100 Accumulation Index
Indicative Number of Securities, Stocks and/or Funds (ETF and Managed) 10–30
Management FeeInvestment Fee NilIndirect Cost Ratio 0.00% p.a.Performance Fee Nil
MODEL PORTFOLIO CODE
SP0005
Shaw Managed Accounts
Shaw Australian Equity (Large Cap) Growth
GOAL BASED PORTFOLIO
Shaw Balanced Portfolio
Investment objective The primary objective of the Shaw Balanced Portfolio is to provide a regular and sustainable income stream and capital growth over the medium term (4–6 years), together with some capital growth whilst minimising risk to capital. It achieves this by investing in a diversified portfolio of asset classes and strategies.
The strategy is designed to have a moderate level of risk.
Investment Strategy and ApproachInvestment Strategy and Approach The investment process combines quantitative and qualitative criteria and analysis to identify asset classes, markets, securities and strategies which have a focus toward producing sustainable income and capital growth.
The portfolio construction is based on macro-economic and thematic views of Shaw’s Research in order to best meet the risk and return objectives of the investment strategy.
The portfolio is a blend of the Shaw and Partners SMA strategic portfolios based on their suitability to the Balanced portfolio objective. Each goals based portfolio has effectively its own asset and risk allocation managed by the Shaw Portfolio Strategies Team.
Asset classes and strategies may include cash, Australian debt securities, and Australian equities including property securities, international equities and alternative strategies (accessed via ASX listed ETFs and or managed funds).
Continual assessment and risk management of bottom-up and topdown parameters is a core component of the model. Changes to the portfolio will be made as deemed appropriate by the investment team in order for the portfolio to have a high probability of meeting its objectives in all market conditions. The investment process takes into consideration the risk around asset classes and the underlying securities maintaining their income and growth characteristics whilst ensuring that the risk of a drawdown is adequately managed. The Portfolio Managers however manage the capital value of the portfolio to minimise the risk of the portfolio failing to achieve its risk and return objectives.
Designed for investors who Seek a balance of income and capital
growth as the primary objective from a broad range of Australian and global asset classes and strategies
Have an investment horizon of four years or more
Accept a moderate risk of volatility in their investment return.
Model Portfolio Details
Model Portfolio Manager Shaw and Partners Limited
Benchmark IndexRBA Cash rate +4%(Gross Income and Total Return)
Indicative Number of Securities, Stocks and/or Funds (ETF and Managed)60–140
Minimum Suggested Investment Time Frame4 years
Asset Allocation RangesShaw Debt Securities Income 0%–50%Shaw Hybrid Income 0%–50%Shaw Australian Equity Core (Large Cap) 0%–60%Shaw Australian Equity Growth (Small and Mid-Cap) 0%–30%International Equity 0%–40%Liquid Alternatives 0%–40%Cash 0%–100%
Indicative Cash Holding3%
Minimum Model Investment$100,000
Management FeeInvestment Fee NilIndirect Cost Ratio 0.37% p.a.Performance Fee Nil
Shaw Managed Accounts
MODEL PORTFOLIO CODE
SP0008
Shaw Balanced Goal
ASSET CLASS PORTFOLIO
Shaw Hybrid Income Portfolio
Investment objective The model aims to invest in a portfolio of ASX listed debt and preference securities that offer diversification benefits to both Australian equities and cash or term deposits.
The model’s return will be generated from a combination of cash (interest payments and dividends), franking credits and capital growth (realised and unrealised) from an actively managed portfolio strategy.
The Shaw Hybrid Income Portfolio seeks to provide investors with a predictable level of income whilst minimising risk to capital.
Investment Strategy and Approach The model manager aims to achieve the investment objectives via a qualitative and quantitative investment process. Key criteria and areas of focus are:
Credit quality of the issuer
Sector/Industry
Call date, conversion dates and final maturity details
Structure of instrument
Timing and composition of cash flows
Relative valuation of sector as a whole and between relevant securities, including the inclusion of new issues
Liquidity and potential changes in liquidity.
The portfolio will be diversified across the above criteria. The portfolio will be monitored against the manager’s expectations of equity returns, credit market implied volatilities and underlying interest rates in order to ensure it is invested across a range of market cycles to meet its return objective, while adhering to the risk tolerances set.
The model manager has access to new issues of debt and preference securities and is able to include in the portfolio as it deems appropriate.
The model manager’s institutional market experience with this asset class brings specialist knowledge to pricing and liquidity. Active management of the portfolio will take advantage of relative mispricing between securities and the asset class as a whole, while taking into consideration the impact of any micro and macroeconomic factors. The ability to lock in gains will be a key feature of the strategy in achieving its objectives.
Designed for investors whoSeek a sustainable income stream (inclusive of franking credits) over a 3 year + time frame, with a lower risk of loss than equities, and a higher rate of return than cash like investments.
Model Portfolio Details
Model Portfolio Manager Shaw and Partners Limited
Benchmark IndexRBA Cash rate +3% (inclusive of franking credits)
Management FeeInvestment Fee NilIndirect Cost Ratio 0.00% p.a.Performance Fee Nil
Shaw Managed Accounts
MODEL PORTFOLIO CODE
SP0002
Shaw Hybrid Income
ASSET CLASS PORTFOLIO
Shaw Liquid Alternatives Portfolio
Investment objective The primary objective of the Shaw Liquid Alternatives Portfolio is to provide regular and sustainable income and capital growth over the medium term (3–5 years) whilst minimising risk to capital. It achieves this by investing in a diversified portfolio of asset classes and strategies that have low correlation with traditional equity and debt asset classes. This portfolio is designed to act as a volatility dampener and diversifier to an existing portfolio of liquid assets.
Investment Strategy and Approach The portfolio is a blend of strategies and investments that can be expected to have a lower correlation to equities, bonds and other traditional beta style investments. The portfolio was designed primarily to lower the downside variance of an income, balanced or growth portfolio that uses a mixture of bonds and equities to derive a given long term return. The strategies and managers chosen for the portfolio have a demonstrable track record of minimising risk to capital during downturns and when blended in the appropriate weights can significantly reduce the downside potential of a bond and equity portfolio.
Asset classes and strategies may include Global Macro, Managed Futures (Trends), Long/Short and Market Neutral, Commodities and Dynamic Markets.
Only managers/investments that have daily pricing and liquidity can be considered. Continual assessment and
research into alternative strategies and return streams is a core component of the model. Changes to the portfolio will be made as deemed appropriate by the investment team in order for the portfolio to have a high probability of meeting its objectives in all market conditions. The investment process takes into consideration the risk around asset classes and the underlying securities maintaining their growth characteristics whilst ensuring that the risk of a drawdown is adequately managed. The portfolio managers however manage the capital value of the portfolio to minimise the risk of the portfolio failing to achieve its risk and return objectives.
Designed for investors who Investors seeking sustainable and lower
volatility returns (mix of income and capital growth) as the primary objective that will be less impacted by large moves in underlying asset prices in traditional investments such as Equities and Bonds
As a standalone investment option, suitable for investors looking for a lower risk/lower return exposure that is not correlated with traditional asset class returns
Blended with a traditional income, balanced or growth portfolio to reduce drawdown and smooth returns
Investors should have an investment horizon of three years or more
Accept the risk of volatility in their investment return.
Model Portfolio Details
Model Portfolio Manager Shaw and Partners Limited
Benchmark IndexRBA Cash rate +3%
Indicative Number of Securities, Stocks and/or Funds (ETF and Managed)3–20
Minimum Suggested Investment Time Frame3 years
Asset Allocation RangesLiquid alternative assets 80%–100%Cash 0%–20%
Indicative Cash Holding2%
Minimum Model Investment$5,000
Management FeeInvestment Fee NilIndirect Cost Ratio 0.95% p.a.Performance Fee Nil
Shaw Managed Accounts
MODEL PORTFOLIO CODE
SP0011
Shaw Liquid Alternatives
GOAL BASED PORTFOLIO
Shaw Growth Goal Portfolio
Investment objective The primary objective of the Shaw Growth Goal Portfolio is to provide regular and sustainable capital growth over the longer term (5–7 years). It achieves this by investing in a diversified portfolio of asset classes and strategies. The strategy is designed to have a high level of risk. It achieves this by investing in a diversified portfolio of asset classes and strategies.
The strategy is designed to have a high level of risk.
Investment Strategy and Approach The investment process combines quantitative and qualitative criteria and analysis to identify asset classes, markets, securities and strategies which have a focus toward producing capital growth over and above income.
The portfolio construction is based on macro-economic and thematic views of Shaw’s Research in order to best meet the risk and return objectives of the investment strategy.
The portfolio is a blend of the Shaw and Partners SMA strategic portfolios based on their suitability to the growth objective. Each goals based portfolio has effectively its own asset and risk allocation managed by the Shaw Portfolio Strategies Team.
Asset classes and strategies may include cash, Australian debt securities, and Australian equities including property securities, international equities and alternative strategies (ETF and or managed funds).
Continual assessment and risk management of bottom-up and top-down parameters is a core component of the model. Changes to the portfolio will be made as deemed appropriate by the investment team in order for the portfolio to have a high probability of meeting its objectives in all market conditions. The investment process takes into consideration the risk around asset classes and the underlying securities maintaining their growth characteristics whilst ensuring that the risk of a drawdown is adequately managed. The Portfolio Managers however manage the capital value of the portfolio to minimise the risk of the portfolio failing to achieve its risk and return objectives.
Designed for investors who Seek capital growth as the primary
objective and some income from a broad range of Australian and global asset classes and strategies
Have an investment horizon of five years or more
Accept the risk of volatility in their investment return.
Model Portfolio Details
Model Portfolio Manager Shaw and Partners Limited
Benchmark IndexRBA Cash rate +5%
Indicative Number of Stocks per Asset Class Based Portfolio30–100
Minimum Suggested Investment Time Frame5 years
Asset Allocation RangesShaw Australian Equity Growth (Large Cap) 0%–80%Shaw Australian Equity Growth (Small and Mid-Cap) 0%–40%International Equity 0%–40%Liquid Alternatives 0%–40%Cash 0%–100%
Indicative Cash Holding3%
Minimum Model Investment$100,000
Management FeeInvestment Fee NilIndirect Cost Ratio 0.36% p.a.Performance Fee Nil
Shaw Managed Accounts
MODEL PORTFOLIO CODE
SP0010
Shaw Growth Goal
ASSET CLASS PORTFOLIO
Shaw Australian Equity (Large Cap) Income
Investment objective The primary objective of the Shaw Australian Equity Income (Large Cap) Portfolio is to provide a regular and sustainable fully franked dividend income stream over the medium term (3–5 years). It achieves this by investing in a portfolio of large-cap Australian listed companies and managed funds. Although the focus is yield generation, the investment process and risk management aims to ensure that risk to capital is minimised with the goal of some capital appreciation via both longer term price appreciation and actively locking in gains as deemed appropriate to the objectives.
Investment Strategy and Approach The investment process combines quantitative and qualitative criteria and analysis to identify stocks and strategies which have a relatively high dividend paying capability, and are likely to produce above average earnings growth with positive valuation characteristics.
The portfolio construction is based on macro-economic and thematic views of Shaw and Partners’ Research in order to best meet the risk and return objectives of the investment strategy.
Continual assessment and risk management of bottom-up and top-down parameters is a core component of the model. Changes to the portfolio will be made as deemed appropriate by the investment team in order for the portfolio to have a high probability of meeting its objectives. The investment process takes into consideration the risk around companies growing/maintaining their dividend characteristics with the result that this portfolio aims for a higher dividend yield than that of the broader market. The portfolio managers however manage the capital value of the portfolio to minimise the risk of the portfolio failing to achieve its risk and return objectives.
Designed for investors who Seek franked dividend income as the
primary objective from an Australian equities portfolio and some capital appreciation
Management FeeInvestment Fee NilIndirect Cost Ratio 0.25% p.a.Performance Fee Nil
Shaw Managed Accounts
MODEL PORTFOLIO CODE
SP0004
Shaw Australian Equity (Large Cap) Income
ASSET CLASS PORTFOLIO
AllianceBernstein Concentrated Global Growth
Investment objective The portfolio seeks long term growth of capital by investing in an actively managed concentrated portfolio of listed securities considered by the portfolio manager to be of very high quality issued by companies with predictable growth.
Investment Strategy and Approach The portfolio manager seeks to achieve the investment objective by composing a portfolio of highly liquid, listed securities of quality companies from the MSCI World universe. These companies are chosen for their specific growth and business characteristics, earnings development, financial position and experienced management.
Designed for investors who Are considered longer term investors (5
years +)
Seek exposure to a concentrated portfolio of high quality global equities with superior return potential with generally low turnover
Model Portfolio Details
Model Portfolio Manager AllianceBernstein
Benchmark IndexMSCI World Index
Indicative Number of Stocks per Asset Class Based Portfolio25–35
Investment objective To provide a return exceeding the MSCI US Mid Cap Growth TR index over rolling 10-year periods.
Investment DescriptionThe US Future Leaders Model is a concentrated US stock portfolio, designed to provide direct equity exposure to rapidly growing businesses with significant opportunity to develop into future mid- or large-cap companies, primarily via organic growth. Stocks are selected through a proprietary in-house systematic framework. The team’s objective is to identify the highest quality, fastest growing companies and trade them at the right time by adhering to a structured investment process. By identifying these Future Leaders early, they believe the portfolio will afford investors with the opportunity to earn superior long-term returns. Portfolio construction will be rooted in our fundamentally based investment philosophy and process – with a focus on the four primary growth sectors of the economy (technology, healthcare, consumer discretionary, and financial services).
Investment Strategy and ApproachThe US Growth Equity team employs a rigorous, disciplined, and repeatable process that is a combination of both qualitative and quantitative inputs. The basis of the process starts with industry centric research performed by the sector experts on the team.
The investment framework is defined by a disciplined investment process consisting of several checklists. This ensures that the investment process used by the team is consistent and repeatable. The investment process has four key inputs that determine a company’s overall ranking and can be applied across all sectors to facilitate stock selection:
1. Company Quality Grade
2. Stock Technical Timing Grade
3. Short Term Earnings Growth Grade
4. Long Term Earnings Growth Grade
The team’s investment framework is the basis for portfolio construction. This regimented process helps to consistently find and own the best quality companies. Value is added through active management by identifying the best companies in the growth universe, then owning (or adding to) them when they are timely and selling (or trimming) them when they are not.
Designed for investors who Are interested in emerging leader
growth stocks;
Are sophisticated investors with long-term investment horizons (5+ years);
Investment objective The objective of the Shaw Australian Equity (Large Cap) Core Portfolio is to provide regular income, capital appreciation and out performance of the S&P/ASX 100 Accumulation Index over the medium term (3–5 years) through investment in large cap shares listed in Australia.
Investment Strategy and Approach Shaw and Partners’ Investment Process combines quantitative and qualitative criteria and analysis to identify stocks likely to produce above average earnings growth with positive valuation characteristics.
The portfolio construction is based on macro-economic and thematic views of Shaw and Partners’ Research in order to best meet the risk and return objectives of the investment strategy. Continual assessment and risk management of bottom-up and top-down parameters is a core component of the Model. Changes to the portfolio will be made as deemed appropriate by the investment team in order for the portfolio to have a high probability of meeting its objectives.
The Investment Process takes into consideration the yield and capital growth objectives of the portfolio and ensures that both are managed simultaneously to ensure that the portfolio is not overly skewed to any style or thematic that would increase the risk of the portfolio failing to meet its objectives.
Designed for investors who Seek exposure to an Australian share
portfolio that provides a franked income stream and capital appreciation
Management FeeInvestment Fee NilIndirect Cost Ratio 0.00% p.a.Performance Fee Nil
Shaw Managed Accounts
MODEL PORTFOLIO CODE
SP0001
Shaw Australian Equity (Large Cap) Core
ASSET CLASS PORTFOLIO
Shaw Australian Equity (Small and Mid-Cap) Growth
Investment objective The primary objective of the Shaw Australian Equity (Small and Mid-Cap) Growth Portfolio is to provide a level of capital appreciation over the longer term (5–7 years). The portfolio is tilted towards small and mid-sized stocks that have superior earning growth capacity and focus is on the total return of each stock rather than the dividend income as the prime objective.
Investment Strategy and Approach The investment process combines quantitative and qualitative criteria and analysis to identify stocks which have a relatively high dividend paying capability are likely to produce above average earnings growth with positive valuation characteristics.
The portfolio construction is based on macro-economic and thematic views of Shaw and Partners’ Research in order to best meet the risk and return objectives of the investment strategy.
Continual assessment and risk management of bottom-up and top-down parameters is a core component of the model. Changes to the portfolio will be made as deemed appropriate by the investment team in order for the portfolio to have a high probability of meeting its objectives.
The investment process takes into consideration the primary objective of capital growth. It aims to invest in companies where the share price does not fully reflect the potential value of the underlying business of the company.
Designed for investors who Seek long term capital growth as the
primary objective from and Australian equities portfolio and some income
Those investors in the accumulation phase
Have an investment horizon of five years or more
Accept the risk of share price volatility.
Model Portfolio Details
Model Portfolio Manager Shaw and Partners Limited
Benchmark IndexS&P/ASX Small Ordinaries Accumulation Index
Indicative Number of Securities, Stocks and/or Funds (ETF and Managed)15–30
Our Large Cap Model Portfolio performed well in both an absolute and relative sense in September. Benchmarked against the S&P/ASX100 index, the portfolio returned 3.9% for the month, outperforming the index by 2.1%. This month we position the portfolio for a continued slowdown in global growth momentum and dial back a few of our overweights. We add Goodman Group (GMG) and Oil Search (OSH) to the portfolio.
The Australian share market – as measured by the ASX100 index, rose 1.83% in September, led by solid returns from technology stocks such as Afterpay Touch (APT) up 15.8% and double digit returns from selected materials and cyclicals such as Boral (BLD), Iluka Resources (ILU), James Hardie (JHX), Oil Search (OSH) and Fortescue Metals (FMG). Dragging the chain were the Telecommunications and Healthcare sectors, as 10-year government bond yields rose from 0.88% to 0.94% but were as high as 1.15% midmonth.
SECTOR HIGHLIGHTS
Energy Boost. This month we significantly increase our weighting to Energy names. Although the attacks on Saudi Arabian oilfield infrastructure seems to have only briefly impact world oil supply, the potential for further escalation in the Gulf cannot be ruled out and this represents a real and present “tail risk” to world markets. Given the relatively attractive valuations of energy stocks, (~10x PE), we see this is a prudent portfolio hedge and add Oil Search (OSH) back to the portfolio and top-up our Santos (STO) and Woodside (WPL) exposures as well.
CHANGES
Out with WES. Following our analyst, Danny Younis’ downgrade of Wesfarmers (WES) from hold to sell, our portfolio rules stipulate that we remove the stock from the portfolio. We also trim Lend Lease (LLC) after a period of
Australian Large Cap Model Portfolio
strong performance and dial back our macro-play on shopping centres as it seems unlikely that even zero interest rates and tax cuts will spur the Aussie consumer. Following a strong upward price move in anticipation of better performance under incoming CEO Ross McEwan, we trim our NAB position by 2%, remaining overweight the stock and sector.
The slowdown in global growth is likely to remain front and centre of investor’s minds for the next month as we head into the last quarter of the year. The apparent weakness in global trade activity is unlikely to be reversed in the short term and this will keep some downward pressure on the earnings expectations of the miners and other industrial cyclical stocks. We pare Rio Tinto (RIO) and add the more defensive and attractively priced growth stock Goodman Group (GMG) following our recent initiation report.
Additions Reductions
GMG 5.00 LLC (1.36)
OSH 3.00 RIO (2.00)
STO 1.50 VCX (2.00)
WPL 1.00 NAB (2.00)
WES (3.14)
10.50 (10.50)
RECOMMENDATION
It is hard to get excited about the prospects for the overall Australian share market, but once we dig into the weeds we can find enough compelling ideas to build a well-diversified portfolio capable of generating reasonable returns (10.9% on our estimates). We remain underweight Australian shares in a balanced portfolio setting and look for a pull-back in the market to put more capital to work. In the meantime, our portfolio should generate reasonable income returns (5.2%, 70% franked on our estimates).
MARKET PERFORMANCE
More sectors outperformed in September than underperformed, with only the large defensive sectors (REITs, Telcos, Healthcare) dragging the market down. Clearly there was rotation amongst investors who started to bid long term bond yields higher over the month, both in Australia and globally. At the start of September, US 10-year bonds were yielding 1.45% and by September 13th they had exceeded 1.9%. This sharp selloff in bonds spilled over into equity markets, causing interest-rate sensitive defensive stocks to perform poorly.
September was also a big month for dividends, with 38 of the top 100 stocks trading exdividend. We estimate that these 38 stocks paid $10.2bn in dividends in September, and another $3.4bn in franking credits. This equates to a yield for the month of 0.58% (0.77% including franking). The largest cash dividend was paid by BHP, at $3.35bn.
PORTFOLIO PERFORMANCE
The absolute and relative portfolio returns were exceptional in September at +4% and +2%. We would not expect to repeat this performance every month, particularly in current market conditions. Sector allocations (overweight banks, underweight healthcare and telco) added 90 basis points to returns and stock selection (banks, food, materials, real estate) added 125 points.
This month we position the portfolio for a continued slowdown in global growth momentum and dial back a few of our overweights.
Research Monitor | Dec 2019 | 17
Portfolio Performance (Accumulation Basis)
Model Portfolio at September 2019
WBC Westpac Banking 9.7%
BHP BHP Group Ltd 8.3%
NAB National Australia Bank 7.8%
ANZ ANZ 6.8%
WPL Woodside Petroleum Ltd 6.6%
SCG Scentre Group 5.4%
GMG Goodman Group 5.1%
STO Santos Limited 5.0%
LLC Lendlease Group 4.8%
CBA Commonwealth Bank 4.5%
FLT Flight Centre Travel Group 4.5%
MQG Macquarie Group Limited 4.2%
COL Coles Group 3.7%
FMG Fortescue Metals Group 3.3%
OSH Oil Search Limited 3.0%
SUN Suncorp Group Limited 2.9%
EVN Evolution Mining Limited 2.8%
NST Northern Star Resources 2.8%
RIO Rio Tinto Limited 2.5%
SGP Stockland 2.4%
VCX Vicinity Centres 2.3%
ILU Iluka Resources Limited 1.6%
Portfolio ASX 100 Index
1.00
1.10
1.20
1.30
1.40
1.50
1.60
1.70
1.80
1.90
2.00
2.10
2.20
Dec
-12
Sep-
13
Jun-
14
Mar
-15
Dec
-15
Sep-
16
Jun-
17
Mar
-18
Dec
-18
Sep-
19
18 | Research Monitor | Dec 2019
Macquarie Group (MQG) offers banking, financial advisory, investment and funds management services. The company offers financial advice, cash management, wealth management and private banking, life insurance, securities brokerage, corporate debt financing, real estate funds management, real estate development financing, investment funds management and foreign exchange services.
Westpac Banking Corporation (WBC) provides a broad range of consumer, business and institutional banking and wealth management services through a portfolio of financial services brands and businesses.
Alumina (AWC) owns 40% of the world’s largest alumina business, Alcoa World Alumina and Chemicals (AWAC) the recognised industry leader. The JV partner Alcoa manages the day-to-day operations of AWAC. AWAC is a low-cost producer and many of its operations are positioned in the lower-cost quartiles.
Fortescue Metals Group (FMG) operates as an iron ore production and sea-borne trading company. It is engaged in the mining of iron ore from its Cloudbreak and Christmas Creek mine sites; and the operation of an integrated mine, rail and port supply chain. The company’s projects include Chichester Hub, Solomon Hub, Herb Elliott Port and Rail Expansion.
Santos (STO) is an Australian oil and gas exploration company. Its key operations are onshore SA Cooper Basin, PNG LNG, Gladstone LNG , Darwin LNG and various gas and oil fields offshore WA.
Woodside Petroleum (WPL) explores for and produces oil and gas from offshore and onshore facilities located in Western Australia and the Northern Territory. The Company operates numerous oil and gas fields and pipelines throughout Australia, the United States and Mauritania. Its products include liquefied natural gas, domestic gas, condensate, crude oil and liquefied petroleum gas.
Centuria Industrial REIT (CIP)operates as a property investment, which acquires and manages industrial properties within Australia. It owns a portfolio of industrial real estate assets delivering stable and predictable rental income with opportunities for value uplift through diligent asset management and repositioning strategies.
Goodman Group (GMG) engages in the development, owning, and management of industrial property and business space. The company involves in the investment in directly and indirectly held industrial property, investment management, property services, and property development. It operates through the following geographical segments: Australia and New Zealand, Asia, Continental Europe, United Kingdom and America.
Stock recommendations
Research Monitor | Dec 2019 | 19
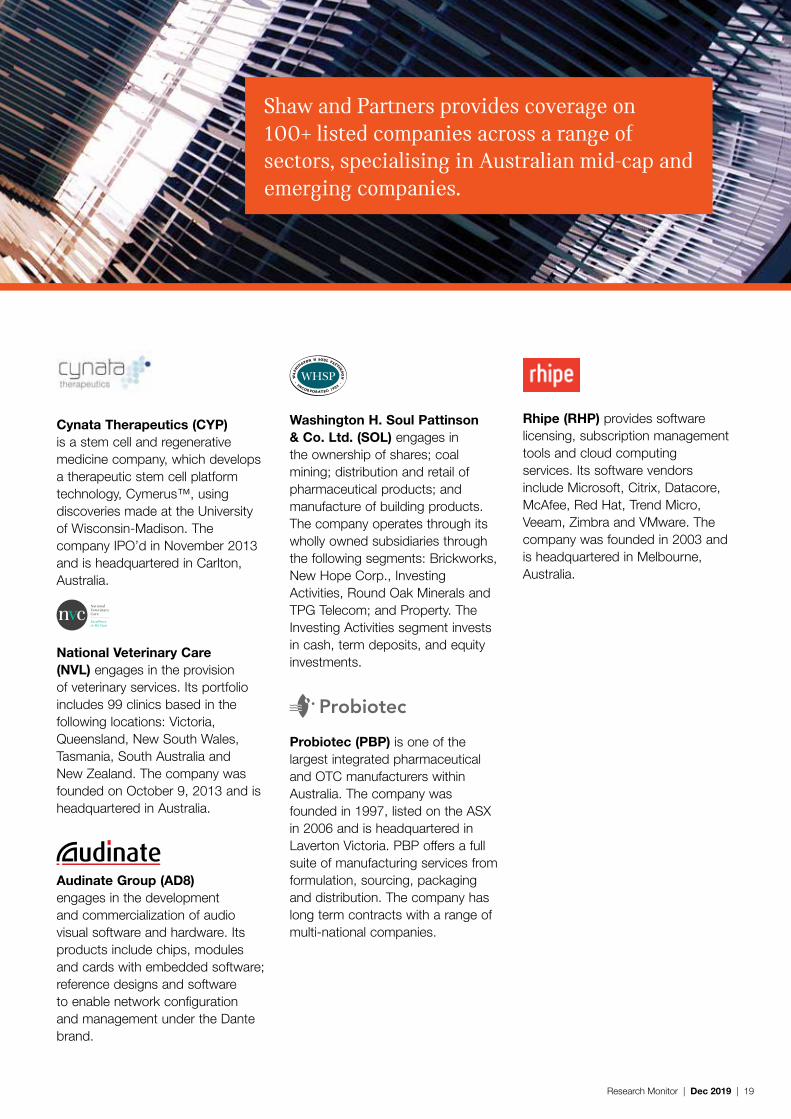
Shaw and Partners provides coverage on 100+ listed companies across a range of sectors, specialising in Australian mid-cap and emerging companies.
Cynata Therapeutics (CYP) is a stem cell and regenerative medicine company, which develops a therapeutic stem cell platform technology, Cymerus™, using discoveries made at the University of Wisconsin-Madison. The company IPO’d in November 2013 and is headquartered in Carlton, Australia.
National Veterinary Care (NVL) engages in the provision of veterinary services. Its portfolio includes 99 clinics based in the following locations: Victoria, Queensland, New South Wales, Tasmania, South Australia and New Zealand. The company was founded on October 9, 2013 and is headquartered in Australia.
Audinate Group (AD8) engages in the development and commercialization of audio visual software and hardware. Its products include chips, modules and cards with embedded software; reference designs and software to enable network configuration and management under the Dante brand.
Washington H. Soul Pattinson & Co. Ltd. (SOL) engages in the ownership of shares; coal mining; distribution and retail of pharmaceutical products; and manufacture of building products. The company operates through its wholly owned subsidiaries through the following segments: Brickworks, New Hope Corp., Investing Activities, Round Oak Minerals and TPG Telecom; and Property. The Investing Activities segment invests in cash, term deposits, and equity investments.
Probiotec (PBP) is one of the largest integrated pharmaceutical and OTC manufacturers within Australia. The company was founded in 1997, listed on the ASX in 2006 and is headquartered in Laverton Victoria. PBP offers a full suite of manufacturing services from formulation, sourcing, packaging and distribution. The company has long term contracts with a range of multi-national companies.
Rhipe (RHP) provides software licensing, subscription management tools and cloud computing services. Its software vendors include Microsoft, Citrix, Datacore, McAfee, Red Hat, Trend Micro, Veeam, Zimbra and VMware. The company was founded in 2003 and is headquartered in Melbourne, Australia.
20 | Research Monitor | Dec 2019
Heading towards lower growth
The implementation of the new capital treatment on unmargined derivative exposures from 1 July this year has increased MQG’s capital requirements by $600m. This has coincided with MQG making significant new investments in windfarms in East Anglia, southern Norway and Taiwan. In total, MQG’s capital requirements have increased by $1.6bn in 2Q20 but its internal capital generating capability is approximately $250m per quarter, hence the capital shortfall.
MQG said that it had $5bn of group surplus capital at 30/6/19 and yet an additional $1.6bn capital requirement in 2Q20 has led to a $1bn capital raising. It would appear MQG’s definition of surplus does not include the concept of freely available to invest in the growth in the business. This suggests it’s only available to support the existing business.
The additional capital requirements in 1H20 are only slightly larger than 1H19. MQG said that they had surplus capital of $4.2bn at the start of 1H19 compared to $6.1bn at the start of 1H20. There was no ordinary equity raising in 1H19 and the starting capital position was weaker for 1H19 than 1H20. Perhaps, they knew that large asset sales were likely to occur in 2H19, whereas that appears not to be the case for 2H20. This is consistent with the guidance which says that 1H20 profit is to be approximately 10% higher than 1H19 but FY20 profit is likely to be slightly lower than FY19.
Macquarie (MQG)
Recommendation Buy
Risk High
Share Price (as at 11 Oct 2019) $129.39
Target Price $130.00
Analyst Brett Le Mesurier
Share Performance Chart
Source: FactSet, Shaw and Partners
1 mth 3 mth 12 mth
Relative Performance* 0.7% 1.9% 12.0%
* Relative Performance is compared to the S&P/ASX 200 Index
The following factors impact net interest income growth: 1% loan growth is expected from 31/3/19 to 30/9/19, which includes similar rates of low growth from home and business loans; and NIM is forecast to be stable from 1H19 to 2H19, excluding customer remediation, because the decline in the cash/bill spread should offset higher discounting and more switching from interest only to P&I loans.
Commissions and lending fees are forecast to decline from 1H19 to 2H19. There should be a rebound in the insurance result since 1H19 was adversely affected by weather events but wealth income should decline by $45m as a result of the exit from advice which was announced at the end of 1H19.
WBC has a target of a 1% reduction in business as usual expenses from 1H19 to 2H19. Customer remediation expenses are likely to continue as WBC finds the task is more expensive than initially hoped.
WBC’s net write-offs for corporate, business and specialised lending totalled $39m in the first 9 months of FY19 against exposure of $274B. Specific provisions are $276m for this category which represents 49% of impairments.
Consumer exposures are more problematic. Australian home loan 90+ day delinquencies increased from 82 bps of loans at 31/3/19 to 90 bps of loans at 30/6/19. Unsecured consumer 90+ day delinquencies increased from 1.87% at 31/3/19 to 1.91% at 30/6/19. The bad debt charge is forecast to be $400m in 2H19 compared to $333m in 1H19.
Westpac (WBC)
Recommendation Buy
Risk Medium
Share Price (as at 11 Oct 2019) $28.75
Target Price $29.00
Analyst Brett Le Mesurier
Share Performance Chart
Source: FactSet, Shaw and Partners
1 mth 3 mth 12 mth
Relative Performance* -2.9% 2.8% 9.4%
* Relative Performance is compared to the S&P/ASX 200 Index
Negative share price divergence vs commodity price
AWC’s 1H19 result commentary included several points that piqued our interest;
The tight Western world alumina market conditions of 2018 have subsided in the first half of 2019 as curtailed supply came back on stream and new refineries ramped up. Against this backdrop AWC reduced production costs which contributed to cash margins in the half of over $150 per tonne despite lower alumina prices.
We expect a modest alumina surplus for the rest of 2019. At the current alumina price of around US$300 per tonne AWC’s low cost assets generate a cash margin of about $80 per tonne. 1H19 alumina margin was US$157/t a decline of $32/t from 2018 at ~$200/t”
AWC share price vs alumina conversion margin highlights a handy correlation. Not surprising really given commodity company share prices follow the underlying commodity price (typical Rsq >+0.9x), which correlates to spot EBITDA trend and spot NPV trend ... so no surprises that the cash margin should follow suit.
We applied an arbitrary cash cost over the time period (~US$220/t). We have made some allowances for notional cost changes – AUD depreciation is picked up in A$/t margin, caustic coda price decline not factored in but would modestly close the gap, energy (swings and roundabouts really).
A GAP has opened between the share price (staying/going higher) and the conversion margin heading lower. Using our KISS principle analysis suggests (i) Alumina price needs to be US$500-550/t ((spot ~$290/t) or (ii) AWC share price should be heading for A$1.50/sh.
Alumina (AWC)
Recommendation Sell
Risk High
Share Price (as at 11 Oct 2019) $2.25
Target Price $1.99
Analyst Peter O'Connor
Share Performance Chart
Source: FactSet, Shaw and Partners
1 mth 3 mth 12 mth
Relative Performance* -5.9% -2.2% -13.8%
* Relative Performance is compared to the S&P/ASX 200 Index
The journey continues ... debt deleveraging and growth
An evolutionary and sometimes revolutionary journey that has been underscored by the stewardships of two different CEO/CFO teams – highlighting that beyond the personalities there is a culture that runs deep. Culture can’t be acquired it is developed and fostered.
The debt reduction, refinancing journey continues at FMG taking gross debt to the lowest since the latest expansion phase. FMG announced the successful completion of the US$600m offering of Senior Unsecured Notes at an interest rate of 4.5%, maturing 15 September 2027. Proceeds will be applied to the partial repayment of US$600m of the outstanding US$1.4bn 2022 Syndicated Term Loan.
Improves tenor & reduces annual instalments. FMG has a financing runway which remains clear to CY2022 and spreads the debt portfolio over the five year period to 2027. FMG will have no debt retirement >US$750m in any one year 2022-27.
Cost of debt expected to be broadly similar – FMG’s current weighted average cost of debt is ~5% and we expect minimal change post the current refinance. But as mentioned above the key benefits of the current rejig are (i) extension of maturities (ii) reduce annual retirements to <US$750m and (iii) current capex plans (Eliwana and Ironbridge) to be essentially cash funded over the next few years.
Fortescue is spending $US3.37bn on new mines over the next three years and, although it has no debt repayments due next year or in 2021, it was facing $US2.15 billion of repayments in 2022 before Friday’s refinancing. That is now just $750m.
Fortescue (FMG)
Recommendation Buy
Risk High
Share Price (as at 11 Oct 2019) $8.81
Target Price $9.50
Analyst Peter O'Connor
Share Performance Chart
Source: FactSet, Shaw and Partners
1 mth 3 mth 12 mth
Relative Performance* 0.5% 0.5% 151.0%
* Relative Performance is compared to the S&P/ASX 200 Index
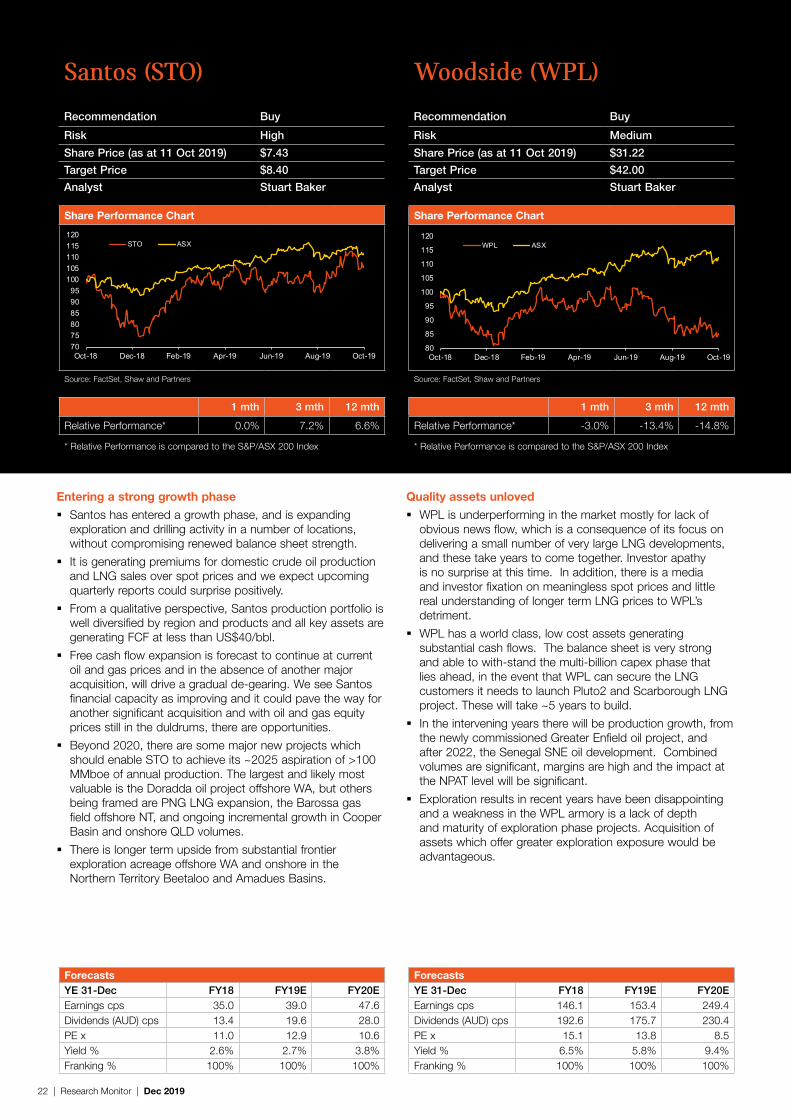
Santos has entered a growth phase, and is expanding exploration and drilling activity in a number of locations, without compromising renewed balance sheet strength.
It is generating premiums for domestic crude oil production and LNG sales over spot prices and we expect upcoming quarterly reports could surprise positively.
From a qualitative perspective, Santos production portfolio is well diversified by region and products and all key assets are generating FCF at less than US$40/bbl.
Free cash flow expansion is forecast to continue at current oil and gas prices and in the absence of another major acquisition, will drive a gradual de-gearing. We see Santos financial capacity as improving and it could pave the way for another significant acquisition and with oil and gas equity prices still in the duldrums, there are opportunities.
Beyond 2020, there are some major new projects which should enable STO to achieve its ~2025 aspiration of >100 MMboe of annual production. The largest and likely most valuable is the Doradda oil project offshore WA, but others being framed are PNG LNG expansion, the Barossa gas field offshore NT, and ongoing incremental growth in Cooper Basin and onshore QLD volumes.
There is longer term upside from substantial frontier exploration acreage offshore WA and onshore in the Northern Territory Beetaloo and Amadues Basins.
Santos (STO)
Recommendation Buy
Risk High
Share Price (as at 11 Oct 2019) $7.43
Target Price $8.40
Analyst Stuart Baker
Share Performance Chart
Source: FactSet, Shaw and Partners
1 mth 3 mth 12 mth
Relative Performance* 0.0% 7.2% 6.6%
* Relative Performance is compared to the S&P/ASX 200 Index
WPL is underperforming in the market mostly for lack of obvious news flow, which is a consequence of its focus on delivering a small number of very large LNG developments, and these take years to come together. Investor apathy is no surprise at this time. In addition, there is a media and investor fixation on meaningless spot prices and little real understanding of longer term LNG prices to WPL’s detriment.
WPL has a world class, low cost assets generating substantial cash flows. The balance sheet is very strong and able to with-stand the multi-billion capex phase that lies ahead, in the event that WPL can secure the LNG customers it needs to launch Pluto2 and Scarborough LNG project. These will take ~5 years to build.
In the intervening years there will be production growth, from the newly commissioned Greater Enfield oil project, and after 2022, the Senegal SNE oil development. Combined volumes are significant, margins are high and the impact at the NPAT level will be significant.
Exploration results in recent years have been disappointing and a weakness in the WPL armory is a lack of depth and maturity of exploration phase projects. Acquisition of assets which offer greater exploration exposure would be advantageous.
Woodside (WPL)
Recommendation Buy
Risk Medium
Share Price (as at 11 Oct 2019) $31.22
Target Price $42.00
Analyst Stuart Baker
Share Performance Chart
Source: FactSet, Shaw and Partners
1 mth 3 mth 12 mth
Relative Performance* -3.0% -13.4% -14.8%
* Relative Performance is compared to the S&P/ASX 200 Index
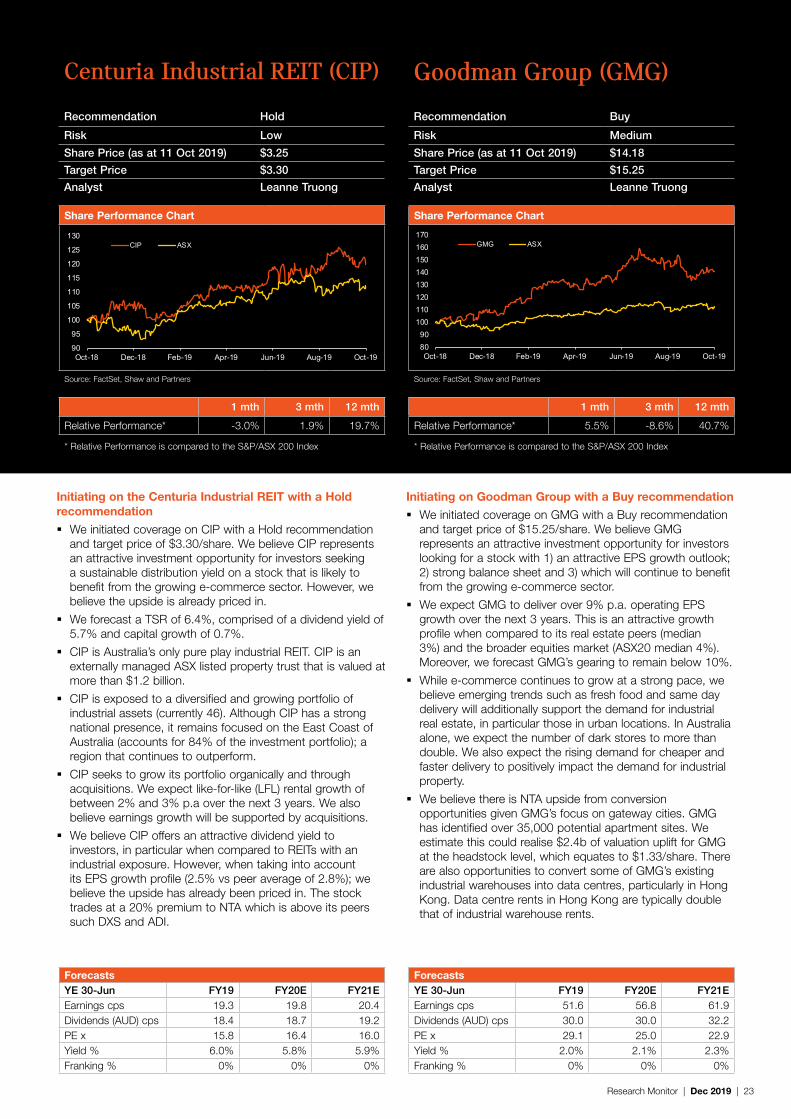
Initiating on the Centuria Industrial REIT with a Hold recommendation
We initiated coverage on CIP with a Hold recommendation and target price of $3.30/share. We believe CIP represents an attractive investment opportunity for investors seeking a sustainable distribution yield on a stock that is likely to benefit from the growing e-commerce sector. However, we believe the upside is already priced in.
We forecast a TSR of 6.4%, comprised of a dividend yield of 5.7% and capital growth of 0.7%.
CIP is Australia’s only pure play industrial REIT. CIP is an externally managed ASX listed property trust that is valued at more than $1.2 billion.
CIP is exposed to a diversified and growing portfolio of industrial assets (currently 46). Although CIP has a strong national presence, it remains focused on the East Coast of Australia (accounts for 84% of the investment portfolio); a region that continues to outperform.
CIP seeks to grow its portfolio organically and through acquisitions. We expect like-for-like (LFL) rental growth of between 2% and 3% p.a over the next 3 years. We also believe earnings growth will be supported by acquisitions.
We believe CIP offers an attractive dividend yield to investors, in particular when compared to REITs with an industrial exposure. However, when taking into account its EPS growth profile (2.5% vs peer average of 2.8%); we believe the upside has already been priced in. The stock trades at a 20% premium to NTA which is above its peers such DXS and ADI.
Centuria Industrial REIT (CIP)
Recommendation Hold
Risk Low
Share Price (as at 11 Oct 2019) $3.25
Target Price $3.30
Analyst Leanne Truong
Share Performance Chart
Source: FactSet, Shaw and Partners
1 mth 3 mth 12 mth
Relative Performance* -3.0% 1.9% 19.7%
* Relative Performance is compared to the S&P/ASX 200 Index
Initiating on Goodman Group with a Buy recommendation
We initiated coverage on GMG with a Buy recommendation and target price of $15.25/share. We believe GMG represents an attractive investment opportunity for investors looking for a stock with 1) an attractive EPS growth outlook; 2) strong balance sheet and 3) which will continue to benefit from the growing e-commerce sector.
We expect GMG to deliver over 9% p.a. operating EPS growth over the next 3 years. This is an attractive growth profile when compared to its real estate peers (median 3%) and the broader equities market (ASX20 median 4%). Moreover, we forecast GMG’s gearing to remain below 10%.
While e-commerce continues to grow at a strong pace, we believe emerging trends such as fresh food and same day delivery will additionally support the demand for industrial real estate, in particular those in urban locations. In Australia alone, we expect the number of dark stores to more than double. We also expect the rising demand for cheaper and faster delivery to positively impact the demand for industrial property.
We believe there is NTA upside from conversion opportunities given GMG’s focus on gateway cities. GMG has identified over 35,000 potential apartment sites. We estimate this could realise $2.4b of valuation uplift for GMG at the headstock level, which equates to $1.33/share. There are also opportunities to convert some of GMG’s existing industrial warehouses into data centres, particularly in Hong Kong. Data centre rents in Hong Kong are typically double that of industrial warehouse rents.
Goodman Group (GMG)
Recommendation Buy
Risk Medium
Share Price (as at 11 Oct 2019) $14.18
Target Price $15.25
Analyst Leanne Truong
Share Performance Chart
Source: FactSet, Shaw and Partners
1 mth 3 mth 12 mth
Relative Performance* 5.5% -8.6% 40.7%
* Relative Performance is compared to the S&P/ASX 200 Index
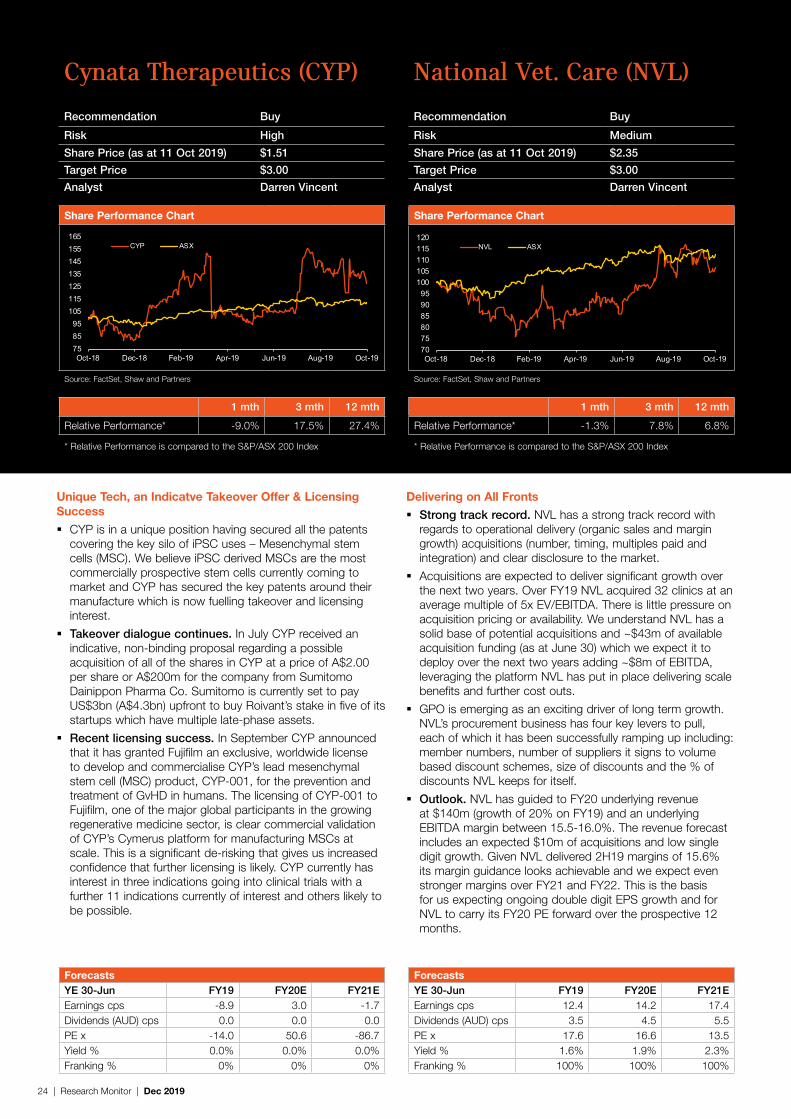
Unique Tech, an Indicatve Takeover Offer & Licensing Success
CYP is in a unique position having secured all the patents covering the key silo of iPSC uses – Mesenchymal stem cells (MSC). We believe iPSC derived MSCs are the most commercially prospective stem cells currently coming to market and CYP has secured the key patents around their manufacture which is now fuelling takeover and licensing interest.
Takeover dialogue continues. In July CYP received an indicative, non-binding proposal regarding a possible acquisition of all of the shares in CYP at a price of A$2.00 per share or A$200m for the company from Sumitomo Dainippon Pharma Co. Sumitomo is currently set to pay US$3bn (A$4.3bn) upfront to buy Roivant’s stake in five of its startups which have multiple late-phase assets.
Recent licensing success. In September CYP announced that it has granted Fujifilm an exclusive, worldwide license to develop and commercialise CYP’s lead mesenchymal stem cell (MSC) product, CYP-001, for the prevention and treatment of GvHD in humans. The licensing of CYP-001 to Fujifilm, one of the major global participants in the growing regenerative medicine sector, is clear commercial validation of CYP’s Cymerus platform for manufacturing MSCs at scale. This is a significant de-risking that gives us increased confidence that further licensing is likely. CYP currently has interest in three indications going into clinical trials with a further 11 indications currently of interest and others likely to be possible.
Cynata Therapeutics (CYP)
Recommendation Buy
Risk High
Share Price (as at 11 Oct 2019) $1.51
Target Price $3.00
Analyst Darren Vincent
Share Performance Chart
Source: FactSet, Shaw and Partners
1 mth 3 mth 12 mth
Relative Performance* -9.0% 17.5% 27.4%
* Relative Performance is compared to the S&P/ASX 200 Index
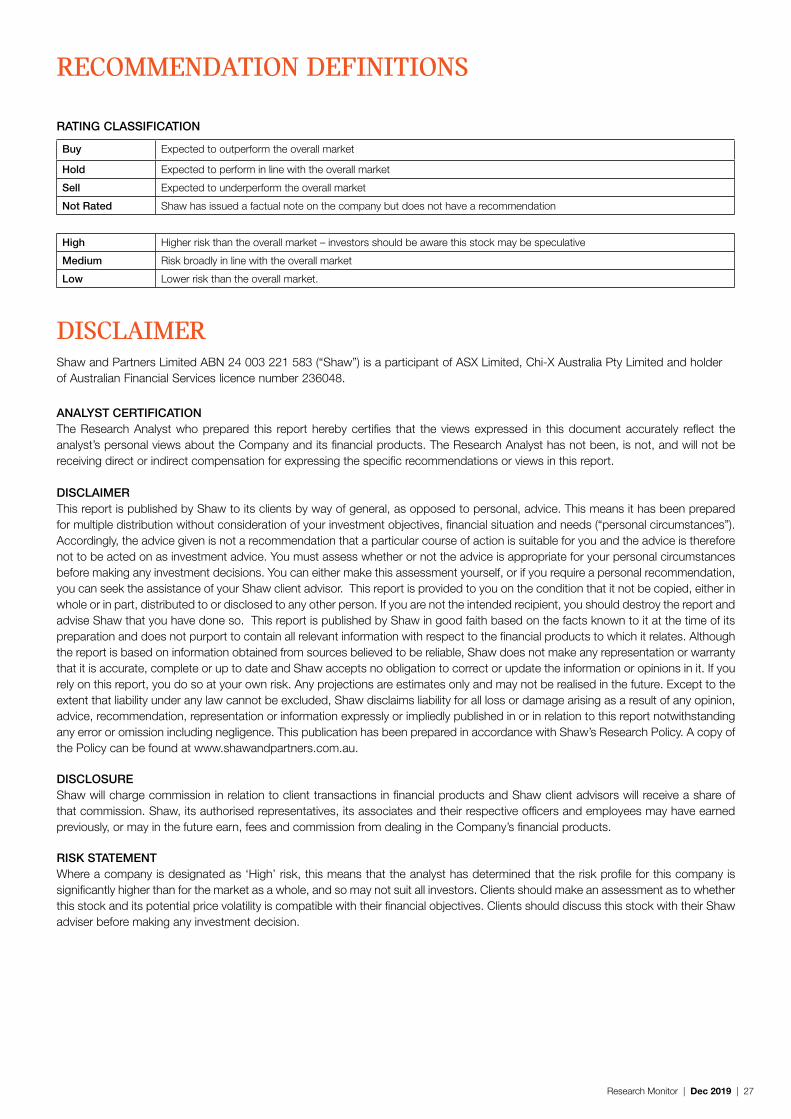
Strong track record. NVL has a strong track record with regards to operational delivery (organic sales and margin growth) acquisitions (number, timing, multiples paid and integration) and clear disclosure to the market.
Acquisitions are expected to deliver significant growth over the next two years. Over FY19 NVL acquired 32 clinics at an average multiple of 5x EV/EBITDA. There is little pressure on acquisition pricing or availability. We understand NVL has a solid base of potential acquisitions and ~$43m of available acquisition funding (as at June 30) which we expect it to deploy over the next two years adding ~$8m of EBITDA, leveraging the platform NVL has put in place delivering scale benefits and further cost outs.
GPO is emerging as an exciting driver of long term growth. NVL’s procurement business has four key levers to pull, each of which it has been successfully ramping up including: member numbers, number of suppliers it signs to volume based discount schemes, size of discounts and the % of discounts NVL keeps for itself.
Outlook. NVL has guided to FY20 underlying revenue at $140m (growth of 20% on FY19) and an underlying EBITDA margin between 15.5-16.0%. The revenue forecast includes an expected $10m of acquisitions and low single digit growth. Given NVL delivered 2H19 margins of 15.6% its margin guidance looks achievable and we expect even stronger margins over FY21 and FY22. This is the basis for us expecting ongoing double digit EPS growth and for NVL to carry its FY20 PE forward over the prospective 12 months.
National Vet. Care (NVL)
Recommendation Buy
Risk Medium
Share Price (as at 11 Oct 2019) $2.35
Target Price $3.00
Analyst Darren Vincent
Share Performance Chart
Source: FactSet, Shaw and Partners
1 mth 3 mth 12 mth
Relative Performance* -1.3% 7.8% 6.8%
* Relative Performance is compared to the S&P/ASX 200 Index
AD8 again surprised the market to the upside with a solid ‘beat’ on not only its guidance but sales, EBITDA and cashflow on the back of a strong 4Q19. Impressively, AD8 is now profitable on all fronts (EBITDA, EBIT, NPAT, cashflow).
In our view, the significant out-performance for the ‘beat’ was due to three key catalysts: (1) the core chips business again achieving its historical ~30% volume growth (Brooklyn / Broadway / Ultimo); (2) AVIO adapters continuing strong demand; (3) Software revenues improving 39% on the back of DDM getting into stride and IPCore doing well (high ASP); and (4) lower AUD.
Number of Dante-enabled products on market continues to grow, increasing from 925 in 2017 to 2,134, or now >6x the market adoption of its closest competitor, CobraNet – at the end 1H19, the number of OEM customers also rose from 310 in 2016 to 459.
When we think of impressive Australian tech companies, it is usually the three members of the ‘A-Team’ that are held up as exemplars (Altium, Appen, Atlassian). Shaw and Partners believe AD8 should be included amongst this August group given its significant addressable market, its position as the global standard in digital audio networking (with no peers within cooee), profitability with sound (and increasing) underlying fundamentals (gross margins ~74% and exiting sales growth ~44% in AUD terms).
Audinate (AD8)
Recommendation Buy
Risk High
Share Price (as at 11 Oct 2019) $7.21
Target Price $8.50
Analyst Danny Younis
Share Performance Chart
Source: FactSet, Shaw and Partners
1 mth 3 mth 12 mth
Relative Performance* -4.4% -12.9% 114.6%
* Relative Performance is compared to the S&P/ASX 200 Index
Consistent investment outperformance for over 40 years – notably over the last 15 years, SOL has achieved an enviable TSR of 11.6% p.a., outperforming the All Ords Accumulation Index by 2.6% p.a.
Superlative dividend track record with SOL one of just two listed companies (Ramsay Health Care) that has increased its DPS annually for the last 18 years.
Key catalyst: Round Oak Minerals set for profitability in FY20 after two years of losses.
Key regulatory event #1: securing approval for New Acland Coal Mine Stage 3 Project continues to be in abeyance as NHC waits for final approvals (expected soon) – additional production from Bengalla/Lenton partly offsets potential Acland declines.
Key regulatory event #2: securing Federal Court approval for the TPG and Vodafone merger (expected before Xmas) – the ACCC’s preliminary view is that the proposed merger will substantially lessen competition.
Benefits of 40-year cross shareholding with BKW has historically – and clearly – outweighed the negatives (vindicated by Federal Court of Australia ruling) – positives include earnings stability, longer term management focus and dividend support vs. pitfalls of inflexibility, illiquidity, entrenching underperforming Board / management, perceived conflicts of interest, and complexity (may hinder valuation).
Washington H Soul Pattinson (SOL)Recommendation Buy
Risk Medium
Share Price (as at 11 Oct 2019) $21.49
Target Price $26.00
Analyst Danny Younis
Share Performance Chart
Source: FactSet, Shaw and Partners
1 mth 3 mth 12 mth
Relative Performance* -1.2% -5.2% -18.2%
* Relative Performance is compared to the S&P/ASX 200 Index
Uknown and undervalued with strong organic growth and net cash
PBP is one of the largest vertically integrated manufacturers of OTC pharmaceutical products within Australia. The company delivers a range of services which range from IP, formulation, supply chain, packaging and distribution across many products including cough liquids, analgesics, tablets, vitamins and others.
PBP delivers the majority of revenues via leverage to a diverse range of large multinational pharmaceutical and OTC companies including JNJ, BKL and others across long term contracts with a high visibility to earnings. PBP is currently delivering $100m+ in revenues, is highly profitable, is in a net cash position and delivering double digit organic growth.
PBP is relatively unknown within the Australian market and has undergone a strategic refresh divesting non-core assets/brands and reinvesting in supply chain initiatives to drive a competitive advantage and presence in OTC manufacturing. Divestment initiatives have totalled over $60m at attractive multiples, which have partly been recycled into strategic acquistions at 4.5x multiples.
We expect PBP to demonstrate continued double digit organic growth underwritten by structural tailwinds driving onshore growth to speciality OTC manufacturers. We also expect the company to be an active consolidator within the Australian market and see further accretive acquisitions as likely.
PBP currently trades at a discount to the overall market with net cash, a strong DPS profile and growing free cash flow.
Probiotec (PBP)
Recommendation Buy
Risk High
Share Price (as at 11 Oct 2019) $1.95
Target Price $2.07
Analyst Jonathon Higgins
Share Performance Chart
Source: FactSet, Shaw and Partners
1 mth 3 mth 12 mth
Relative Performance* 19.3% 20.0% 31.8%
* Relative Performance is compared to the S&P/ASX 200 Index
RHP is the leading wholesaler of cloud based products within APAC and is one of only 11 globally managed account partners for Microsoft globally and the smallest by market capitalisation. RHP was born in the cloud and derives the majority of revenues via a recurring monthly billable model that due to strong growth trajectory and platform like costs is more profitable each month as operating leverage grows across the business.
RHP is a an ASX listed turbocharged option on MSFT’s growth within the fastest growing markets globally (Asia).
Multiple growth levers are evident across RHP’s business and this underwrites our confidence and investment thesis. Private cloud took 10 years to grow to FY19 gross margin levels, O365 CSP (public cloud) took 4 years and Azure (infrastructures as a service) is currently 30% ahead of CSP at a similar time since launch.
RHP stock has pulled back upon the announcement of the launch into Japan and associated market expectations regarding the growth resources (expenses). We see management as having the track record of delivering multiple product and geographical growth targets previously and see the company as being successful in time within Japan. Japan is the second largest market for MSFT products globally and should buoy future growth prospects alongside public cloud.
We like net cash, recurring earnings, operating leverage, global business models and leading management - All these are all available through RHP exposure.
Rhipe (RHP)
Recommendation Buy
Risk High
Share Price (as at 11 Oct 2019) $2.65
Target Price $3.30
Analyst Jonathon Higgins
Share Performance Chart
Source: FactSet, Shaw and Partners
1 mth 3 mth 12 mth
Relative Performance* -1.12% -7.99% 126.50%
* Relative Performance is compared to the S&P/ASX 200 Index
Hold Expected to perform in line with the overall market
Sell Expected to underperform the overall market
Not Rated Shaw has issued a factual note on the company but does not have a recommendation
High Higher risk than the overall market – investors should be aware this stock may be speculative
Medium Risk broadly in line with the overall market
Low Lower risk than the overall market.
DISCLAIMERShaw and Partners Limited ABN 24 003 221 583 (“Shaw”) is a participant of ASX Limited, Chi-X Australia Pty Limited and holder of Australian Financial Services licence number 236048.
ANALYST CERTIFICATIONThe Research Analyst who prepared this report hereby certifies that the views expressed in this document accurately reflect the analyst’s personal views about the Company and its financial products. The Research Analyst has not been, is not, and will not be receiving direct or indirect compensation for expressing the specific recommendations or views in this report.
DISCLAIMERThis report is published by Shaw to its clients by way of general, as opposed to personal, advice. This means it has been prepared for multiple distribution without consideration of your investment objectives, financial situation and needs (“personal circumstances”). Accordingly, the advice given is not a recommendation that a particular course of action is suitable for you and the advice is therefore not to be acted on as investment advice. You must assess whether or not the advice is appropriate for your personal circumstances before making any investment decisions. You can either make this assessment yourself, or if you require a personal recommendation, you can seek the assistance of your Shaw client advisor. This report is provided to you on the condition that it not be copied, either in whole or in part, distributed to or disclosed to any other person. If you are not the intended recipient, you should destroy the report and advise Shaw that you have done so. This report is published by Shaw in good faith based on the facts known to it at the time of its preparation and does not purport to contain all relevant information with respect to the financial products to which it relates. Although the report is based on information obtained from sources believed to be reliable, Shaw does not make any representation or warranty that it is accurate, complete or up to date and Shaw accepts no obligation to correct or update the information or opinions in it. If you rely on this report, you do so at your own risk. Any projections are estimates only and may not be realised in the future. Except to the extent that liability under any law cannot be excluded, Shaw disclaims liability for all loss or damage arising as a result of any opinion, advice, recommendation, representation or information expressly or impliedly published in or in relation to this report notwithstanding any error or omission including negligence. This publication has been prepared in accordance with Shaw’s Research Policy. A copy of the Policy can be found at www.shawandpartners.com.au.
DISCLOSUREShaw will charge commission in relation to client transactions in financial products and Shaw client advisors will receive a share of that commission. Shaw, its authorised representatives, its associates and their respective officers and employees may have earned previously, or may in the future earn, fees and commission from dealing in the Company’s financial products.
RISK STATEMENTWhere a company is designated as ‘High’ risk, this means that the analyst has determined that the risk profile for this company is significantly higher than for the market as a whole, and so may not suit all investors. Clients should make an assessment as to whether this stock and its potential price volatility is compatible with their financial objectives. Clients should discuss this stock with their Shaw adviser before making any investment decision.
28 | Research Monitor | Dec 2019
Holder of Australian Financial Services Licence Number 236048 | ABN 24 003 221 583 | Participant of ASX Limited, Chi-X Australia Pty Limited