European Research Studies, Volume XIII, Issue (1), 2010 The Residual Value Models: A Framework for Business Administration Konstantinos J. Liapis 1 Abstract This article investigates the relationship between a firm’s performance and Residual Value Models (RVM) which serve as decision making tools in corporate management. The main measures are the Economic Value Added (EVA® 2 ) and Cash Value Added (CVA® 3 ), with key components the Residual Income (RI), Free Cash Flow (FCF) and Weighted Average Cost of Capital (WACC). These measures have attracted considerable interest among scientists, practitioners and organizations in recent years. This work focuses on the relations, among Net Income (NI), Residual Income, Cash Flows from Operations activities (CFO), cost of equity capital and debt capital, we also discuss the usage of accounting data from accrual or cash flow basis, the economic adjustments on them, and the compatibility with IFRS 4 rules or other countries’ GAAPs 5 . Generally, the decision making based on Value Based Management (VBM) key metrics shows inconsistencies and limitations in definitions and applications, but at the same time, it is a way for management to have influence on the company’s performance and total market value (TMV) which are strongly related to current and future VBM key metrics’ amounts. The contribution of this paper is that it surveys from a critical perspective, literature about Residual Value Models (RVM) and VBM metrics and proposes a new framework for managing the firm’s value and monitoring performance. Keywords: Value Based Management, Corporate Governance, Performance Measurement, EVA®, Residual Income, WACC. JEL Classification: M41; G14; G3; G30. 1 Assistant Professor (elected) Panteion University Department of Economic and Regional Development, 136 Sygrou Avenue, P.C.17671, Athens, Greece e-mail: [email protected]. 2 EVA®: is a trademark of Stern, Stewart and Co. 3 CVA®: is a trademark of Boston Consulting and Hot Value Advisors Co. 4 IFRS : International financial reporting standards 5 GAAP : General Accepted Accounting Principles
Transcript
European Research Studies, Volume XIII, Issue (1), 2010
The Residual Value Models: A Framework for Business Administration
Konstantinos J. Liapis1
Abstract This article investigates the relationship between a firm’s performance and Residual Value Models (RVM) which serve as decision making tools in corporate management. The main measures are the Economic Value Added (EVA®2) and Cash Value Added (CVA®3), with key components the Residual Income (RI), Free Cash Flow (FCF) and Weighted Average Cost of Capital (WACC). These measures have attracted considerable interest among scientists, practitioners and organizations in recent years. This work focuses on the relations, among Net Income (NI), Residual Income, Cash Flows from Operations activities (CFO), cost of equity capital and debt capital, we also discuss the usage of accounting data from accrual or cash flow basis, the economic adjustments on them, and the compatibility with IFRS4 rules or other countries’ GAAPs5. Generally, the decision making based on Value Based Management (VBM) key metrics shows inconsistencies and limitations in definitions and applications, but at the same time, it is a way for management to have influence on the company’s performance and total market value (TMV) which are strongly related to current and future VBM key metrics’ amounts. The contribution of this paper is that it surveys from a critical perspective, literature about Residual Value Models (RVM) and VBM metrics and proposes a new framework for managing the firm’s value and monitoring performance. Keywords: Value Based Management, Corporate Governance, Performance Measurement, EVA®, Residual Income, WACC. JEL Classification: M41; G14; G3; G30.
1 Assistant Professor (elected) Panteion University Department of Economic and Regional Development, 136 Sygrou Avenue, P.C.17671, Athens, Greece e-mail: [email protected]. 2 EVA®: is a trademark of Stern, Stewart and Co. 3 CVA®: is a trademark of Boston Consulting and Hot Value Advisors Co. 4 IFRS : International financial reporting standards 5 GAAP : General Accepted Accounting Principles
European Research Studies, Volume XIII, Issue (1), 2010 84
1. Introduction Residual Value Models (RVM) generally are called a range of calculative techniques such as EVA, CVA, Cash Flow Return on Investment (CFRI), Total Business Return and, Economic Value Management which purport to enable decisions in companies to influence shareholders value. These methods are advanced by major management consultancy firms, practitioners and academics (Biddle C.G., Bowen M.R., Wallace S.J., 1997). An application of RVM or VBM method, according to Malmi T. and Ikäheimo S. (2003)., would be to aim to create shareholders value, identify the value drivers, connect performance measurement, target setting and rewards to value creation or value drivers, connect decision making and action planning, both strategic and operational to value creation or value drivers and every one expects all these features to appear in organizations claiming to use VBM. The most famous VBM system is the EVA® method created by Stewart G. (1991). Important firms like Coca Cola, DuPont, Eli Lilly, Polaroid, Pharmacia, and Whirlpool have been among the adopters. In this study we propose a framework for managing the firm’s value through monitoring VBM key metrics for the company’s “value drivers”. The accounting and finance sciences have created a large range of methods and models for performance measurement. Generally these models could be classified into three sets. The first set is based on income with representative ratios P/E (price per earnings), EPS (earning per share), and ROE (return on equity). The second set is based on discounted cash flows which are called and DCF methods with representative methods NPV (net present value), IRR (internal rate of return) and ARR (accounting rate of return). The third set is based on value added with famous models EVA, CVA, RI, and FCF. In this study we discuss a model that summarizes all the above methods. Our article is organized as follows. Section 2 presents the value added methods briefly. Section 3 analyzes the economic adjustments on accounting GAAP’s data. Section 4 analyzes Corporate Governance and Managerial Framework for implementation. Section 5 presents the Inconsistencies and limitations in application. Section 6 relates the company’s Total Market Value (TMV) with EVA. Sections 2, 3, 4, 5 and 6 prepare section 7 in which we discuss a managerial framework based on VBM measures in connection with performance key metrics (indicators), and the creation of a VBM key metrics model. Finally, section 8 summarizes the outputs of our work.
The Residual Value Models: A Framework for Business Administration
85 2. The Components of Residual Value Goldberg R.S. (1999)., O’Byrne F.S. (1999)., Young S.D and O’Byrne F.S. (2001)., denote that the basic objective of EVA is to create an operating measure of periodic performance that is consistent with discounted cash flow (DCF) valuation and highly correlated with current market value. Accounting earnings cannot be used to calculate the DCF value of a company because accounting earnings don’t recognize the cost of equity capital. EVA differs from accounting earnings because it recognizes the cost of both debt and equity capital; hence, it can be used to calculate the DCF value of a company. Free cash flow (FCF) can also be used to calculate the DCF value of a company, but FCF is poorly correlated with current market value because it fails to match investment outlays with the future periods they benefit. EVA differs from free cash flow because EVA permits the recognition of expenditures to be deferred to the future periods they benefit and, hence, is more highly correlated with current market value. EVA differs from FCF by substituting for the actual investment in the year a capital charge based on book capital:
(1) Dcapital - NOPAT = FCF (2) capital * c - NOPAT =EVA
NOPAT is Net Operating Profit after Tax, or operating profit minus the taxes that would be payable without any deduction for interest expense. NOPAT, unlike net income, has no charge for interest expense or any other financing cost because it is designed to separate operating performance from the method of financing. FCF can be expressed in terms of NOPAT without adding back depreciation because investment, D-capital, is net of depreciation. With EVA method the earnings before extraordinary items (EBEI) that is accounting earnings before interest so, EBIT without taxes, direct related with cash flow from operations (CFO), and residual income (RI). Thus:
(3) Accrual+CFO=EBEI Accrual denotes the accounting recognized accrual revenues. The accounting net operating profit after tax is equal: (4) ATInt +EBEI=NOPATacct Where . The residual income generally defined as:
European Research Studies, Volume XIII, Issue (1), 2010 86
Where acctCC and acctC are Capital Charge and Accounting Capital
correspondently. The capital is the sum of equity book value ( bvE ) (plus debt (D)
thus: (6) Ebv)+(Di-NOPAT RI Cacct=
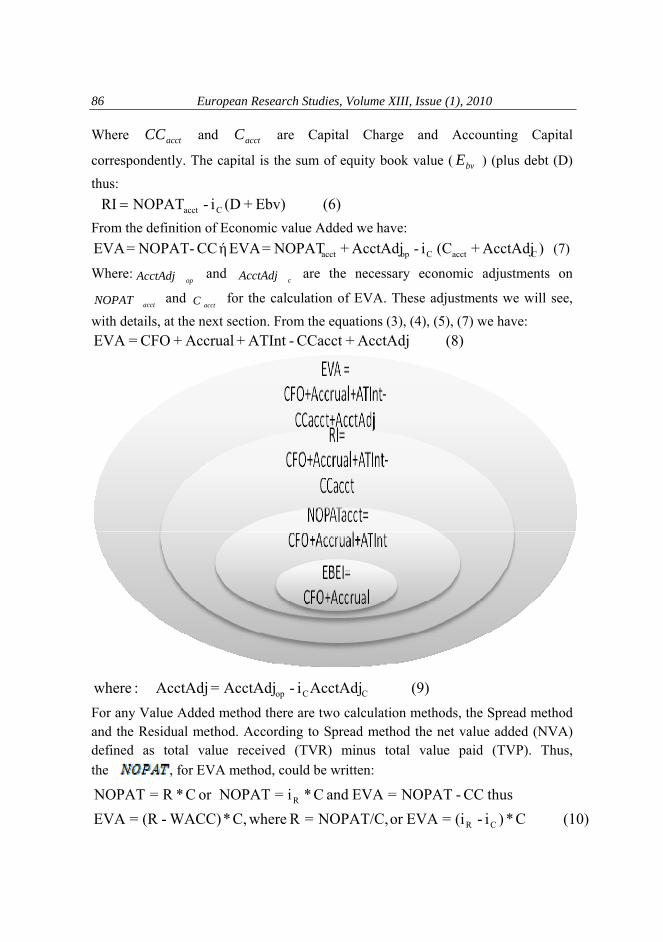
From the definition of Economic value Added we have: )AcctAdj+(C i-AcctAdj+NOPAT=EVA ή CC-NOPAT=EVA CacctCopacct (7)
Where:opAcctAdj and
cAcctAdj are the necessary economic adjustments on
acctNOPAT and acctC for the calculation of EVA. These adjustments we will see,
with details, at the next section. From the equations (3), (4), (5), (7) we have: (8) AcctAdj +CCacct -ATInt + Accrual + CFO =EVA
(9) AcctAdji-AcctAdj=AcctAdj :where CCop
For any Value Added method there are two calculation methods, the Spread method and the Residual method. According to Spread method the net value added (NVA) defined as total value received (TVR) minus total value paid (TVP). Thus, the , for EVA method, could be written:
The Residual Value Models: A Framework for Business Administration
87 According to Residual method:
WACCand C*WACC=CC whereCC-NOPAT=EVA
equitydebt
equityequitydebtdebt
CCCiCi
orC
CC+
+=
(11) )C i+C i (-NOPAT=EVA equityequitydebtdebt
On the Value Added equations (RI or EVA) based on spread method, the component R approximated could be replaced by ROE, ROC, ROIC, RORAC, RONA, ROGA, CRONA (Stoughton M.N and Zechner J., 2007) taking by this way into account and other information (risk, cash and other). This year a new index has produced based on EVA in order to held corporate governance Stewart B. 2009. The name of this index is “EVA Momentum” and has defined as the change in a firm’s economic profit in a given period divided by sales in the prior period. After implementation the Dupont formula not in ROC (return on Capital) but in new index we have the conclusion that this index summarize productivity gains and profitable growth.
(12) Growth Sales * SalesEVA
SalesEVAΔ
SalesΔEVA
=MomentumEVA 1-t
t ⎟⎠⎞
⎜⎝⎛+⎟
⎠⎞
⎜⎝⎛=
3. The Components of Cost of Capital From the other hand a firm’s cost of capital is an important benchmark in many popular forms of performance analysis. These measures are important because they can be less sensitive to the distortions that can arise from traditional accounting measures (Knight 1997). The cost of capital or the weighted Average Cost of Capital (WACC) is equal with:
WACC or ( )SD
SiSD
Dii sDc ++
+−= φ1 (13)
Where di : Average interest rate of debt capital. si : Average interest rate of equity capital. D: Debt capital. s: Equity capital.φ: Tax rate. The cost of capital is equal with an interest rate that aggregates the free interest rate and an equity risk premium for the risks undertaking from shareholders.
European Research Studies, Volume XIII, Issue (1), 2010 88
Where: freeR or fR The interest rate free of risk – commonly the interest rate of long
term government bonds. marketR or mR : Market annual rate of performance –
predicted or realized performance rate in capital markets. : Beta coefficient of risk factor. If β>1 the companies ‘shares have bigger volatility than market and if β<1 smaller. BETA coefficient is produced by regression of single function that relates the share price with index price of stock market. With another method which is called dividends method or Gordon method (Gordon M., 1962) the cost of equity capital is equal with
rate]growth termlong [Expected+]Price)stock common (Pshare)per earnings (EPS[=i=Equity] of[Cost S
(16) g+]P
ESP[=i=i SCapital Share
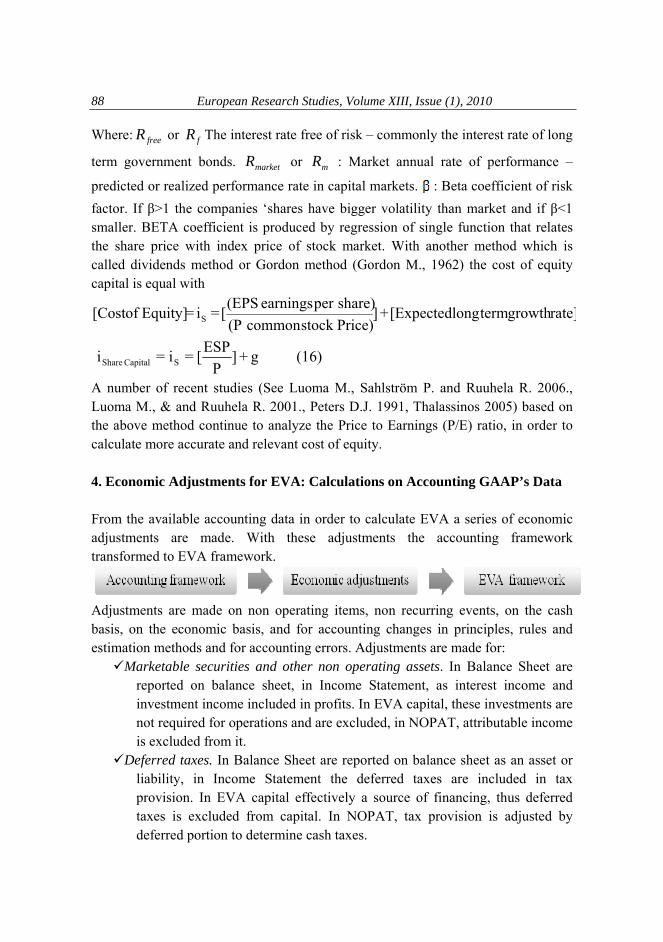
A number of recent studies (See Luoma M., Sahlström P. and Ruuhela R. 2006., Luoma M., & and Ruuhela R. 2001., Peters D.J. 1991, Thalassinos 2005) based on the above method continue to analyze the Price to Earnings (P/E) ratio, in order to calculate more accurate and relevant cost of equity. 4. Economic Adjustments for EVA: Calculations on Accounting GAAP’s Data From the available accounting data in order to calculate EVA a series of economic adjustments are made. With these adjustments the accounting framework transformed to EVA framework.
Adjustments are made on non operating items, non recurring events, on the cash basis, on the economic basis, and for accounting changes in principles, rules and estimation methods and for accounting errors. Adjustments are made for:
Marketable securities and other non operating assets. In Balance Sheet are reported on balance sheet, in Income Statement, as interest income and investment income included in profits. In EVA capital, these investments are not required for operations and are excluded, in NOPAT, attributable income is excluded from it.
Deferred taxes. In Balance Sheet are reported on balance sheet as an asset or liability, in Income Statement the deferred taxes are included in tax provision. In EVA capital effectively a source of financing, thus deferred taxes is excluded from capital. In NOPAT, tax provision is adjusted by deferred portion to determine cash taxes.
The Residual Value Models: A Framework for Business Administration
89
Reserves, allowances and, unusual accruals. In Balance Sheet are reported on balance sheet as liability, in Income Statement, charged against earnings. In EVA capital, investments are not considered to be required for operations and are excluded, in NOPAT, they are not charged until cash spent.
LIFO inventory method. In Balance Sheet, inventory is reported on balance sheet at older historic cost, in Income Statement, more recent cost is matched against revenue. In EVA capital, LIFO reserve is added back to reflect current value, in NOPAT, increases in LIFO reserve are added to NOPAT.
Operating leases. In Balance Sheet, they are treated as off-balance sheet future commitment, in Income Statement, rent expense is charged to earnings. In EVA capital, the operating leases are capitalized and added to both PP&E (Property, plant and equipment) and debt, in NOPAT, imputed interest on additional debt is added to NOPAT.
Recognized goodwill. In Balance Sheet the net goodwill is recognized as an asset. In Income Statement, an amortization expense is charged to earnings. In EVA capital the cumulative amortization is added back to goodwill, in NOPAT no amortization occurs.
Pooling of interest goodwill. In Balance Sheet, no goodwill is reported, in Income Statement, no amortization expense. In EVA capital the unrecognized goodwill is added back, in NOPAT, no amortization occurs.
Unusual gains or losses. In Balance Sheet, are written down reduces in asset balance by historical cost, in Income Statement, gains and losses are included in earnings. In EVA capital, gains reduce capital and unusual losses are added back, in NOPAT, gains and losses are not included.
Research and development / marketing. In Balance Sheet, there is no capitalization recognized, in Income Statement, R&D and marketing expenses are expensed as incurred. In EVA capital such expenses are capitalized if economic life exceeds accounting cycle, in NOPAT, the capitalized expenses is amortized over the economic life of the asset.
All these adjustments make sense, but there are controversies between them, which are used for EVA against RI, which is based on GAAPs’ rules and CFO, which is based on cash flow statement, but our work doesn’t make a part of this discussions. 5. Corporate Governance and Managerial Framework
European Research Studies, Volume XIII, Issue (1), 2010 90
In this part we try to ask in two questions. In which part of corporate governance we implement VBM methods? Between corporate conformance and corporate performance there are the main responsibilities of a company (Bhimani A., Soonawalla K. 2005, Thalassinos 2006). These responsibilities are classified into 4 categories: Corporate Financial Reporting (CFR), Corporate Governance (CG), Corporate Social Responsibility (CSR), and Stockholders Value Creation (SVC). The VBM methods implement on the last part in order to secure corporate performance. How, from the managerial point of view, the concept of VBM models is applied to practice? Malmi T. and Ikäheimo S. (2003) and Ittner C.D., Larcker D.F., (2001) suggest that VBM as managerial concept consists of six basic steps:
Choosing specific internal objectives that lead to shareholder value enhancement. Selecting strategies and organizational designs consistent with the achievement of
the chosen objectives. Identifying the specific performance variables, or “value drivers”, which actually
create value in the business given the organization’s strategies and organizational design.
Developing action plans, selecting performance measures, and setting targets based on the priorities identified in the value driver analysis.
Evaluating the success of action plans and conducting organizational and managerial performance evaluation.
Assessing the ongoing validity of the organization’s internal objectives, strategies, plans, and control systems in light of current results, and modifying them as required.
Every framework when is applied has to be compatible to these steps. 6. VBM’s Inconsistencies and Limitations A question is arising till our analysis, if there are any inconsistencies and limitations applying VBM methods. Cagle L., Smythe Jr.T., and Fulmer J. (2003) note that the use of EVA® is clearly a worthwhile consideration. However, there are significant implementation issues. Special considerations must be made when making adjustments to capital and NOPAT. Further, there are several factors to consider when selecting centers for measuring EVA®, and accounting adjustments must be made for these centers. Moreover, capital charge decisions must be implemented, and there are numerous miscellaneous considerations. Keys E.D., Azamhuzjaev M., and Mackey J. (2001) in their study describe inconsistencies and limitations for the EVA method. EVA has several weaknesses. Specifically, there are inconsistencies in the calculation of CAPITAL and inconsistencies in the calculation of NOPAT. There are also general limitations to EVA as Managers will have fewer choices in financing operations, Risky projects
The Residual Value Models: A Framework for Business Administration
91 will be accepted and moderately risky projects will be rejected, EVA is too complex, EVA is easy to manipulate, EVA is a short-term measure, EVA is a single performance measure that includes no measures of quality or time, EVA terminology is misleading, EVA should not be used for capital budgeting. 7. The Components of a Company’s Market Value Another question is if there are any relations between Value Added Created, from management decisions based on VBM measures, with Total Market Value TMV (company’s value in the market). TMV is equal with market value of total debt, leases, and other liabilities, preferred stock, and common stock. Using another point of view TMV is equal with total capital plus an amount called Market Value Added (MVA), thus we could define MVA as:
(16) CAPITAL TOTAL-VALUE MARKET TOTAL=MVA
Many times the debt amount and the fair value of debt is approximated equal and for this reason many times are excluded from C and TMV respectively. Thus the TMV represents the total shares value at stock market and C is equal with equity book value. EVA recognizes the same investment cost as FCF, but also charges for beginning book capital (which has no impact on FCF), the DCF value of the company can be expressed in terms of EVA and beginning book capital:
(17) EVA future of PV + Capital =FCF future of PV = TMV 0 EVA defers the recognition of expenditures through the capitalization process. A capitalized expenditure is not charged against EVA in the year in which it is made, only in the years in which depreciation and/or a capital charge is recognized. MVA from equations (16) and (17) is equal with present value of future EVA, thus:
( ) ( ) ( )33
22
11
111 orWACCiEVA
orWACCiEVA
orWACCiEVAMVA
ccc ++
++
+= (18)
PV(EVA)=EVA future of luePresent va=MVA The total market value will be equal to capital and the present value of future EVA
(19) PV(EVA)+C=TMV
European Research Studies, Volume XIII, Issue (1), 2010 92
( ) ( ) ( ) ( ) ⎥⎥⎦
⎤
⎢⎢⎣
⎡+
++
++
++
+++=
ΔΔΔΔ
...1111)(
, 3210
4321
C
IEVA
C
IEVA
C
IEVA
C
IEVA
C
O
IIIIorWACCIEVA
CTMVthus CCCC
( ) ( ) ⎥⎥⎦
⎤
⎢⎢⎣
⎡+
+
Δ+
+
Δ+
Δ++= ...
11)( 23
121
CCCCCC
O
IiEVA
IiEVA
iEVA
iEVA
CTMV
( )( ) ( ) ( ) ⎥
⎥⎦
⎤
⎢⎢⎣
⎡+
+
Δ+
+
Δ+
+Δ+
++= ...111
13
32
21
CCCC
C
C
O
iEVA
iEVA
iEVA
iI
iEVA
CTMV
( ) [ ])(1
tC
C
C
O EVApvi
Ii
EVACTMV Δ
+++=
( ))(
1t
C
C
C
O EVApvi
Ii
EVACTMV Δ
+++= (19)
The total market value according to the equation above has as components the book value of capital [C], the capitalized EVA [ ]ciEVACEVA /0= and EVA’s future
growth value ⎥⎦
⎤⎢⎣
⎡Δ
+= )(
1t
c
c EVApvi
iFGV . The sum of the first two components
is called also Current Operations Value ⎥⎦
⎤⎢⎣
⎡+=
ciEVA
CCOV 0 . In this point we can
make a general conclusion. Following the above sense of analysis, easily we have the same components (operations value and future growth) for any other VBM measure like RI, FCF, and CVA. O’Hanlon J. and Peasnell K. (2002), Schueler A. and Krotter S. (2008) examined the link between RI with Excess Value Created (ECV). Their studies provide the link between ECV and RI by differentiating between two components: the terminal value of previously realized RI, including the RI of current period, and the present value of future RI. ECV is defined by
atC
T
taa
btC
T
bb
jtC
T
jjt iRIiRIiRIECV −
+=
−
=
−
=
+=+=+= ∑∑∑ )1()1()1(111
(20)
For the t is now (b < t < a) the first part of the equation above denotes the Residual Income Book value Relationship (RIBR) and the second part the Residual Income Valuation Relationship (RIVR). Gebhardt R.W., Lee C.M.C., and Swaminathan B. (2001) analyze the RI valuation model as:
The Residual Value Models: A Framework for Business Administration
93
∑∑∞
=
−++∞
=
+ =+−
+=+
+==1
1
1 )1()*(
)1()(
rr
c
rtcrttt
rr
c
rtttt i
BViNIEBV
iRIE
BVPTMV
= ∑∞
=
−++
+−
+1
1
)1(]*)[(
rr
c
rtcrttt i
BViROEEBV (21)
For any horizon T,
∑−
=−
−++−++
+++
+−
++−
+
+−
++−
+=
1
31
*
11
21
)1(*)(
)1(*)(
)1(*)(
)1(*)(
T
rT
cc
Ttcrtr
c
rtcrt
c
tcrt
c
tcrttt
iiBViFROE
iBViFROE
iBViFROE
iBViFROE
BVP (22)
Where FROE forecasted return on equity, BV Equity Book Value also for D Dividends and k the dividend payout ratio:
(23) k)-(1*NI+BV=D-EPS+BV=BV 1)-(t1)-(ttt1)-(tt 8. The Proposed Value Based Management Framework The main object of our work is to build a framework using only the available information arising from financial statements - accounting data, in order to integrate accrual and cash flow accounting, and incorporate the Value Based methods with performance key indicators. The calculation of NOPAT could be made both from net income and net sales for example: Net income Net sales Net unusual gain after taxes Cost of goods sold (FIFO) Decrease deferred taxes SG&A Increase in LIFO reserve Marketing and advertising Amortization of goodwill Recognized R&D amortization Increase in capitalized R&D Incremental cash pension expense Incremental cash pension expense Other operating expenses Net interest expense after taxes Adjusted EBIT Economic adjustments Cash operating taxes NOPAT NOPAT
As balance sheet measures are used, Net Assets is equal to Total Assets minus Noninterest-Bearing Current Liabilities (NIBCL’s e.g., accounts payable). Also, Net Assets is equal to capital that is defined as liabilities plus equity minus NIBCL, thus, the calculation of the capital could be made both from the Assets and from the liability side. Total assets Short-term debt
European Research Studies, Volume XIII, Issue (1), 2010 94
NIBCLs Current portion long-term debt
Net assets Senior log-term debt
LIFO reserve Other liabilities
PV of operating leases Debt and other liabilities
Capitalized R&D Preferred stock
Cumulative .Goodwill amortization Common stock
Cumulative unusual items after taxes Deferred taxes
Cumulative effect of accounting change Economic adjustments
Economic adjustments
EVA capital EVA capital
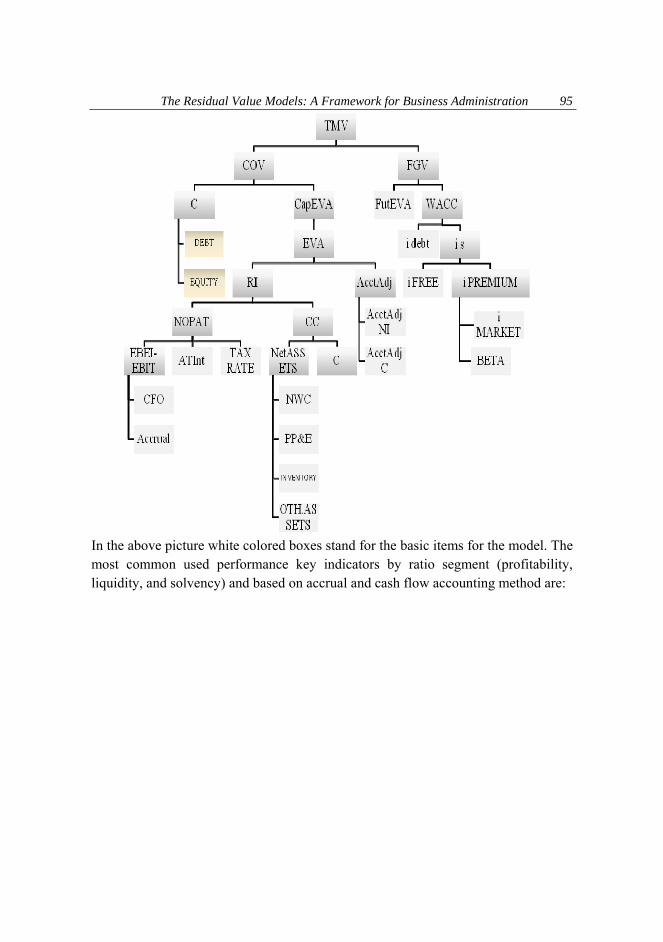
Return on net assets (RONA) is a measure also, Cash return on Assets (CRONA) is used for CVA that gives a measure like EVA, but is based on an overall total cash flow. From differentiation of above ratios from WACC we have a set of performance spreads arising from different value added methods. From the other hand, we can make a framework as a top to down model starting with equation (19) in which company’s valuation is produced with cooperative benefits such as disaggregate growth components of value, analyze market capitalization, determine economic payback, and benchmark.
The Residual Value Models: A Framework for Business Administration
95
In the above picture white colored boxes stand for the basic items for the model. The most common used performance key indicators by ratio segment (profitability, liquidity, and solvency) and based on accrual and cash flow accounting method are:
European Research Studies, Volume XIII, Issue (1), 2010 96
We mention at this point that the basic items of VBM methods support by the calculation of performance key metrics indicators cover ratios from all dimensions (profitability, liquidity, and solvency). We will try to relate, using the equation 10 (spread method of EVA), VBM methods with performance key metrics (indicators). The equation (10) is similar with any other VBM model, differenced only in definitions of variable used.
SDSi
SDDiWACCand
CNOPATRwhereCWACCREVA sD +
++
−==−= )1(,,,,*)( φ
NetAssetsSD
SiSD
DiNetAssetsNOPATEVA sD *)1( ⎥⎦
⎤⎢⎣⎡
++
+−−= φ (24)
If we continue the substitution with the detail components of NOPAT, we have:
The Residual Value Models: A Framework for Business Administration
97
[ ]AssetsOthINVENTEPPNWCSD
SiSD
DiNetAssets
AcctAdjtATAccrualCFOEVA sD
.&*
)1(ln
+++
⎟⎟⎠
⎞⎜⎜⎝
⎛⎥⎦⎤
⎢⎣⎡
++
+−−⎥⎦
⎤⎢⎣⎡ +++
= φ(25)
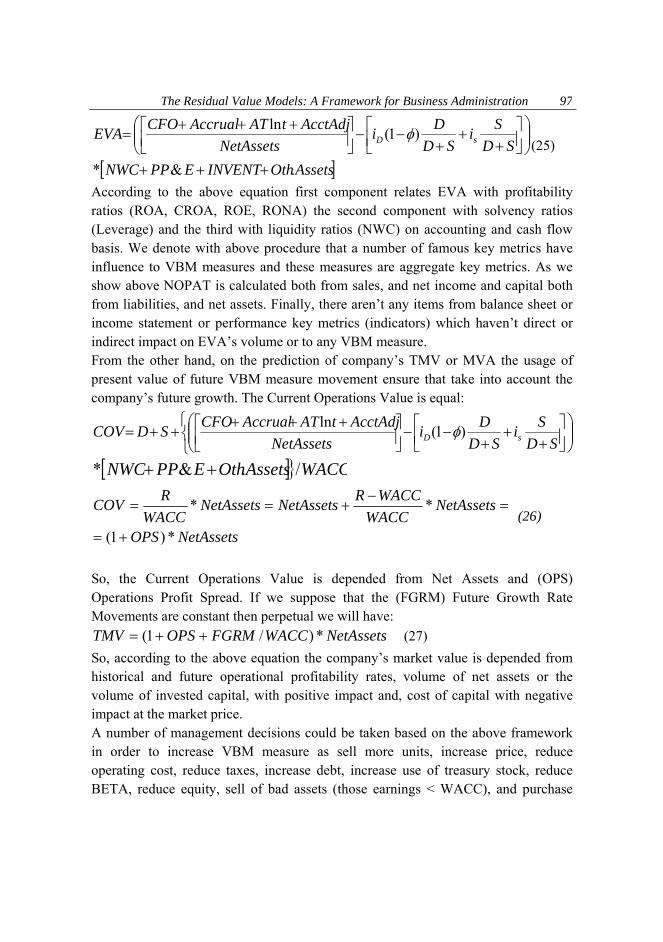
According to the above equation first component relates EVA with profitability ratios (ROA, CROA, ROE, RONA) the second component with solvency ratios (Leverage) and the third with liquidity ratios (NWC) on accounting and cash flow basis. We denote with above procedure that a number of famous key metrics have influence to VBM measures and these measures are aggregate key metrics. As we show above NOPAT is calculated both from sales, and net income and capital both from liabilities, and net assets. Finally, there aren’t any items from balance sheet or income statement or performance key metrics (indicators) which haven’t direct or indirect impact on EVA’s volume or to any VBM measure. From the other hand, on the prediction of company’s TMV or MVA the usage of present value of future VBM measure movement ensure that take into account the company’s future growth. The Current Operations Value is equal:
⎩⎨⎧
⎟⎟⎠
⎞⎜⎜⎝
⎛⎥⎦⎤
⎢⎣⎡
++
+−−⎥⎦
⎤⎢⎣⎡ +++
++=SD
SiSD
DiNetAssets
AcctAdjtATAccrualCFOSDCOV sD )1(ln φ
[ ]} WACCAssetsOthEPPNWC /.&* ++
NetAssetsOPS
NetAssetsWACC
WACCRNetAssetsNetAssetsWACC
RCOV
*)1(
**
+=
=−
+== (26)
So, the Current Operations Value is depended from Net Assets and (OPS) Operations Profit Spread. If we suppose that the (FGRM) Future Growth Rate Movements are constant then perpetual we will have:
NetAssetsWACCFGRMOPSTMV *)/1( ++= (27) So, according to the above equation the company’s market value is depended from historical and future operational profitability rates, volume of net assets or the volume of invested capital, with positive impact and, cost of capital with negative impact at the market price. A number of management decisions could be taken based on the above framework in order to increase VBM measure as sell more units, increase price, reduce operating cost, reduce taxes, increase debt, increase use of treasury stock, reduce BETA, reduce equity, sell of bad assets (those earnings < WACC), and purchase
European Research Studies, Volume XIII, Issue (1), 2010 98
good assets (those forecasting earnings > WACC) but, which is the suitable mix policy for a company it depends from its economic situation. 9. Conclusions This survey starts from a critical perspective, literature about Residual Value Models (RVM) mainly on EVA, proposes a framework for managing the firm’s value and monitoring performance following every RVM model. The main outputs from our investigation are presented below. All the Value Based Management methods based on Value Added could be integrated into a framework for monitoring company’s performance. This framework could be renamed as RVM framework. The RVM incorporate performance key metrics (indicators), thus it could be renamed also as VBM key metrics or RVM key metrics. Residual Value Models (RVM) and Value Based Management methods are an instrument for managing the firm’s value through the two components of the capitalized value added and the present value of future value added movements. Residual Value Models (RVM) especially RI and EVA could be based only on available information arising from financial statements and accounting data following both accrual and cash flow accounting. In RVM the Value Added is a variable that could be optimized following corrects decisions based on the values of key metrics and could be related with managers’ compensations, when VBM methods implement on corporate “value drivers” of a company.
The Residual Value Models: A Framework for Business Administration
99 10. References 1. Andersson T., Haslam C. Lee E., (2006), “Financialized Accounts: Restructuring
and Return on Capital Employed in S&P 500”, Accounting Forum, 30, 21-41. 2. Besanger S., Mottis N., and Ponssard J. P., (2001), “Value Based Management
and the Corporate Profit Centre”, European Business Forum, Winter ????? 3. Bhimani A., Soonawalla K., (2005), “From Conformance to Performance: The
Corporate Responsibilities Continuum”, Journal of Accounting and Public Policy, 24, 165-174.
4. Biddle C. G., Bowen M. R., Wallace S. J., (1997), “Does EVA® Beat Earnings? Evidence on Associations with Stock Returns and Firm Values”, Journal of Accounting and Economics, 24, 301-336.
5. Black A., Wright J., Bachman J., Makall M., Wright P., (1998), In Search of Shareholder Value: Managing the Drivers of Performance, Pitman Publishing, London.
6. Bromwich M., Walker M., (1998), “Residual Income Past and Future”, Management Accounting Research, 9, 391-419.
7. Malmi T., Ikäheimo S., (2003), “Value Based Management Practices – Some Evidence from the Field”, Management Accounting Research, 14, 235-254.
8. Cagle L., Smyth Jr. T., Fulmer J., (2003), “Implementing EVA®: One Company’s Story”, The Journal of Corporate Accounting & Finance, Autumn, 65-70.
9. Cotter J., (1996), “Accrual and Cash Flow Accounting Models: A Comparison of the Value Relevance and Timeliness of their Components”, Accounting and Finance, 36, 127-150.
10. Crabtree D. A., DeBusk K. G., (2008), “The Effects of Adopting the Balance Scorecard on Shareholders Returns”, Advances in Accounting, incorporating Advances in International Accounting, 24, 8-15.
11. Gebhardt R. W., Lee M. C., Swaminathan B., (2001), “Toward an Implied Cost of Capital”, Journal of Accounting Research, 39.1, 135-176.
12. Goldberg R. S., (1999), “Economic Value Added: A Better Measure for Performance and Compensation?”, The Journal of Corporate Accounting & Finance, Autumn, 55-67.
13. Goldberg R. S., Godwin H. G., (2001), “Your Merger: Will it Really Add Value?” The Journal of Corporate Accounting & Finance, January/February, 27-35.
14. Gordon M., (1962), The Investment, Financing and Valuation of the Corporation, Homewood, IL: Irwin.
European Research Studies, Volume XIII, Issue (1), 2010 100
15. Ittner C. D., Larcker D. F., (2001), “Assessing Empirical Research in Managerial Accounting: A Value Based Management Perspectives”, Journal of Accounting and Economics, 32, 349-410.
16. Jensen C. M., Meckling H. W., (2009), “Specific Knowledge and Divisional Performance Measurement”, Journal of Applied Corporate Finance, 21.2 Spring, 49-57.
17. Keys E. D., Azamhuzjaev M., Mackey J., (2001), “Economic Value Added®: A Critical Analysis”, The Journal of Corporate Accounting & Finance, January/February, 65-71.
18. Knight, J. A., (1997), Value Based Management: Developing a Systematic Approach to Creating Shareholder Value, McGraw-Hill, New York.
19. Luoma M., Ruuhela R., (2001), “How to Develop Price Per Earnings Ratio to Fair Valuation Method of a Stock?, Technical Analysis of Stock and Commodities,19, 34-38.
20. Luoma M., Sahlström P., Ruuhela R., (2006), “An Alternative Estimation Method of Equity Risk Premium Using Financial Statements and Market Data, Advances in Accounting, 22, 229-238.
21. Martin J. D., Petty J. W., (2000), Value Based Management: The Corporate Response to the Shareholder Revolution, Harvard Press.
22. McConaughy L. D., (1999), “Is the Cost of Capital Different for Family Firms”, Family Business Review, 12.4, 353-360.
23. McSweeney B., (2007), “The Pursuit of Maximum Shareholder Value: Vampire or Viagra”, Accounting Forum, 31, 325-331.
24. O’Byrne F. S., (1999), “EVA and Its Critics”, Journal of Applied Corporate Finance, 12.2 Summer, 92-96.
25. O’Byrne F. S., Young S. D., (2009), “Why Capital Efficiency Measures Are Rarely Used in Incentives Plans, and How to Change That”, Journal of Applied Corporate Finance, 21.2 Spring, 87-92.
26. O’Hanlon J., Peasnell K., (1998), “Wall Street’s Contribution to Management Accounting: Stern Stewart EVA® Financial Management System”, Management Accounting Research, 9, 421-444.
27. O’Hanlon J., Peasnell K., (2002), “Residual Income and Value – Creation: The Missing Link”, Review of Accounting Studies 7, 229-245.
28. Officer R. R., (1994), “The Cost of Capital of a Company Under an Imputation Tax System”, Accounting and Finance, May, 1-17.
29. Peasnell V. K., (1996), “Using Accounting Data to Measure the Economic Performance of Firms”, Journal of Accounting and Public Policy, 15, 291-303.
30. Peters D. J., (1991), “Valuing a Growth Stock”, Journal of Portfolio Management, 17, 49-51.
The Residual Value Models: A Framework for Business Administration
101
31. Sbebban J. T., (1994), “To EVA or Not to EVA: Is That the Question?”, Journal of Applied Corporate Finance, 7.2 Summer, 85-87.
32. Schueler A., Krotter S., (2008), “The Link Between Residual Income and Value Created for Levered Firms: A Note”, Management Accounting Research, 19, 270-277.
33. Stern J., (1998), “The EVA Financial Management System”, in J. Stern and D. Chew (Eds.), The Revolution in Corporate Finance pp. 32-46, Blackwell Publishers Oxford.
34. Stewart B., (2009), “EVA Momentum: The One Ratio That Tells the Whole Story”, Journal of Applied Corporate Finance, 21.2 Spring, 74-86.
35. Stewart G., (1991), The Quest for Value, Harper Business. 36. Stoughton M. N., Zechner J., (2007), “Optimal Capital Allocation Using
RAROC and EVA”, Journal of Financial Intermediation, 16, 312-342. 37. Thalassinos E. J., Courtis P., (2005), “Equity Fund Raising and “Creative”
Accounting Practices: Indications from Athens Stock Exchange for the 1999-2000 Period”, European Research Studies, Vol. VIII, Issue 1-2, pp. 2-10.
38. Thalassinos E., Kyriazidis Th., Thalassinos E. J., (2006), “The Greek Capital Market: Caught in Between Poor Corporate Governance and Market Inefficiency” European Research Studies, Vol. IX, Issue 1-2, pp. 3-24.
39. Tortella D. B., Bruso S., (2003), “The Economic Value Added (EVA): An Analysis of Market Reaction”, Advances in Accounting, 20, 265-290.
40. Watts R., (1998), “Does It Pay to Manipulate EPS?” in J. Stern & D. Chew (Eds.), The Revolution in Corporate Finance, Blackwell Publishers, Oxford.
41. Young S. D., O’Byrne F. S., (2001), EVA® and Value Based Management: A Practical Guide to Implementation, McGraw Hill.
European Research Studies, Volume XIII, Issue (1), 2010 102