29
The Revenue Implications of Temporary Tax Relief For Repatriated Foreign Earnings: An Analysis of the Joint Tax Committee’s Revenue Estimates Robert J. Shapiro and Aparna Mathur August 2011
The Revenue Implications of Temporary Tax Relief
For Repatriated Foreign Earnings
An Analysis of the Joint Tax Committeersquos Revenue Estimates
Robert J Shapiro and Aparna Mathur
August 2011
1
The Revenue Implications of Temporary Tax Relief for Repatriated Foreign Earnings
An Analysis of the Joint Tax Committeersquos Revenue Estimates1
Robert J Shapiro and Aparna Mathur
Executive Summary
This study evaluates the Joint Tax Committee‟s (JCT) approach and results for estimating the
revenue effects of the Homeland Investment Act (HIA) of 2004 which provided a temporary 85
percent deduction under the US corporate tax for certain qualified earnings of foreign
subsidiaries repatriated to their US parent companies We also evaluate the revenue effects of
current proposals to provide another one-year tax preference for repatriated earnings on the
same general terms as the 2004 Act We find that the JCT‟s approach has been flawed
conceptually and its estimates of significant revenue losses are incorrect
In 2004 the JCT estimated that the HIA would cost US taxpayers $33 billion over 10
years relative to its baseline (current law without the provision) This year the JCT
similarly estimated that the same provision enacted in 2011 would cost US taxpayers
$787 billion over 10 years compared to its current baseline
These projected revenue losses largely reflect two assumptions by JCT staff First the
temporary tax preference would induce US multinationals companies (MNCs) to shift
the timing of their planned repatriations so as to bring back funds in 2004-2005 or 2011-
2012 which otherwise they would have brought back later at a higher tax Therefore the
JCT assumes a sharp increase in repatriations during the periods of the tax preference
followed by sharp declines in later years relative to their earlier trend
New IRS data support the first assumption ndash repatriations did rise sharply in 2004-2005
sufficiently to produce revenues gains in those years despite the lower tax rate
However IRS data also show that repatriations in 2007 and 2008 did not fall below trend
as the JCT predicted but actually accelerated relative to their previous trend Therefore
the predicted revenue losses in later years have not occurred
Second the revenue losses predicted by the JCT assume that the prospect of tax relief for
repatriated earnings in the future would induce MNCs to alter their corporate behavior
and organization so that more of their earnings would come from foreign markets
JCT has offered no evidence for this assumption nor have independent analyses found
that the expectation of this tax preference altered corporate behavior and structure in this
way High levels of foreign direct investments by US MNCs began at least 15 years
before the 2004 Act in order to build global production networks that could serve global
markets There is no evidence that this process accelerated after the 2004 passage of HIA
1 The research for this project received financial support from NDN The views and analysis are solely those of the
authors
2
Based on current data and knowledge including actual repatriations under the 2004 Act
repatriations in the early out-years of the JCT‟s 10-year revenue estimate and the actual
trend growth rate of repatriations we can generate new revenue estimates
By replicating the JCT estimating process to the extent possible and using the new data in
place of the flawed JCT assumptions we estimate that the HIA will produce revenue
gains of $235 billion over 10 years compared to the JCT‟s estimate of a $33 billion
revenue cost over 10 years
Similarly we estimate that a reprise of the HIA enacted in 2011 would produce an $87
billion revenue gain over 10 years compared to the recent JCT estimate of a 10-year
billion revenue cost of $787 billion
I Introduction and Summary of Results
The taxation of foreign income earned by US multinational companies (MNCs) has two
basic elements First these firms can defer US corporate tax on the earnings of their foreign
subsidiaries until those earnings are repatriated to the US parent company usually in the form
of dividends2 Second when the US parent company does repatriate foreign earnings it can
claim a tax credit for the foreign taxes already paid (or deemed paid) on that income As a result
the maximum tax liability on this foreign-source income of US companies cannot exceed the
taxes that would have been paid if the income had been generated inside the United States which
currently is 35 percent
Congress is currently considering proposals to provide a temporary sharp reduction in
the US corporate tax rate on those foreign-source earnings3 These proposals would reinstate
for one year the basic provisions of the Homeland Investment Act (HIA) enacted as part of the
American Jobs Creation Act (AJCA) in 2004 To minimize the lock-out effect that discourages
US multinationals from deploying these earnings in the United States and to provide those
corporations with low-cost resources to expand their domestic workforces and investment the
legislation would offer US-based multinationals a one-time deduction of up to 85 percent for
ldquoextraordinary dividendsrdquo paid by controlled foreign corporations (CFCs) to their US parent
companies subject to certain limitations With a US corporate tax rate of 35 percent the
legislation would apply a 525 percent rate to qualified foreign earnings before taking account of
foreign tax credits for taxes paid on the earnings to countries where they were earned4
The effectiveness of the 2004 Act in promoting job creation and physical and intangible
investments is a matter of debate among economists which we describe later A similar debate
has arisen over the likely economic effects of the current proposal Economic conditions today
differ in certain ways from those in 2004-2005 and we do not analyze here the impact of the
2 Certain exceptions apply For instance subpart F income of CFCs is considered a deemed dividend and is subject
to immediate taxation 3 See httpwwwopencongressorgbill112-h1834show httpbilbrayhousegovH_R_1036pdf
4 15 percent of the qualifying dividends would be taxed at the 35 corporate rate 035 x (1 ndash 085) = 00525
3
policy on employment and investment under current conditions Instead the focus of this
analysis is the likely revenue consequences of reinstating the provisions of HIA
Prior to the enactment of the 2004 Act the Joint Committee on Taxation (JCT) estimated
that the provision would cost US taxpayers $33 billion over ten years In March 2011
Representative Lloyd Doggett asked the JCT to estimate the revenue effects of applying the same
policy for one year covering the taxpayer‟s first taxable year after December 31 2011 On April
15 2011 the JCT estimated that this policy would cost the Treasury $787 billion over ten years
(FYs 2011-2021) Using public materials including recent IRS data on repatriated foreign
earnings following the 2004 Act and an analysis of the JCT estimating procedures used in 2004
proposal published by JCT‟s chief of staff (Edward Kleinbard) and a JCT senior economist
(Patrick Driessen) in Tax Notes5 we conclude firtst that 1) The HIA will generate an estimated
$236 billion revenue gain over 10 years rather than a $33 billion revenue lossthe proposal if
enacted would more likely produce revenue gains which we estimate at $87 billion over ten
years than the $787 billion revenue cost projected by JCT
The JCT‟s projected revenue losses largely reflect the Committee staff‟s assumptions that
the 2004 Act would first significantly alter the timing of repatriations and second change
corporate behavior and organization so as to shift more earnings to foreign markets in the
expectation that Congress eventually would approve a subsequent period of lower taxes on
repatriated income6 Later data as we will note immediately below contradicts the first
assumption As to the second assumption the JCT has never provided evidence for its validity
but rather simply attributed $1 billion in foregone revenues to this factor in its 2004 estimate for
HIA Given the US Senate‟s failure in 2009 to approve a second round of the temporary tax
preference such expectations in the current period would seem unlikely on their face
Moreover with emerging economies accounting for a majority of global growth for at
least the last decade US multinational companies have been investing at significant rates in
foreign operations in order to serve these fast-growing global markets In fact US companies
have maintained large-scale foreign direct investments for more than a generation This trend
did not originate with the HIA and its effects should properly be part of the JCT‟s revenue
baseline and therefore not affect the revenue estimate for HIA or its reprise in 2011 It also
would be very difficult to disentangle any evidence of the behavioral changes projected by JCT
from the responses by multinationals to certain disincentives for domestic US investment
arising from either economic conditions or other aspects of the US corporate tax This may
help explain why the JCT could offer no evidence for its $1 billion estimate for this effect in
2004 and why it did not publicly specify any number for this effect in its 2011 estimate
Direct evidence can be brought bear however on the JCT‟s first assumption in 2004
which held that the Act would induce US multinationals to increase the foreign earnings they
repatriated under the HIA‟s temporary preferential rate mainly by using earnings which
5 Kleinbard and Driessen (2008)
6 The JCT also suggests that some revenue might be derived from taxing shareholder dividends or share buy-backs
funded by foreign earnings repatriated under the temporary tax preference Economists do not agree about whether
multinationals used funds repatriated under the HIA for those purposes which the HIA barred Greater shareholder
dividends and share buy-backs also could occur using funds freed up by the influx of repatriated earnings If such
effects did occur they would have been modest Since there are no data confirming or tracking such effects we do
not include them in our analysis of either HIA or its proposed reprise
4
otherwise they would have repatriated in later years at the ordinary US corporate tax rate The
short-term increase in repatriations would be sufficient to increase revenues for two years since
otherwise the earnings represented by the increase would remain abroad untaxed by the US
Treasury However if the Act‟s main effect was to alter timing bringing forward to the
temporary period of lower taxes foreign earnings which otherwise would have been repatriated
in later higher tax years the tax change would reduce overall revenues In fact the JCT
projected substantial declines in repatriations in the out-years following the 2004 Act producing
$33 billion lower revenues over the ten years following its enactment than if the Act were not in
place The JCT‟s revenue estimate for a policy of reprising those provisions in 2011 adopted the
same assumption with a resulting $787 billion estimated revenue cost over the ten years
New data from the IRS do not support the JCT‟s central assumption about the time-
shifting of repatriations and the revenue estimate based largely on it Those data show that as
expected multinationals repatriated abnormally-high levels of foreign-source income at the
temporary preferential tax rate in FYs 2004-2005 as intended under the Act and as is intended
under proposals to temporarily reinstate those provisions To the degree that these high levels
reflected earnings that otherwise would have stayed abroad the Act actually produced revenue
increases relative to the baseline and would not have been followed in subsequent years by
lower than normal repatriations To the degree that the higher repatriations reflected earnings
that otherwise would have been brought back later at a higher tax rate it would have produced
revenue losses as those high-repatriation years were followed by much lower than normal
repatriations in subsequent years In fact the latest IRS data show that once the 2004-2006
preferential rate expired repatriations in 2007 and 2008 did not decline as expected by the JCT
but returned to their trend growth rate before the 2004 Act or even accelerated As a result the
out-year revenue losses expected by the JCT would not have materialized
We cannot fully duplicate the JCT‟s revenue-estimating process However we can
replicate much of the process by introducing assumptions about future repatriation levels
consistent with the latest IRS data After doing so we estimate that the HIA will produce a
revenue gain of $235 billion over ten years compared to the JCT‟s prediction of a $33 billion
revenue loss If a reprise of the 2004 Act were enacted reinstating the 525 percent preferential
tax rate (before foreign tax credits) for qualified repatriations in FY 2011 and FY 2012 the
results would include a temporary increase in repatriations and the revenues collected on the
increased repatriations as expected by the JCT Some of the higher repatriations would be offset
by reduced revenues from the temporary lower tax rate compared to current law However if
repatriation behavior in subsequent years follows the pattern seen in the 2007 and 2008 IRS data
revenues in the out-years would not decline relative to current law By projecting the continued
growth of repatriations at the actual rates in the initial out-years following the temporary tax
reduction in the HIA we find that a reinstatement of the HIA‟S provisions for FYs 2011 and
2012 would increase revenues by an estimated $87 billion over the years FYs 2011-2021
II The JCT Revenue Estimate for the Homeland Investment Act
To understand and evaluate the JCT‟s revenue estimates for the 2004 Act and its reprise
in FY 2011 we begin by analyzing both the provisions of the 2004 Act and the assumptions
adopted by the JCT to estimate its revenue consequences
5
Provisions of the Homeland Investment Act of 2004
The 2004 Act included a number of technical restrictions on the nature or source of the
foreign-source income eligible for the preferential rate upon repatriation7 Generally speaking
dividends qualified for preferential treatment under the 2004 Act had to exceed the average
dividend received from the parent company‟s CFCs over the five tax years ending prior to July 1
20038 These qualified dividends were further limited to the greater of $500 million or the
earnings ldquopermanently reinvestedrdquo outside the United States according to the MNC‟s most
recently audited financial statement9 Earnings repatriated at the preferential rate also had to be
used for certain specified domestic reinvestment uses including hiring new employees or
training existing staff increases in employee salaries or benefits (excluding executives) research
and development within the United States investments in infrastructure intangible property and
other capital investments certain types of debt repayment advertising or marketing and the
acquisition of business entities including foreign entities The funds could not be used for
executive compensation intercompany transactions shareholder distributions stock
redemptions portfolio investments local state or federal tax payments and purchases of
Treasury bills municipal or corporate bonds However as long as corporations used funds
equivalent to those repatriated under the preferential rate they could spend as much as they
chose on anything else including the uses barred for funds brought back under the Act Finally
companies could not use the dividend deduction to eliminate all of their taxable income10
Economists continue to debate whether the 2004 Act increased employment or
investments in its other permitted purposes For example one study used modeling techniques to
infer that the data were most consistent with firms increasing their spending on shareholder
7 For example eligible income included section 302 and section 304 redemptions of stocks section 316 dividends
and cash from inbound liquidations considered a dividend under the provisions of 367(b) However other funds
treated as dividends under section 367 as well as section 1248 dividends subpart F income from the earnings and
profits of CFCs and previously taxed income (PTI) were not eligible Redmiles (2008) 8 The base period dividends included distribution of PTI under subpart F dividends of property and section 956
distributions To compute the average the maximum and minimum annual dividends were discarded and the
remaining 3 tax years were averaged Taxpayers were also required to reduce qualifying dividends by any increase
in their CFC debt to related persons This requirement prevented taxpayers from loaning funds to their CFCs and
including the payments in their cash dividends An exception existed for banks and securities dealers and for
intercompany trade payables 9 There is a considerable literature studying the effect of repatriations and repatriation taxes on firm incentives and
behavior For example Hines and Hubbard (1990) analyze 1984 tax return data and report that a one percent
decrease in the repatriation tax is associated with a four percent increase in dividend payments by foreign
subsidiaries Further Desai et al (2001) use Bureau of Economic Analysis (BEA) data on dividend repatriations to
conclude that repatriations are sensitive to repatriation taxes They infer from their data that repatriation taxes
reduce aggregate dividend payouts by 128 percent In addition Foley et al (2007) hypothesize that the repatriation
tax cost help explain why firms hold significant amounts of cash an empirical observation previously explained by
the existence of transaction costs and precautionary motives Firms that face higher repatriation tax burdens hold
higher levels of cash hold the cash abroad and hold the cash in affiliates that would trigger high tax costs when
repatriated 10
Technically the HIA stipulated that the taxable income of a multinational using the HIA could not be less than the
non-deductible portion of the qualified dividends it claimed
6
payouts which was not a permitted purpose11
Similarly other researchers found evidence of
large increases in stock repurchases by firms using the 2004 Act also not a permitted purpose12
However a third study surveyed tax executives in firms claiming the deduction and drawing on
this direct evidence the researchers concluded that firms did use their repatriated funds to hire or
train US employees and expand capital investments and domestic RampD as required13
The
most recent published analysis found similarly that firms that were financially constrained in
2004 and 2005 used their repatriated funds to expand their domestic investments14
Actual Repatriations under the HIA
As expected the 2004 Act substantially increased the volume of repatriated foreign
earnings in the first two years as reported in the IRS Statistics of Income15
One study of these
flows found that 843 multinational companies claimed preferential tax treatment for foreign-
source earnings repatriated in this period and these MNCs collectively repatriated nearly $362
billion of which $312 billion qualified for the deduction16
The distribution of these deductions
across industries broadly reflects the distribution of foreign earnings across industries ndash with
more than 80 percent coming from manufacturing firms and 50 percent coming from the two
US sectors with the largest global market shares pharmaceuticalsmedicines and computers
and electronic equipment However some differences across industries may reflect differences
in the share of earnings and profits normally held abroad the ability to extract those earnings
within the allotted time frame and the availability of foreign versus domestic investment
opportunities17
For a complete breakdown of repatriations by industry FYs 2004-2006 see
Appendix Table A-1
The Terms of the JCT Revenue Estimate for the HIA
The $312 billion in funds repatriated under the HIA taxed at the 525 percent tax rate
would suggest that the Act generated revenues of $164 billion (312 x 0525 = 1638) However
a revenue estimate involves much more complex calculations based on how much revenue
would be generated in the absence of this policy change and assessments about how the policy
change would alter economic behavior The JCT provided the following revenue estimate for
the HIA during its consideration by Congress in 2004
11
Dharmapala Foley and Forbes (2008) 12
Clemons and Kinney (2008) 13
Graham Hanlon and Shevlin (2008) The contrary findings can be reconciled through the fungibility of corporate
funds as noted by Graham et al Some funds which otherwise would have gone to job creation and domestic
investments could be used for shareholder payouts and like once the newly-repatriated funds took care of jobs and
investments 14
Faulkender and Peterson (2011) 15
httpwwwirsgovtaxstatsbustaxstatsarticle0id=18069300html 16
Redmiles (2008) 855 percent of these deductions were claimed in 2005 with 77 percent claimed in 2004 and
68 percent in 2006 17
Blouin Jennifer and Linda Krull (2006) The pharmaceutical industry tends to have more cash on hand than other
industries due to high profit margins and minimal capital spending Overall about 86 percent of cash dividends
qualified for the deduction The percentage for the pharmaceutical and medicine manufacturing industry was
noticeably higher at 94 percent
7
Table 1 2004 JCT Estimates of Revenue Effects of the HIA ($ billions)18
Fiscal Year 2005 2006 2007 2008 2009 2010 2011 2012 2013 2014 Total
Revenue
Change $28 - $21 - $13 - $08 - $06 - $04 - $03 - $03 - $02 -$ 02 - $33
This estimate shows that the JCT expected the HIA to increase repatriations sufficiently
to produce nearly $3 billion in additional revenues in FY 2005 after accounting for the revenue
costs of the lower tax rate on repatriations that would have occurred in that year without the
change However JCT projected that the one-year revenue increase would be followed by nine
years of lower revenues than under the baseline reflecting the shift of repatriated funds from
those years to 2004-2005
The most comprehensive exegesis of the JCT revenue estimate as noted earlier is the
2008 analysis published by the JCT‟s Kleinbard and Driessen To create the revenue estimate
above the JCT first built a baseline of estimated revenues from all foreign-source corporate
income under the law prevailing before the HIA based on tax return data on repatriations and the
foreign tax credits claimed against the US taxes on those repatriated dividends19
We infer that
JCT staff estimated that in a typical year the residual US corporate income tax on all reported
foreign source income would range from $10 billion to $20 billion20
An estimated $2 billion of
those annual taxes were collected on repatriations from low-tax foreign countries producing the
highest US tax burdens upon their repatriation Consequently most income earned in low-tax
countries is held abroad as income ldquopermanently reinvestedrdquo which provided one of the
parameters for the 2004 Act Firms generally repatriate such income only when the parent
company has a compelling reason such as financial distress or a major acquisition The bulk of
repatriations and the source of most of the revenues are earnings from high-tax nations which
carry large foreign tax credits21
The JCT‟s estimate of the revenues that would be collected under the HIA relied on its
staff‟s subjective views of the planning and investment strategies of US multinationals and the
role ascribed to foreign-source income in those plans as well as the historic data on repatriations
and foreign-tax credits under then-current law Based on its views and that evidence the JCT
estimated that under HIA US companies would repatriate approximately $235 billion JCT
divided these aggregate earnings into three pools Pool number one amounting to an estimated
$30 billion per-year represented foreign earnings that US multinationals would have
repatriated in any case22
Therefore the US tax on this income would be significantly lower
under the HIA than under the baseline The second pool represented repatriations from relatively
18
Joint Committee on Taxation (2004) 19
Kleinbard and Driessen (2008) 20
The JCT provides little data or detailed explanation for its revenue cost of $33 billion Using JCT data our
analysis suggests a revenue gain of $82 billion under HIA with baseline revenues over 10 years totaling about $20
billion However this would suggest that the JCT‟s revenue estimate for HIA would be greater than $33 billion 21
Under the rules for constructing the baseline the JCT staff had to assume that the ldquoactive finance exceptionrdquo to
subpart F which was scheduled to expire in 2006 would expire as scheduled As a result the baseline projected
significant repatriations by multinational financial services firms prior to 2006 in order to take advantage of the
lower tax rates and avoid the harsher rules that would be in place after 2006 22
Note revenue-estimating conventions do not permit the JCT to discount future tax revenues
8
low-tax countries which otherwise would have occurred sometime over the ten-year revenue-
estimating period but which MNCs would now accelerate into the FYs 2004-2006 period in
order to take advantage of the temporary lower tax rate The JCT staff estimated that those
dividends would total around $75 billion over the ten year window This pool also was seen as a
revenue loser since this income would otherwise have been repatriated in later years at higher
tax rates The third pool were the ldquopermanently reinvested earningsrdquo which but for the HIA
would have remained abroad This pool which JCT staff estimated at $130 billion over the
forecasting period would earn higher revenues under the 2004 Act than under normal tax rules
The JCT estimate also relied on several additional assumptions all of which tended to
reduce the projected initial revenue gains or increase the projected revenue losses in later years
The most important assumption held that pushing forward repatriations which might have
occurred in later years would ultimately reduce the volume of repatriations in later years
regardless of the capital needs of the parent companies in those later years As we will see this
critical assumption proved to be incorrect In addition the JCT staff assumed that the 2004 ACT
would not affect the economy‟s total labor supply and investment levels The JCT model
therefore assumed for revenue-estimating purposes that the intended benefits of the Act would
not be realized or at a minimum would not affect revenues The JCT‟s modeling also ignored
the time value of money so that corporate revenues collected in 2005 were valued the same as
revenues collected in 2015 The use of a standard discount rate would have reduced the weight
of the projected revenue costs in later years relative to the revenue gains in the first years
Finally the JCT assumed that MNCs would employ certain tax-planning approaches which
would enable them to effectively pay less than the 525 percent on their repatriations (before
foreign tax credits) which also reduced the projected revenues
The JCT Revenue Estimate
The JCT‟s final revenue estimate was derived by calculating the difference between the
projected taxes collected under the baseline and the projected taxes collected under HIA For the
first two of three tranches of foreign-source earnings defined by the JCT the only difference was
the lower tax rate under HIA than under existing law ndash the pool of repatriations that would have
occurred in 2004-2005 regardless of the tax change and the pool of repatriations from low-tax
jurisdictions that would have occurred in later years regardless of the tax change and which
therefore were accelerated into 2004-2005 Therefore the JCT estimating process inevitably
found that revenues from these two tranches of foreign earnings would fall relative to current
law Only the third tranche of foreign-source earnings the funds that otherwise would not have
been repatriated at all could generate revenue gains For these earnings the JCT staff estimated
that the effective tax rate would be 365 percent rather than 525 percent after taking account of
foreign tax credits used to offset the taxes paid on the 15 percent of repatriated dividends not
eligible for the HIA deduction
The JCT also posited that the passage of HIA would create an expectation among
taxpayers that Congress would enact another temporary preferential rate for repatriations in the
future Therefore the estimate also assumes that the HIA would lead some multinationals to
invest more offshore than they would have otherwise and to retain more foreign-source earnings
offshore all in the expectation of a second round of HIA While the JCT cites no evidence to
9
support such a change in behavior its estimate includes another $1 billion in revenue losses over
ten years to reflect this assumed change
The net effect of these assumptions and procedures was the estimate of a net $33 billion
revenue cost for HIA including revenue gains in the first year and revenue losses in each of the
succeeding nine years (Table 1 above)
III A Critical Analysis of the JCT Revenue Estimate for the HIA Proposal
In this section we explore further the assumptions and procedures used by the JCT to
estimate the revenues for the HIA proposal Again while we cannot duplicate the large scale
dynamic modeling employed by bodies such as the JCT and the Congressional Budget Office
(CBO) we can apply historical and current data to evaluate the soundness of the JCT‟s
assumptions and projections in hindsight We find that JCT‟s projections were significantly
flawed chiefly because some of its assumptions proved to be incorrect
Comparing the JCTrsquos Revenue Scores with Actual Revenues
There is no doubt that the assumptions and procedures used by the JCT did not properly
capture the dynamics involved in repatriations during the period of HIA and the following two
years (the latest data available) The JCT forecast total repatriations of $235 billion for the
period FYs 2004-2008 by companies using HIA In fact actual repatriations totaled nearly $687
billion including $312 billion brought back under the preferential rate23
(Table 2 below) As a
result JCT‟s expectation of $123 billion (before tax credits) in total implicit revenues collected
on repatriated earnings over this period ($235 billion x 00525) hugely underestimated actual
implicit revenues of $1474 billion (also before foreign tax credits) The baseline revenues for
this period were $898 billion before tax credits As a result the JCT expectation of a difference
of - $775 billion between baseline revenues ($898 billion) and revenues under HIA ($123
billion) was off by $1351 billion from the actual difference of $576 billion between baseline
revenues ($898 billion) and implicit revenues under HIA ($1474 billion)
Table 2 Revenue Expectations of the JCT for HIA and Actual Implicit Revenues
Before Foreign Tax Credits FYs 2004-2008 ($ billions)24
Revenues
Baseline Repatriations
Implicit Revenues
with HIA
Revenue Difference
from Baseline
JCT Score $898 $2350 $123 - $775
Actual Data $898 $6866 $1474 $576
The large difference between the revenues projected by the JCT and the implicit revenues
-- revenues due at the given tax rates of 525 percent for repatriated earnings subject to the HIA
and 35 percent for non-HIA eligible repatriated earnings all before foreign tax credits -- reflects
in part the huge gap between the volume of foreign-source earnings actually repatriated over this
23
We compare JCT‟s forecast of foreign source earnings repatriated under HIA ($235 billion) with total
repatriations for the period FYs 2004-2008 ($687 billion) as well as repatriations under the preferential rate ($312
billion) because JCT assumed negligible repatriations in the years following the expiration of the lower rate 24
Authors calculations based in long-term growth rate of repatriations and 35 percent corporate tax rate
10
period ($6866 billion) and the volume of repatriations expected by the JCT ($2350 billion)
This difference in turn reflects in part the JCT‟s serious underestimation of the foreign earnings
repatriated under the HIA in FYs 2004-2005 as well as the foreign earnings repatriated in those
outside the terms and tax preference of the HIA (Table 3 below) An equally large part of the
difference however reflects the JCT‟s underestimation of the foreign earnings that would be
repatriated after HIA expired The JCT expected repatriations to decline sharply in FYs 2006-
2008 (and beyond) as MNCs shifted repatriations planned for those later years into the FY 2004-
2005 time frame of HIA This shifting of repatriations from later high-tax years to the two low-
tax years of the HIA generated all of the JCT‟s projected revenue losses relative to its baseline
IRS data show that this expected decline in post-HIA repatriations did not occur After
2004-2005 repatriations returned to the upward trend seen in the years preceding the enactment
of the HIA (Table 3 below) Note most of the HIA repatriations occurred in 2005 but under the
terms of the Act some could be claimed in FY 2004 and some in FY 2006 The bulk of the non-
HIA repatriations in the FYs 2004-2006 period occurred in FYs 2004 and 2006
Table 3 Repatriations and Implicit Revenues Before Foreign Tax Credits
FYs 2004-008 ($ millions)25
Fiscal Year Repatriations Implicit
Revenues
2004-2006 (HIA Repatriations (525 rate) $3123246 $163970
2004-2006 (Non-HIA Repatriations (35 rate) $1814517 $635081
2007 (35 rate) $883096 $309084
2008 (35 rate) $1045362 $365877
Total FYs 2004-2008 $6866220 $1474011
The data for FYs 2007 and 2008 clearly contradict the JCT expectation that repatriations
would decline from baseline projections in the post-HIA years In fact repatriations actually
accelerated after the expiration of HIA compared to their trend before its enactment We
collected IRS data on repatriations for the period 1994-2008 to establish whether repatriations
prior to the 2004 Act followed a predictable pattern26
The data include the tax returns of all
active US multinational corporations for this period including a separate entry for ldquodividends
received from foreign corporationsrdquo27
These data allow us to construct an estimate of average
repatriations prior to HIA as well as the potential tax revenues from these repatriations net of
foreign tax credits To test the predictive ability of these data for 2007 and 2008 we examined
25
IRS Statistics of Income and authors‟ calculations 26
httpwwwirsgovtaxstatsarticle0id=17069200html 27
Note that dividends received may include a small proportion of portfolio investments and not just income
repatriated from CFCs to the parent company For example for 2004 and 2006 (the only two years for which these
data are available) the IRS reports dividend repatriations from the CFC‟s to their US parents that were
approximately 85 percent of the total repatriations shown here Of course the two tables are based on different sub-
samples of returns so it is hard to compare the numbers from the two tables In general we believe that the bulk of
the repatriations are dividends paid from foreign subsidiaries Our numbers do change if we allow repatriations to be
only 85 percent of the values shown here However the overall result that the HIA yielded positive revenues does
not go away even if we make that assumption
11
two periods prior to HIA 1994-2003 the full decade before the 2004 Act and 1994-2001
ending with the first year of reduced repatriations from the 2001 economic downturn
Table 3 below shows that repatriations increased steadily from $303 billion in 1994 to
$649 billion in 1999 dipped modestly in 2000 to $602 billion and then fell significantly from
2001 to 2003 reflecting the recession and subsequent slow growth28
Between 2004 and 2006
the period in which firms could elect to repatriate under the low tax rate repatriations showed a
sharp increase Firms brought back $363 billion during FYs 2004-2006 using the HIA of which
$312 billion actually qualified for the deduction In FY 2005 alone US firms repatriated $363
billion in foreign source earnings including dividends brought back both under the terms of the
HIA and dividends repatriated under ordinary tax law Hence the period of the HIA marked a
clear break in trend from previous periods29
(Therefore these numbers include total
repatriations including those ineligible for the HIA) Table 3 shows that repatriations grew at an
annual rate of 45 percent from 1994 to 2003 and by 73 percent per-year from 1994 to 2001
Table 3 Actual Repatriations FYs 1994-2008 and Expected Repatriations
FYs 2002-2014 Based on Growth Rates for 1994-2003 and 1994-2001 ($ millions)30
Fiscal
Year
Repatriated
Dividends
Expected Repatriations
based on 45 annual growth
(1994-2003)
Expected Repatriations
based on 73 annual growth
(1994-2001)
1994 $303224 -- --
1995 $354181 -- --
1996 $462451 -- --
1997 $510093 -- --
1998 $492329 -- --
1999 $649054 -- --
2000 $602034 -- --
2001 $499977 -- --
2002 $455806 -- --
2003 $449215 -- --
2004 $584110 $469267 $619484
2005 $3619453 $490214 $665360
2006 $724200 $512096 $714633
2007 $883096 $534955 $767556
2008 $1045362 $558834 $824397
2009 NA $583780 $885448
2010 NA $609838 $951020
2010 NA $637060 $1021449
2012 NA $665500 $1097092
2013 NA $695203 $1178338
2014 NA $726235 $1265600
28
The NBER business cycle dating committee dated the start of the recession in March 2001 which explains this
decline in dividend repatriations 29
The repatriation numbers shown here are higher than those we reported in Table 1 which was specific to IRS
analysis of the 843 firms that repatriated to take advantage of the HIA tax rates Table 3 shows all repatriations
whether or not firms qualified for the low rates under the HIA 30
IRS Statistics of Income and authors‟ calculations
12
These calculations also provide a prediction of repatriations in later years assuming that
those repatriations would not fall sharply in 2007 and beyond as the JCT had predicted In fact
the latest IRS data show that they grew at an even faster rate than they had before the enactment
of the HIA The IRS reports that repatriations increased from $724 billion in 2006 to $883
billion in 2007 and $1045 billion in 2008 compared to our forecast of $539 billion in 2007 and
$609 billion in 2008under 45 percent annual growth and to $768 billion in 2007 and $824
billion in 2008 under the forecast of 73 percent annual growth Using the 73 percent annual
growth rate as our reference we find that actual repatriations were 131 percent greater in 2007
and 211 percent greater in 2008 than the trend established before the 2004 Act By contrast the
JCT revenue estimate concluded that in every period after 2005 or 2006 there would be revenue
losses relative to the baseline from multinationals having shifted repatriations planned for later
years to the 2004-2006 window provided by the HIA The new data also suggest that
repatriations will continue to increase through the JCT‟s estimating period for HIA Based on
the data for 2007 and 2008 we might expect those repatriations to continue to increase even
faster but for the global recession of 2008-2009 and slow growth in 2010 and 2011
If we exclude 2001 from our calculation of the average annual growth of repatriations
and include only 1994-2000 the average growth rate is 121 percent This trend would forecast
repatriations of more than $100 billion in both 2007 and 2008 Therefore the actual
repatriations show that the real trend lies between the trends for 1994-2001 (73 percent annual
growth) and 1994-2000 (121 percent annual growth) Whatever the precise long-term growth
rate of repatriations they are exceeding the growth rates of the pre-2001 recession period If
these trends continue the JCT‟s projected revenue losses from the HIA will never occur
Actual Revenues and the Use of Foreign Tax Credits
To evaluate the JCT revenue estimate for the HIA more directly we have to calculate the
implicit revenues derived by multiplying repatriations by the appropriate tax rate -- 35 percent
for repatriations that did not qualify for the HIA and 525 percent for repatriations that did so
qualify Next we adjust those calculations for foreign tax credits Finally we compare those
revenue estimates net of foreign tax credits with estimated baseline revenues As we will see
these calculations suggest that net revenues from repatriations for the estimating period FYs
2004-2014 will total an estimated $498 billion compared to estimated baseline revenues of
$263 billion for a net revenue gain of $235 billion over the ten-year period By contrast the
JCT forecast a net revenue loss of $33 billion
While the JCT modeling of its revenue baseline is not entirely transparent we assume it
draws on the maximum data available To forecast the volume of baseline repatriations
assuming there were no HIA we therefore first calculate the average annual growth rate of
repatriations over the preceding period To be conservative we will use the average growth rate
for 1994-2003 45 percent per-year Our projections of the implicit revenues (before foreign tax
credits) based on projected repatriations also should generally match the numbers derived by the
JCT Our estimate of baseline revenues before foreign tax credits suggests they would have
averaged about $172 billion per-year over the three-year period FYs 2004 to 2006 and would
13
have continued to increase from FY 2007 to FY 2014 This reconstruction of baseline
repatriations and implicit revenues before foreign tax credits is provided in Table 4 below
Table 4 Projected Repatriations and Implicit Revenues 2004-2014
Using 1994-2004 Average Growth Rate and Without the HIA ($ millions)
Year Expected Repatriations
Based on 45 percent annual growth
Implicit Revenues (Before Tax Credits)
Based on a 35 Percent Tax Rate
2004 $469267 $164244
2005 $490214 $171575
2006 $512096 $179234
2007 $534955 $187234
2008 $558834 $195592
2009 $583780 $204323
2010 $609838 $213443
2010 $637060 $222971
2012 $665500 $232924
2013 $695203 $243321
2014 $726235 $254182
The JCT revenue estimate for HIA assumed that almost all of the revenues over the ten-
year forecasting period would be collected on earnings from low-tax countries and during the
period of the temporary 525 percent preferential tax rate as MNCs brought forward to 2004-
2006 period earnings that might have been repatriated later Therefore all qualifying dividends
would be taxed at 525 percent Under HIA MNCs could claim foreign tax credits only for 15
percent of their qualified dividend income plus any other ineligible repatriated earnings The
JCT revenue estimate for HIA projected $235 billion in qualified dividends during 2004-2006
with no qualified dividends in later years At a tax rate of 525 percent before tax credits this
would yield $123 billion in baseline revenues for 2004-2006 and losses in subsequent years
since most of those revenues were assumed to have been brought forward from repatriations that
would have occurred in those subsequent years
As already noted in Table 2 above actual repatriations were much higher $3126 billion
in qualified dividends subject to HIA in FYs 2004-2006 another $1815 billion in non-qualified
dividends not subject to HIA in those same years plus normal repatriations of a $883 billion in
FY 2007 and $1045 billion in FY 2008 All told these dividends over FYs 2004-2008 would
have generated $1474 billion in implicit revenues before foreign tax credits That came to
$576 billion more than the JCT‟s estimate of $898 billion in baseline revenues (without HIA
and before foreign tax credits) as compared to the JCT‟s estimate of an implicit revenue loss of
$775 billion (before foreign tax credits)
Foreign Tax Credits
As noted now many times US corporations can claim a tax credit equal to the amount
of foreign taxes paid on dividends repatriated to the parent company so as to avoid double
taxation The theoretical maximum US tax owed on repatriated earnings therefore is 35
14
percent (if untaxed in the country where they were earned) and the ability to claim this credit
creates an incentive for firms to repatriate earnings mainly from subsidiaries located in high tax
locations thereby generating the largest foreign tax credits Therefore the actual tax revenues
collected from repatriated dividends may be much lower than the implicit revenues The foreign
tax credits claimed on repatriated earnings since 2000 have ranged from $411 billion in 2001
more than $100 billion in 200831
(See Appendix Table A-2 for a breakdown of foreign tax
credits by year 1994-2008) HIA disallowed foreign tax credits on the foreign earnings eligible
for the 85 percent deduction which in effect reduced the size of foreign tax credits claimed
against income brought back at the preferential rate to 15 percent of the foreign taxes paid on
that income
A simple way to estimate the revenue from dividend repatriations taking account of
foreign tax credits would be to multiply the volume of repatriations by 35 percent and deduct the
foreign tax credits listed in Table A-2 after segregating repatriations brought back under HIA
and multiplying those repatriations by 525 percent However the foreign tax credits claimed in
each year except 2005 actually exceed the implicit revenues before foreign tax credits from the
repatriations reported for those years which would imply zero aggregate revenues32
(See
Appendix Table A-3 for implicit revenues and foreign tax credits by year FYs 1994-2008)
These aggregate data however give an incomplete picture While firms may be able to lower
their taxes on repatriated dividends significantly by repatriating from high-tax jurisdictions such
a tax strategy is not available to all firms or at all times Therefore to determine the actual
effective tax rate on repatriated dividends ndash the US taxes owed after foreign tax credits -- we
draw on studies that focus specifically on this issue
Research by Harry Grubert a senior economist at the Treasury Department found that
the majority of firms but not all face negative effective tax rates on their repatriations (ie owe
no US corporate tax)33
That explains why dividend repatriation in 2000 resulted in tax
revenues of only some $13 billion It further suggests that tax revenues from repatriated income
come from dividends earned mainly in comparatively low-tax countries and are received by
parent companies without excess foreign tax credits from high-tax jurisdictions Two recent
studies have estimated that the effective tax burden on repatriations from low-tax countries after
tax credits averaged about 33 percent34
The broadest academic study used BEA data on
multinationals covering the years 1999 to 2004 and found that the average effective tax rate on
repatriated foreign incomes was an estimated 1026 percent35
In either case the use of foreign tax credits clearly and sharply reduces the revenues
collected on repatriated foreign-source income with or without HIA For our calculations we
assume that the effective tax rate on repatriations not eligible for the preferential rate under HIA
after foreign tax credits is 1026 percent This estimated tax rate may be too high but it is the
31
httpwwwirsgovtaxstatsarticle0id=17069200html 32
Foreign tax credits as reported by the IRS include credits for taxes paid on royalties and interest income which is
separate from the dividend income paid by subsidiaries to their parent companies but the vast bulk of the credits do
involve dividend repatriations In 2007 $US companies paid or were deemed to have paid an estimated $99 billion
in foreign taxes of which an estimated $53 billion was related to dividend income 33
Grubert (2005) 34
Grubert and Altshuler (2008) Grubert and Mutti (2001) 35
Blouin et al (2009)
15
result reported by the best academic analysis currently available Using our projections of
baseline repatriations this value produce baseline revenues projections for the years FYs 2004 to
2014 averaging about $6 billion per-year (See Appendix Table A-4 for these calculations by
year) This tax rate also suggests that over the decade preceding the enactment of HIA 1994-
2003 tax revenues from repatriations averaged $3 billion to $4 billion The JCT reports that tax
collections averaged about $2 billion per-year from pre-HIA repatriations from low-tax
countries which makes our numbers somewhat higher than the JCT If we used an effective tax
rate falling between the 1026 percent estimate and the more conservative 33 percent estimate
for repatriations not eligible for a preferential rate the numbers would agree For example
analysis by PricewaterhouseCoopers suggests that the effective tax rate on repatriations in FY
2004 was 81 percent although it is unclear what share of those dividends qualified for the
preferential rate under HIA
The JCT staff assumed an effective tax rate on qualifying dividends under HIA of 365
percent -- after the 85 percent deduction and the foreign tax credits on the remaining 15 percent
Therefore based on the JCT‟s forecast of $235 billion in qualified dividends under the HIA they
estimated revenues approaching $82 billion from the Act Since this estimate was less than their
forecast of baseline revenues without HIA the JCT concluded that the HIA would lose $33
billion in revenues over 10 years36
Finally we establish how close the JCT estimate came to actual revenues We can
calculate the revenues after foreign tax credits collected on repatriated dividends during the HIA
period and the subsequent two years as follows MNCs could not claim foreign tax credits
against the qualified repatriated earnings so the tax revenues from that portion of repatriated
income is unchanged from the implicit revenues presented earlier corrected for the JCT‟s
underestimation of their dimensions ($235 billion forecast by JCT compared to $312 billion
actually claimed) Based on the academic literature the average tax rate on qualifying
dividends after foreign tax credits on the taxable 15 percent was 365 percent37
Further full
foreign tax credits were allowed against the nondeductible portion of repatriated income For
dividends not qualifying for HIA treatment which were repatriated during the 2004-2006 as well
as for repatriated earnings in 2007 and 2008 we use the 1026 percent tax rate from the academic
literature to calculate the revenues from these foreign-earnings after foreign tax credits
Moreover IRS data showed that repatriated earnings in 2007 and 2008 did not decline as the
JCT had assumed and predicted but actually accelerated relative to their pre-HIA trend The
results are presented in Table 5 below
Table 5 Tax Revenues from Repatriated Foreign Earnings Net of Foreign Tax Credits
Based on Actual Data FYs 2004-2008 ($ millions)
Fiscal Year and Type of Dividends Repatriations Revenues
After Foreign Tax Credits
Dividends Under HIA 2004-2006 $3123246 $113999 (365 rate)
36
It is not clear how the JCT derived its revenue cost of $33 billion Our calculations using JCT data produce a
revenue estimate of $82 billion under HIA and baseline revenues over 10 years would total about $20 billion
Therefore the JCT‟s projected revenue cost for HIA would seem to be greater than the $33 billion reported 37
Redmiles (2008)
16
Non-Qualifying Dividends 2004-2006 $1814517 $186169 (1026 rate)
Normal Dividends 2007 $883096 $90606 (1026 rate)
Normal Dividends 2008 $1045362 $107254 (1026 rate)
Totals $6866220 $498028
Based on actual repatriation data the estimated revenues collected under HIA and the
subsequent two years came to $498 billion compared to the projected baseline revenues for this
period of $263 billion Therefore the JCT revenue estimate for HIA over the first five years
(FYs 2004-2008) was incorrect in both sign and dimensions
IV The Revenue Estimates for a Reprise of HIA in 2011-2012
In April 2011 Representative Lloyd Doggett asked the JCT to provide a revenue estimate
for two proposals including one that would reinstate the provisions of HIA as applied to
repatriations occurring in a company‟s first taxable year after December 31 2011 An elective
temporary 85 percent deduction for certain dividends received from controlled foreign
corporations The JCT offered the following ten-year revenue estimate covering FYs 2011-2021
Table 6 JCT Revenue Estimate for a Reprise of HIA FYs 2011-2021 ($ billions) 38
2011 2012 2013 2014 2015 2016 2017 2018 2019 2020 2021 2011-2021
$34 $125 $96 -$128 -$135 -$141 -$141 -$134 -$127 -$122 -$117 - $787
The assumptions underlying the new JCT revenue estimate are generally the same as
those adopted by the JCT for its 2004 revenue assessment of HIA39
In particular the JCT
continues to assume that MNCs would bring forward to 2011 and 2012 repatriations planned for
later years and that would result in negligible repatriations in the years following the temporary
tax preference This assumption is captured by the JCT‟s assumed ldquoacceleration effectrdquo as
income that would have been repatriated in the out-years is brought forward for repatriation
during the period of the temporary tax preference Without this assumed effect which the JCT
states explicitly the Committee‟s estimated revenue losses would have been much smaller As
we established with respect to the HIA however repatriations rose significantly in the period of
the tax preference (FYs 2004-2006) In addition repatriations in subsequent years far from
falling actually accelerated in 2007 and 2008 relative to their pre-HIA trend The large increase
in repatriations in response to the tax incentive appear to have come from funds held abroad
which firms had not planned to repatriate producing a revenue increase Furthermore the
provision far from inducing revenue losses in later years was followed by continuing growth in
revenues As a result the overall revenue results of HIA were significantly positive
There is one notable difference regarding the JCT‟s two baselines The 2011 JCT
estimate assumes that US multinationals will repatriate more foreign-source income than in
earlier periods based on domestic needs and the growth in CFC income This may reflect the
JCT‟s assumption in 2004 that the HIA would create the expectation of another temporary tax
preference for repatriated profits which in turn would induce multinationals to shift more of
38
httpdoggetthousegovimagespdfjct_repatriation_scorepdf 39
Ibid
17
their operations abroad so that more of their profits would be generated there As noted earlier
the JCT provides no evidence of such an effect nor are there data or independent analyses that
support this JCT assumption It is true that the recent decades of strong growth by developing
nations have led to much greater foreign direct investment by US multinational companies
mainly to serve fast-growing foreign markets This trend began many years before the HIA and
its effects on repatriation should be part of the JCT‟s revenue baseline and therefore not affect
the revenue estimate for the temporary tax preference Further if the JCT‟s assumed behavioral
changes in response to the HIA have occurred at all the effects would be very difficult to
distinguish from responses by the same companies to various disincentives for domestic US
investment arising from other parts of the US tax code or economic conditions Finally
deferral provisions in place for nearly a century already insulate most of the foreign earnings of
US MNCs from the US corporate tax until those earnings are actually repatriated
There is also a reference to possible revenues derived from taxing shareholder dividends
or share repurchases financed by foreign earnings brought back under the temporary tax
preference The HIA barred the use of qualified dividends for these purposes and economists do
not agree about whether multinationals nonetheless used funds repatriated under the HIA in this
way However since money is fungible MNCs could use domestic funds freed up by an influx
of the tax-preferred repatriated earnings to fund moireacute shareholder dividends and share
repurchases At the same time if this effect did occur under HIA it would have had only modest
revenue effects
Since the JCT does not provide a basis for accounting for this effect or for its larger
behavioral assumption and as there also are no data confirming or tracking such effects and
behavioral changes we focus here on the impact of the larger acceleration effect Here we
apply a similar critical analysis to the revenue estimate for the current proposal While our
earlier analysis could rely on actual data for 2004-2006 and for 2007 and 2008 there are no data
to directly refute or validate the JCT assumptions used to price a reprise of HIA in FYs 2011-
2012 Instead we apply the lessons provided by the actual data for FYs 2004-2008
As our starting point we use data on the share of permanently-reinvested earnings (PRE)
that potentially could be repatriated under a reprise of HIA The JCT estimate of repatriations
appears to begin as well with the volume of accumulated foreign earnings as captured by PRE
data The JCT report notes that the level of repatriations will be considerably higher in 2011 and
2012 than in 2004 and 2005 because US multinationals have built up a larger stock of such
permanently-reinvested earnings While precise data on foreign-source earnings remaining
abroad is unavailable most estimates range from $700 billion to more than $1 trillion For
example PricewaterhouseCoopers in July 2010 used a sample of 841 multinationals to estimate
that their accumulated PRE was about $115 trillion at the end of 200940
The JCT revenue
estimate relies on a different 2009 analysis which held that these earnings would grow to more
than $700 billion by the end of 201041
Table 7 below presents our forecast of qualified
repatriations under a reprise of HIA in FYs 2011-2012 To be conservative we adopt the JCT
$700 billion estimate of PRE and apply the 86 percent share of PRE repatriated under the HIA in
FYs 2004-2006 This produces an estimate of $6045 billion in foreign earnings that would be
40
PricewaterhouseCoopers (2010) 41
Sheppard and Sullivan (2009)
18
repatriated in FYs 2011-2012 under a renewed HIA42
Next we apply the estimated 365 percent
tax rate for qualified dividends repatriated after foreign tax credits to forecast of nearly $221
billion in revenues likely to be generated in FYs 2011-2012 from these qualified repatriations43
For our estimate of out-year revenues we apply our analysis of the out-year revenues
from HIA including the evidence that repatriations at a minimum revert to their trend growth
rate in the subsequent years In fact we found that repatriations in FYs 2007 and 2008 exceeded
the pre-HIA trend but here we adopt two more conservative assumptions First we assume that
repatriations will merely return to their trend growth rate rather than continue to accelerate
Further we adopt the lower pre-trend growth rate of 45 percent annual growth which reflected
the economic slowdown in 2001-2003 to recognize the current period of slow growth Using
these assumptions we estimate repatriations for the remainder of the revenue-estimating period
FYs 2013-2021 Finally we apply the residual US corporate tax rate for these repatriations
1026 percent for the post FY 2011 HIA period The results ndash estimated repatriations and
revenues for FYs 2011-2021 under a reprise of HIA -- are provided in Table 7 below
Table 7 Estimated Repatriations and Revenues under a Reprise of HIA
FYs 2011-2012 ($ millions)
Fiscal Year Projected Repatriations Projected Revenues
2011-2012 (365 tax rate) $6045299 $220653
2013 (1026 tax rate) $695203 $71328
2014 (1026 tax rate) $726235 $74512
2015 (1026 tax rate) $758653 $77838
2016 (1026 tax rate) $792517 $81312
2017 (1026 tax rate) $827894 $84942
2018 (1026 tax rate) $864849 $88734
2019 (1026 tax rate) $903454 $92694
2020 (1026 tax rate) $943782 $96832
2021(1026 tax rate) $985910 $101154
Total $13543797 $989999
These calculations show that if the repatriation behavior of multinational companies after
a second HIA-style tax program follows their initial behavior after the original HIA program tax
revenues would total about $99 billion over the ten-year period Next to see whether the second
HIA program would likely gain or lose revenues on net we compare these projected revenues
with baseline revenues in the absence of an HIA-type policy We construct this baseline by
applying the same assumptions about the trend growth rate repatriations 45 percent per-year
and the average effective tax rate on those repatriations 1026 percent that we applied to the
post-HIA type program to the entire forecasting period of FY 2011-2021 Table 8 below
presents these estimates
42
The JCT may assume a slightly higher volume of repatriations under the preferential deduction which would
assume a higher percentage of PRE repatriated than in2004-2006 We cannot be certain because unfortunately the
JCT does not make those numbers public where they could be examined and debated openly 43
Note that this analysis does not include other repatriations that do not take advantage of the tax holiday If we
included those our estimate of revenues would be even higher However since there is no reasonable way of
projecting those repatriations we exclude them from this analysis
19
Table 8 Estimated Baseline Repatriations and Revenues FYs 2011-2021 ($ millions)
Fiscal
Year
Projected
Repatriations
Projected
Revenues
2011 $637060 $65362
2012 $665497 $68280
2013 $695203 $71328
2014 $726235 $74512
2015 $758653 $77838
2016 $792517 $81312
2017 $827894 $84942
2018 $864849 $88734
2019 $903454 $92694
2020 $943782 $96832
2021 $985910 $101154
Total $8801054 $902988
This analysis suggests that far from the ten-year $787 billion revenue cost projected by
the JCT a reprise of the HIA would likely raise revenues relative to the baseline Our estimate is
a revenue increase of $87 billion over ten years based on 45 percent annual growth in
repatriations and effective tax rates of 365 percent on qualified dividends and 1026 percent on
normal repatriations The math is now straightforward $98999 billion - $90299 billion = $87
billion
Our analysis and projection have certain limitations In particular we cannot forecast
with confidence domestic or global economic conditions over the next two years much less over
the next ten years We also cannot predict how other tax policies might change in the United
States and other nations including corporate rates over the next two or ten years However the
same uncertainties apply to the JCT‟s estimates of repatriations and revenues under both
scenarios Moreover we are very confident about the central difference between the JCT‟s
revenue estimate and our own The JCT forecasts that at some point in FY 2014 and for the
following years in the estimating period revenues under an HIA-type policy would turn negative
relative to baseline revenues because the JCT assumes that repatriations would fall to negligible
levels If this were to occur of course a reprise of the HIA would lose revenues as the JCT has
predicted However there is no empirical basis for this assumption and view Again following
the FYs 2004-2006 period of HIA IRS data show that repatriations at a minimum returned to
their long-term trend growth rate in FYs 2007 and 2008 In fact the growth rate of repatriations
appears to have accelerated modestly in FYs 2007 and 2008 relative to the long-term pre-HIA
trend If even the more conservative pattern were sustained following a reprise of HIA we
should expect a modest revenue gain rather than the large revenue loss forecast by the JCT
We note that our projected revenue gains under the original HIA at $235 billion appear
to be greater than the projected $87 billion revenue gain from a reprise of HIA in FYs 2011-
2012 despite much higher expected repatriations in the later period In part this reflects changes
20
in the JCT baseline used in the Committee‟s recent estimate reflecting the JCT‟s estimate of
higher rates and levels of repatriations under normal law than were assumed in 200444
More
important our $87 billion in revenue gains relative to the baseline all occur in FYs 2011-2012
After that point and consistent with the latest IRS data but unlike the JCT we do not assume or
forecast revenue losses in subsequent years Instead we forecast a return to normal or baseline
levels of repatriations for the rest of the forecasting period (FYs 2013-2020) By contrast the
JCT forecasts that those would be the years when its estimated $787 billion revenue loss would
occur Finally while our projected revenue gain is nominally greater for the original HIA at
$235 billion than for its reprise at $87 billion the difference between our estimates and the
JCT‟s forecasts is greater under a reprised HIA than under the original policy Under a new
HIA the difference between our estimated revenue gains of $87 billion and the JCT‟s estimated
revenue loss of $787 billion is $874 billion compared to a $268 billion difference between our
estimated $235 billion in revenue gains for the original HIA and the JCT‟s forecast of a $33
billion revenue loss
The Revenues Estimates and Recent Economic Studies of Multinational Companies
The JCT approach assumes that repatriations expand or contract mainly in response to tax
rates This view is implicit in its modeling of HIA as well as its recent projections for a reprise of
the 2004 policy This view of the power of tax rates is especially evident in the JCT‟s
assumption that companies would respond to the temporary lower tax rate by bringing forward to
the period of the tax preference most or all of the repatriations which otherwise would have
occurred later As a result JCT forecasts that the policy would disrupt the normal course of
repatriations driving post-HIA repatriations to levels far below those of the baseline forecast
As noted now many times the repatriation data for FYs 2007 and 2008 did not correspond even
remotely to the JCT forecast In addition the JCT‟s view is at variance with recent evidence and
analysis about how multinational corporations operate more generally
For example a 2006 study examined the determinants of the repatriation practices of US
multinational firms45
The study found that while tax considerations influence these
repatriations tax minimization does not explain a significant share of actual firm-level
repatriation policies and behavior Comparing the repatriation behavior of firms subject to
sharply different taxes on those repatriations the authors found only modest differences In fact
some firms incur avoidable tax penalties by simultaneously repatriating dividends and investing
in new equity in the same subsidiaries In turns out that financial considerations can be more
paramount than taxes Parent companies that need cash to fund domestic investments or to pay
dividends to their shareholders use repatriations to draw on the resources of their foreign
affiliates This finding is reinforced by subsequent research which found as noted earlier that
firms which were already capital-constrained used HIA to repatriate funds to support planned
domestic investments46
44
The JCT predicted much a smaller PRE base for the 2004 proposal establishing a lower baseline The PRE base
predicted for the second round is much larger however raising the baseline 45
Desai Foley Hines (2006) 46
Faulkender and Petersen (2011)
21
The proposition that financially-constrained parent companies with profitable domestic
investment opportunities will sometimes finance those capital expenditures by drawing on the
accumulated earnings of their foreign affiliates even when it involves avoidable tax costs can be
tested Technically this involves measuring the extent to which the repatriated dividend policies
of heavily-leveraged firms in industries with high values of ldquoTobin‟s qrdquo differ from the
repatriated dividend policies of other firms Tobin‟s q measures the ratio between the market
value and replacement value of the same physical asset or investment and industries with high
values of Tobin‟s q have large incentives to undertake new investment The evidence indicates
that firms with significant domestic cash needs arising from a combination of attractive domestic
investment opportunities (Tobin‟s q) and high degrees of leverage repatriate cash from their
foreign affiliates to meet these needs In short the expected returns from investments can trump
tax incentives producing much of the significant repatriations in the post-HIA period seen in the
IRS data
Other evidence suggests that these repatriations are also driven by complementarities in
the economic activities of US parent companies and their foreign subsidiaries A seminal 2008
analysis of the investment behavior of US multinationals found that the foreign and domestic
activities of US multinational companies are correlated positively47
Increases in investment
and employment in a MNC‟s foreign subsidiaries are associated with increases in domestic
investment and employment by the parent company As a result we should expect higher
repatriations by a MNC when investment and employment by its foreign subsidiaries expand in
order to help finance the accompanying domestic expansions by the parent company This result
would be especially pronounced if the costs of domestic credit for the US parent company are
relatively high This dynamic was also identified in an earlier 2005 study by the same authors
which focused specifically on the foreign capital expenditures and domestic capital spending of
US multinational companies48
Finally other research has highlighted additional non-tax
related factors that also influence dividend repatriations 49
For instance if a high growth rate in
a foreign economy is accompanied by strong performance and high earnings by the foreign
affiliates of an MNC agency considerations may drive the US parent company to restrict the
cash flow available to the managers of the subsidiaries resulting in higher dividend repatriations
This effect has been directly observed in multinationals headquartered in the United Kingdom
A review of recent economic research and evidence therefore shows that many factors
in addition to tax policies ndash and especially in addition to temporary tax deductions reductions --
influence dividend repatriations by multinational companies The JCT‟s crucial conclusion that
repatriations would fall drastically following the HIA or following its reprise in the present
period because the average effective tax rate would rise from the temporary 365 percent to
some 1026 percent is refuted by economic analysis and theory as well as the data
47
Desai Foley Hines (2009) 48
Desai Foley Hines (2005) 49
Lehmann and Ashoka Mody (2006) See also Lehman Alexander and Ashoka Mody (2004) International
Dividend Repatriations Issues 2004 -2005
httpbooksgooglecombooksid=21xxemX8Mf8Camppg=PA12amplpg=PA12ampdq=what+influences+dividend+repatri
ationsampsource=blampots=xTn5Q5wK6Yampsig=XKdrDZhKf1JEcDwxiY_ZX4ryXKMamphl=enampei=llowTvHzLoT20g
HspM2HAwampsa=Xampoi=book_resultampct=resultampresnum=2ampved=0CCEQ6AEwAQv=onepageampq=what20influe
nces20dividend20repatriations3Fampf=false
22
V Conclusion
This analysis has strived to establish whether the JCT‟s revenue estimates for the
Homeland Investment Act of 2004 and the proposal to reinstate its provisions for two years in
2011-2012 are accurate We found that the Committee misjudged the scale and character of the
foreign earnings repatriated under the HIA and more important the scale and nature of the
foreign earnings repatriated in subsequent years after HIA‟s expiration The JCT predicted that
the foreign earnings repatriated under HIA would come substantially from foreign earnings
which multinational companies would have repatriated in later years As a result the Committee
predicted a sharp drop in repatriations after the Act expired producing substantial revenue
losses Instead IRS data for FY 2007 and 2008 showed that repatriations in those years after the
expiration of HIA continued to grow compared to repatriations in the years preceding the
enactment of HIA In fact there is evidence that the growth of repatriations actually accelerated
after HIA expired again relative to their growth rate in the years before HIA Recent research
and analysis of the repatriation and investment behavior of multinational companies can help
explain why the JCT erred in both the sign and dimensions of the revenue consequences of the
HIA While MNCs took significant advantage of the temporary low tax rate under HIA to
repatriate several hundred billion dollars in foreign earnings as expected and intended under the
HIA they continued to repatriate substantial foreign earnings in subsequent years at normal tax
rates to meet their investment needs even exceeding projected levels based on pre-HIA trends in
repatriations As a result we estimate that the HIA will not cost US taxpayers $33 billion over
ten years relative to the baseline as the JCT predicted Rather we estimate HIA will result in a
ten-year revenue gain of some $235 billion
We applied the same analysis to the recent JCT revenue estimate a reprise of the
provisions of terms of HIA in 2011 and 2012 Using the same logic which the Committee‟s
revenue estimators applied to the 2004 proposal the JCT has projected that a second round of a
temporary lower tax rate on repatriated foreign earnings would reduce revenues by $787 billion
over ten years compared to the baseline We estimated repatriations under such a second round
of HIA and in the following eight years using projections based on the latest IRS data and come
to a very different conclusion We estimate that a second round of the provisions and terms of
HIA would produce revenue gains of $87 billion over ten years
Economic conditions in the United States and foreign markets have a significant effect on
such revenue estimates and given the economic upheavals of recent years those conditions are
impossible to predict with any confidence Therefore one cannot ascribe great certainty to either
the JCT‟s revenue estimates or those developed in this study However recent data and analysis
of the behavior of multinational corporations establishes with substantial certainty that the basic
approach adopted by the JCT to estimate the revenue losses under HIA and its proposed reprise
is fundamentally flawed Evidence and analysis strongly suggest that both HIA and a reprise in
2011 and 2012 would ultimately increase federal revenues relative to the baseline of taking no
new action
23
Appendix
Table A-1 Repatriations by Major and Minor Industry FYs 2004-2006 $ thousands50
Industry Qualified Dividends Share of Qualifying
Dividends All industries 312324610 100 Manufacturing 252251369 081 Food manufacturing 17637518 006 Paper 6186498 002 Chemicals 120202492 038 Basic chemicals 4803249 002 Pharmaceuticals and medicines 98780756 032 Plastics and rubber products 796360 000 Primary metal 478789 000 Fabricated metal products 4809733 002 Machinery 5353065 002 Computer and electronic equipment 57486812 018 Computer amp peripheral equipment 34199356 011 Semiconductor and electronic components 13569819 004 Electrical equipment appliance and components 4100543 001 Transportation equipment 10243076 003 Wholesale and retail trade 12860439 004 Wholesale trade durable goods 4643031 001 Wholesale trade nondurable goods 3910565 001 Retail trade 4306843 001 Transportation and warehousing 918156 000 Information 13202284 004 Software publishers 8256358 003 Finance insurance real estate rental leasing 11915338 004 Insurance carriers and related activities 2738175 001 Professional scientific and technical services 2739979 001 Management of companies and enterprises 7023785 002 Other services 5567914 002 All other industries 5845347 002
50
The numbers are taken directly from the IRS Statistics of Income and the sub-categories do not necessarily add up
to the larger industry category
24
Table A-2 Foreign Tax Credits Claimed FYs 1994-2008 ($ millions)51
Fiscal Year Foreign Tax Credits Claimed
1994 $254013
1995 $304203
1996 $402438
1997 $421996
1998 $373965
1999 $383900
2000 $485060
2001 $410632
2002 $420215
2003 $500336
2004 $568722
2005 $820512
2006 $781835
2007 $865799
2008 $1004337
Table A-3 Implicit Revenues from Repatriations and Foreign Tax Credits
Claimed for those Repatriations FYs 1994-2008 ($ millions)
Fiscal
Year
Revenues from Repatriations at
Appropriate Rate (35 or 525) Foreign Tax Credits
1994 $106128 $254014
1995 $123963 $304203
1996 $161858 $402438
1997 $178533 $421996
1998 $172315 $373965
1999 $227169 $383900
2000 $210712 $485058
2001 $174992 $410632
2002 $159532 $420215
2003 $157225 $500336
2004 $204439 $568722
2005 $1270310 $820512
2006 $253470 $781835
2007 $309084 $865799
2008 $365877 $1004337
51
IRS Statistics of Income httpwwwirsgovtaxstatsarticle0id=17069200html
25
Table A-4 Projected Revenues Net of Foreign Tax Credits
From Baseline Repatriations FYs 2004-2014 ($ millions)
Fiscal
Years
Projected Baseline
Repatriations
(without HIA)
Projected Tax Revenues Net of
Foreign Tax Credits Assumed
Effective Tax Rate of 1026
2004 $469267 $48147
2005 $490214 $50296
2006 $512096 $52541
2007 $534955 $54886
2008 $558834 $57336
2009 $583780 $59896
2010 $609838 $62569
2011 $637060 $65362
2012 $665497 $68280
2013 $695203 $71328
2014 $726235 $74512
26
References
Blouin Jennifer and Linda Krull ldquoBringing It Home A Study of Incentives Surrounding the
Repatriation of Foreign Earnings under the American Jobs Creation Act of 2004rdquo National Tax
Association August 2006
Blouin Jennifer and Krull Linda and Leslie A Robinson ldquo Is US Multinational Intra-Firm
Dividend Policy Influenced by Capital Market Incentivesrdquo (2009)
httpwwwkelloggnorthwesterneduaccountingpapersjblouinpdf
CRS (2011) ldquoTax Cuts on Repatriation Earnings as Economic Stimulus An Economic
Analysisrdquo httpwwwctjorgpdfcrs_repatriationholidaypdf
Clemons and Kinney bdquobdquoAn Analysis of the Tax Holiday for Repatriation Under the Jobs Act‟‟
Tax Notes Aug 25 2008 p759
Desai Mihir A C Fritz Foley and James R Hines Jr 2001 ldquoRepatriation Taxes and Dividend
Distortionsrdquo National Tax Journal 54 (4) 829-851
_______________(2005) Foreign Direct Investment And The Domestic Capital Stock
American Economic Review Vol 95 (2May) pp 33-38
_______________ (2006) ldquoDividend Policy inside the Multinational Firmrdquo
httpwwwpeoplehbseduffoleydividendspdf
_______________ (2009) Domestic Effects of the Foreign Activities of US Multinationals
American Economic Journal Economic Policy 1(1) 181ndash203
Dharmapala Dhammika Foley C Fritz and Kristin j Forbes 2010 ldquoWatch What I do Not
What I Say The Unintended Consequences of the Homeland Investment Actrdquo
httppapersssrncomsol3paperscfmabstract_id=1337206
Faulkender Michael and Mitchell Peterson ldquoInvestment and Capital Constraints Repatriations
Under the American Jobs Creation Actrdquo
httppapersssrncomsol3paperscfmabstract_id=1364207
Foley C Fritz Jay C Hartzell Sheridan Titman and Gary Twite 2007 ldquoWhy do Firms Hold so
Much Cash A Tax-Based Explanationrdquo Journal of Financial Economics 86 579-607
Graham John R Hanlon Michelle and Terry Shivlin ldquoBarriers to Mobility The Lockout Effect
of US Taxation of Worldwide Corporate Profitsrdquo
httppapersssrncomsol3paperscfmabstract_id=1316576
27
Grubert Harry and Rosanne Altshuler ldquoCorporate Taxes in the World Economy Reforming the
Taxation of Cross-Border Incomerdquo in John W Diamond and George R Zodrow (eds)
Fundamental Tax Reform Issues Choices and Implications Cambridge Mass MIT Press
2008
Grubert Harry and John Mutti Taxing International Business Income Dividend Exemption
versus the Current System Washington DC American Enterprise Institute 2001
Grubert Harry ldquoComment on Desai and Hines ldquoOld Rules and New Realities Corporate Tax
Policy in a Global Settingrdquo National Tax Journal Vol LVIIl No 2 June 2005
Hines James R Jr and R Glenn Hubbard 1990 ldquoComing Home to America Dividend
Repatriations by US Multinationalsrdquo In Razin A Slemrod J (Eds) Taxation in the Global
Economy University of Chicago Press Chicago IL pp 161-200
Internal Revenue Service Statistics of Income Bulletin
Joint Committee on Taxation ldquoEstimated Budget Effects of the Conference Agreement for HR
4520 bdquoAmerican Jobs Creation Act of 2004‟‟‟ Oct 7 2004 JCX 69-04 Item IV22
Kleinbard Edward and Patrick Driessen (2008) ldquoA Revenue Estimate Case Study The
Repatriation Holiday Revisitedrdquo Tax Notes Vol 120 No 12 September 22 2008
Lehmann Alexander and Ashoka Mody (2004) ldquoInternational Dividend Repatriationsrdquo
International Monetary Fund Working Paper No WP045
_______________ International Dividend Repatriations Issues 2004 - 2005 (2006)
International Monetary Fund
PricewaterhouseCoopers (2010) ldquoPermanently Reinvested Earnings of US Corporationsrdquo
National Economics and Statistics Division July 14 2010
Redmiles Melissa (2008) The One-Time Received Dividend Deduction‟‟ IRS Statistics of
Income Bulletin vol 27 number 4
Sheppard Lee A and Martin A Sullivan ldquoMultinationals Accumulate to Repatriaterdquo Tax Notes
January 19 2009
28
About the Authors
Robert J Shapiro is the chairman and co-founder of Sonecon LLC a private firm that provides
advice and analysis to senior executives and officials of US and foreign businesses
governments and non-profit organizations He is an internationally-known economist who has
advised among others President Bill Clinton Vice President Al Gore Jr British Prime
Ministers Tony Blair and Gordon Brown and US Senators Barack Obama and Hillary Clinton
Currently he is also a Senior Policy Fellow of the Georgetown University McDonough School of
Business advisor to the International Monetary Fund chairman of the US Climate Task Force
director of the Globalization Initiative at NDN co-chair of American Task Force Argentina and
a director of the Axson-Johnson Foundation in Sweden Before establishing Sonecon Dr
Shapiro was Under Secretary of Commerce for Economic Affairs from 1997 to 2001 Prior to
that he was co-founder and Vice President of the Progressive Policy Institute and the Progressive
Foundation He was the principal economic advisor to Bill Clinton in his 1991-1992 campaign
and a senior economic advisor to Vice President Gore and Senator John Kerry in their
presidential campaigns In the 2008 presidential campaign he advised the campaign and
transition of Barack Obama Dr Shapiro also served as Legislative Director and Economic
Counsel for Senator Daniel Patrick Moynihan He has been a Fellow of Harvard University the
Brookings Institution and the National Bureau of Economic Research He holds a PhD and
MA from Harvard University a MSc from the London School of Economics and Political
Science and an AB from the University of Chicago
Aparna Mathur is a Resident Scholar at the American Enterprise Institute where she focuses
on tax policy finance technology and health care policy issues Dr Mathur also is a noted
scholar in international finance and econometrics and an affiliate analyst for Sonecon LLC
She has been a consultant to the World Bank a researcher at the Tata Energy Research Institute
and an instructor in economics at the University of Maryland Dr Mathur holds a PhD and
MA from the University of Maryland as well as degrees from Hindu College and the Delhi
School of Economics of Delhi University
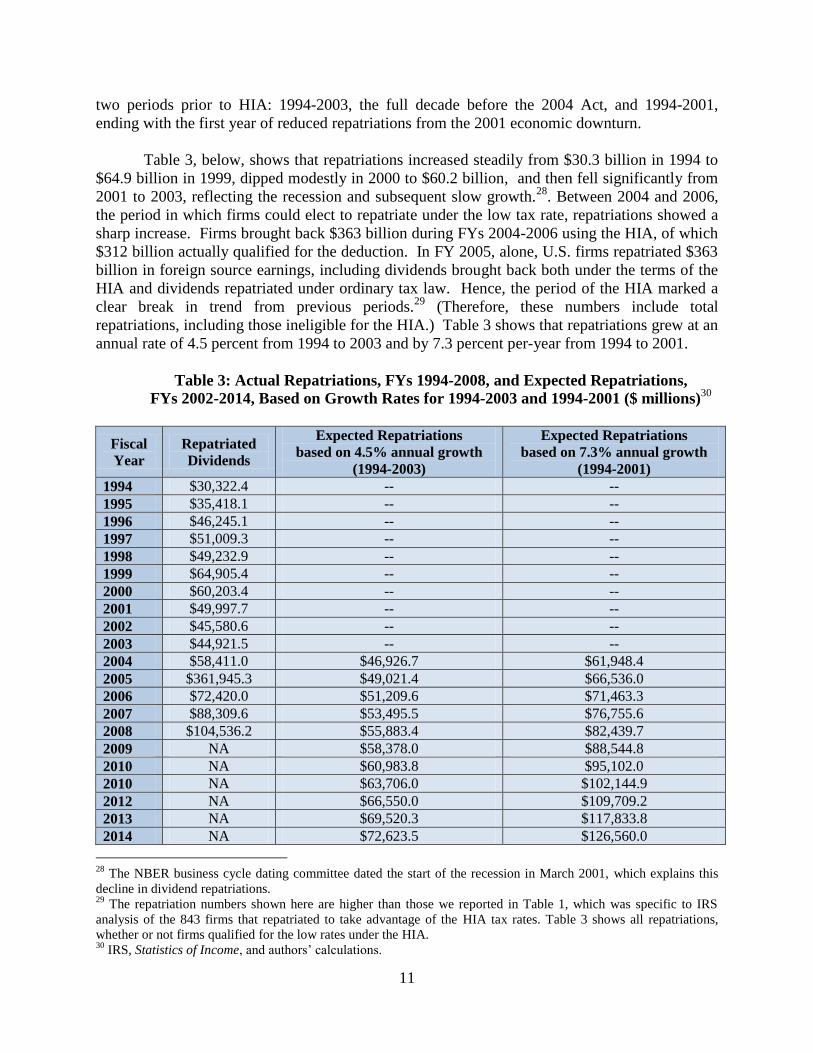


