1 The richer, the trustier? How party resources affect legislators’ style of representation Caroline Close FNRS Postdoctoral Researcher, Université Libre de Bruxelles (CEVIPOL) Vivien Sierens PhD Student, Université Libre de Bruxelles (CEVIPOL) ECPR General Conference – Oslo 2017 – Section “Political Parties: Transformation or Decline?” Abstract While legislative parties usually work as united bloc in parliamentary democracies, individual legislators have different perceptions of their representative role. Some legislators tend to exercise their mandate primarily as the delegates of their party, while others feel above all tied to their voters; and others rather exercise their mandate as trustees. As already put forward by existing research, legislators’ tendency to adopt one or the other style of representation may vary across institutional settings, and depending on individual legislators’ profile and motivations. By contrast, variations across parties remain barely understood. This paper investigates the extent to which legislators’ style of representation could be affected by extra- parliamentary party organisational structures and characteristics, and focuses especially on the role of intra-party resources available to the organisation. Using quantitative data collected in the frame of the PartiRep MP Survey and of the Political Party Database (PPDB), we investigate this relationship across 14 parliamentary democracies, 45 parties and 796 legislators. Among other findings, we uncover a positive and significant relationship between a party’s level of income and legislators’ tendency to adopt a party-delegate style. We discuss the possible mechanisms underlying these findings, and suggest potential avenues for further research. ***This is a work in progress. Please cite with caution***
Transcript
1
The richer, the trustier? How party resources affect legislators’ style of representation
Caroline Close
FNRS Postdoctoral Researcher, Université Libre de Bruxelles (CEVIPOL)
Vivien Sierens
PhD Student, Université Libre de Bruxelles (CEVIPOL)
ECPR General Conference – Oslo 2017 – Section “Political Parties: Transformation or Decline?”
Abstract
While legislative parties usually work as united bloc in parliamentary democracies, individual
legislators have different perceptions of their representative role. Some legislators tend to
exercise their mandate primarily as the delegates of their party, while others feel above all tied
to their voters; and others rather exercise their mandate as trustees. As already put forward by
existing research, legislators’ tendency to adopt one or the other style of representation may
vary across institutional settings, and depending on individual legislators’ profile and
motivations. By contrast, variations across parties remain barely understood. This paper
investigates the extent to which legislators’ style of representation could be affected by extra-
parliamentary party organisational structures and characteristics, and focuses especially on the
role of intra-party resources available to the organisation. Using quantitative data collected in
the frame of the PartiRep MP Survey and of the Political Party Database (PPDB), we investigate
this relationship across 14 parliamentary democracies, 45 parties and 796 legislators. Among
other findings, we uncover a positive and significant relationship between a party’s level of
income and legislators’ tendency to adopt a party-delegate style. We discuss the possible
mechanisms underlying these findings, and suggest potential avenues for further research.
***This is a work in progress. Please cite with caution***
2
Introduction
Theories of parliamentary party democracy usually expect party representatives to act
uniformly and follow their party’s policies. However, the preferences of elected representatives
may diverge from those of their party or voters, to which they are both accountable. In case of
such disagreement, legislators may adopt different styles of representation (party-delegate,
voter-delegate or trustee), depending on the principals (party, voters or their own opinion) they
choose to primarily represent. Existing research has already put forward how legislators’
tendency to adopt one or the other style of representation may vary across institutional
settings, and depending on individual legislators’ profile and ambition. However, variations
across parties have been questioned to a lower extent, and we still know relatively little about
the role of extra-parliamentary party organisational structures and characteristics in accounting
for these variations. Yet, the ‘party-in-public-office’ does not operate as an isolated entity, but
as one of the faces of a larger party organisation. We therefore expect that the extra-
parliamentary organisation would affect MPs’ attitudes towards their party. This paper tackles
this issue, and specifically examines the link between intra-party resources and legislators’ style
of representation.
Partisan organisations can rely on several types of resources: financial resources, emanating
from different sources (public subsidies, private donations, membership fees); paid staff, which
provides expertise in the party in public and central office; and members, which constitutes a
crucial reservoir of voluntary labour that can be mobilised during campaigns. In this paper, we
examine the effect of financial resources, by considering the annual party income (standardised
by the size of the electorate) and the source of this income (e.g. share of the income coming
from public subsidies), as well as the effect of party membership (standardised by the size of the
party’s electorate). We hypothesise that legislators in wealthier parties, in financial and
membership terms, will be more likely to adopt a party-delegate style. We also expect that
legislators in parties relying extensively on members’ donations will be more likely to adopt a
party-delegate style, while those in parties relying more on public subsidies will be more likely
3
to adopt a trustee or voter-delegate style. At the empirical level, we use quantitative data
collected in the frame of two comparative surveys: the PartiRep Comparative MP Survey, and
the Political Party Database (PPDB). Our dataset includes 796 legislators elected in the national
assemblies (lower chamber) of 14 parliamentary democracies. The findings partly support our
expectations, but also put forward unexpected, but still relevant relationships between intra-
party resources and representational styles.
Better understanding the impact of party resources influx on legislators’ style of representation
is crucial, as legislators’ representational roles may impact their actual behaviour as linkage
agents (Andeweg, 2012; Gross, 1978; Katz, 1997; Studlar and McAllister, 1996), and may affect
the quality of representative democracy by impacting party-voters congruence (Converse and
Pierce, 1986; Önnudóttir, 2014; Wessels and Giebler, 2011). Besides, examining the influence of
extra-parliamentary organisational arrangements appears particularly salient at a time when
party organisations are transforming, notably through processes such as cartelisation (Katz and
Mair, 2009; Katz and Mair, 1995) – a process that has been accompanied by increased financial
(and staff) resources for established parties, by a rising share of public subsidies in the parties’
income but also by a decline of party membership and a growing contestation of the alleged
cartelised elites.
The paper first reviews the existing literature, and formulates the hypotheses. The second
section presents the dataset, and exposes how we operationalise the main variables. The third
section explains the analysis and main results, before we draw some general conclusions.
Linking intra-party resources to styles of representation
In economics and sociology, resources have often been studied at a meso-level of analysis, in
connection with organisational structure, functioning and change. In economics, the Resource
Based View (RBV) has focused on the relationship between the types of resources available and
competitive organisational strategies (Barney, 1991; Wernerfelt, 1984). In sociology, on the one
hand, the Resource Dependency Theory (RDT) (Pfeffer and Salancik, 2003) has focused on the
4
links between organisational changes and resource ownership, and has postulated that
organisational changes depend on variations in resource ownership; and on the other hand, the
resource mobilisation perspective (McCarthy and Zald, 1977) has focused on the ability of social
movement to exist according to the resources that they are able to mobilise.
In political science, and in particular in the field of party politics, resources have mostly been
studied at a micro-level of analysis. The resource model of political participation has been
extensively developed to analyse how individual characteristics affect political participation,
including electoral behaviour (Brady et al., 1995) and activism (Whiteley and Seyd, 1996). Until
recently, resources have been observed to a lesser extent at the meso (party) level. We can
nevertheless cite the work of Lynch et al (2006), which has attempted to apply the RBV to
political parties, thereby linking parties’ performances to their capacity to control and exploit
various resources (leadership, policies, organisational and communication skills) in order to
achieve and sustain their competitive advantage.
Besides, the evolution of political parties in the last decades has increasingly attracted scholars’
attention towards organisational transformations generated by change in parties ’resources. An
important part of the literature has been concerned with the issue of the decline of party
membership, which constitutes one of the crucial resources of political parties (Delwit, 2011;
Van Biezen et al., 2012). Attention towards other forms of intra-party resources (e.g. finances,
staff) has also been prompted by the increasing regulation of political parties across
democracies, notably in terms of party finances (Van Biezen and Kopecký, 2015). While some
scholars have been concerned with the consequences of these changes for the way parties
organise (Bolleyer, 2009; Katz and Mair, 1995; Kölln, 2015; van Biezen and Piccio, 2013), we
propose here to question how patterns of intra-party resources can relate to variations in party
members’ attitudes (and potentially behaviour), especially those of parliamentary party
members.
5
Research examining legislators’ voting defection and/or party switching behaviour provide some
insights in that regard. Scholars have put forth the way party leaders (or whips) can mobilise
parliamentary resources (e.g. staff, office spaces, etc.) as ‘carrots’ to incentivise unity among
public officials (Malloy, 2003, p. 119). By relying on extensive resources, the party leader would
increase its capacity to discipline its parliamentarians. Recently, Tavits (2012) and Little and
Farrell (2017) have examined the influence of extra-parliamentary party resources (e.g. party
income, membership size, local organisational and electoral strength) on legislative voting unity,
arguing that ‘stronger’ –i.e. wealthier– parties would provide a greater electoral value to
individual MPs. Consequently, in these parties, MPs would stick to the party line to avoid losing
these resources. Their findings indeed indicate that parliamentary voting unity is greater among
wealthier parties. In a similar vein, studies on party switching have regularly put forth the role of
resources in the motivations of MPs to change their affiliation: a greater access to distributive
resources in another party would be amongst the strongest motives for an MP to join that party
(Desposato, 2006; Mershon, 2014; O’brien and Shomer, 2013).
Hence, these pieces of research suggest the existence of a rather straightforward relationship
between a party’s level of resources, and the behaviour of individual legislators. Their
assumptions are entrenched in a rational-institutional conception of legislators’ motivations
(Strøm, 2012). Such rational approach has also been used to study MPs’ representational roles
and styles, and has conceived them as behavioural strategies constrained by the institutional
context (Searing, 1994; Strøm, 1997; Zittel, 2012). In that perspective, MPs motivated by the
prospect of re-election, policy influence or access to office would be more likely to adopt a
party-delegate style in settings where their re-election, influence and career options highly
depends on the party organisation or party leader. The argument has often been illustrated by
the effect of the electoral system: a party-delegate style would be encouraged in proportional
closed-list system, where MPs’ re-election depends more on party reputation than on their
personal reputation (Carey and Shugart, 1995); a voter-delegate or a trustee style would be
more strategic in open-list and preferential voting systems where MPs’ re-election depends
more on voters, or in single-member district where MPs’ personal reputation and concerns for
6
the constituency matter significantly (Cain et al., 1987; Carey and Shugart, 1995; Farrell and
Scully, 2010; Norris, 2002).
According to this rational-institutional approach to representational styles and roles, and on the
basis of what we know so far regarding the link between resources and MPs’ behaviour, we
could hypothesise that MPs in parties where resources (finances and members) are abundant
should be more likely to adopt a party-delegate style; whereas in a context where the party
cannot provide as much resources, legislators could be more tempted by adopting a trustee or
voter-delegate style.
However, representational roles and styles should not be considered only as strategic
behaviours, but also as ‘habits of the heart’ (Zittel, 2012) influenced by more socio-structural
dynamics. Structural perspectives provide additional tools to elaborate on the relationship
between a party’s resources and legislators’ attitudes towards representation.
Early structural-functionalist approaches identified the type of political regime and (party)
system as structuring elements of legislators’ representational role, highlighting the difference
between the dominant trustee style of representation in the US presidential system, which
relies on weak party organisations, and the dominant party-delegate style of European
parliamentary party-based systems (Converse and Pierce, 1986; Wahlke et al., 1962). Thus, early
on, party organisational strength was considered as an important factor, but was only
operationalised at the systemic level. Later on, some researches included party strength as a
party-level factor, but merely operationalised it as party size in the constituency (see e.g.
Wessels and Giebler, 2011, p. 12); or measured it through legislators’ perception of the party
organisational strength (Thurber, 1976).
If the effect of party organisational strength in terms of financial resources on MPs’
representational style has, to our knowledge, never been tested, Gauja’s (2012) research has
already suggested a potential impact of party membership. Conducting interviews with party
7
elites across six parties in three countries (Australia, UK, New-Zealand), she relates the
difference between the party-delegate orientation of social-democratic MPs (and to a lesser
extent of the Greens) and the trustee style of liberal parties’ MPs to the parties’ origins that
resulted in specific organisational cultures. The former type of parties emerged as membership
organisations, in which the parliamentary party was considered as the delegate of the broader
organisation and members; while the latter type of parties formed within parliament, resulting
in a strong emphasis on ‘the independence of parliamentarians in their organisational ethos’
(Gauja, 2012, p. 122). Accordingly, legislators in organisations relying on a large number of
members should tend to adopt a party-delegate style of representation, whereas legislators in
cadre parties would tend to adopt a trustee-style. In other words, parties having more members
should produce more party-delegates.
The mechanism underlying this relationship is not as straightforward as the rational-institutional
argument, but rather relies on an indirect and structural dynamic. Membership organisations
would give a greater say to the party-on-the-ground, notably in controlling the activities of the
parliamentary party, and in holding the party-in-public office accountable. Membership size
would affect the intra-party balance of power between the different faces of the party; and
legislators in parliamentary parties dominated by members and activists of the extra-
parliamentary party would accordingly feel and behave as the delegates of the broader party
organisation.
We believe that another aspect of intra-party resources could affect this balance of power: the
relative share of different sources of revenue in the party income. As mentioned earlier,
financial resources may emanate from different sources, or actors: parties can rely extensively
on members’ fees or donations, on private sector’s contribution, or on public subsidies. The
relative share of party income coming from these different sources could influence the intra-
party balance of power, and in turn, could affect legislators’ attitudes. If the party extensively
depends on membership donations, this may increase the relative power of the party-on-the-
ground and of party activists in the central organisation, who might try to shape the
8
parliamentary party as the delegate of the broader party organisation. By contrast, an important
share of private donations in the party income (a characteristic which is found in personalised or
candidate-centred style of politics, such as in the US) could make MPs more accountable to
external party actors that would exchange their support against favourable policies. Legislators
in such context could me more likely to adopt a voter-delegate style of representation. Finally, a
high share of public subsidies should increase the power, autonomy and centrality of the party
in public office within the broader organisation. It could in turn affect legislators at the
individual level: by making legislators less dependent or accountable to the extra-parliamentary
organisation, or to private donators, a high share of public subsidies in the party income could
make members of the party-in-public-office more likely to adopt a trustee style of
representation.
Data and Methods
The PartiRep Comparative MP Survey and the Political Party Database
This research combines two cross-country databases. First, the PartiRep Comparative MP Survey
database comprises an attitudinal survey carried out among national and regional legislators in
15 European democracies and other macro-level and meso-level variables (mostly linked to the
state structure, electoral system, legislative organisation and activity, etc.). MPs were invited to
respond either through an online web-survey (46.8%), print questionnaires (33.7%), face-to-face
interviews (18.7%) or by telephone (0.8%). The data was collected between spring 2009 and
winter 2012, with an average response rate of 19.5%, although this rate varies quite a lot from
one parliament to another. Despite these varying response rates, the sample remains
representative of the population (Deschouwer et al., 2014)1.
1 Using the Duncan index of dissimilarity, Deschouwer et al. (2014) have noticed that, as far as party composition is concerned, some parties are slightly underrepresented, while others are slightly overrepresented. The models presented in the analysis have been replicated by applying a party weight. The findings were highly similar.
9
Second, this research uses the Political Party Database (PPDB) to measure intra-party resources
as well as other organisational variables (e.g. candidate selection, see below). The PPDB project
is a cross-national project examining various aspects of intra-party structure and practices: party
membership, selection of party personnel, leadership autonomy, links with collateral
organisation etc. The project focuses on party official statutes and rules, not informal processes,
what facilitates data collection, replication and cross-national comparison. The first round of
data collection includes information (over 300 variables) on 122 parties in 19 countries during
the 2010-2014 period (Poguntke et al., 2016). The selected parties are mostly those elected in
the lower house of the national parliaments.
In this study, only MPs elected in national parliaments are included. The final database includes
796 individuals from 45 parties elected in 14 national assemblies (lower chamber) (see Appendix
1). For the purpose of the analysis, we have excluded respondents who sit as independent in the
parliament. We have also removed the parties which included less than six respondents in order
to allow for enough intra-party variation in the responses provided by each party’s MPs.
Measuring MPs’ style of representation
Considering MPs’ representational roles, Eulau et al. (1959) make the distinction between two
elements: the ‘style’ and ‘focus’ of representation. ‘Style’ refers to the distinction between an
attitude of trustee and that of delegate. ‘Focus’ refers to the group primarily represented by the
legislator (e.g. the nation as a whole, a specific group in society, etc.). As stated by Önnudottir
(2016, p.733, referring to Bengtsson and Wass, 2011; Wessels and Giebler, 2011): ‘in practice,
the focus and those two styles are closely related since trustees are more prone to consider
themselves to represent the nation as a whole and delegates to focus on specific group(s)’. In
this paper, we are primarily interested in legislators’ style of representation.
As presented in the introduction of this paper, three styles of representation have been vastly
discussed in the literature: the trustee style, the party-delegate style, and the voter-delegate
10
style. At the empirical level, these styles have often been measured using survey items asking
legislators (or, more often, candidates) about how they should vote in case of disagreement
(Önnudóttir, 2014, 2016; Wessels and Giebler, 2011): follow their own opinion, the party’s
position, or the voters’ opinion – the latter being the most difficult to apprehend, and
sometimes refer to the party voters or to the constituency voters. We proceed similarly here,
using three questions, each implying a choice between two ‘principals’:
1. How should, in your opinion, a Member of Parliament vote if his/her party has one
opinion on an issue that does not correspond with his/her personal opinion?
a. MP should vote according to his/her own opinion
b. … according to his/her party’s opinion
2. How should, in your opinion, a Member of Parliament vote if his/her own opinion on an
issue does not correspond with the opinion of his/her voters?
a. … according to his/her own opinion
b. … according to the opinion of his/her voters
3. How should, in your opinion, a Member of Parliament vote if his/her voters have one
opinion
and his/her party takes a different position?
a. … according to the opinion of his/her voters
b. … according to his/her party’s opinion
Four categories of MPs can be distinguished: the ‘pure’ party-delegate (MPs choosing the party
in items 1 and 2), the ‘pure’ trustee (MPs choosing their own opinion in items 1 and 3), the
‘pure’ voter-delegate (MPs choosing his/her voters in items 2 and 3), and a mixed category
including MPs who do not consistently chose one principal. Within this latter category, we also
include MPs who didn’t answer to one of the questions, and for which we cannot define a ‘pure’
style of representation. The distribution of MPs across these categories is the following: 355
MPs in the dataset appear to be pure party-delegates, 241 appear to be pure trustees, 86 MPs
appear as pure voter-delegates. Nine MPs could not be classified into one of these categories,
while 105 did not answer to one of the questions; 114 respondents are thus categorised as
‘undefined style’. This distribution is in line with previous studies (Önnudóttir, 2016; Wessels
and Giebler, 2011). In the analysis, we consider each style of representation as a binary
11
dependent variable (see Wessels and Giebler, 2011), coded 1 if the MP adopts the specific style,
and 0 if the MP does not.
Intra-party resources
First, we examine the effect of the amount of party income standardised by the size of the
countries’ electorates (Poguntke et al., 2016; Van Biezen and Kopecký, 2015, p.5)2. This
standardised income ranges from a minimum of 0.18 (i.e. the Polish party ‘Law and Justice’) to a
maximum of 6.19 (the Norwegian social-democratic party Arbeiderpartiet), with an average at
1.35 and a standard deviation of 1.17. Hence, on average, parties earn 1.35 euro per voter.
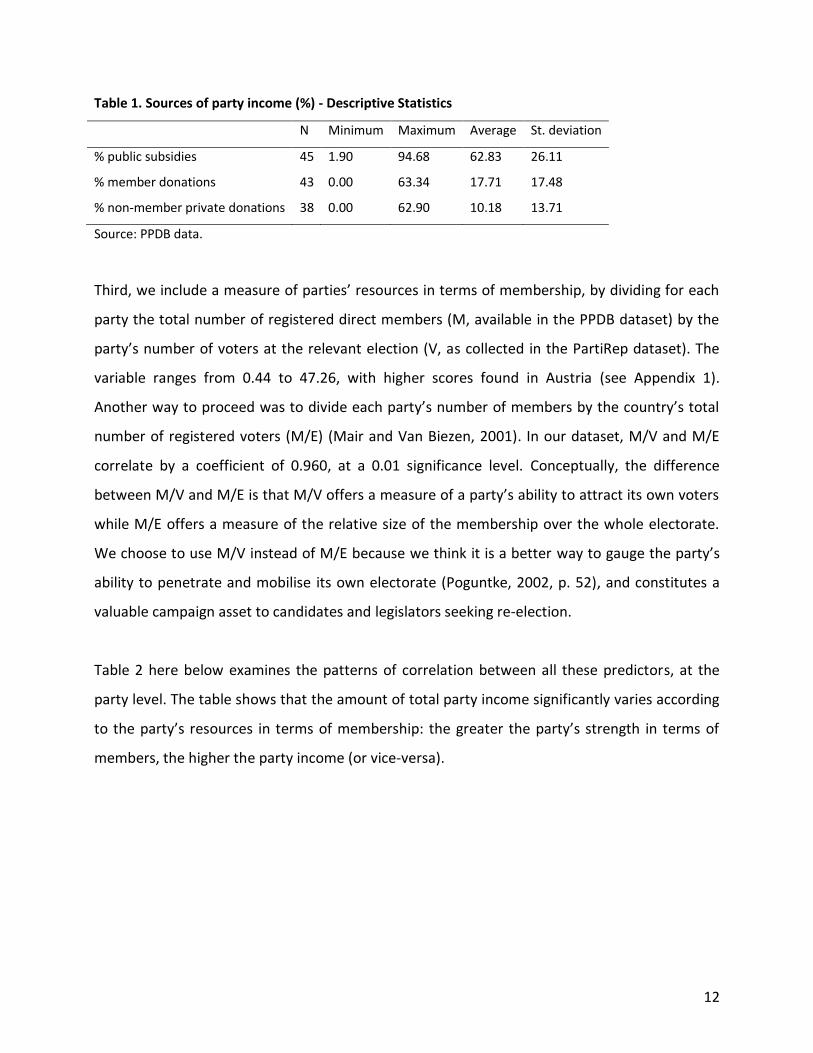
Second, we consider the source of income perceived by the parties, and test the effect of the
proportion (%) of direct subsidies in the party’s income. Table 1 presents descriptive statistics
for the three types of resources coded in the PPDB database: public subsidies, party members’
contributions and private donations. The share of public subsidies is inversely and significantly
correlated with the share of private donations (-0.682**) and with the share of member
donations (-0.645**), but the latter two do not correlate with each other. This can partly reflect
the cartelisation thesis, with parties seeking state resources to compensate for the decreasing
share of members’ fees –or, vice versa, parties losing members (fees) as a result of their
increasing amalgamation with the state. Given that values are missing for several parties for
both the share of members’ donations and private donations, we only include the share of
public subsidies in the analysis.
2 When these fees were expressed in another currency than euros, they were converted in euros at 2010 exchange
rates.
12
Table 1. Sources of party income (%) - Descriptive Statistics
In the models presented below, we first control for individual-level characteristics. We include
one socio-demographic characteristic, MPs’ age3, and one measure of MPs’ socialisation in the
party (Önnudóttir, 2016; Wessels and Giebler, 2011; Zittel, 2012). Regarding the effect of age,
younger MPs should be more likely to adopt a party-delegate style, as they need to get their
party and leader’s support to reach higher position (Kam, 2009, p. 199), while older MPs should
be more likely to adopt a trustee style. Party socialisation is measured through ‘seniority’ (Zittel,
2012), which is operationalised as the number of years since the MP’s first election to the
national parliament4. In addition, we control for MPs’ perceived ideological distance with their
party5, as we expect that MPs who feel more ideologically distant from their parties should be
more likely to adopt a trustee style of representation, or eventually a voter-delegate style, than
a party-delegate style.
3 We also controlled for the effect of gender, but this variable had no significant effect. 4 We have considered measuring party socialisation at a lower level of power, using data on whether or not the MP had previously been elected at lower level of power. However, we were confronted with a great amount of missing data (e.g. no data for Portugal). We have also considered taken into account MPs’ perceived chance of being re-elected (and re-selected), as ‘hopeless legislators’ being more likely to adopt a party-delegate style (Zittel, 2012, p. 116); but again, missing values were too numerous. 5 ‘In politics, people sometimes talk of left and right. Using the following scale, where 0 means left and 10 means right where would you place …?’ ‘your own views?’/‘your national party?’
14
At the party level6, we first control for the parties’ left-right placement as measured by Benoit
and Laver (2007) through expert surveys. Previous studies have suggested that parties on the
right-hand side of the spectrum would tend to have a higher number of trustees, while parties
of the would have relatively more party-delegates (Andeweg, 1997, p. 120; Studlar and
McAllister, 1996, p. 76; Wessels and Giebler, 2011). Second, we control for ‘time in
government’, measured as the percentage of time a party has been part of the national
government between 1975 and 20127. We believe that the longer a party has been in
government, the more likely it will have developed a strong socialisation of its MPs towards a
party-delegate style. Besides, we believe that this variable may affect a party’s amount of
resources, but more importantly a party’s capacity to access public funding (though correlations
do not show significant relationships at the party level). Accordingly, we have decided to control
for an interaction effect between the time spent in government and the share of public
subsidies in the party income.
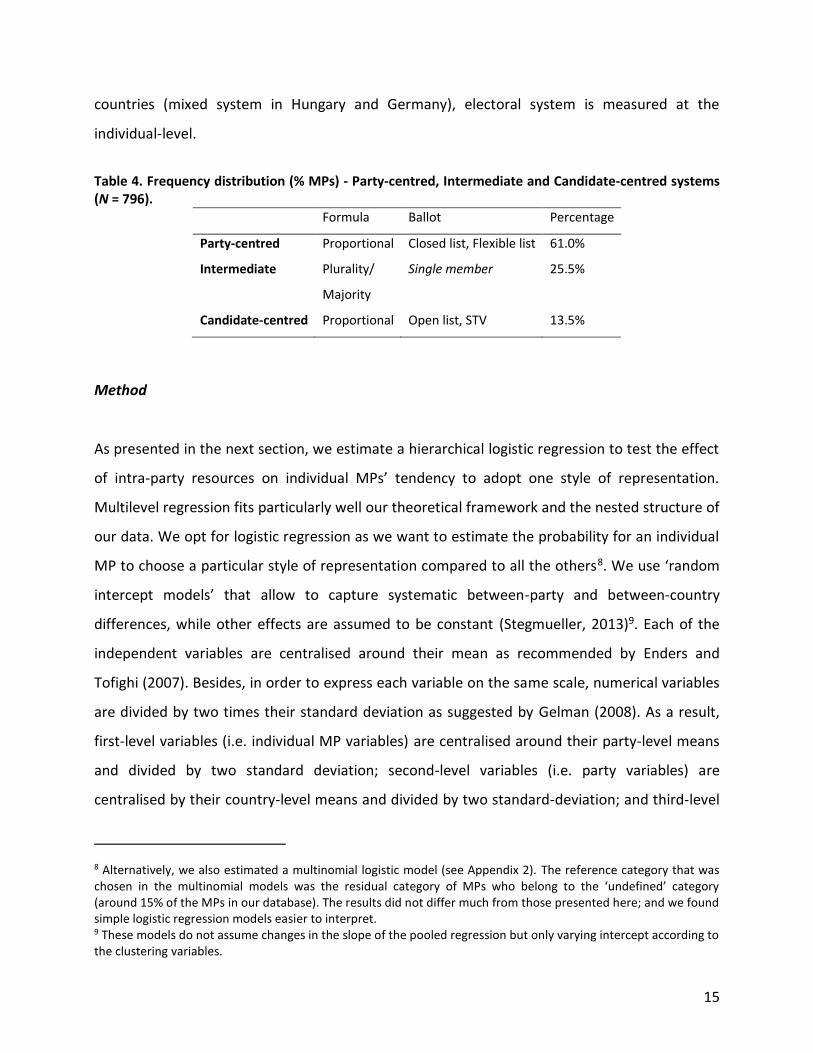
Finally, we control for the degree of personalisation of the electoral system. Electoral systems
that increase the incentives to cultivate a personal rather than a party vote would tend to
produce less party-delegates, and potentially more voter-delegates or trustees (Cain et al.,
1987; Carey and Shugart, 1995; Farrell and Scully, 2010; Norris, 2002). The need for cultivating a
personal reputation can have different origins: it can stem from intraparty competition,
increased by the openness of the ballot; or from the incentives MPs have to commit themselves
in constituency work, which are particularly salient in majoritarian single-member district (Pilet
et al., 2012). Accordingly, we use Mitchell’s typology (Mitchell, 2000) of electoral systems, which
combines both the electoral formula and the ballot structure to classify electoral systems in
three broad categories, from the most party-centred to the most candidate-centred system (see
Table 4 below). Note that since some legislators are elected through different rules in some
6 In preliminary versions of this paper, we included more party-level control variables: party size, government or opposition position, degree of exclusiveness or centralisation of the candidate selection method (see Esaiasson, 2000; Önnudóttir, 2016; Strøm, 2012; Wessels and Giebler, 2011), etc. None of these were significant in the models presented below. We decided to drop them for clarity reasons. 7 Due to the important changes that occurred in the Italian party system in 1993, time in government of Italian parties is computed for the period 1993-2012. Time in government for the Belgian parties is computed after the split of each of the parties along the linguistic divide (1975).
15
countries (mixed system in Hungary and Germany), electoral system is measured at the
individual-level.
Table 4. Frequency distribution (% MPs) - Party-centred, Intermediate and Candidate-centred systems (N = 796).
Formula Ballot Percentage
Party-centred Proportional Closed list, Flexible list 61.0%
Intermediate Plurality/
Majority
Single member 25.5%
Candidate-centred Proportional Open list, STV 13.5%
Method
As presented in the next section, we estimate a hierarchical logistic regression to test the effect
of intra-party resources on individual MPs’ tendency to adopt one style of representation.
Multilevel regression fits particularly well our theoretical framework and the nested structure of
our data. We opt for logistic regression as we want to estimate the probability for an individual
MP to choose a particular style of representation compared to all the others8. We use ‘random
intercept models’ that allow to capture systematic between-party and between-country
differences, while other effects are assumed to be constant (Stegmueller, 2013)9. Each of the
independent variables are centralised around their mean as recommended by Enders and
Tofighi (2007). Besides, in order to express each variable on the same scale, numerical variables
are divided by two times their standard deviation as suggested by Gelman (2008). As a result,
first-level variables (i.e. individual MP variables) are centralised around their party-level means
and divided by two standard deviation; second-level variables (i.e. party variables) are
centralised by their country-level means and divided by two standard-deviation; and third-level
8 Alternatively, we also estimated a multinomial logistic model (see Appendix 2). The reference category that was chosen in the multinomial models was the residual category of MPs who belong to the ‘undefined’ category (around 15% of the MPs in our database). The results did not differ much from those presented here; and we found simple logistic regression models easier to interpret. 9 These models do not assume changes in the slope of the pooled regression but only varying intercept according to the clustering variables.
16
variables (i.e. country variables) are centralised around their grand mean. This centralisation
technique allows expressing all the coefficients as a deviation of +/- 1 standard deviation from
the mean.
Analysis and findings
Our analysis proceeds in three steps. First, we compute empty multilevel models to identify the
existence of potential contextual effects at the party and country level (table 5). For the party-
delegate style of representation, our estimate of the mean logit score is -0.22. As this coefficient
is expressed on a logarithmic scale, this means that around 44%10 of the MPs in our database
tend to adopt a party-delegate style of representation. We find an intra-class correlation11 of
0.11 at the country level and of 0.03 at the party level. This means that 11% of the variation in
MPs’ choice for a party-delegate style is due to their country, and 3% is due to their party. For
the voter-delegate style of representation, our estimate of the mean logit score is -2.35, i.e. MPs
have 9% chance to adopt this style of representation. We found a low intra-class correlation at
the country and party levels. Around 8% of the variation in MPs’ choice for the voter-delegate
style is due to country specific factors and 7% is due to party factors. Finally, for the trustee style
of representation, our estimate of the mean logit score is -0.96, i.e. MPs have 27% chance to
adopt a trustee style of representation12. Around 17% of the variation in MPs’ choice for the
trustee style is due to the country and an additional 1% is due to party factors.
Table 5. MPs’ styles of representation – Empty multilevel models.
Party Delegate Style Voter Delegate Style Trustee Style
10 This quantity is obtained by computing the inverse logistic function for this coefficient such that prob <- exp(logit) / (1 + exp(logit)) 11 The Intra-Class Correlation measure (ICC) is a measure of the homogeneity within groups. The higher the ICC, the higher the homogeneity within groups. It also means that the higher the ICC, the higher heterogeneity between groups. 12These three styles of representation account for 80% of the legislative attitudes adopted by MPs. The 20-remaining percent correspond to MPs who have an undefined style of representation. These proportions are coherent with the data distribution discussed earlier.
17
(1) (2) (3)
Constant -0.223 -2.349*** -0.962***
(0.207) (0.230) (0.253)
ICC Country 0.11337 0.08307 0.17934
ICC Party 0.03958 0.07057 0.01816
Observations 796 796 796
Note: *p**p***p<0.01
Second, we estimate multilevel logit models to test the effects of our independent variables
(party income, share of public subsidies, and M/V) on MPs’ probability to adopt one or the other
style of representation. The models suggest that party income and share of public subsidies
have a significant effect on MPs’ representational style. MPs who belong to parties having a
higher income are significantly more likely to adopt a party-delegate style of representation
than any other style of representation, as we expected. An increase of one standard deviation
from the average standardised party income level (within each country) increases the odds for
an MP to adopt a party delegate style by more than 40%13.
The share of public subsidies has a modest but significant effect on MPs’ choice for a voter-
delegate style of representation. An increase of one standard deviation from the average level
of public subsidies increases the odds for an MP to adopt a voter-delegate style of
representation by 2%14. This effect is very modest, and is not in line with our expectation that a
higher share of public subsidies would increase MPs’ tendency to adopt a trustee style –to the
contrary, the coefficient is negative for trustee style15. This is interesting to underline: parties
which seem to depend the most on state subsidies, thus which benefit from some effects of the
cartelisation of party politics, do seem to produce more voter-delegates –in a way, legislators
13 In other words, this means that one standard deviation change from the mean in party income corresponds to a positive difference of 8% in the probability of adopting a party delegate style of representation (invlogit(-0.853217+0.337085*1.4450)- invlogit(-0.853217+0.337085*2.4450)). 14 This means that one standard deviation change from the mean in party income corresponds to a positive difference of 0.5% in the probability of adopting a party delegate style of representation such that invlogit(-0.853217+0.024*60.470)- invlogit(-0.853217+0.024*59.470). 15 Note that we also estimated models with ‘share of members’ donation’ as the independent variable, instead of ‘share of public subsidies’. This decreased our N by 20 observations. In these models, the effect of membership donations was not significant.
18
seem to feel more accountable to their voters, contrary to the cartel party thesis assumption
that parties would increasingly become ‘agents of the state’ rather than intermediaries between
the state and civil society. Yet, we shouldn’t be too confident with this finding, given the low
number of MPs adopting a voter-delegate style.
Finally, we do not find any significant effect of resources in terms of membership (M/V) on MPs’
style of representation. MPs coming from parties that have a higher membership/voter ratio are
not significantly more likely to adopt any particular style of representation. When looking solely
at the sign of the coefficient, the relationship goes counter to what we expected: a higher M/V
ratio diminishes the probability that legislators will adopt a party delegate style; but increases
the probability that they will adopt a voter-delegate style. Yet, this result makes sense given the
way we have operationalised membership size: legislators in parties that are well embedded in
their electorate seem more accountable to their voters.
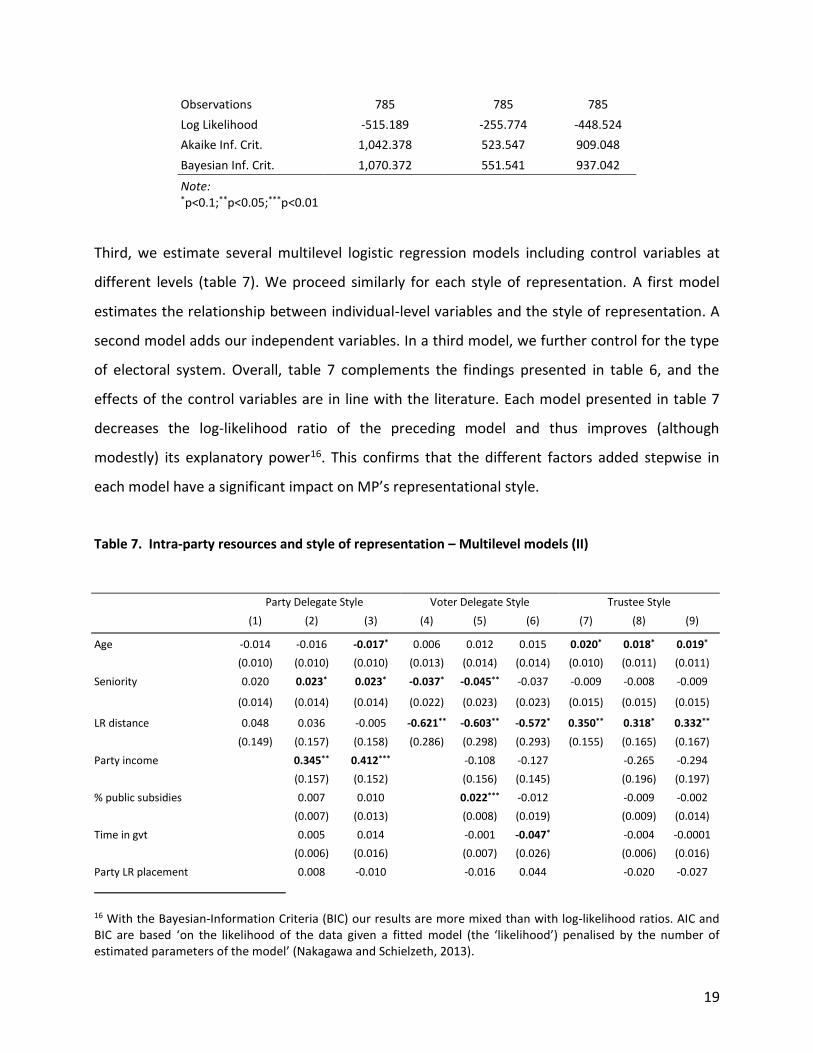
Concerning the model fit, model 2 in table 6 presents the lower log-likelihood (and lower AIC
and BIC), followed by model 3, suggesting that our independent variables better predict MPs’
probability to adopt a voter-delegate style, then MPs’ probability to adopt a trustee style;
although we rather formulated our expectations in terms of MPs’ probability to adopt a party-
delegate style.
Table 6. Intra-party resources and style of representation – Multilevel models (I)
16 With the Bayesian-Information Criteria (BIC) our results are more mixed than with log-likelihood ratios. AIC and BIC are based ‘on the likelihood of the data given a fitted model (the ‘likelihood’) penalised by the number of estimated parameters of the model’ (Nakagawa and Schielzeth, 2013).
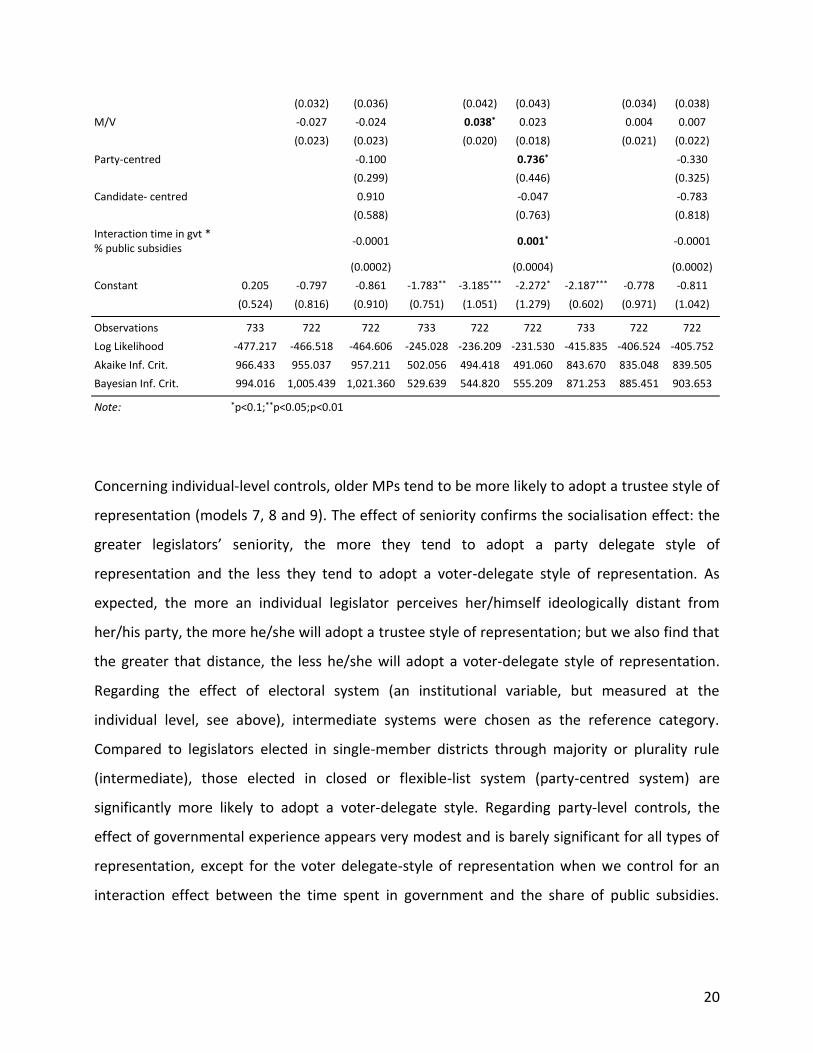
Concerning individual-level controls, older MPs tend to be more likely to adopt a trustee style of
representation (models 7, 8 and 9). The effect of seniority confirms the socialisation effect: the
greater legislators’ seniority, the more they tend to adopt a party delegate style of
representation and the less they tend to adopt a voter-delegate style of representation. As
expected, the more an individual legislator perceives her/himself ideologically distant from
her/his party, the more he/she will adopt a trustee style of representation; but we also find that
the greater that distance, the less he/she will adopt a voter-delegate style of representation.
Regarding the effect of electoral system (an institutional variable, but measured at the
individual level, see above), intermediate systems were chosen as the reference category.
Compared to legislators elected in single-member districts through majority or plurality rule
(intermediate), those elected in closed or flexible-list system (party-centred system) are
significantly more likely to adopt a voter-delegate style. Regarding party-level controls, the
effect of governmental experience appears very modest and is barely significant for all types of
representation, except for the voter delegate-style of representation when we control for an
interaction effect between the time spent in government and the share of public subsidies.
21
Legislators in parties which have exercised power for a smaller period of time (e.g. anti-system
parties or new parties) are more likely to adopt a voter-delegate style.
Interestingly, we also uncover that MPs coming from parties with less governmental experience
and depending more on public subsidies tend to be a little bit more likely to adopt a voter-
delegate style of representation. Hence, we could hypothesise that MPs in newer or non-
governmental parties whose resources come from other sources than public funding –
especially, members’ donations– would be less likely to adopt a voter-delegate style than those
non-governmental parties relying extensively on public funding (e.g. right-wing populist parties).
Note that in model 5, the positive effect of M/V on MPs’ likelihood to adopt a voter delegate
style becomes statistically significant.17 As suggested above, this could mean that legislators
coming from parties that are better able to encapsulate their voters are slightly more likely to
adopt a voter delegate style of representation. Hence, our expectations should be revised
regarding the effect of party membership.
Conclusion
Resources do matter for organisations: they provide tools for mobilising members, they ensure
the organisation’s viability and survival, and they affect the internal balance of power, structure
and functioning of that organisation. In the case of political party organisations, resources fulfil
these functions as well, and can be classified in three types: finances, members, and staff. Given
the transformations of party organisations in the last decades, which include declining
membership figures, increased party regulations and reliance on state resources, it is worth
questioning if and how patterns of intra-party resources can affect the way parties –and their
individual representatives– perform as linkage agents in representative democracies. This paper
17 We have controlled for multicollinearity between our predictors and it appears to be quite low (VIF=1.11). There is a small correlation (-0.05) between the variable measuring the MP’s subjective distance to her/his party and M/V. However, when we include our metric of subjective distance, our analysis is performed on a lower N. This alters the estimation of the confidence intervals. When we do not control for the MP’s subjective distance, M/V coefficient does not show a significant effect.
22
has aimed at examining some aspects of this broader issue, by investigating the empirical link
between intra-party resources and individual legislators’ tendency to adopt specific styles of
representation –party-delegate, trustee or voter-delegate style. The research question has
therefore asked to what extent do intra-party resources can shape parliamentary party
members’ attitudes towards representation?
Using comparative cross-sectional data collected among individual legislators and parties across
14 national assemblies, the paper has analysed the effect of three variables: the amount of
financial resources available to the party organisation as a whole (operationalised through the
standardised annual party income), the source of this income (and precisely, the share of public
subsidies in this income), and the size of the party membership (standardised by the size of the
party’s electorate). Despite the empirical limitations of this study, among which a relatively
small N in some categories and a limited variation in terms of parties and countries, we hope
that this piece of research will provide relevant thoughts on the link between party
organisational features and representation dynamics, and will help to open new avenues for
research in both the party politics and legislative fields.
First, the findings point out that the richer the party in terms of annual income, the higher the
probability that legislators will adopt a party-delegate style of representation. In other words,
the richer the party, the trustier or the more loyal the MP towards her/his party. Nevertheless,
the underlying mechanism explaining this finding remains dubious. From a rational choice
perspective, we could assume that legislators in parties that rely on a great amount of resources
will strategically adopt such loyal attitude, in order not to risk losing the financial advantages
that the party can provide them for re-election, policy influence or access to office. From a more
structural or organisational point of view, we could presume that the availability of resources
provides the party with tools that can be used to assure a relatively good functioning of the
organisation, and which would make party members –and among them, legislators– potentially
more satisfied, and more attached and accountable to the organisation. Yet, we could also re-
think the causal relationship between these variables, by suggesting that those parties which
23
have managed to access greater amount of resources are those that have managed to work as
coherent and united entities, in both the electoral and parliamentary arena, what can be
grasped through their MPs’ tendency to feel as party-delegates. Because they were more
‘united’, these parties have managed to access power and remain in office, thus accessing and
keeping the advantages that comes with this power; and have also managed to attract members
(and their fees) who were convinced by the coherence of the project and of the functioning of
the organisation. Longitudinal and more in-depth case studies would certainly help to
disentangle these mechanisms.
A second relevant finding concerns the effect of the M/V ratio. While we expected that parties
having more members would produce more party delegates, we have found that legislators in
parties which have a greater capacity to penetrate their electorate have a greater likelihood to
adopt a voter delegate style. Hence, parties that are better anchored among their voters would
tend to have legislators that take more into account their voters’ opinions. Further analyses
should contrast the effect of the different measurement of party membership size and strength,
such as the M/E ratio.
A third interesting finding concerns the source of party income, and its effect when interacted
with time in government. While we had expectations for different sources of income (private
and members’ donations, public subsidies), we could only reasonably test the effect of the share
of public subsidies. While we expected that a higher share of public subsidies would increase
legislators’ tendency to adopt a trustee style, we found that a higher relative share of public
subsidies in the party income increases legislators’ tendency to adopt a voter-delegate style –
although the effect was quite small. Yet, this effect was especially relevant when observed in
interaction with parties’ duration in office: MPs coming from parties with less governmental
experience and depending more on public subsidies tended to be a little bit more likely to adopt
a voter-delegate style of representation. Again, further research is needed to better understand
the mechanisms underlying these relationships.
24
Besides, other aspects of intra-party resources should be considered as well. Among them, one
could question the role of resources distribution within the organisation, between the different
faces of the party organisation, but also across individual party actors, including legislators. A
distribution of resources that would increase the power of the extra-parliamentary party
organisation relatively to that of the parliamentary party organisation could potentially increase
legislators’ tendency to adopt a party-delegate style of representation. A distribution of
resources that would empower individual legislators relatively to their party (e.g. campaign
funding to individual candidates) would certainly increase legislators’ tendency to adopt a
trustee or voter-delegate style18.
18 In that vein, we have investigated the effect of MPs’ autonomy or strength (Little and Farrell, 2017), based on MPs’ direct allocation of campaign funds and parliamentary staff, on MPs’ styles of representation. We have indeed uncovered a significant positive relationship between MPs’ autonomy and MPs’ tendency to adopt a trustee style of representation. But problematically, this index correlates too much with the type of electoral system (MPs in party-centred systems being significantly less strong), and shows too little variation between parties in the same country to allow meaningful results.
25
References
Andeweg, R.B., 2012. The consequences of representatives’ role orientations: attitudes, behaviour, perceptions, in: Blomgren, M., Rozenberg, O. (Eds.), Parliamentary Roles in Modern Legislatures. Routledge/ECPR Studies in European Political Science, London & New York, pp. 66–84.
Andeweg, R.B., 1997. Role specialisation or role switching? Dutch mps between electorate and executive. The Journal of Legislative Studies 3, 110–127.
Barney, J., 1991. Firm Resources and Sustained Competitive Advantage. Journal of Management 17, 99–120.
Bengtsson, Å., Wass, H., 2011. The Representative Roles of MPs: A Citizen Perspective. Scandinavian Political Studies 34, 143–167.
Benoit, K., Laver, M., 2007. Estimating party policy positions: Comparing expert surveys and hand-coded content analysis. Electoral Studies 26, 90–107.
Bolleyer, N., 2009. Inside the Cartel Party: Party Organisation in Government and Opposition. Political Studies 57, 559–579.
Brady, H.E., Verba, S., Schlozman, K.L., 1995. Beyond Ses: A Resource Model of Political Participation. The American Political Science Review 89, 271–294.
Cain, B.E., Ferejohn, J.A., Fiorina, M.P., 1987. The Personal Vote: Constituency Service and Electoral Independence. Harvard University Press, Cambridge, MA.
Carey, J.M., Shugart, M.S., 1995. Incentives to cultivate a personal vote: A rank ordering of electoral formulas. Electoral Studies 14, 417–439.
Converse, P.E., Pierce, R., 1986. Political Representation in France. Harvard University Press. Delwit, P., 2011. Still in decline? Party membership in Europe, in: van Haute, E. (Ed.), Party
Membership in Europe: Exploration into the Anthills of Party Politics. Bruxelles. Deschouwer, K., Depauw, S., André, A., 2014. Representing the people in parliaments, in:
Deschouwer, K., Depauw, S. (Eds.), Representing the People. A Survey among Members of Statewide and Substate Parliaments. Oxford University Press, Oxford, pp. 1–18.
Desposato, S.W., 2006. Parties for Rent? Ambition, Ideology, and Party Switching in Brazil’s Chamber of Deputies. American Journal of Political Science 50, 62–80.
Enders, C.K., Tofighi, D., 2007. Centering predictor variables in cross-sectional multilevel models: a new look at an old issue. Psychol Methods 12, 121–138.
Farrell, D.M., Scully, R., 2010. The European Parliament: one parliament, several modes of political representation on the ground? Journal of European Public Policy 17, 36–54.
Gauja, A., 2012. Party dimensions of representation in Westminster parliaments: Australia, New Zealand and the United Kingdom, in: Blomgren, M., Rozenberg, O. (Eds.), Parliamentary Roles in Modern Legislatures. Routledge/ECPR Studies in European Political Science, London and New York, pp. 121–144.
Gelman, A., 2008. Scaling regression inputs by dividing by two standard deviations. Statist. Med. 27, 2865–2873.
Gross, D.A., 1978. Representative Styles and Legislative Behavior. The Western Political Quarterly 31, 359–371.
Kam, C.J., 2009. Party Discipline and Parliamentary Politics, 1st ed. Cambridge University Press.
26
Katz, R.S., 1997. Representational roles. European Journal of Political Research 32, 211–226. Katz, R.S., Mair, P., 2009. The Cartel Party Thesis: A Restatement. Perspectives on Politics 7,
753–766. Katz, R.S., Mair, P., 1995. Changing models of party organization and party democracy. Party
politics 1, 5–28. Kölln, A.-K., 2015. The effects of membership decline on party organisations in Europe.
European Journal of Political Research 54, 707–725. Little, C., Farrell, D.M., 2017. Party Organization and Party Unity, in: Scarrow, S.E., Webb, P.D.,
Poguntke, T. (Eds.), Organizing Political Parties, Representation, Participation and Power. Oxford University Press, Oxford, pp. 285–306.
Lynch, R., Baines, P., Egan, J., 2006. Long-Term Performance of Political Parties. Journal of Political Marketing 5, 71–92.
Mair, P., Van Biezen, I., 2001. Party membership in twenty European democracies, 1980-2000. Party Politics 7, 5–21.
Malloy, J., 2003. High Discipline, Low Cohesion? The Uncertain Patterns of Canadian Parliamentary Party Groups. The Journal of Legislative Studies 9, 116–129.
McCarthy, J.D., Zald, M.N., 1977. Resource Mobilization and Social Movements: A Partial Theory. American Journal of Sociology 82, 1212–1241.
Mershon, C., 2014. Legislative Party Switching, in: Martin, S., Saalfeld, T., Strøm, K. (Eds.), The Oxford Handbook of Legislative Studies. Oxford, pp. 418–434.
Mitchell, P., 2000. Voters and their representatives: electoral institutions and delegation in parliamentary democracies. European Journal of Political Research 37, 335–351.
Nakagawa, S., Schielzeth, H., 2013. A general and simple method for obtaining R2 from generalized linear mixed-effects models. Methods Ecol Evol 4, 133–142.
Norris, P., 2002. Ballot Structures and Legislative Behavior: Changing Role Orientations via Electoral Reform, in: Power, T.J., Rae, N.C. (Eds.), Exporting Congress? The Influence of the U.S. Congress on World Legislatures. University of Pittsburgh Press, Pittsburgh, pp. 157–184.
O’brien, D.Z., Shomer, Y., 2013. A Cross-National Analysis of Party Switching. Legislative Studies Quarterly 38, 111–141.
Önnudóttir, E.H., 2016. Political parties and styles of representation. Party Politics 22, 732–745. Önnudóttir, E.H., 2014. Policy Congruence and Style of Representation: Party Voters and
Political Parties. West European Politics 37, 538–563. Pfeffer, J., Salancik, G.R., 2003. The External Control of Organizations: A Resource Dependence
Perspective, 1 edition. ed. Stanford Business Books, Stanford, Calif. Pilet, J.-B., Freire, A., Costa, O., 2012. Ballot Structure, District Magnitude and Constituency-
Orientation of MPs in Proportional Representation and Majority Electoral Systems. Representation 48, 359–372.
Poguntke, T., Scarrow, S.E., Webb, P.D., 2016. Party Rules, Party Resources, and the Politics of Parliamentary Democracies: How Parties Organize in the 21st Century. Party politics 22, 661–678.
Poguntke, T., 2002. Party Organizational Linkage: Parties Without Firm Social Roots?, in: Luther, R.K., Muller-Rommel, F. (Eds.), Political Parties in the New Europe. Oxford University Press, Oxford, pp. 43–62.
27
Searing, D., 1994. Westminster’s World: Understanding Political Roles. Harvard University Press. Stegmueller, D., 2013. How Many Countries for Multilevel Modeling? A Comparison of
Frequentist and Bayesian Approaches. American Journal of Political Science 57, 748–761. Strøm, K., 2012. Roles as Strategies: Towards a Logic of Legislative Behaviour, in: Blomgren, M.,
Rozenberg, O. (Eds.), Parliamentary Roles in Modern Legislatures. Routledge, Abingdon, Oxon, pp. 85–100.
Strøm, K., 1997. Rules, Reasons and Routines: Legislative Roles in Parliamentary Democracies, in: Müller, W.C., Saalfeld, T. (Eds.), Members of Parliament in Western Europe. Roles and Behaviour. Frank Cass, London, pp. 155–174.
Studlar, D.T., McAllister, I., 1996. Constituency Activity and Representational Roles among Australian Legislators. The Journal of Politics 58, 69–90.
Thurber, J.A., 1976. The Impact of Party Recruitment Activity upon Legislative Role Orientations: A Path Analysis. Legislative Studies Quarterly 1, 533–549.
Van Biezen, I., Kopecký, P., 2015. Patterns of Party Funding in European Democracies: State Subsidies and the Party Organization. Presented at the ECPR General Conference, Montreal.
Van Biezen, I., Mair, P., Poguntke, T., 2012. Going, going, . . . gone? The decline of party membership in contemporary Europe. European Journal of Political Research 51, 24–56.
van Biezen, I., Piccio, D.R., 2013. Shaping intra-party democracy: On the legal regulation of the internal party organization., in: Cross, W.P., Katz, R.S. (Eds.), The Challenges of Intra-Pary Democracy. Oxford University Press, Oxford, pp. 27–48.
Wahlke, J.C., Eulau, H., Buchanan, W., Ferguson, L., 1962. The Legislative System. Wiley, New York.
Wernerfelt, B., 1984. A resource-based view of the firm. Strat. Mgmt. J. 5, 171–180. Wessels, B., Giebler, H., 2011. Choosing a Style of Representation: The Role of Institutional and
Organizational Incentives. Presented at the 6th ECPR General Conference, University of Iceland.
Whiteley, P.F., Seyd, P., 1996. Rationality and party activism: Encompassing tests of alternative models of political participation. European Journal of Political Research 29, 215–234.
Zittel, T., 2012. Legislators and their representational roles: strategic choices or habits of the heart?, in: Blomgren, M., Rozenberg, O. (Eds.), Parliamentary Roles in Modern Legislatures. Routledge/ECPR Studies in European Political Science, London & New York, pp. 37–65.
28
Appendices
Appendix 1
Table 8. List of countries and parties included in the analysis.
PSOE 1974 2.60 75.50 5.52 United Kingdom (2010) Conservative Party 1834 0.61 1.90 1.21 Labour Party 1900 0.81 25.50 2.25 Liberal Democrats 1988 0.25 7.30 0.63
Appendix 2
Table 9. Two-level Multinomial Logistic Regression estimated through SEM. Individual observations are nested in parties. (Reference Category: Undefined Style of Representation).
(1) (2) (3) Party Delegate Voter Delegate Trustee
Age -0.001 0.022 0.021 (0.014) (0.018) (0.015) Seniority 0.016 -0.034 -0.017 (0.021) (0.029) (0.022) LR Distance 0.196 -0.336 0.386 (0.240) (0.351) (0.245) Party Income 0.442*** 0.139 0.0442 (0.141) (0.176) (0.155) % Public Subsidies 0.007 -0.008 0.002 (0.014) (0.019) (0.015) Timeingovt -0.009 -0.058** -0.020 (0.019) (0.026) (0.019) Party LR placement -0.001 0.042 -0.0106 (0.043) (0.055) (0.046) MV -0.038 0.005 0.005 (0.024) (0.024) (0.023) Party-centred -0.803 -0.248 0.263 (0.717) (0.954) (0.744) Candidate-centred -1.432** -0.272 -0.880 (0.658) (0.842) (0.688) Interaction time in gvt * % public subsidies