The Rise of China’s Multinationals Abstract China’s multinationals are reshaping the relationship between firms and states. We use data on 26,954 outward FDI transactions by Chinese firms from 2000-2013 to draw inferences about firms’ objectives from their investment location decisions. We find patterns consistent with rent seeking, different strategies for different types of firms, and influence of Communist Party patronage networks. Private firms are less responsive to government guidance on foreign investment than centrally-controlled state-owned enterprises, but reap greater benefits from Chinese state efforts to promote investment abroad through diplomacy. JEL Codes: F3, F5 Keywords: Chinese OFDI, political constraints, risk aversion 1 Randall Stone, University of Rochester Yu Wang, University of Rochester Shu Yu, World Bank
Transcript
The Rise of China’s Multinationals
Abstract
China’s multinationals are reshaping the relationship between firms and states.
We use data on 26,954 outward FDI transactions by Chinese firms from 2000-2013
to draw inferences about firms’ objectives from their investment location decisions.
We find patterns consistent with rent seeking, different strategies for different types
of firms, and influence of Communist Party patronage networks. Private firms are
less responsive to government guidance on foreign investment than centrally-controlled
state-owned enterprises, but reap greater benefits from Chinese state efforts to promote
investment abroad through diplomacy.
JEL Codes: F3, F5
Keywords: Chinese OFDI, political constraints, risk aversion
1
Randall Stone, University of Rochester Yu Wang, University of Rochester
Shu Yu, World Bank
1 Introduction
The rise of China has reshuffled the agents of global business, so it has become
necessary to understand Chinese politics in order to understand the politics of foreign
investment. With nearly 19,000 firms investing in 180 countries, China has become the
third largest source of foreign direct investment. These firms are redefining the balance
of power between states and multinational corporations and reopening questions about
international dependency. However, the political implications of Chinese foreign invest-
ment are under-theorized, and the empirical distribution of Chinese investment is poorly
understood. There are theoretical reasons to expect Chinese firms to diverge from the pre-
vailing model of the multinational corporation, but there are important distinctions to be
made among these firms. Firms have varying degrees of autonomy from the Chinese state,
which affect their investment strategies and bargaining leverage vis-a-vis the countries in
which they invest.
China has a rapidly growing market economy, but its ruling Communist Party
retains an extraordinary degree of state ownership and control. State-owned banks domi-
nate the allocation of capital, so the discipline of a competitive capital market is missing.
Corruption is rampant. Moreover, promotion within the the Communist Party hierarchy
is based on economic management, so firms are drawn into intra-Party factions. This
economic model has distinct consequences for firms depending on their positions in the
structure. Two important distinctions stand out: between state-owned and private firms,
and between firms located in politically-connected regions and those located in less privi-
leged regions.
State-owned enterprises (SOEs) are responsible for the majority of Chinese FDI by
volume, so they form a uniquely important set of state-owned actors. State-owned enter-
prises in China do not behave like profit-maximizing firms because career advancement for
their directors takes the form of positions in state ministries. They are directly controlled
by the state, so they are highly responsive to Chinese foreign policy, which directs them
to invest in neighboring countries and in countries that play a role in China‘s long-term
development strategy (e.g. One Belt, One Road). Furthermore, because they are implic-
itly insured, SOEs are willing to invest in the riskiest locations, and because there is less
competition in dictatorships, the probability that an SOE invests in a country decreases
monotonically as its institutions improve.
Unlike state-owned enterprises, private firms do pursue profits, and are risk averse;
they cannot afford to be expropriated, so they are reluctant to invest in the riskiest neigh-
borhoods. On the other hand, Chinese institutions create incentives for private firms
to avoid countries with high-quality institutions. China’s uncompetitive capital markets
allow inefficient organizations to survive and control substantial capital flows, and for low-
2
productivity firms, the opportunity cost of investing in political activity is low. Conse-
quently, these firms specialize in investments in countries where institutions are sufficiently
weak to deter future entrants and protect their monopoly rents from competition. A mo-
nopolistic investment strategy implies a non-monotonic relationship between institutional
quality and investment. Meanwhile, in contrast to state-owned enterprises, private Chinese
firms exercise substantial autonomy from the state and benefit from informal patronage
networks.
A second distinction to make among Chinese firms depends on their geographical
location in the patronage network that sustains the governing coalition in the Chinese Com-
munist Party. The organization of the Chinese Communist Party is based on “democratic
centralism,” which means that formal control flows from lower levels of the organization
to the top, while informal control flows from the top to the bottom through the appoint-
ments process. The formal rules matter when conflict arises between factions vying to
control the central Party organs, and in that case a faction‘s power base of loyal clients
in the regions becomes critical. This patron-client relationship is a two-way relationship,
so regions controlled by ruling-faction loyalists receive privileged access to state resources,
including credit. The successful firms in those regions are politically connected to the local
Party leaders, and privileged access to credit means that the average foreign investor from
a connected region is more likely to be an unproductive, rent-seeking firm. Consequently,
the non-monotonic pattern of monopolistic investment is most pronounced among firms
from connected regions. Because of their role in supporting the informal Party power
structure, these firms enjoy greater autonomy from the state and derive greater benefits
from Chinese state patronage when they invest abroad.
To test these claims, we use firm-level data extracted from the comprehensive
dataset on foreign investment transactions recorded by the Ministry of Commerce of the
People’s Republic of China (MOFCOM).1 The MOFCOM data cover all OFDI transac-
tions made by Chinese firms over the period 2000-2013, including 26,954 transactions by
18,974 firms in 180 countries. These data allow us to sharpen our inferences by zeroing in
on firm characteristics. We have only imperfect proxies for our key concepts of state own-
ership and connected regions, so the first stage of our analysis is a measurement exercise
to establish that our measures perform as our theory expects. Instead of coding the own-
ership of all 18,974 firms in our dataset, we isolate the 172 most important firms, which
are centrally-controlled SOEs under the management of SASAC, the State-owned Assets
Supervision and Administration Commission of the State Council. These 172 firms are re-
sponsible for the majority of Chinese foreign investment volume. Our measure of regional
1Most studies of Chinese outward OFDI analyze aggregate OFDI flows (Buckley et al., 2007; Cheng& Ma, 2007; Cheung & Qian, 2009). A few studies use micro data but do not investigate the effects ofpolitical institutions or foreign policy (Luo et al., 2011; W. Chen & Tang, 2014; C. Chen, 2015).
3
political connectedness is based on biographical connections between regional Party lead-
ers and members of the Standing Committee of the Politburo (Shih 2004, 2009), and this
measure is subject to error. We use a revealed-preference research design, using firms’ in-
vestment location decisions to draw inferences about their objectives. As expected, we find
that investment by centrally controlled SOEs has a monotonic negative relationship with
the quality of institutions; investment by all other firms has the expected non-monotonic
relationship, with a maximum rate of investment when institutions are moderately inhos-
pitable; and the non-monotonic relationship is most pronounced for firms from politically
connected regions. Finding that our proxy measures perform as expected, we turn next to
the question of assessing the political implications of Chinese FDI. Our analysis confirms
that Chinese foreign investment responds to foreign-policy priorities established in Beijing.
Countries that recognize Taiwan receive fewer Chinese investments, non-OECD countries
that vote with China in the United Nations General Assembly attract more, and countries
that subsequently joined the Asian Infrastructure Investment Bank (AIIB) receive more.
Since the decision to join the AIIB occurred after our data were collected, this effect can-
not be a response to the decision to join; consequently, it must represent an effect of a
latent propensity to support Chinese foreign policy. Furthermore, we uncover substantial
evidence of the mechanisms by which the state exerts its guidance. Diplomatic visits from
Chinese leaders to foreign capitals and government directives encouraging Chinese firms
to invest are associated with increased foreign investment, which demonstrates the active
role of the Chinese state in guiding foreign investment. This is not surprising.
Our most interesting results show that firms’ responses to government signals de-
pend on their positions in the regulatory framework and their access to powerful officials.
Centrally-controlled SOEs are most responsive to government directives and connected
firms are least responsive, indicating that politically-connected firms are relatively au-
tonomous vis-a-vis the state and enjoy a greater degree of discretion than other firms
when deciding where to invest. In contrast, centrally-controlled firms do not respond to
diplomatic visits by Chinese leaders, which indicates that the purpose of these visits is not
to corral investors to support Chinese foreign policy. Instead, Chinese diplomatic efforts
have the strongest effect on investment by firms from politically connected regions, which
is consistent with the interpretation that state patronage of preferred firms extends to
using diplomacy to provide lucrative investment opportunities.
2 Theory
Political Constraints and Foreign Direct Investment
Institutions that protect property rights are widely understood to reduce the trans-
4
action costs that would otherwise inhibit foreign investment (Eaton & Gersovitz, 1984;
J. Anderson & Marcouiller, 2002; De Groot et al., 2004; Kuziemko & Werker, 2006b;
J. E. Anderson & Young, 2006). Foreign direct investment incurs irreversible fixed costs,
which creates a time consistency problem for the host government. Promises that were at-
tractive for the government to make ex ante, before the investment is made, may no longer
be incentive compatible ex post (Kydland & Prescott, 1977). Raymond Vernon described
this problem as an “obsolescing bargain,” in which a firm enjoys substantial bargaining
leverage before it chooses a location for its investments, but the balance of power shifts in
favor of the host government once the firm has invested in specific assets (Vernon, 1971).
Anticipating this problem, foreign investors are wary of investing in countries that may
not be able to commit to refraining from extractive policies, and political institutions are
the best available solution. The institutional feature that has been most widely identified
as reassuring foreign investors is the proliferation of veto players, which impose constraints
on policy making; when policy is unlikely to change, it is unlikely to change to the detri-
ment of a foreign investor(Henisz, 2000). Conversely, when government operates without
constraints, foreign investors face a higher degree of policy uncertainty. This argument
has been extended to suggest that democratic regimes and federal systems are attractive
destinations for foreign investment (Jensen, 2003, 2006, 2008).2
This argument applies best to the strategies of firms from advanced economies.
The most successful firms in advanced economies are the most productive, control the
most valuable intangible assets such as technology, brands and organization, and enjoy
the greatest access to capital. Productive firms are most inclined to engage in foreign
investment because their low marginal costs allow them compete effectively in spite of
the fixed costs of doing business in foreign countries, and they invest abroad rather than
leasing their technology as a strategy to protect their intangible assets (Helpman et al.,
2004). Because they seek to protect intangible assets, these firms seek investment locations
that offer secure property rights. Furthermore, because their chosen lines of business are
highly profitable, productive firms from advanced economies are not particularly tempted
by opportunities to extract rents from poor countries; the opportunity cost is too high.
When they choose investment locations, they select countries where they are able to avoid
the costs of engaging in political activity.
Chinese firms, in contrast, are not subject to the discipline of a competitive cap-
ital market. The state intervenes extensively in the Chinese economy, rations access to
credit, and channels resources to favored firms. Most of the banking sector is insolvent by
conventional accounting standards. Property rights and the rule of law are weak. Large
economic organizations develop political influence that allows them to survive and grow
2For a dissenting view, see Li & Resnick (2003).
5
even if their operations are inefficient, and many of them have answered the call of the
Chinese government to invest resources abroad. Most of the Chinese firms do not have
the competitive advantages of firms from advanced economies, so the opportunity cost of
engaging in political activity that they face is lower, and rent-seeking investments may
appear more attractive.
While western investors are deterred by a high level of policy uncertainty, Quer et
al. (2012) argue that there is no evidence that political risk discourages Chinese OFDI.
Indeed, there is some evidence that Chinese OFDI focuses on countries with fewer political
constraints, more corruption and more political instability (Cheung et al., 2012; C. Chen,
2015; Ramasamy et al., 2012). Some studies link a preference for poor institutions to
investments in the mining sector. Kolstad & Wiig (2012) show that Chinese firms prefer
to invest in countries with both substantial natural resources and poor institutions. Beule
& Duanmu (2012) similarly find that Chinese mining firms invest in countries with poor
institutions. Outside the mining sector, Chinese firms are deterred by political instability,
but not by poor rule of law or high corruption. Buckley et al. (2007) argue that Chinese
firms are generally attracted to locations that exhibit political risk.
Previous studies have reached inconsistent results but have consistently sought a
monotonic effect of political institutions on Chinese investment. In contrast, we argue
that firms with monopolistic business strategies should have a non-monotonic response to
the quality of political institutions. When unproductive firms invest abroad, they seek
opportunities to extract rents that are available because of features of the host economy
or political system. These rents could arise from market power, for example, when a firm
invests in a sector where it will be a monopoly supplier. Alternatively, they could arise
from policy benefits such as subsidies, regulatory benefits or tax holidays provided by the
government because of the firm’s political activity. In either case, access to rents depends
on the ability to limit competition, which is accomplished by deterring the entry of other
firms. This objective sets an upper limit on the desirable quality of political institutions
in the host country. Beyond this optimal point, incremental reforms of institutions that
make the political system more transparent, competitive, or capable of making credible
commitments tend to reduce the firm’s expected profits, because they make entry more
attractive for competing firms. The firm’s preference for weak institutions is not mono-
tonic, however, because the firm balances the risk of entry against the risk of expropriation
by the government. When institutional safeguards are very weak the risk of entry is low
and the risk of expropriation is high, so institutional improvements increase the firm’s
expected profit. The balance of risks shifts as institutions improve, until at some point the
risk of entry outweighs the risk of expropriation. In short, there is an interior maximum
to a monopolistic firm’s preference for institutional quality, which implies that the firm’s
6
response to institutions is non-monotonic.
Chinese firms are diverse and have diverse investment strategies. Some have pro-
ductivity advantages and intangible assets, and can be expected to seek out investment
locations that guarantee secure property rights. We expect the distribution of Chinese
firms to be shifted towards the norm of monopolistic strategies, however, because the
Chinese capital market is permissive towards inefficient organizations. Lacking detailed
firm-level data on productivity, we cannot control for these differences. However, two
prominent firm-level features specific to the Chinese context play an important role in our
analysis. One set of firms is set apart by being based in regions whose leaders enjoy strong
political connections with the leading factions in the Communist Party, and another is set
apart by being centrally-controlled state-owned enterprises.
Political Connections
China’s non-transparent capital market and patronage-based political system de-
fine the matrix of opportunities and constraints within which Chinese firms operate. Pol-
itics in China is a covert competition among factions within the Communist Party, in
which faction leaders with power in the Party and the central government ministries sup-
ply patronage to regional party leaders in return for political support. When power shifts
at the center, a cascade of personnel changes typically follows in the regions. Patron-
client relationships may be defined by common biographical details, political experiences,
or geographical origins. Victor Shih has argued that credit allocation to the regions is
reliably linked to a measure of biographical connectedness between provincial party secre-
taries and governors, on one hand, and members of the policy making standing committee
of the Politburo, on the other (Shih, 2004, 2009). Political connections influence foreign
investment through two mechanisms.
The first mechanism is credit allocation. Since credit allocation is dominated by
state-owned banks in China, access to credit at the provincial level depends on faction
politics. Therefore, the political connections of the regional leadership determine how
much access to credit regional firms enjoy. In turn, political distortions in capital avail-
ability lead to inefficient forms of foreign investment. Morck et al. (2008) suggest that
capital-unconstrained Chinese firms tend to conduct excessive outward OFDI, while cap-
ital constraints are most binding for the firms that have the OFDI opportunities that
would create the most value. Shifting surplus capital to politically favored regions encour-
ages investments by firms from those regions that are more likely than average to pursue
rent-seeking strategies rather than to consolidate productive value chains.
The second mechanism is international bargaining. In addition to enjoying special
access to capital, firms from politically-connected regions may enjoy rent-seeking oppor-
7
tunities that are unavailable to less favored firms. To the degree that the terms of foreign
investment depend upon bargaining between the Chinese state and the host country, firms
that have powerful patrons from favored regions may be able to secure more valuable con-
cessions abroad. They may be able to obtain regulatory advantages or tax preferences that
provide a competitive advantage, or they may be able to convince the host government
to erect barriers that constrain future competition. The existence of these opportunities,
furthermore, makes rent-seeking investments more attractive relative to value-producing
investments, and magnifies the advantages of investing in a country with an uncompetitive
political system from the point of view of a monopolist.
For both of these reasons, we expect firms with political connections to exhibit
most strongly the non-monotonic preference for host-country political institutions consis-
tent with a monopolistic investment strategy. Eighty percent of Chinese OFDI transactions
are made by firms that are located in regions outside of Beijing and depend upon the sup-
port and goodwill of regional leaders. These leaders, in turn, depend for their positions on
cultivating strong ties with the central elites in the Chinese Communist Party. Patronage
relationships run both ways, however. Benefits flow from the central government to the
regions whose leaders support the dominant faction, and the ultimate beneficiaries are
firms in the well-connected regions.
Foreign Policy
Foreign policy affects foreign direct investment because cooperative or conflictual
relations between countries affect the security of foreign assets. Leaders who are reluctant
to jeopardize their foreign relations will be less tempted to expropriate foreign assets;
conversely, foreign investments are hostages to fate if relations become conflictual. Chinese
foreign investment is special in this regard, however, because the Chinese state exercises
an unusual degree of guidance over its foreign investment. Chinese foreign investment is
subject to an intrusive licensing regime, and as much as 75% of foreign investment volume is
carried out by centrally-controlled state-owned enterprises (C. Chen, 2015). The Chinese
state explicitly discourages investments in some countries with which it has unfriendly
relations, encourages investments in others, and guides investments to particular countries
and sectors that it identifies as strategic priorities. A long-standing foreign policy priority
has been to discourage other countries from recognizing Taiwan. In 2014 China launched
a successful campaign to convince 56 other countries, including a number of leading U.S.
allies, to become founding members of the Asian Infrastructure Investment Bank (AIIB)
over U.S. objections. Foreign policy initiatives are likely to be reflected in Chinese foreign
investment patterns. A study of China’s aggregate OFDI in Africa, for example, finds
that the likelihood that a country receives OFDI increases if the country concerned has
8
diplomatic relations with China or is a political ally of China (Cheung et al. 2012b).
Beginning with the adoption of the “Going Global” policy in 1999, the Chinese
government has actively encouraged Chinese outward FDI. However, in the legislation re-
lated to OFDI, the National Development and Reform Commission (NDRC) states that
projects involving sensitive countries, regions or sectors require approval from the NDRC
and the State Council. The guidelines for foreign investment, or “Measures,” define sensi-
tive countries as those that are not in a diplomatic relationship with China, that are under
international sanctions, or that are involved in civil wars or international conflict.3 On the
other hand, MOFCOM has issued a series of “Catalogues of Countries and Industries for
Guiding Investment Overseas” intended to guide Chinese firms towards suitable investment
destinations. The guidelines presented in successive editions of the catalogues represent a
clear statement of official policy and have gradually expanded the set of countries in which
investment is officially encouraged (Sauvant & Chen, 2014). In the analysis that follows,
we use the degree to which firms conform to this guidance to make inferences about the
balance of power between the firm and the state.
In addition, China actively uses state visits by the President (Chairman) and Pre-
mier to promote foreign investment. Chinese leaders are routinely accompanied on state
visits by substantial delegations of business executives, and inclusion in such a delega-
tion is a considerable honor. Depending upon the relationship between the firm and the
state, the surge of investment following state visits could be a sign that the government
coerces investment to support its foreign policy, or alternatively, it could indicate that
the government provides valuable support to Chinese firms abroad which motivates them
to invest voluntarily. If firms are dependent on the state, investing in a country with
good relations with China could be a way for firms to support Chinese foreign policy, and
participating in a trade delegation could be a sign of loyalty. Alternatively, if firms are
relatively autonomous, this could be a sign that government uses its leverage with foreign
countries to secure beneficial terms for Chinese businesses, and being included in a dele-
gation could be a sign of patronage. Anecdotal evidence supports the interpretation that
state visits provide lucrative opportunities for private firms. For example, President Xi
Jinping was accompanied by a group of business executives during his visit to the United
States in September 2015, and almost all of those business executives were from private
enterprises.4 In the analysis that follows, we use information about which firms respond
to state visits by investing abroad to show that some firms appear to be relatively au-
3Interim Measures for the Administration of Examination and Approval of Overseas InvestmentProjects, issued by the National Development and Reform Commission (NDRC), October 2004 and sub-sequent versions.
4Paul Mozur and Jane Perlez, The New York Times, September 8, 2015,http://www.nytimes.com/2015/09/09/science/china-flexes-tech-muscles-before-state-visit-with-meeting-of-industry-giants.html.
9
tonomous and respond to state visits because they benefit from the state’s diplomacy on
their behalf.
Centrally-controlled state-owned enterprises (SOEs) and private firms respond dif-
ferently to Chinese diplomatic initiatives. China’s regulatory framework for OFDI singles
out SOEs for special treatment.5 Central SOEs have been granted permission to invest to
strategically sensitive regions and sectors and have preferential access to low-cost financing
and substantial subsidies from the government. The licensing and approval procedure is
more rapid for central SOEs than for other firms. According to Sauvant & Chen (2014),
central SOEs require the approval from an average of three government agencies in order
to initiate a foreign investment, while other firms require approval from as many as five
agencies.
On the other hand, centrally-controlled SOEs are considerably less autonomous
from the state than private firms. Although some central SOEs are listed on the stock
market, they are overseen by the State-owned Assets Supervision and Administration
Commission of the State Council (SASAC), their directors are appointed by state officials,
and their profits flow into the state budget. The central government controls their opera-
tions. During the turmoil in China’s stock market in summer 2015, for example, SASAC
ordered the centrally-administered SOEs not to sell shares and to purchase additional
shares to stabilize prices.6 Due to their state ownership and visibility, we expect their
investment decisions to be more affected by government policies and political considera-
tions. The state attempts to influence private firms as well, but they have a greater range
of discretion because they have more private information.
3 Data
We use the comprehensive dataset maintained by the Ministry of Commerce (MOF-
COM) from 2000 to 2013 to analyze the political determinants of Chinese firms’ OFDI
decisions. Approval from MOFCOM is required for outward investments by Chinese firms,
and MOFCOM has recorded all the approved investments since the 1980s (Chen and Tang
2014b). Since all outbound direct investments must be authorized, MOFCOM provides us
with a comprehensive census of transactions that originate in China. The data set reports
the name of the investing firm, the firm’s sector of business, the province of origin, and
the recipient country of each transaction.
MOFCOM recorded 26,954 investment transactions made by 18,974 firms in 180
5See Appendix 8.1 for a detailed description of the regulatory framework.6“China Asks Central SOEs not to Sell Shares amid Market Volatility,” Xinhua, July 08, 2015,
countries or regions over the period of 2000-2013. Table 1 shows the geographic distribu-
tion of Chinese outward FDI over this period.7 Asia is the most prominent recipient of
Chinese OFDI, followed by North America and Europe, but there are substantial numbers
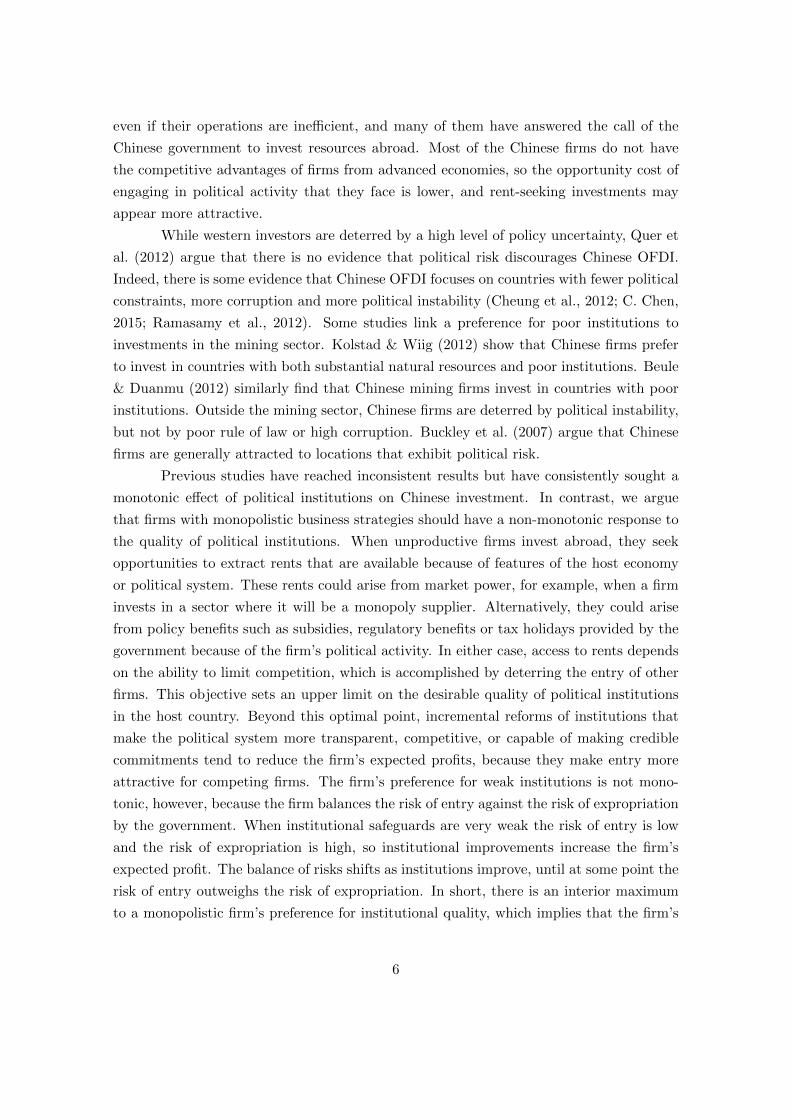
of transactions in Africa and South America. Figure 1 displays the distribution of transac-
tions over time, indicating that the momentum for Chinese firms to invest abroad took off
after the Chinese government initiated the “Going Global” strategy in 1999.8 Investments
made after 2000 account for 99.5 percent of all transactions, so we narrow our sample
period to 2000-2013 to simplify the empirical analysis.
Figure 1: The Growth of Chinese OFDI, 1983-2013
Note:Left: y-axis Chinese OFDI flows in billion USD. Source: UNCTAD, FDI Statistics.Right: y-axis Number of Chinese OFDI deals made in a year. Source: MOFCOM.
The data are a panel of 18,974 firms, 201 countries/regions and years between 2000
and 2013, where the unit of observation is a firm-country-year.9 There are 52,804,642
observations, in 0.05% of which the dependent variable, 1(Investi,j,t > 0), takes the value
of 1.
7See Figure 9 in the Online Appendix for a graphic representation of the geographic distribution ofChinese OFDI.
8“Big Push for ‘Going Global’ Strategy,” The State Council, http://english.gov.cn/premier/news/2015/05/06/content 281475102500953.htm.9The panel is slightly unbalanced, because the observation for Serbia and Montenegro as a union stopped
in 2005. From 2006 onward, Serbia and Montenegro are treated as two separate countries. South Sudandoes not enter our dataset until 2011 when it became independent from Sudan.
11
Table 1: The geographic distribution of Chinese OFDI, 2000-2013
Note: Each cell reports the number of OFDI deals made in the row continent and in the column year.The Caribbean countries are grouped into South America.
POLCON is our main independent variable of interest. POLCON is a measure
of the political constraints operating on policy making in a particular polity, which is
based upon a simple, one-dimensional spatial model where actors (veto players) have ideal
points over a policy interval and Euclidean preferences (Henisz 2000). Each veto player
blocks any policy proposal that is further from her ideal point than the status quo, so
the subset of the policy space between the veto players with the most extreme preferences
constitutes the core, or the set of policies that cannot be unanimously amended. For a
randomly selected status quo, therefore, the ratio of the core to the interval representing
the possible policy space is the probability that a policy can be changed. As the number
of veto players increases (executive, lower and upper legislative chambers, judiciary and
sub-federal institutions) and their preferences diverge, the policy process becomes dead-
locked and policy stabilizes at the status quo. This is commonly used as a measure of
secure property rights. We use POLCON together with its quadratic term to capture the
non-monotonic relationship between a country’s level of political constraints and firms’
tendency to invest predicted by a model of monopolistic competition. The data are taken
from the most recent version of the Henisz Political Constraints Index (POLCON, updated
in 2013). We also substitute the polity score provided by the Polity IV dataset and its
square for POLCON as a robustness check.
According to W. Chen & Tang (2014), China’s outward direct investment is mainly
driven by resource-seeking and market-seeking motives. Following studies such as Cheung
et al. (2012a), we include the following variables as proxies for market-seeking motives: 1)
Ln GDP, the host country’s nominal GDP in current USD (in logs); 2) Ln GDP per capita,
the host country’s real per capita GDP in constant 2005 USD (in logs); 3) GDP Growth,
12
the host country’s GDP growth rate; 4) Imports, the ratio of imports from China over a
host country’s total imports; and 5) Exports, the ratio of exports from China over a host
country’s total exports. The data on GDP measures are obtained from World Development
Indicators (2015) while trade data is provided by UN Comtrade (2015). In addition, we
include the ratio of resource rent over the host country’s GDP, Resources (WDI, 2015)
to capture the resource seeking motive. Our vector of common controls also includes
the geographic distance between a host country and China (Ln Distance) and whether a
host country shares the same language or a common border with China (Language and
Contiguous). These measures are obtained from CEPII. The control variables and main
variables of interest are listed in Table 7.
4 Empirical Results
We present our empirical results in this section. First, we use non-parametric re-
gression to investigate the non-monotonic relationship between Chinese firms’ investments
and host countries’ level of political constraints, and then we turn to parametric regressions
using a quadratic specification, which allow us to test hypotheses. We turn next to firm
characteristics, to determine how the investment strategies of centrally-controlled SOEs
and firms from politically-connected regions respond to political constraints. Finally, we
examine the effects of Chinese foreign policy on firms’ investment decisions, and how this
depends upon firm characteristics.
4.1 Host Country Political Constraints
Our theoretical priors suggest that the appropriate functional form for the rela-
tionship between POLCON and Chinese OFDI decisions should be (negative) quadratic.
In order to evaluate this hypothesis without imposing functional form assumptions, we
first run a non-parametric regression and plot the results in Figure 2.
13
Figure 2: The Negative Quadratic Relationship between Chinese OFDI and POLCON
where Φ is the c.d.f. of the standard normal distribution, 1(Investi,c,t > 0)) equals
1 if firm i invests in country c in year t and 0 otherwise.10 Xc,t is a vector of control
variables on host countries’ characteristics. The year fixed effects, πt, control for economic
conditions in China and other macro trends that influence firms’ decisions to go abroad.
εi,c,t is the error term.
10We observe in the dataset that some firms invest in a country more than once in particular years, butsuch cases are rare. For simplicity, we construct a binary variable rather than a count variable from theraw dataset.
14
Table 2: Main results
1 2 3 4
Invest
Ln GDP 0.133∗∗∗ 0.143∗∗∗ 0.146∗∗∗ 0.160∗∗∗
(70.10) (58.82) (58.76) (61.84)
ln GDP per capita -0.0346∗∗∗ -0.0389∗∗∗ -0.0371∗∗∗ -0.0143∗∗∗
(-11.92) (-11.69) (-10.89) (-3.85)
GDP Growth 0.0153∗∗∗ 0.0157∗∗∗ 0.0164∗∗∗ 0.0255∗∗∗
Note Left: The negative quadratic relationship between Chinese OFDI and host country political constraints. Right:The density plot of the POLCON distribution in the dataset.
In the left panel, we show that when the level of political constraints is very low,
increases in political constraints attract Chinese OFDI. It is only when POLCON reaches
a certain level, 0.28 based on our estimation, that increases in POLCON begin to reduce
the inflow of investments from China. By considering the distribution of POLCON in
the right panel, we are able to show that for 47.3 percent of our observations (to the
left of the red vertical line), better political institutions attract Chinese OFDI rather
than deterring it. This is consistent with our intuition that Chinese firms tend to pursue
16
monopolistic investment strategies, and illustrates the limitations of previous findings that
suggest Chinese OFDI is uniformly attracted to countries with poor political institutions.
The findings do not change after controlling for firms’ sectoral dummies in Column 3.
Column 4 introduces an important robustness check, substituting polity scores and
their square for our main variable of interest, POLCON. POLCON is the most theoretically
appropriate measure of our quantity of interest, because our theory concerns the effect of
political institutions on policy stability, rather than, for example, on representativeness
or transparency. However, the normative implications of our findings are substantially
broadened by the observation that our results are essentially unchanged when we use the
standard measure of democracy in place of political constraints. This makes us more com-
fortable using synonyms like the quality of political institutions when describing political
constraints.
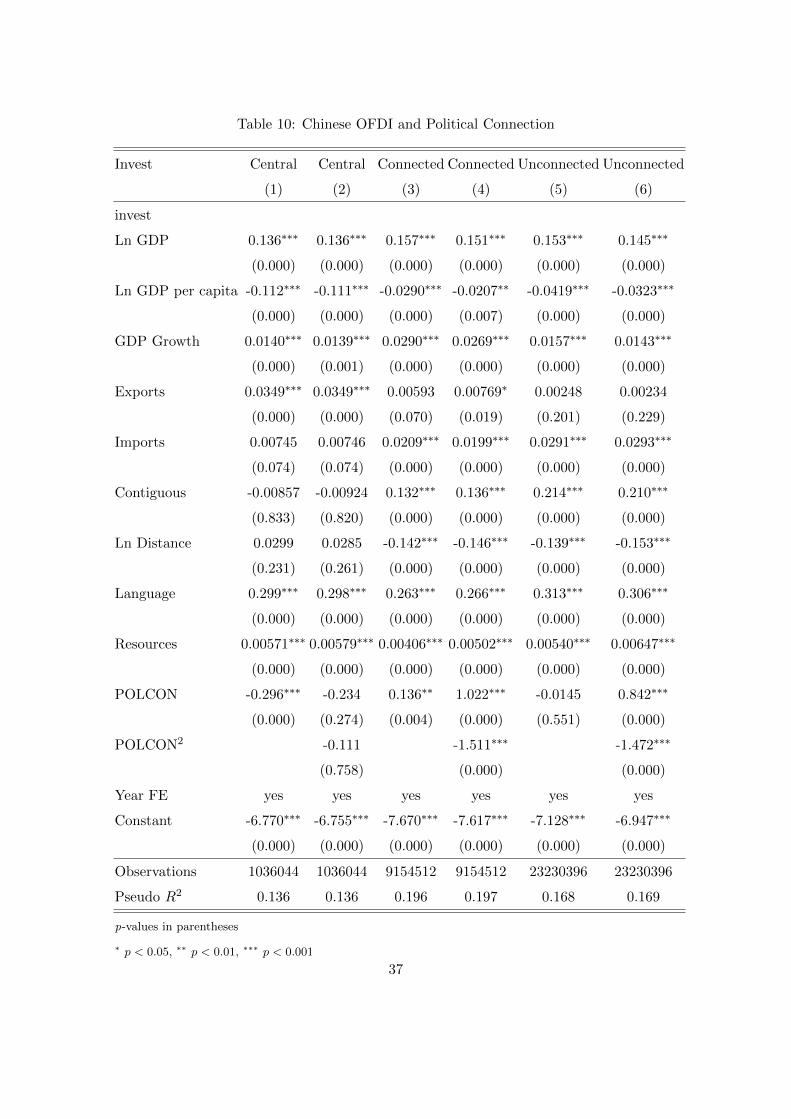
4.2 Firm Characteristics: State Ownership and Political Connections
We expect investment decisions by Chinese firms to be conditioned on firm-level
characteristics, including state ownership and political connectedness to the central gov-
ernment. We use information provided by MOFCOM to identify firms that are centrally
administered state-owned enterprises (SOEs).11 These firms are directly administered by
the central government, and we label them, “central firms.”
We then divide non-central firms into politically connected firms and politically
unconnected firms based on their province of origin. Firms located in politically connected
provinces are labelled as politically “connected firms” while firms located in politically
unconnected provinces are labelled as politically“unconnected firms”. In our sample, 70.23
percent of foreign investors are unconnected firms, 26.42 percent are connected firms while
3.35 percent are central firms. For this purpose, we rely heavily on the connection concept
developed in Shih (2009). A province is regarded as politically connected if the provincial
party secretary or governor shares the same birthplace, the same institution of higher
education, the same bureaucratic grouping, and the same experience of Long March with
a member of the standing committee of the Politburo (PSC) at that time, or a serving
PSC member was officially recorded as a native of the province. We extend the dataset
developed in Shih (2004) to cover the entire observation period.12
11Centrally administered state-owned enterprises are large companies overseen by the State-owned AssetsSupervision and Administration Commission of the State Council (SASAC). They typically operate in“strategic sectors” such as aviation, power and telecommunications, and their total business revenues hit25.1 trillion yuan in 2014, up 3.8 percent. See “China to reduce number of central SOEs to 40”, ChinaDaily, http://www.china.org.cn/business/2015-04/27/content 35429294.htm.
12Please see the codebook of Shih (2004) for details.
17
Figure 4: Evolution of Provinces’ Political Connection, 2000-2013
Note: The evolution of political connection at the provincial level, 2000-2013. Black denotes political connection. White denotes otherwise.
Figure 4 presents our coding of the political connectedness of the 31 Chinese
provinces over the period 2000-2013. Our sample period covers the administrations of
three Chinese presidents, Jiang (2000-2002), Hu (2003-2012), and Xi (2013). The figure
shows that there are large-scale official turnovers after a new president comes into office.
For example, officials from president Xi Jinping’s home province of Shaanxi have risen
dramatically since he came to office, and this is captured well by our data.13 There is
substantial variation over time in the list of provinces that are coded as connected to the
central government even within one president’s tenure, however, so the coding captures
more than presidential administrations.
We first examine how firms react to the level of political constraints in host coun-
tries. Using the model specification of column 2 in Table 2, we replicate the regressions
with the three firm subsamples.14 The estimation results are then used to calculate odds
ratios between the investment probability for a given value of POLCON and the invest-
ment probability for the maximum value of POLCON in the dataset.15 Plotting the odds
ratios against the value of POLCON in Figure 5 illustrates how the investment tendency
of each type of firms depends on the level of political constraints.
13Bo Zhiyue, “In China, Xi Jinping’s Shaanxi Clique on the Rise.” The Diplomat, May 08, 2015.http://thediplomat.com/2015/05/in-china-xi-jinpings-shaanxi-clique-on-the-rise/.
14The estimation results are reported in Appendix 4.15Note that in our dataset, POLCON’s value ranges from 0 to 0.72.
18
Figure 5: Sensitivity to Host Countries’ Level of Political Constraints
Kiribati, Marshall Islands, Saint Kitts and Nevis, St. Lucia,
Nicaragua, Paraguay, St. Vincent and the Grenadines,
Palau, Panama, Solomon Islands, Swaziland,
Sao Tome and Principe (12) Tuvalu (11)
No
Rest of the World (168) Andorra, Bahamas, Bhutan,
Dominica, Liechtenstein,
Maldives, Monaco, Montenegro,
San Marino, Somalia (10)
Note: Chad severed ties with Taiwan in 2006. The Chinese investment in Chad was made in 2005, whenChad still recognized Taiwan.
Consistent with the findings of Cheung et al. (2012b), we find that Taiwan recognition
16To minimize the potential for endogeneity bias and take into account the time needed to clear theinvestment licensing procedure, we lag the foreign-policy measures by one year.
17The set of counties that recognize Taiwan is not static. Nine countries broke their diplomatic ties withTaiwan between 2000 and 2013, including Chad, Gambia and Malawi, which have all received Chineseinvestment.
20
plays a key role in determining Chinese OFDI. Although some countries that recognize
Taiwan receive some Chinese FDI, our estimation results indicate that the probability that
a firm chooses to invest in a country is reduced by 90% if that country recognizes Taiwan.
A broad measure of Chinese foreign policy preferences is similarity in UN General
Assembly voting. Similarity scores in UN voting have been widely used in studies of U.S.
foreign policy, and the United States has a standing policy of using its foreign aid to
reward and punish countries based upon their “important” votes in the UN as determined
by the U.S. State Department. More generally, UN voting may serve as a convenient
index of a country’s foreign policy preferences, so that similarity in voting could represent
convergence in policy preferences even if neither country explicitly seeks to influence the
other’s votes (Voeten et al., 2009). We interpret the voting coincidence between China
and country c in year t (UN votingc,t) as a measure of country c’s diplomatic proximity
with China. Using the voting data provided by Voeten (2013) and the approach of Dreher
& Jensen (2013), we code votes in agreement with China as 1, votes in disagreement as 0,
and abstentions or absences as 0.5. After summing the scores obtained from all votes and
dividing it by the number of votes in year t, we get UN voting, which ranges from 0 to 1.
We find a strong relationship between UN voting similarity and Chinese OFDI transactions
that is consistent across firm types. In the pooled sample, an increase in proximity by
one standard deviation is associated with a 48% increase in the probability that a firm
makes an investment in a particular country. This effect holds only in countries that are
not members of the OECD, which suggests that China conditions its FDI to developing
countries on political alignment, but uses different criteria to make decisions on investing
in developed countries.18
Along similar lines, we use the decisions of countries to join the China-sponsored
Asian Infrastructure Investment Bank in 2015 as a proxy for their willingness to accomo-
date China’s foreign policy preferences. The United States mildly discouraged its allies
from joining the AIIB, but a number of them decided to become founding members nev-
ertheless, including the UK, Germany, France, Israel and Australia, whose joining swelled
the ranks of founding members to 57. These decisions post-date our OFDI data, so we
have to be very cautious in interpreting these results, but they are consistent with treating
AIIB membership as a proxy for an accommodating posture towards China. Countries
that joined the AIIB in 2015 were substantially more likely to receive investments in prior
years, and the results were consistent across firm types.
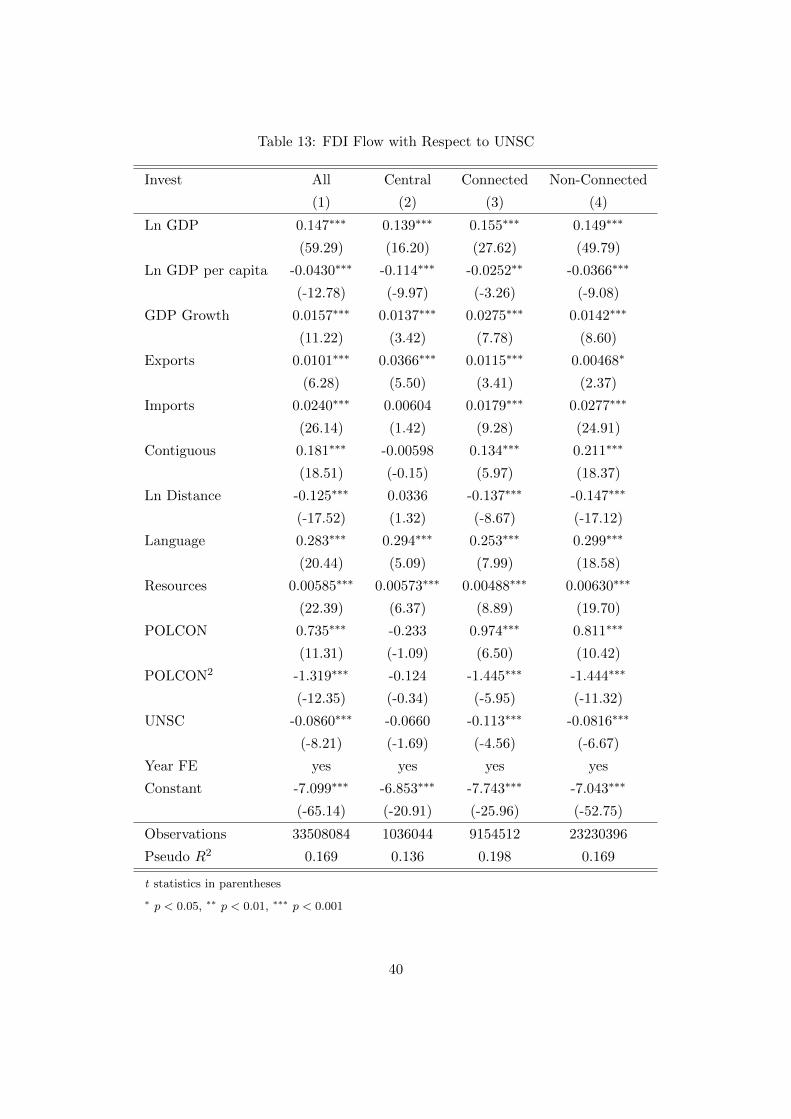
In an effort to discriminate between the hypothesis that China targets a general
foreign policy orientation and the possibiity that it uses OFDI strategically to reward
18The model includes a dummy variable for OECD membership and an interaction between OECD andUN voting. Estimates are reported in Table 11. See Figure 8 in the Online Appendix for the distributionof UN voting among OECD members and non-OECD countries.
21
particular foreign policies, we turned our attention to temporary membership in the UN
Security Council. Temporary UNSC members have the opportunity to influence a wide
range of foreign policy issues of concern to the leading states in the international sys-
tem, so the latter have an incentive to use their resources to influence UNSC members’
votes. Membership has been shown to be associated with increased U.S. foreign aid and
increased support from the World Bank, the IMF and UN agencies (Kuziemko & Werker,
2006a; Vreeland & Dreher, 2014). Because temporary members serve two-year terms that
cannot be consecutive, the end of a term provides an exogenous treatment that identifies
the effect. If China used its OFDI strategically to reward countries that supported its
positions in the UNSC, it would target temporary members, and would have no incentive
to continue to target them after their terms expired. The negative significant results re-
ject the hypothesis that China targets temporary UNSC members for OFDI, suggesting
that the more likely interpretation of the UN voting results is that countries with general
foreign policy orientations supportive of China receive favorable treatment from Chinese
authorities rather than that China responds to UN votes per se.
Table 4: FDI and Chinese Foreign Policy
Variables Firms Estimates S.E. p Value ∆ Prob
Taiwan recognition
all -0.552 0.05 0.00 -90.9%
central -0.543 0.1073 0.00 -88.6%
connected -0.569 0.1156 0.00 -92.7%
non-connected -0.571 0.0657 0.00 -91.5%
UN voting
all 1.120 0.07 0.00 48.4%
central 1.073 0.21 0.00 40.8%
connected 0.953 0.16 0.00 40.0%
non-connected 1.193 0.08 0.00 52.5%
UNSC seat
all -0.086 0.01 0.00 -30.4%
central -0.066 0.04 0.09 -26.3%
connected -0.113 0.02 0.00 -37.2%
non-connected -0.082 0.01 0.00 -28.9%
AIIB Membership
all 0.117 0.01 0.00 45.5%
central 0.104 0.03 0.09 37.5%
connected 0.125 0.02 0.00 49.5%
non-connected 0.119 0.01 0.00 43.5%
Note: The change in probability for the variable UN voting compares the predictions at the mean and atthe mean plus one standard deviation. Detailed estimation results are in the Online Appendix.
22
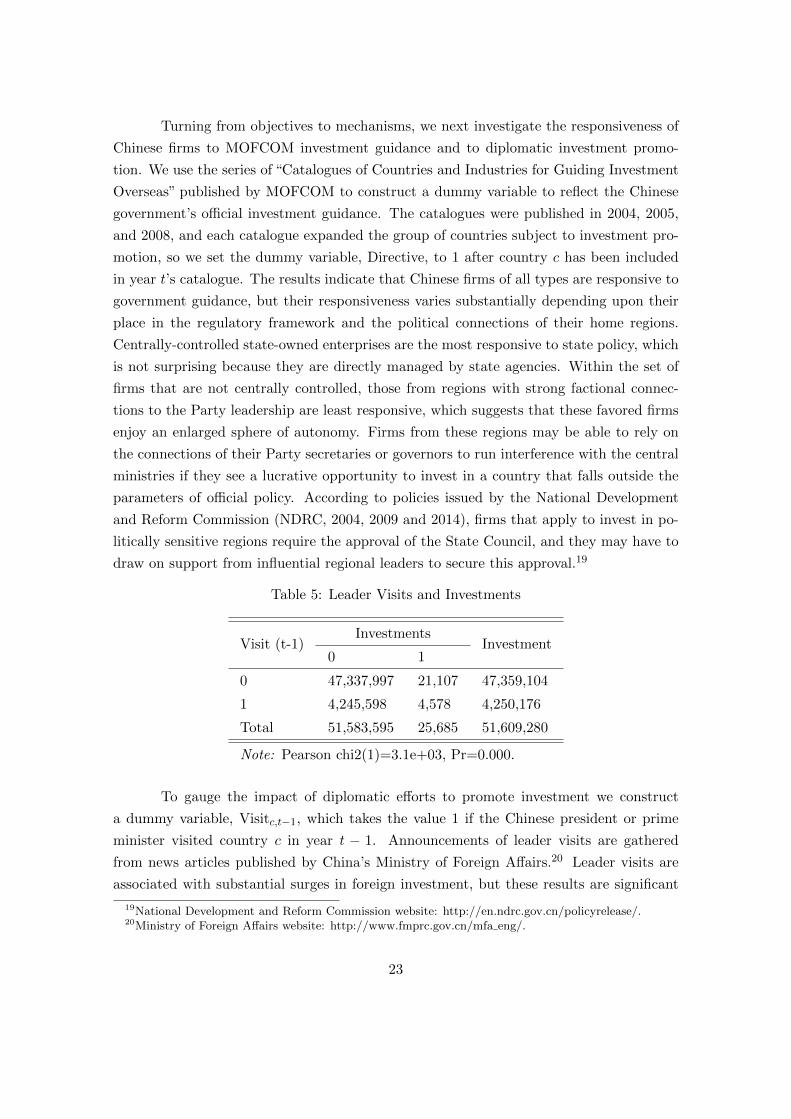
Turning from objectives to mechanisms, we next investigate the responsiveness of
Chinese firms to MOFCOM investment guidance and to diplomatic investment promo-
tion. We use the series of “Catalogues of Countries and Industries for Guiding Investment
Overseas” published by MOFCOM to construct a dummy variable to reflect the Chinese
government’s official investment guidance. The catalogues were published in 2004, 2005,
and 2008, and each catalogue expanded the group of countries subject to investment pro-
motion, so we set the dummy variable, Directive, to 1 after country c has been included
in year t’s catalogue. The results indicate that Chinese firms of all types are responsive to
government guidance, but their responsiveness varies substantially depending upon their
place in the regulatory framework and the political connections of their home regions.
Centrally-controlled state-owned enterprises are the most responsive to state policy, which
is not surprising because they are directly managed by state agencies. Within the set of
firms that are not centrally controlled, those from regions with strong factional connec-
tions to the Party leadership are least responsive, which suggests that these favored firms
enjoy an enlarged sphere of autonomy. Firms from these regions may be able to rely on
the connections of their Party secretaries or governors to run interference with the central
ministries if they see a lucrative opportunity to invest in a country that falls outside the
parameters of official policy. According to policies issued by the National Development
and Reform Commission (NDRC, 2004, 2009 and 2014), firms that apply to invest in po-
litically sensitive regions require the approval of the State Council, and they may have to
draw on support from influential regional leaders to secure this approval.19
Table 5: Leader Visits and Investments
Visit (t-1)Investments
Investment0 1
0 47,337,997 21,107 47,359,104
1 4,245,598 4,578 4,250,176
Total 51,583,595 25,685 51,609,280
Note: Pearson chi2(1)=3.1e+03, Pr=0.000.
To gauge the impact of diplomatic efforts to promote investment we construct
a dummy variable, Visitc,t−1, which takes the value 1 if the Chinese president or prime
minister visited country c in year t − 1. Announcements of leader visits are gathered
from news articles published by China’s Ministry of Foreign Affairs.20 Leader visits are
associated with substantial surges in foreign investment, but these results are significant
19National Development and Reform Commission website: http://en.ndrc.gov.cn/policyrelease/.20Ministry of Foreign Affairs website: http://www.fmprc.gov.cn/mfa eng/.
23
only for firms that are not centrally controlled. If these surges were intended as Chinese
concessions to improve bilateral relations, they should be concentrated among central
firms, since these are the easiest to control and account for the bulk of Chinese OFDI. The
lack of results for these firms confirms our intuition that diplomatic efforts to promote
investment are primarily intended to provide benefits to firms. The striking result is that
connected firms benefit more than twice as much as non-connected firms from leader visits,
increasing their probability of investing by over 25% when a Chinese leader visits a country.
The implication is that Chinese diplomacy channels lucrative investment opportunities to
firms from regions with leaders who are political allies of the ruling faction. The fact
that these opportunities are political plums, furthermore, suggests that the exchange rate
of influence favors Chinese diplomacy: foreign leaders are willing to make concessions
to Chinese leaders that are valuable to Chinese firms. Since the connected firms that
respond have the most monopolistic investment strategies, the implication is that Chinese
diplomacy wrests concessions that make those strategies profitable, such as giving Chinese
firms preferential access to markets or resources.
Table 6: OFDI and Chinese Foreign Policy
Variables Firms Estimates S.E. p Value ∆ Prob
Directive
all 0.224 0.013 0.00 150.4%
central 0.299 0.0448 0.00 208.0%
connected 0.193 0.0259 0.00 129.5%
non-connected 0.233 0.0169 0.00 158.4%
Visit
all 0.031 0.01 0.00 13.5%
central 0.035 0.0311 0.26 14.1%
connected 0.052 0.0160 0.00 25.6%
non-connected 0.026 0.0085 0.00 10.9%
These results establish that Chinese foreign investment is intensively guided and
promoted by the state and is responsive to important Chinese foreign policy objectives.
The evidence suggests that China targets general foreign policy orientations rather than
using OFDI as an instrument to achieve particular outcomes in international organi-
zations. Chinese firms enjoy variable degrees of autonomy from the state, however.
Centrally-controlled SOEs are most closely controlled. In contrast, firms from regions
with politically-influential Party leaders have the most freedom to choose their investments
abroad, and benefit most from diplomatic investment promotion, while central firms do
not appear to benefit.
24
5 Case Studies
To illustrate our findings, we focus on two firms that have made enough foreign
investments to allow us to replicate our analysis using investments by an individual firm.
Sinohydro Corporation21 is a centrally-controlled state-owned enterprise, and Yuncheng
Plate Making Group22 is a private firm.
Sinohydro Corporation is the largest and most successful Chinese firm in the field
of hydraulic and hydropower engineering, and holds a 50% share of the global hydroelectric
construction market.23 By 2011, Sinohydro had established 79 branches in 60 countries
in Africa, Asia, South America and Eastern Europe. Undertaking 311 projects valued at
31 billion USD, Sinohydro was ranked 24th in the list of top International Contractors by
Engineering News-Record, and was ranked second among Chinese firms according to new
signed contract value, and third in terms of international turnover in 2011.24 True to type
as a prominent state-owned enterprise, Sinohydro plays a key role in Chinese diplomacy,
and many of its investments are in countries with poor governance but a prominent role
in China‘s foreign policy, such as Uzbekistan and Sudan. Sinohydro rebuilt the Tashkent
Airport and subsequently carried out a World Bank irrigation project in Uzbekistan, and
the Chinese Ministry of Commerce commended it for following the “Go Global” policy,
overcoming obstacles, and setting a good example for other Chinese firms in Central Asia.25 In Sudan, Sinohydro built the Merowe dam (2003-2009), the largest dam in the world,
which was substantially financed by China’s Export-Import Bank. It subsequently created
an affiliate in Sudan and won a $300 million contract from the Sudanese government to
construct roads.2627 Sinohydro’s investments in both Uzbekistan and Sudan followed
Chinese state visits.
In contrast, Yuncheng Plate Making Group is a private firm located in Shanxi
province, and its investment strategy appears to be more risk averse and focused on op-
21Firm website: http://www.sinohydro.com.22Firm website: http://www.yczbjt.com.23“China’s dam builders crack the Latin American market,” Global Construction Review, February
24“Sinohydro Corporation Limited”, Contact Office of Chinese Companies in Saudi Arabia,http://www.saudi-cocc.net/c35294/w10243306.asp.
25“中国水利水电工程总公司继续成功开拓乌兹别克及中亚工程承包市场,” Tiantian Zheng,MOFCOM, http://www.mofcom.gov.cn/article/i/jyjl/j/200207/20020700030682.shtml. In 2012, Sino-hydro received a certificate from China’s Embassy in Uzbekistan in recognition of its contribu-tion to China-Uzbekistan economic relations. “中国水电获中国驻乌兹别克斯坦经参处表彰,”http://www.sinohydro.com/index.php?m=content&c=index&a=show&catid=69&id=687.
27“Sinohydro wins US $300 million order in Sudan,” China Daily, March, 6, 2009,http://www.china.org.cn/business/2009-03/06/content 17390909.htm.
25
portunities to make monopolistic profits. With 132 subsidiaries and total assets of 4.3
billion RMB, it is the world’s largest manufacturer of gravure rollers. Gravure rollers
are used in high-quality and high-volume color printing, including magazines, advertise-
ments and packaging materials, and the business lends itself to monopolization because
of the high fixed costs of the equipment used to produce specialized rollers for particular
print runs.28 Yuncheng controls 80% of China’s domestic market and has extensive in-
vestments all around the world, including developed countries such as the United States,
Japan, and Spain, and developing countries such as Pakistan, Egypt and Nepal. It invests
most heavily in developing countries with weak political institutions, and its businesses in
those regions appear to be its most profitable. According to documents released by the
Shanghai Far East Credit Rating Corporation, Yuncheng’s initial eleven foreign factories,
located in Vietnam (two), Pakistan, Bangladesh, Thailand, Burma, Indonesia, the Philip-
pines, Egypt, Ukraine and Egypt, all recorded over 50% profit margins, which exceeded
the profits achieved in the Chinese domestic market. All of these factories enjoyed income
tax exemptions, so Yuncheng was evidently able to translate its political influence into
policy support.29 In contrast, although the firm has made inroads into markets in devel-
oped countries, it has been much less competitive there. For example, Yuncheng currently
controls 5% of the Spanish market.30
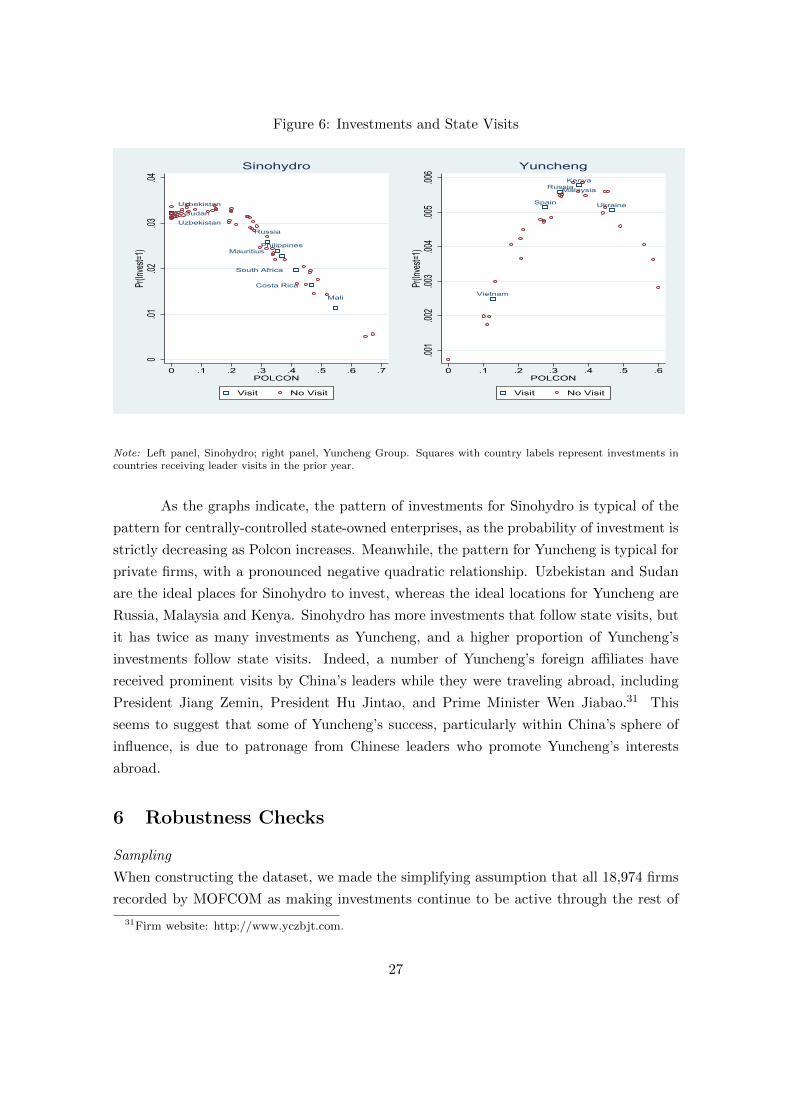
Our dataset includes 66 investments from Sinohydro and 34 investments from
Yuncheng Group, so we are able to estimate the probabilities of investment as a function
of political constraints for each firm. Figure 6 graphs the estimated probabilities for
Sinohydro on the left panel and for Yungcheng on the right panel. The squares represent
investments in countries that have seen a leader visit in the prior year, and are labeled
with country names.
28The basic technology of gravure rollers has been is use since the 19th century, but Yuncheng usesadvanced Swiss color management technology and computer-controlled laser etching to produce its rollers.
29 “2006年山西运城制版集团股份有限公司5亿元短期融资券信用评级结论通知,” Shanghai Far East CreditRating Corporation, http://www.sfecr.com/uploadfiles/2015/11/20151112134903493.pdf.
30“中 资 企 业 在 欧 洲 闯 出 共 赢 路,” People Daily, March 15, 2013,http://news.xinhuanet.com/overseas/2013-03/15/c 124460771 2.htm.
26
Figure 6: Investments and State Visits
Uzbekistan
Uzbekistan
Sudan
Russia
MauritiusPhilippines
South Africa
Costa Rica
Mali
0.01
.02.03
.04Pr(
Inves
t=1)
0 .1 .2 .3 .4 .5 .6 .7POLCON
Visit No Visit
Sinohydro
Vietnam
Spain
RussiaMalaysia
Kenya
Ukraine
.001
.002
.003
.004
.005
.006
Pr(Inv
est=1
)
0 .1 .2 .3 .4 .5 .6POLCON
Visit No Visit
Yuncheng
Note: Left panel, Sinohydro; right panel, Yuncheng Group. Squares with country labels represent investments incountries receiving leader visits in the prior year.
As the graphs indicate, the pattern of investments for Sinohydro is typical of the
pattern for centrally-controlled state-owned enterprises, as the probability of investment is
strictly decreasing as Polcon increases. Meanwhile, the pattern for Yuncheng is typical for
private firms, with a pronounced negative quadratic relationship. Uzbekistan and Sudan
are the ideal places for Sinohydro to invest, whereas the ideal locations for Yuncheng are
Russia, Malaysia and Kenya. Sinohydro has more investments that follow state visits, but
it has twice as many investments as Yuncheng, and a higher proportion of Yuncheng’s
investments follow state visits. Indeed, a number of Yuncheng’s foreign affiliates have
received prominent visits by China’s leaders while they were traveling abroad, including
President Jiang Zemin, President Hu Jintao, and Prime Minister Wen Jiabao.31 This
seems to suggest that some of Yuncheng’s success, particularly within China’s sphere of
influence, is due to patronage from Chinese leaders who promote Yuncheng’s interests
abroad.
6 Robustness Checks
Sampling
When constructing the dataset, we made the simplifying assumption that all 18,974 firms
recorded by MOFCOM as making investments continue to be active through the rest of
31Firm website: http://www.yczbjt.com.
27
our sample period. One potential concern is that some firms might have failed and ceased
operations during our sample period, which would introduce erroneous zeroes. To address
this potential problem, we first shrink the observation period to 2005-2013 and then to
2010-2013. Since fewer firms will fail in a shorter time period, shortening our sample pe-
riod makes our initial assumption more plausible. Finally, we restrict our sample to only
firms that have made an investment in a foreign country in a particular year. This ensures
in the strictest sense that all firms in the dataset are active and are considering making
foreign investments. We apply our baseline model to these subsamples and report the
results in the Online Appendix in Table 16. The negative quadratic relationship between
POLCON and firms’ tendency to invest is consistently significant at the 1 percent level in
all of the subsamples, so we are not concerned about sample selection bias caused by firm
exits.
Political Constraints
To check the robustness of our quadratic specification of the relationship between political
constraints and OFDI decisions, we replicate our baseline estimation with linear, quadratic,
and cubic functional forms. The estimates are reported in the Online Appendix in Table 9
and the predicted probabilities are plotted against POLCON in Figure 7. The coefficient
for POLCON is insignificant in the linear specification, so we reject the linear model. This
is consistent with the results of our non-parametric analysis. The estimates from the cubic
model are not qualitatively different from those from the quadratic specification, so adding
further complexity is unlikely to improve on the efficiency of our estimates.
Figure 7: Effects of POLCON on Chinese OFDI: Linear, Quadratic and Cubic
.000
01.0
0002
.000
03.0
0004
.000
05.0
0006
Pr(
Inve
st)
0 .1 .2 .3 .4 .5 .6 .7POLCON
Linear Predictions
.000
01.0
0002
.000
03.0
0004
.000
05.0
0006
Pr(
Inve
st)
0 .1 .2 .3 .4 .5 .6 .7POLCON
Quadratic Predictions
.000
01.0
0002
.000
03.0
0004
.000
05.0
0006
Pr(
Inve
st)
0 .1 .2 .3 .4 .5 .6 .7POLCON
Cubic Predictions
Note: The left, middle, and right panels are obtained from using the estimates reported in column 1-3 of Table 9.
28
7 Conclusion
We analyze a comprehensive firm-level dataset of China’s outward OFDI and use
firms’ location decisions to draw inferences about their investment strategies, the degree of
their autonomy vis-a-vis the state, and their political influence. We obtain three important
sets of results and draw broad lessons about the politics of Chinese foreign investment.
First, we find that Chinese firms generally prefer to invest in countries with a mod-
erately low level of political constraints. There is a non-monotonic relationship between
the level of political constraints in the target country and these firms’ probability of invest-
ing, which is consistent with a model of monopolistic competition. Chinese firms prefer
to invest in a country where the level of political constraints is high enough to reduce the
risk of expropriation, but not so high as to allow competition to drive monopolistic profits
to zero. This relationship is well approximated by a negative quadratic specification, and
this finding is robust to a wide range of robustness checks, including use of alternative
samples and substituting the polity democracy score for political constraints.
Second, we find important differences in investment strategies that are driven by
firm characteristics, which allow us to draw conclusions about Chinese domestic politics.
Centrally-controlled state-owned firms respond most weakly to political constraints in
potential host countries and are most likely to invest in countries with extremely weak po-
litical constraints. There is no non-monotonic effect of institutions for these central firms,
which are apparently implicitly insured against political risk. Firms that are not central
SOEs behave quite differently. The non-monotonic relationship that signals monopolistic
strategies is most pronounced for firms from regions whose leaders are well-connected at
the top of the Communist Party. This is consistent with previous work that showed that
factional connections channel credit to favored regions, and further implies that firms from
those regions can rely on these connections to help them to pursue monopolistic investment
strategies abroad.
Finally, we find that Chinese foreign investment responds to Chinese foreign policy,
but responsiveness varies by firm characteristics in revealing ways. Countries that recog-
nize Taiwan drive Chinese investors away, and developing countries that vote with China in
the United Nations General Assembly attract them. China’s Ministry of Commerce issues
investment guidance that channels foreign investment to favored regimes, and we find that
central SOEs are most responsive to those guidelines, and firms from well-connected regions
are least responsive. Evidently, firms can exploit factional politics to carve out a sphere of
autonomy. China’s leaders use their foreign travel to promote Chinese foreign investment,
but we find that central SOEs are excluded from these investment-promotion efforts. In
contrast, the benefits go disproportionately to the same firms from well-connected regions
that are least responsive to official guidance. It appears that firms from favored regions
29
can rely on Chinese diplomacy to secure lucrative concessions abroad.
As it emerges as one of the leading sources of foreign investment, China is increas-
ingly exporting its domestic politics. Firms that are based in China exist in a milieu of
uncompetitive capital markets based on favors and connections, which allows uncompeti-
tive organizations to flourish. These firms find monopolistic business strategies to be most
lucrative, and they pursue a strategy of investing in countries that are hospitable to such
strategies, where expropriation is not too likely, but entry of competitors can easily be
deterred. The accident of which regions happen to be favored in the factional struggle for
power within the Communist Party determines the flow of credit and influence, and firms
from favored regions pursue the most consistently monopolistic foreign investment strate-
gies. China’s diplomacy seeks to use foreign investment to build international support for
its foreign policy, but firms from favored regions can slip out of the net, and the highest-
profile efforts to promote investment appear to be made on behalf of the interests of firms
from those regions. The picture that emerges suggests a fusion of competition between
political factions and between monopolistic firms, where private firms that benefit from
political patronage enjoy not only substantial autonomy but also considerable control over
Chinese investment policy.
30
References
Anderson, J., & Marcouiller, D. (2002). Insecurity And The Pattern Of Trade: An
Empirical Investigation. The Review of Economics and Statistics.
Anderson, J. E., & Young, L. (2006, November). Trade and Contract Enforcement. The
B.E. Journal of Economic Analysis & Policy , 5 (1). doi: 10.1515/1538-0645.1574
Beule, F. D., & Duanmu, J.-L. (2012). Locational determinants of internationaliza-
tion: A firm-level analysis of Chinese and Indian acquisitions. European Management
Journal , 30 (3), 264 - 277. Retrieved from http://www.sciencedirect.com/science/
article/pii/S0263237312000242 (Multinational Companies from Emerging Markets
and Strategic Fit) doi: http://dx.doi.org/10.1016/j.emj.2012.03.006
Buckley, P. J., Clegg, L. J., Cross, A. R., Liu, X., Voss, H., & Zheng, P. (2007). The
Determinants of Chinese Outward Foreign Direct Investment. Journal of International
Business Studies, 38 (4), 499-518. Retrieved from http://www.jstor.org/stable/
4540439
Chen, C. (2015). Determinants and motives of outward foreign direct investment from
China’s provincial firms. Transnational Corporations, 23 (1). (New York and Geneva:
United Nations Conference on Trade and Development)
Chen, W., & Tang, H. (2014). The Dragon Is Flying West: Micro-level Evidence of
Chinese Outward Direct Investment. Asian Development Review , 31 (2), 109-140.
Cheng, L. K., & Ma, Z. (2007). China´s outward FDI: Past and future. (Working paper
no. 2007706001E, School of Economics, Renmin University, China.)
Cheung, Y.-W., de Haan, J., Qian, X., & Yu, S. (2012). The Evolving Role of China in the
Global Economy. In The Evolving Role of China in the Global Economy (p. 419-444).
MIT Press. Retrieved from http://www.jstor.org/stable/j.ctt5hhm32.18
Cheung, Y.-W., & Qian, X. (2009). EMPIRICS OF CHINA’S OUTWARD DIRECT
8.1 Regulations on China’s Outward Direct Investment
China’s regulatory framework for OFDI serves two objectives: to facilitate and support
OFDI, and to encourage OFDI that contributes most to China’s national development
(Sauvant & Chen, 2014). These goals are more explicitly elaborated in the “Going Global”
strategy, which states that the government should facilitate investment in natural resources
exploration and other areas where Chinese firms have a comparative advantage. In recent
years, China’s regulatory framework on OFDI has moved from restricting to facilitating
and encouraging while a major part of it remains cumbersome.
The first legislation related to OFDI projects is the Interim Measures for the Ad-
ministration of Examination and Approval of the Overseas Investment Projects (the “In-
terim Measures”). The document was issued by the National Development and Reform
Commission (NDRC) in October 2004. In addition, as the ministry responsible for OFDI,
the Ministry of Commerce of People’s Republic of China (MOFCOM) started setting the
detailed rules for the examination and approval of OFDI projects from 2005. Currently
It also maintains the filing system and publishes annual aggregated OFDI flows in the
Statistical Bulletins of China’s Outward Foreign Direct Investment.
Due to China’s capital controls, the NDRC, the MOFCOM, China ExIm Bank,
and other government agencies announced the regulations concerning how China’s policy
banks provide credit support for OFDI projects in 2004-2005. Back then, the authority
considers the amount of foreign exchange needed in the investment as a main determinant
for whether to approve an OFDI project.
As the Chinese economy expands and the demand for OFDI grows, the workload at
the central government agencies, such as the State Council, the NDRC, and the MOFCOM,
has became onerous. To cope with the expanding demand, the NDRC issued the Notice
of the National Development and Reform Commission about Decentralizing the Approval
Authority of Foreign Investment Projects (the “Notice”) in February 2011. The “Notice”
grants provincial government the approval authority over local firms when the projects are
not sensitive in terms of size, sector, and destination. To further decentralize the project
approval authority, the NDRC issued the Measures for the Administration of Approval
and Recordation of the Overseas Investment Projects (the “Measures”) in 2014 to replace
the old “Interim Measures”.
The“Measures”raised the investment amount threshold for projects to be approved
by the State Council to USD 2 billion and the investment amount threshold for projects
to be approved by the NDRC to USD 1 billion. Meanwhile, projects involving sensitive
countries (or regions) or sensitive sectors still need the approval from the NDRC and the
34
State Council. The “Measures” define sensitive countries (or regimes) as countries (or re-
gions) that are not in a diplomatic relationship with China, under international sanctions,
or involved in (civil) wars. Sensitive sectors include telecommunication, hydropower, real
estate, power grid, news media, etc.
8.2 Tables
Table 7: Main variables and sources of data
Variable Explanation SourceInvest Inflow of Chinese OFDI, binary MOFCOMLn GDP Log of host country GDP World BankLn GDP per capita Log of host country GDP per capita World BankGDP Growth Host country GDP growth rate World BankExports Export to China as share of Chinese GDP UN ComtradeImports Import from China as share of Chinese GDP UN ComtradeLn Distance Log of distance between country i and China CEPIILanguage Share a common language, binary CEPIIResources Resources rent as share of host country GDP World BankPOLCON Political constraints in the host country Political Constraint IndexPolity Democracy index of the host country Polity IV ProjectTaiwan A dummy on whether the country recognizes Taiwan Xinhua
Table 8: Firm Types and Investment Behavior
Firm Type Political Ties Relationship Ratio (0.56) C.I. (95%)


![De - macs.hw.ac.ukfairouz/forest/talks/talks2001/talkPPDP2001.pdf · A ew F Uses of Generalised Reduction and erm T Reshu ing Regnier [1992] uses term reshu ing and generalized reduction](https://static.documents.pub/doc/80x56/5c7b042409d3f26c268b6477/de-macshwacuk-fairouzforesttalkstalks2001-a-ew-f-uses-of-generalised.jpg)


