Javier San Félix Head Banco Santander – America Division Head Banco Santander America Division The Rise of Emerging Market Financial Institutions: Financial Institutions: What are the implications for financial stability? WB / IMF/ FED, June 7 th 2013
Transcript
Javier San FélixHead Banco Santander – America DivisionHead Banco Santander America Division
The Rise of Emerging Market Financial Institutions:Financial Institutions: What are the implications for financial stability?yWB / IMF/ FED, June 7th 2013
2
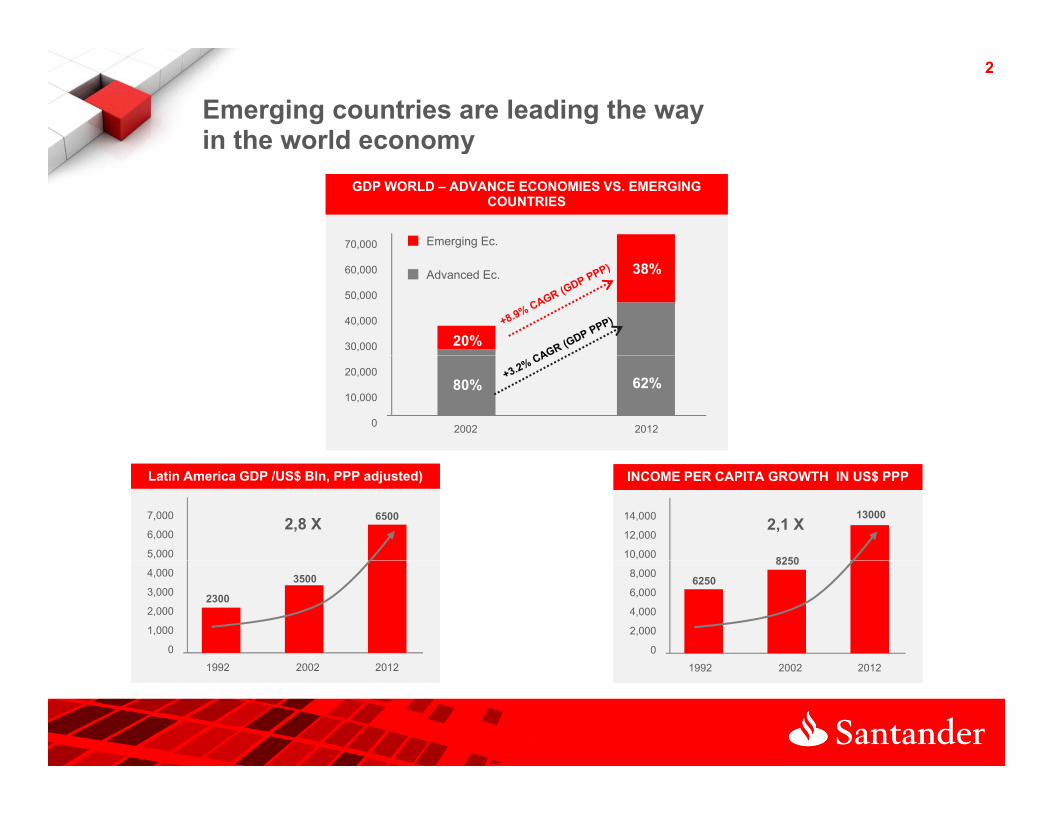
Emerging countries are leading the wayin the world economy y
GDP WORLD – ADVANCE ECONOMIES VS. EMERGING COUNTRIES
GDP WORLD – ADVANCE ECONOMIES VS. EMERGING COUNTRIES
70,000 Emerging Ec.
60,000
50,000
40,000
30,000 20%
38%Advanced Ec.
20,000
10,000
0 2002 2012
80% 62%
Latin America GDP /US$ Bln, PPP adjusted) Latin America GDP /US$ Bln, PPP adjusted)
7,000
6,000
5,000
65002,8 X
INCOME PER CAPITA GROWTH IN US$ PPPINCOME PER CAPITA GROWTH IN US$ PPP
14,000
12,000
10,000 8250
130002,1 X
4,000
3,000
2,000
1,000
0
2300
3500 8,000
6,000
4,000
2,000
0
6250
8250
1992 2002 2012 1992 2002 2012
3
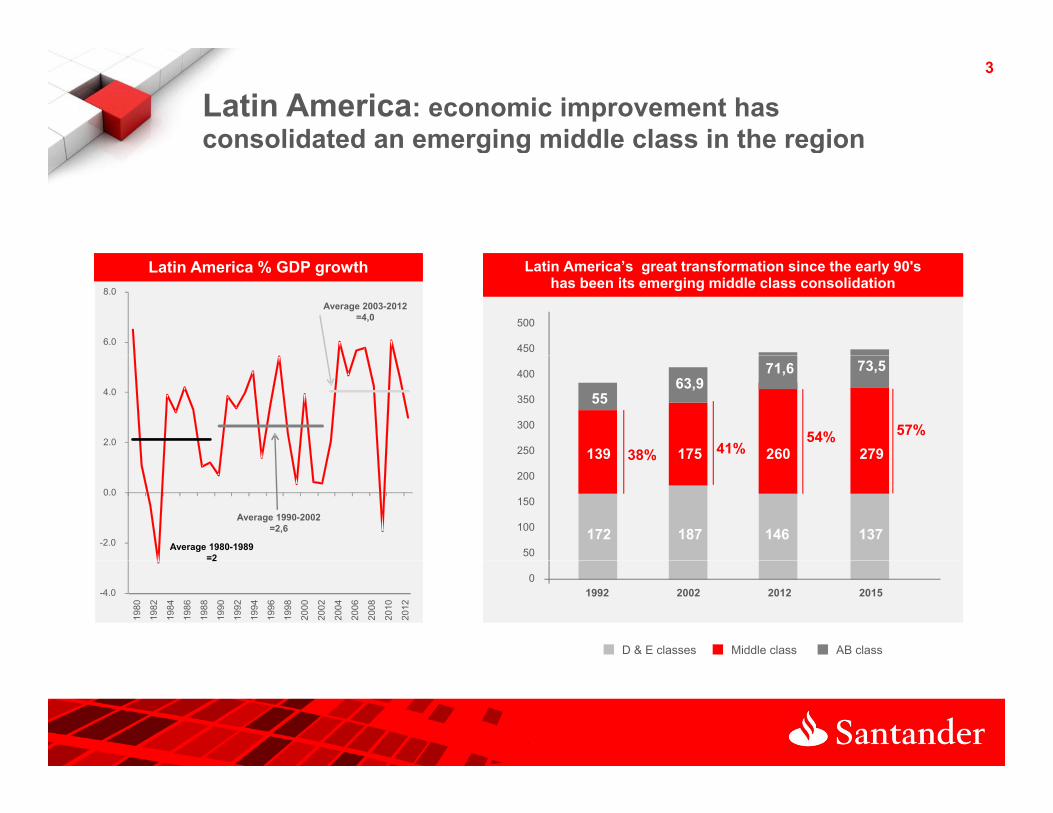
Latin America: economic improvement has consolidated an emerging middle class in the regiong g g
500
450
Latin America % GDP growthLatin America % GDP growth
6.0
8.0Average 2003-2012
=4,0
Latin America’s great transformation since the early 90's has been its emerging middle class consolidation
Latin America’s great transformation since the early 90's has been its emerging middle class consolidation
400
350
300
250 139
55
175
63,9
260
71,6
279
73,5
38% 41%54% 57%
2.0
4.0
200
150
100
50172
139
187
175
146
260
137
27938%
-2.0
0.0
Average 1980-1989=2
Average 1990-2002=2,6
01992 2002 2012 2015
D & E classes Middle class AB class
-4.0
2
1980
1982
1984
1986
1988
1990
1992
1994
1996
1998
2000
2002
2004
2006
2008
2010
2012
4
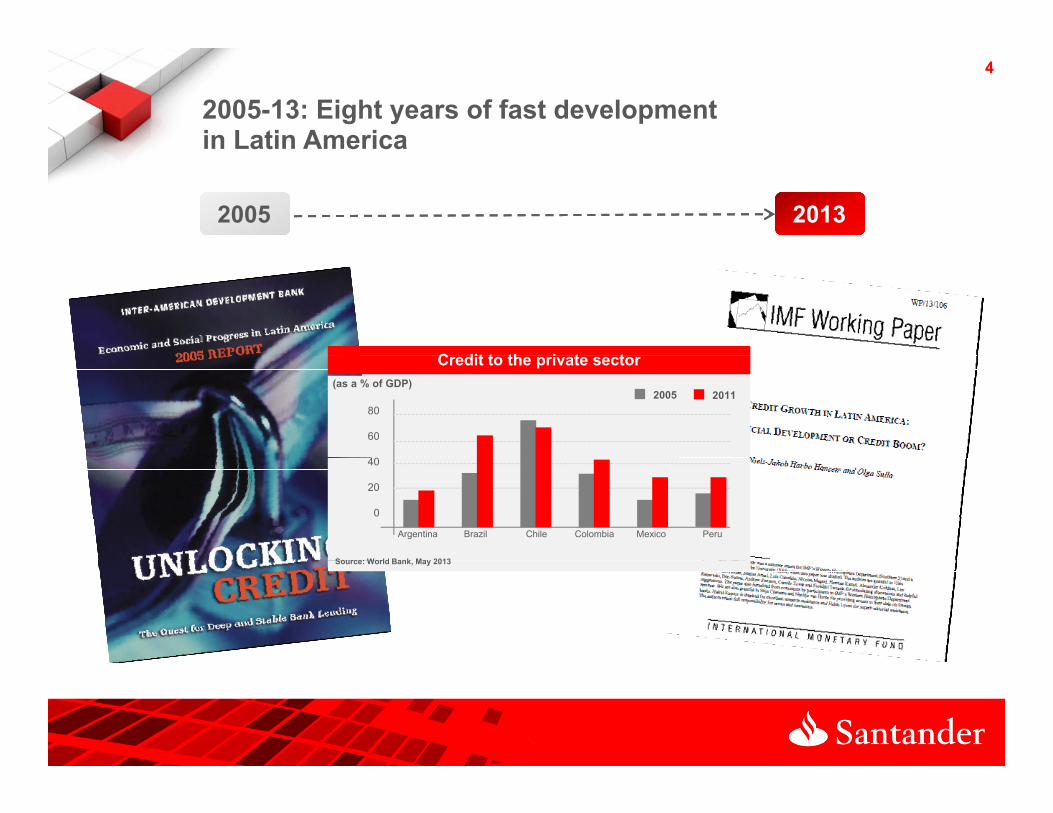
2005-13: Eight years of fast development in Latin America
2005 2013
C dit t th i t tC dit t th i t tCredit to the private sector Credit to the private sector
80
60
40
20112005(as a % of GDP)
40
20
0
Argentina Brazil Chile Colombia Mexico Peru
Source: World Bank May 2013Source: World Bank, May 2013
5
Banking systems in LATAM
Latin America keeps growing at double-digit rates
CreditCredit
1,778
SavingsSavings
2,741
5515.3
19.618.7
1,082
1,2841,535
55
11.814.515.3
12 4
1,857
2,1402,450
6.1
Dec-10 Dec-11 Last. Av.Dec-09Dec-09
12.4
Dec-10 Dec-11 Last. Av.
6Latin America is in the forefront of implementation of new financial regulation and with solvent and liquid balance-sheetsliquid balance-sheets
Status of adoption of Basel III
Final rule bli h d
Final rule
published
Draft rulepublished
Mexico Argentina Brazil United States European Union
Source: BIS, May 2013
Solvency and liquidity indicators
Capital to Assets
Liquid Assets to Total Assets
11.7
29.0
10.0
30.2
8.1
13.2
11.1
35.0
10.4
28.3
4.7
39.7
5.1
19.0
Argentina Brazil Chile Mexico Peru USA Germany UK
12.0
13.4
Source: Financial Soundness Indicators (FSI), World Bank, May 2013
7
Santander has weathered the crisis
Recurring results… even in tough timesProfits
2012Pre-provision profit (net margin)(billions of euros)
First quarter 2013 attributable profit by geographic segments (*)
Balance between mature and emerging markets
Brazil26%
Poland4%Spain
11%G
Portugal1%
26%
Mexico13%
Germany5%
Other – Europe4%
Rest of Latin
USA12%
UK12%
Chile5%
Rest of Latin America3%
Argentina4%
(*) Ordinary attributable profit by operating area excluding discontinued real estate activity in Spain
9
…and its Business Model
The commercial model focuses on satisfying the needs of different types of customers
Commercial focus
Asset Management and Insurance 4%
Global Wh l l
Attributable profit in 2012(by business area)
78% Retail
Top World Banks: Loan/Assets (%)Top World Banks: Loan/Assets (%)
70
Commercial Banking
74%
and Insurance 4% Wholesale Banking22%
60
50
40
30
ank
1
AN ank
3
ank
4
ank
5
ank
6
ank
7
ank
8
ank
9
nk 1
0
nk 1
1
nkn1
3
ank
2
nk 1
2
nk 1
4
20
10
0
The international bank with the most branches: 14 392B
a SA Ba
Ba
Ba
Ba
Ba
Ba
Ba
Ban
Ban
BanBa
Ban
Ban
Source: Bank data
14,392
10
With a differential structure of self-standing subsidiaries
Internationalization through subsidiaries that are autonomous in capital and liquidity
Subsidiary model
They are subject to local legislation and regulation
They are supervised byThe Group’s subsidiaries
are local banks to all intents and purposes:
They are supervised by local authorities
Their deposits are guaranteed by local guarantee funds
There is no transfer of deposits or capital between Group units
11
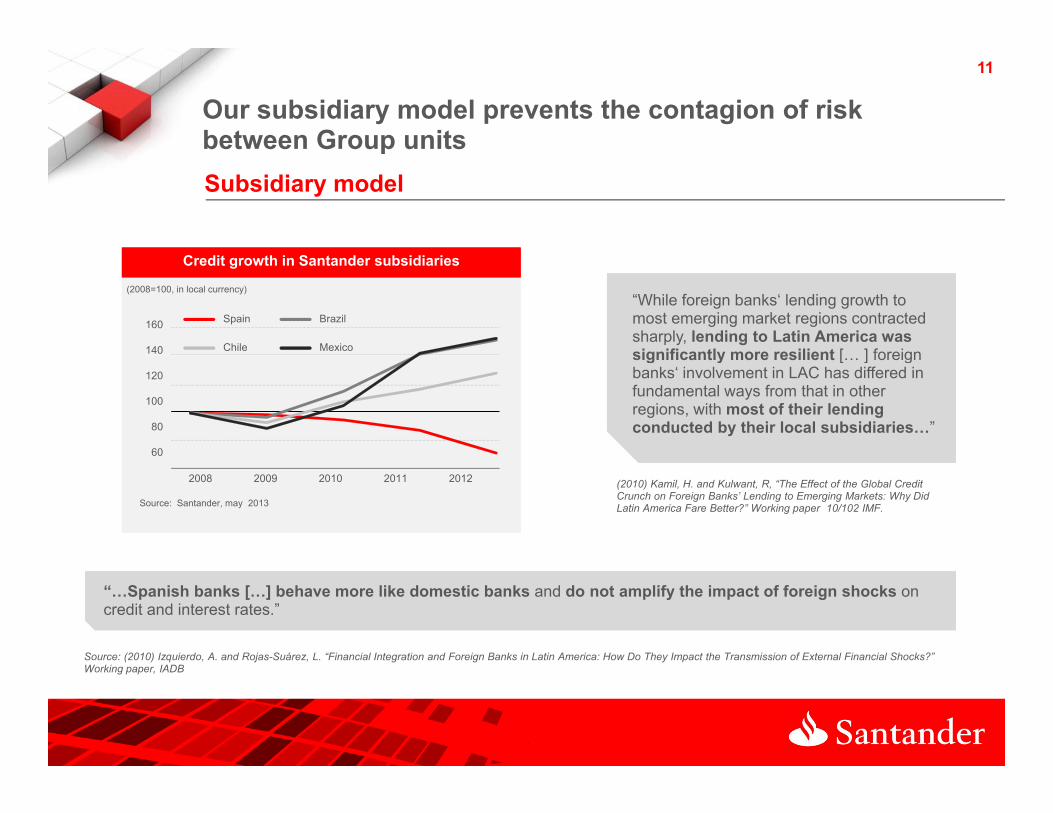
Our subsidiary model prevents the contagion of risk between Group unitspSubsidiary model
“While foreign banks‘ lending growth to most emerging market regions contracted sharply, lending to Latin America was significantly more resilient [ ] foreign(as a % of GDP)
Credit growth in Santander subsidiaries Credit growth in Santander subsidiaries
160
140
(2008=100, in local currency)
Spain Brazil
Chile Mexico significantly more resilient [… ] foreign banks‘ involvement in LAC has differed in fundamental ways from that in other regions, with most of their lending conducted by their local subsidiaries…”
120
100
80
60
(2010) Kamil, H. and Kulwant, R, “The Effect of the Global Credit Crunch on Foreign Banks’ Lending to Emerging Markets: Why Did Latin America Fare Better?” Working paper 10/102 IMF.
2008 2009 2010 2011 2012
Source: Santander, may 2013
Source: (2010) Izquierdo, A. and Rojas-Suárez, L. “Financial Integration and Foreign Banks in Latin America: How Do They Impact the Transmission of External Financial Shocks?”
“…Spanish banks […] behave more like domestic banks and do not amplify the impact of foreign shocks on credit and interest rates.”
Working paper, IADB
12
Taking advantage of Group strengths
Subsidiary modelBenefit from the Group's corporate policies…
CorporateGovernance
Sharing bestpractices
Tecnologicalenvironment
Productdevelopment
Riskmanagement
Brand name
13
Results seem to back our model
Subsidiary model
Preserving the “local touch”
160180200
Banks: Top 75 in market capitalizationBanks: Top 75 in market capitalization
6080
100120140160
IPOs:
Brazil (2009) Chile (2011) México (2012)
IPOs:
Brazil (2009) Chile (2011) México (2012)
Santander Mexico
Santander Brazil
Santander Group
0204060
ICBC
Wel
lsFa
rgo
HSB
Cct
ion
Bank
gan
Cha
seC
itiG
roup
nkof
Chi
naof
Amer
ica
nkof
Chi
naw
ealth
Bank
subi
shiU
FJst
pac
Bank
ofC
anad
aú
Uni
banc
od
NZ
Ban
kac
hsG
roup
Sber
bank
Sant
ande
rin
ion
Bank
tralia
Bank
NP
Parib
aso
Brad
esco
UBS
ova
Scot
iaoy
dsBa
nkS
Banc
orp
Barc
lays
tom
oM
itsu
ofSc
otla
ndC
harte
red
mun
icat
ions
ncia
lGro
upor
dea
Bank
BBVA
anSt
anle
yha
nts
Bank
sche
Bank
edit
Suis
seris
hBa
nks
ofM
ontre
alst
rialB
ank
PNC
Hon
gKo
ngo
doBr
asil
Nom
ura
DBS
Gro
upe
Gen
eral
eU
nicr
edit
Citi
cBa
nkSe
ngBa
nkD
evel
Bank
peria
lBan
ka
Sanp
aolo
nese
Bank
DFC
Bank
nkof
Indi
ade
lban
ken
Swed
bank
der(
Bras
il)ay
anBa
nkio
nalB
ank
entra
lAsi
aD
NB
ASA
Raj
hiBa
nkse
asBa
nknt
iBan
kasi
ICC
IBan
kdi
riPe
rser
odi
tAgr
icol
eka
Ensk
ilda
ank
Rak
yat
BB&T
Cor
pAk
bank
Sant
ande
rer
cial
Bank
México (2012)México (2012)
2 out of the 5 biggest
commercial banks
2 out of the 5 biggest
commercial banks
W
Chi
naC
onst
ruJP
Mor
g
Agric
ultu
ralB
anBa
nk Ban
Com
mon
wM
itsW
eR
oyal
Bank Ita
úAu
stra
liaan
dG
oldm
anSa
Banc
oTo
ront
oD
omN
atio
nalA
ust
BNBa
nco
Bank
ofN Ll U
Sum
iR
oyal
Bank
oSt
anda
rdBa
nkof
Com
mM
izuh
oFi
nan
No
Mor
gaC
hina
Mer
chD
eut
Cre
Allie
dI
Bank
oIn
du
BOC
HBa
nco D
Soci
ete
Chi
naH
ang
SSh
anga
iPud
ong
DC
anad
ian
ImIn
tesa
Ove
rsea
Chi
n HSt
ate
BaSv
ensk
aH
an
Banc
oSa
ntan
dM
ala
Qat
arN
atBa
nkC
e
AlR
Uni
ted
Ove
rTu
rkiy
eG
aran
Bank
Man
dC
red
Skan
dina
visk Ba B
Gru
poFi
nSi
amC
omm
e
Source: Bloomberg, May 2013
of the regionof the region
15
Due to its Geographical Diversification (II) …With significant shares in 10 main markets (data as of 12/31/2012)With significant shares in 10 main markets (data as of 12/31/2012)
Share5: 12%Branches: 1,189Customers: 26.2 mln
UK 4UK 4
Share1: 10%Branches: 3,788Customers: 27 3 mln
BrazilBrazilBranches: 722Customers: 1.7 mln
USA Sovereign
Share1: 14%Branches: 1,170
MexicoMexico
Customers: 27.3 mln
Share3: 14%Branches: 296Customers: 6 5 mln
GermanyGermany
Share1: 9%
ArgentinaArgentina
Portugal4Portugal4Sh 1 19%
ChileChile
,Customers: 10.0 mln Customers: 6.5 mlnBranches: 370
Customers: 2.4 mln
Share: 9%
Poland 2, 4Poland 2, 4
Share1: 13%Branches: 4,683Customers: 15.0 mln
Spain4Spain4Share1: 10%Branches: 667Customers: 2.3 mln
Share1: 19%Branches: 504Customers: 3.5 mln
Branches: 1,062Customers: 5.8 mln
(1) Credits (2) Business total including Kredyt Bank (4) Includes Santander Consumer Finance business(2) Business total, including Kredyt Bank(3) Consumer term loans
(4) Includes Santander Consumer Finance business (5) Includes all mortgage loans, UPLs, and SMEs