45
Beach Energy Limited The road to future growth Euroz Conference, Rottnest Island 17 March 2010 1 Reg Nelson Managing Director

Beach Energy Limited
The road to future growth
Euroz Conference, Rottnest Island
17 March 2010
1
Reg Nelson
Managing Director

Disclaimer
• This presentation contains forward looking statements that are subject to risk factors
associated with oil, gas, geothermal and related businesses. It is believed that the
expectations reflected in these statements are reasonable but they may be affected by a
variety of variables and changes in underlying assumptions which could cause actual results or
trends to differ materially, including, but not limited to: price fluctuations, actual demand,
currency fluctuations, drilling and production results, reserve estimates, loss of market,
industry competition, environmental risks, physical risks, legislative, fiscal and regulatory
developments, economic and financial market conditions in various countries and regions,
political risks, project delays or advancements, approvals and cost estimates.
• All references to dollars, cents or $ in this presentation are to Australian currency, unless
otherwise stated. References to “Beach” may be references to Beach Energy Limited or its
applicable subsidiaries.
• Unless otherwise noted, all references to reserves and resources figures are as at 30 June
2009 and represent Beach‟s share.
Competent Persons Statement
• This presentation contains information on Beach‟s Reserves and Resources which have been
compiled by Mr Gordon Moseby, who is a full time employee of Beach, is qualified in
accordance with ASX listing rule 5.11 and has consented to the inclusion of this information in
the form and context in which it appears.
Compliance statements
2
Overview of Beach
Energy Limited
• Strategy
• Base business
• Growth potential
Positioning for long-
term growth
• What
• Where
• How
3
Today’s presentation

• 2P reserves of 66 MMboe
• Sustainable long-term oil and gas production
• FY 2010 production guidance of 8.0 MMboe
• $118 million cash and zero debt*
4
Beach Energy Limited (ASX : BPT): A compelling value proposition
* as at 31 Dec 2009
• Huge Cooper Basin shale gas resource potential
• High potential East African rift oil exploration acreage
• LNG supply potential from existing portfolio
• Track record of value creation
• Highly competent team
• Quality joint venture and strategic relationships
Strong base
business
‘Game changing’
long-term growth
potential
The right
people and
relationships

Corporate framework
5
• Consistent, targeted growth:
– Long-term cash flow, production and reserves
– Value driven investments
• Thinking ahead of the pack:
– Early entry, low risk, high return
– Participation in emerging technologies and opportunities
• Balanced portfolio:
– 60:30:10 risk profile
• Conservative and flexible balance sheet
• Invest in affordable low pollutant energy
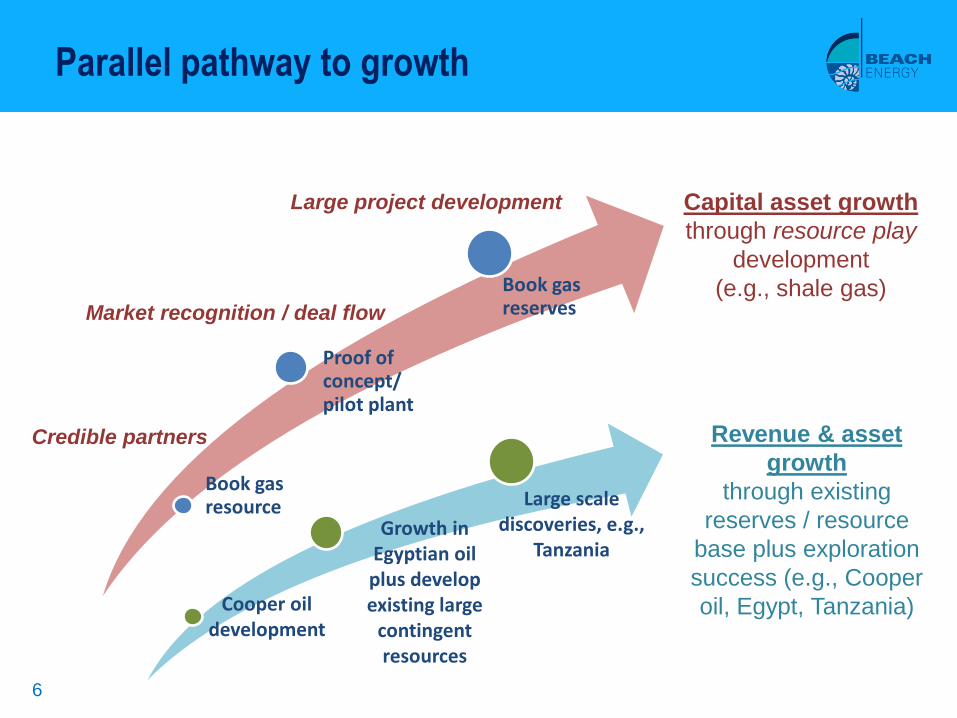
Parallel pathway to growth
6
Capital asset growth
through resource play
development
(e.g., shale gas)
Revenue & asset
growth
through existing
reserves / resource
base plus exploration
success (e.g., Cooper
oil, Egypt, Tanzania)
Book gas resource
Proof of concept/ pilot plant
Book gas reserves
Credible partners
Market recognition / deal flow
Large project development
Cooper oil development
Growth in Egyptian oil plus develop existing large
contingent resources
Large scale discoveries, e.g.,
Tanzania

Next two to five years
7
Exploration Growth
Oil & gas discoveries in Cooper with aim to add up to
20 MMboe new reserves
Develop opportunities in Egypt with aim to add up to 30+ MMbbl of new reserves
Drill high value targets, e.g., Barque prospect in New
Zealand, PNG targeting 100+ MMboe potential
Development Growth
Develop large contingent conventional gas resource of
approx. 500 PJ already booked in Cooper & elsewhere
Acquire producing or near producing assets suited to
Beach’s skills with a focus on upside potential
Assess and quantify large shale gas resource in Cooper Basin
Aim:Double
production &
reserves &
access high
value markets
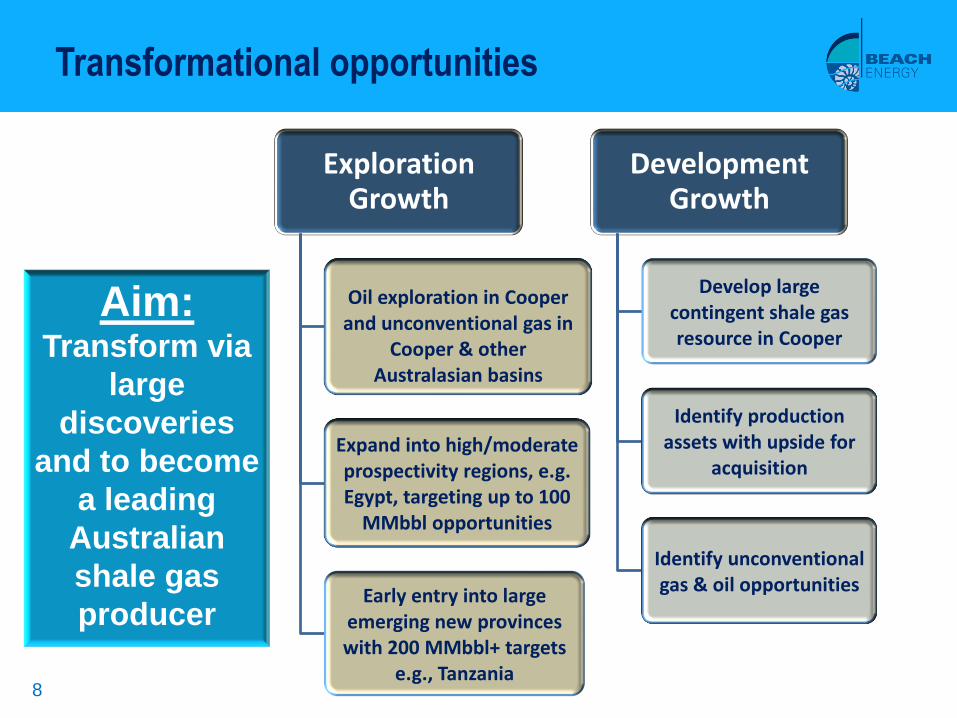
Transformational opportunities
8
Exploration Growth
Oil exploration in Cooper and unconventional gas in
Cooper & other Australasian basins
Expand into high/moderate prospectivity regions, e.g. Egypt, targeting up to 100
MMbbl opportunities
Early entry into large emerging new provinces with 200 MMbbl+ targets
e.g., Tanzania
Development Growth
Develop large contingent shale gas resource in Cooper
Identify production assets with upside for
acquisition
Identify unconventional gas & oil opportunities
Aim:Transform via
large
discoveries
and to become
a leading
Australian
shale gas
producer
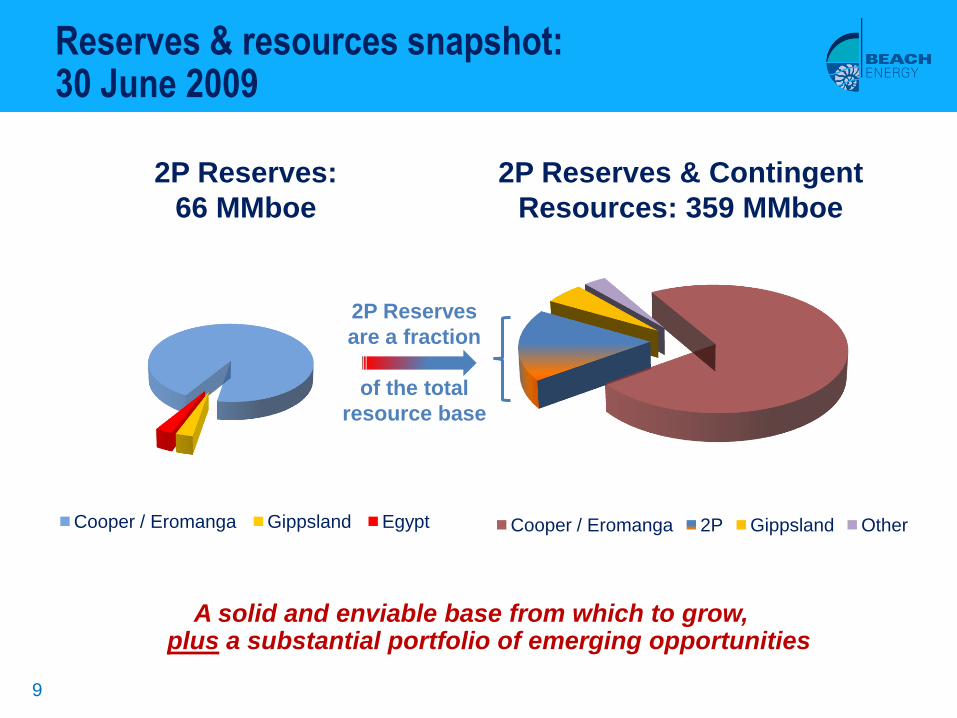
Cooper / Eromanga Gippsland Egypt
Reserves & resources snapshot: 30 June 2009
9
A solid and enviable base from which to grow,plus a substantial portfolio of emerging opportunities
2P Reserves:
66 MMboe
2P Reserves & Contingent
Resources: 359 MMboe
Cooper / Eromanga 2P Gippsland Other
2P Reserves
are a fraction
of the total
resource base

Reserves and production
10
0
1
2
3
4
5
6
7
8
9
10
FY 2007 FY2008 FY 2009 FY 2010 est.
Gas & Gas Liquids Oil
0
20
40
60
80
100
120
140
160
FY 2006 FY2007 FY 2008 FY 2009
Gas & Gas Liquids Oil
2P ReservesProduction
• Consistent production performance:
– Oil represents 38% of est. FY 2010
production (34%, FY 2009)
• Solid reserves growth in recent years:
– Offset by Tipton West gas divestment in
FY 2009
MM
bo
e
MM
bo
e

Overview of financial position
11
HY09 FY09
Net cash on hand $118 million $136 million
Production volume 4.0 MMboe 9.6 MMboe
Sales revenue $259 million $581 million
Cash flow from operations $22 million $173 million
Net profit after tax $34 million $260 million
Underlying net profit $26 million $64 million
Interim dividend declared 0.75 cents / share 3.75 cents / share
Underlying earnings per share 2.41 cents / share 6.21 cents / share
HY09 - a steady result with our eye on the future

• Cooper Basin is a key supplier
of onshore oil and gas to
eastern Australian markets:
– Diversified asset, product and
market mix
• Beach participates in
approximately 300 exploration
and production licenses:
– Equity interests range from
approximately 17% to 100%
• Numerous exploration and
development opportunities
The ‘base business’: Cooper Basin production, development & exploration
12

Cooper Basin Oil
2P reserves 14.3 MMbbl
• Comprised of three key areas:
– Western flank (Beach operated)
– Central Cooper Basin (Santos
operated)
– Eastern flank (Beach operated)
• Successful development of the
Beach operated western flank:
– Beach discovered approximately
10 MMbbl over the past 8 years
• Beach operated six well drilling
campaign planned for 2010
The ‘base business’: Conventional Cooper Basin oil & gas
13
Cooper Basin Gas
2P reserves 228 PJ & 7.4 MMboe
• Gas & ethane contracts with major
retailers and end consumers
• Domestic and export LPG contracts
• Export naptha contracts
• Quality joint venture partners in
Santos and Origin Energy
• Drilling program planned to convert
500 PJ (gross) of conventional gas
resources into 2P reserves

14
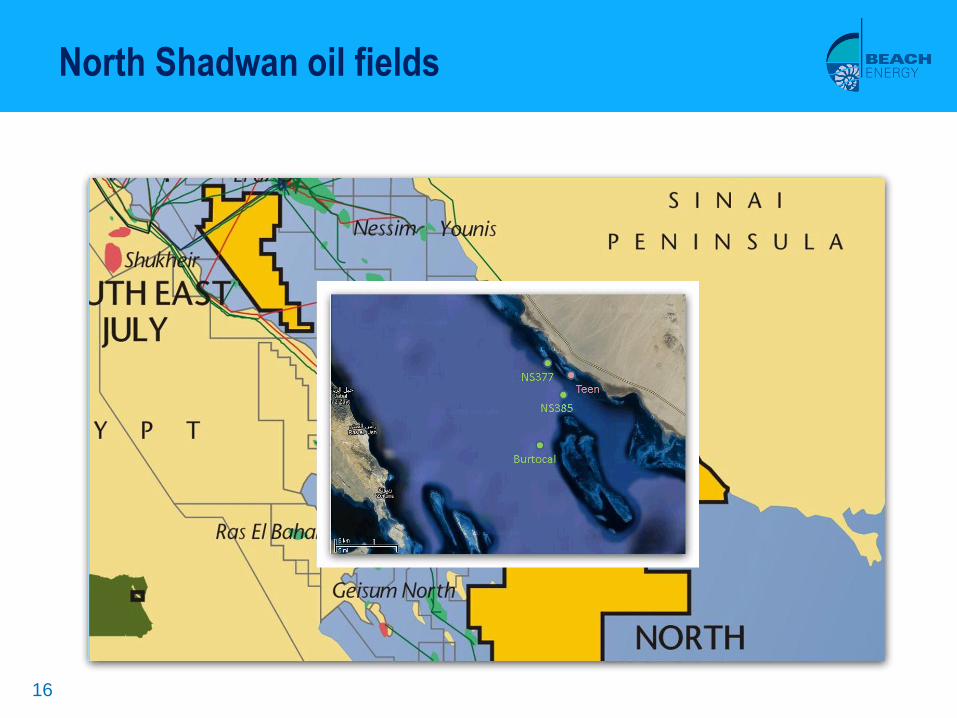
The ‘base business’ - Gulf of Suez: First oil within months
• Beach 20% interest
• High potential Gulf of Suez
acreage
• Three existing oil
discoveries:
– NS 377 and 385
(„near shore fields‟)
– NS 394 „Burtocal‟
• First oil expected Q3 2010
from near shore fields
• Seeking new opportunities
to expand growth

15
Gulf of Suez oil fields
15
16
North Shadwan oil fields

17
North Shadwan:Near shore fields conceptual development
GH-377 Field
GH-385 Field
To Ghara Facilities
2 wells to be drilled
from onshore
4 wells to be drilled
from onshore

18
Finding more oil in Egypt
• Highly prospective region
• Long established industry -
favourable legislative & fiscal
regime
• Home to giant oil fields (500 -
800 MMbbl) such as Morgan,
July & Ramadan
• Extensive infrastructure
• Low cost
• Large opportunity deal flow
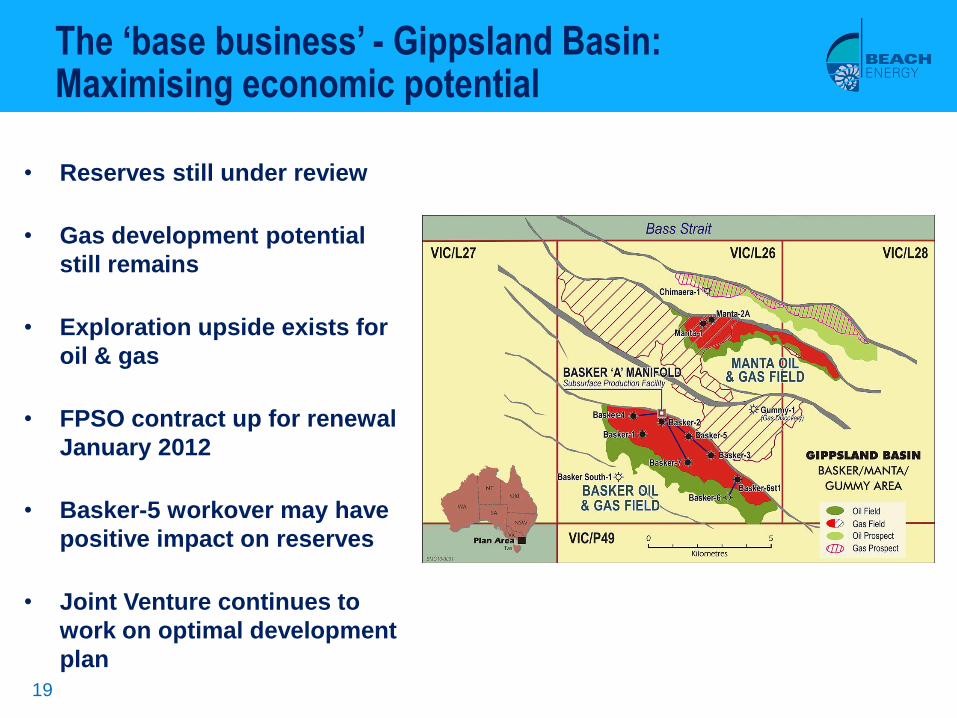
• Reserves still under review
• Gas development potential
still remains
• Exploration upside exists for
oil & gas
• FPSO contract up for renewal
January 2012
• Basker-5 workover may have
positive impact on reserves
• Joint Venture continues to
work on optimal development
plan
19
The ‘base business’ - Gippsland Basin:Maximising economic potential

• Beach is seeking to grow its
base gas business in eastern
Australian markets from the
Cooper Basin
• Good long-term growth
opportunities for eastern
Australian gas resources:
– Strong projected domestic and
export demand
– Carbon policies
• Cooper Basin shale gas is a
‘sleeper’ in the options for long-
term domestic and export gas
supply
Expanding the base business:Positioning for long-term Australian gas supply
20

• Early identification of Cooper
Basin shale gas potential
• Captured prospective acreage
with high equity participation
• Huge resource potential:
– Comparable to combined NSW
and Queensland coal seam gas
volume
• Access to multiple market
opportunities via existing
and future infrastructure
• Developing key relationships
to deliver technologies and
new markets
Cooper Basin:Significant shale gas potential
21
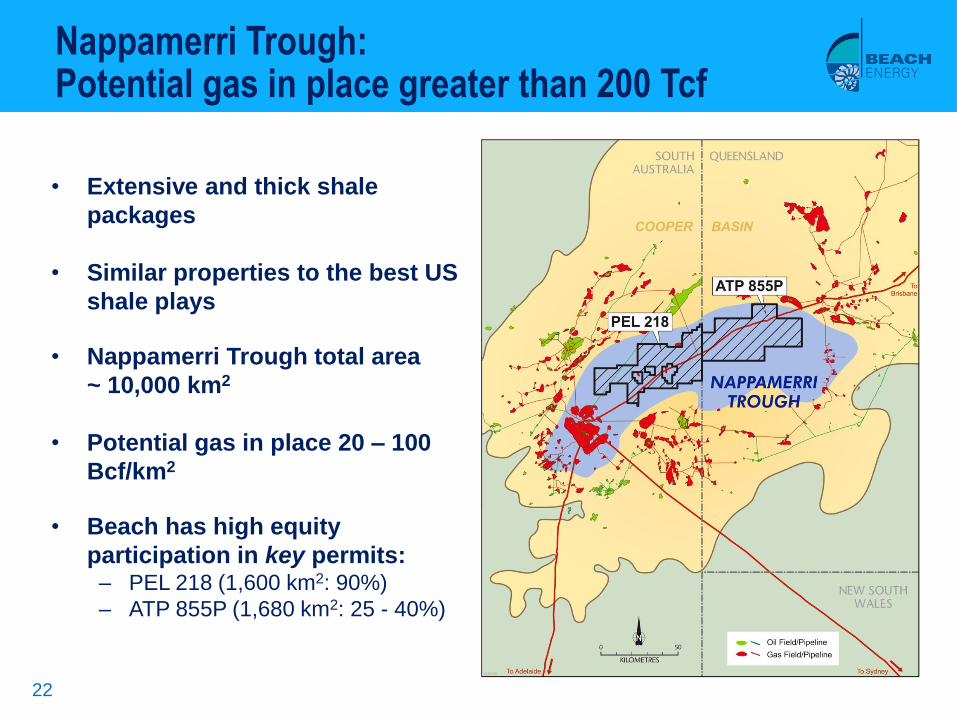
Nappamerri Trough: Potential gas in place greater than 200 Tcf
• Extensive and thick shale
packages
• Similar properties to the best US
shale plays
• Nappamerri Trough total area
~ 10,000 km2
• Potential gas in place 20 – 100
Bcf/km2
• Beach has high equity
participation in key permits:– PEL 218 (1,600 km2: 90%)
– ATP 855P (1,680 km2: 25 - 40%)
22
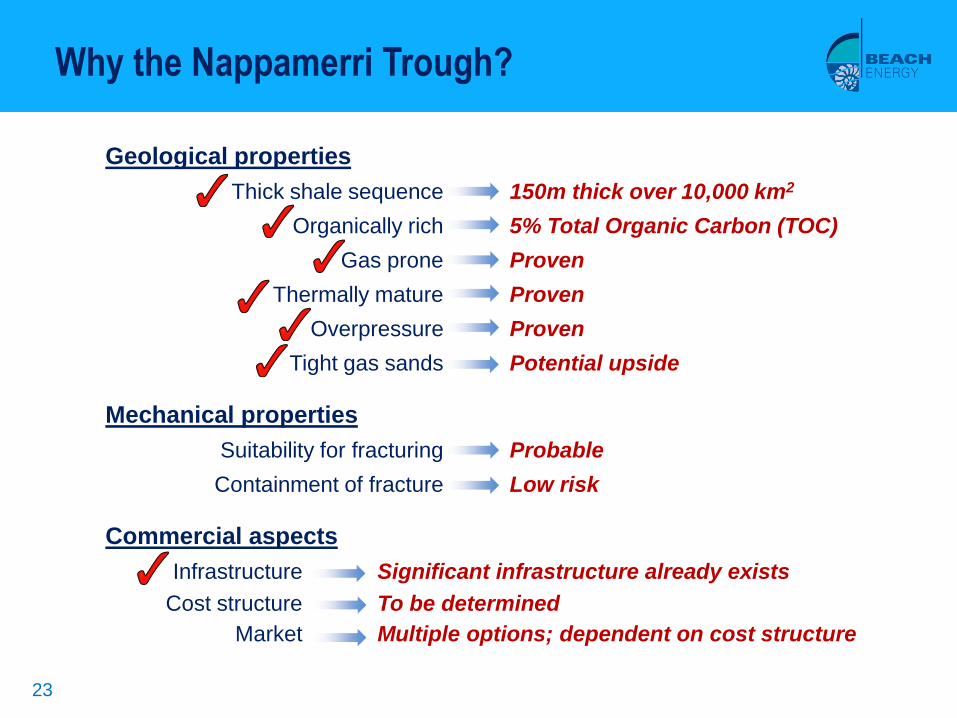
Geological properties
Thick shale sequence 150m thick over 10,000 km2
Organically rich 5% Total Organic Carbon (TOC)
Gas prone Proven
Thermally mature Proven
Overpressure Proven
Tight gas sands Potential upside
Mechanical properties
Suitability for fracturing Probable
Containment of fracture Low risk
Commercial aspects
Infrastructure Significant infrastructure already exists
Cost structure To be determined
Market Multiple options; dependent on cost structure
Why the Nappamerri Trough?
23
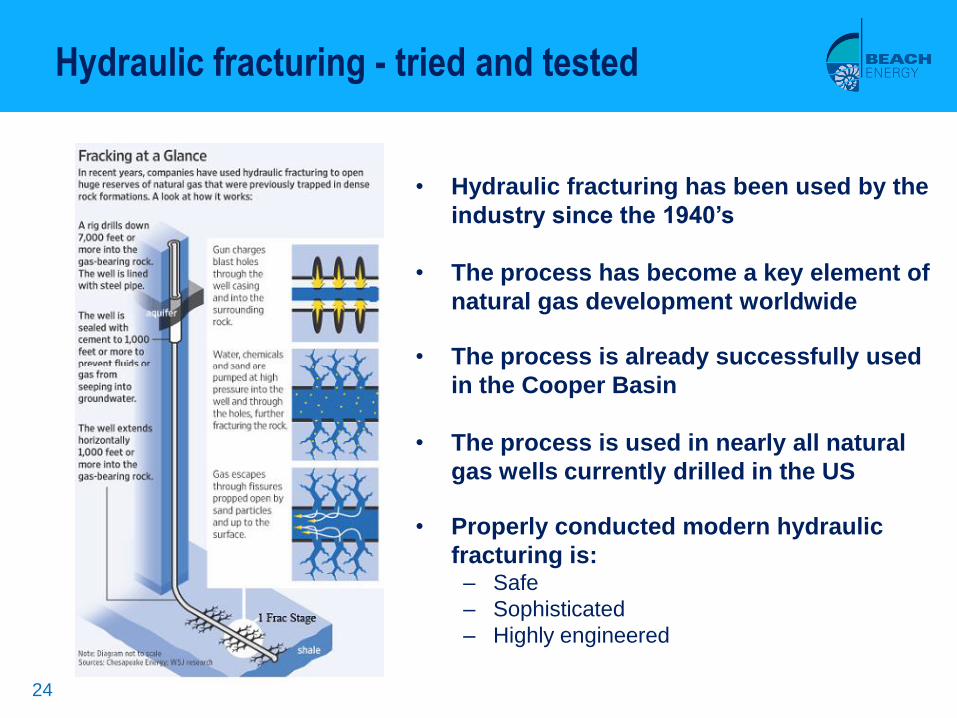
Hydraulic fracturing - tried and tested
24
• Hydraulic fracturing has been used by the
industry since the 1940’s
• The process has become a key element of
natural gas development worldwide
• The process is already successfully used
in the Cooper Basin
• The process is used in nearly all natural
gas wells currently drilled in the US
• Properly conducted modern hydraulic
fracturing is:– Safe
– Sophisticated
– Highly engineered

Cooper Basin shale gas:Indicative shale gas development timeline
25
Holdfast-1 vertical
exploration well
Q3 2010
Design pilot production
well Q2
Q4 2010/
Q1 2011
BOOK GAS RESOURCE
Q2 2011
Pilot production
well
Drill Q2 2011
Frac Q4 2011
Test Q1 2012
Pilot development
Commence FY13
BOOK GAS
RESERVE
Target FY13/14
FIRST GAS SALES
Target FY15
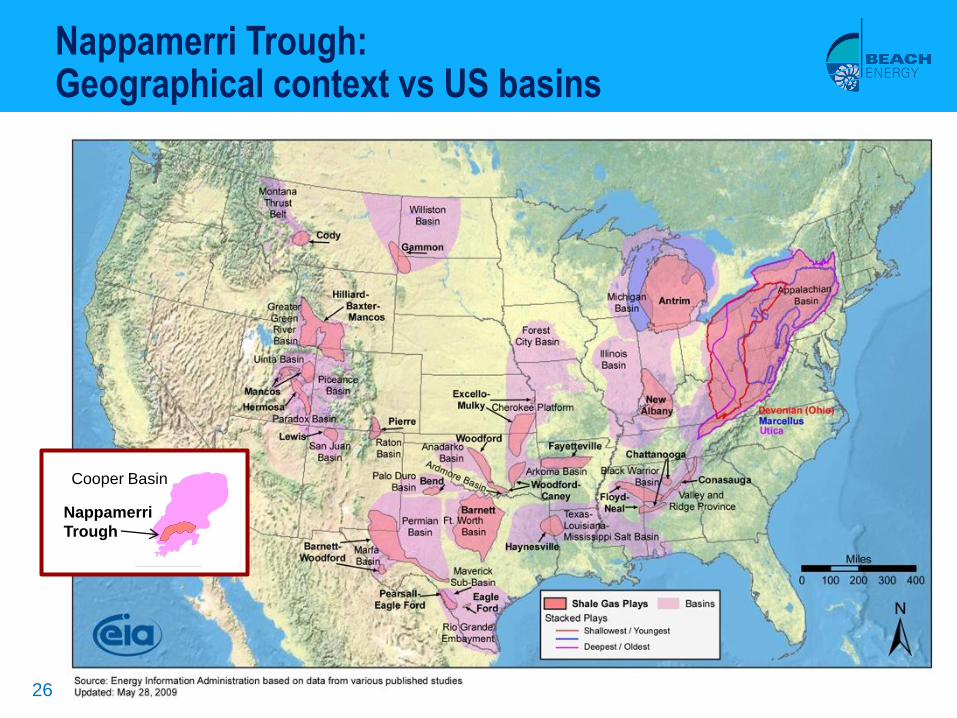
Nappamerri Trough: Geographical context vs US basins
26
Cooper Basin
Nappamerri
Trough

0
5
10
15
20
25
30
35
40
2006 2007 2008 2009
No. of frac stages/well
F&D cost (US$/bbl)
27
US technology improvements drive down costs: e.g. - Bakken Shale
• Technology advancements in
multi – stage frac completions
is driving efficiencies in US oil
& gas developments
• Key advancements are
particularly associated with
long lateral drilling + multi-
stage fracs
• Advances in technology is
delivering:– Increased reserves & production
– Lower finding & development
costs
• Australian shale projects can
benefit from the US experience
& learning gained by others
Bakken Shale (oil), North Dakota
Source: Sundance Energy
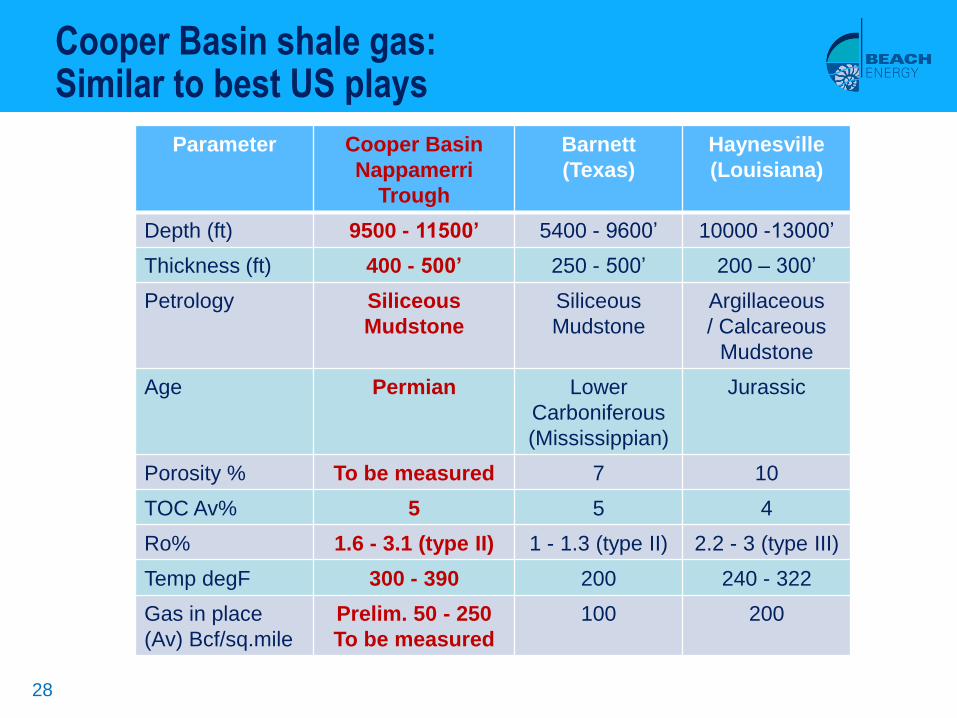
Cooper Basin shale gas:Similar to best US plays
28
Parameter Cooper Basin
Nappamerri
Trough
Barnett
(Texas)
Haynesville
(Louisiana)
Depth (ft) 9500 - 11500’ 5400 - 9600‟ 10000 -13000‟
Thickness (ft) 400 - 500’ 250 - 500‟ 200 – 300‟
Petrology Siliceous
Mudstone
Siliceous
Mudstone
Argillaceous
/ Calcareous
Mudstone
Age Permian Lower
Carboniferous
(Mississippian)
Jurassic
Porosity % To be measured 7 10
TOC Av% 5 5 4
Ro% 1.6 - 3.1 (type II) 1 - 1.3 (type II) 2.2 - 3 (type III)
Temp degF 300 - 390 200 240 - 322
Gas in place
(Av) Bcf/sq.mile
Prelim. 50 - 250
To be measured
100 200

Multiple long-term shale gas market options
Market opportunities
Existing customers –
extension contracts
Existing customers –incremental
contracts
New domestic
customers
Gas Swaps
Mature existing MOUs
Export LNG
• Good prospects to increase
Cooper Basin supply over time
• New domestic gas supply
opportunities include:
– Power generation
– Feedstock
– Liquid fuels
• LNG supply a long-term
objective
• Holdfast-1 shale gas exploration
well to be drilled Q3 2010
• Targeting first Beach-operated
shale gas sales in FY 2015
29

• Australian unconventional gas M&A activity has been mainly associated
with Queensland coal seam methane (CSM):
– Approximately $20 billion worth of recent CSM deals
– Purchasers include BG Group, ConocoPhillips, Shell and PETRONAS
• Australian unconventional gas M&A activity has lagged overseas ‘action’
whilst the industry was developing technology, resources and markets
When will Cooper Basin shale gas value recognition occur?
30
Deal Location Date Value
Mitsui - Anadarko Marcellus Feb 10 US$1.4b
Total - Chesapeake Barnett Jan 10 US$2.25b
ExxonMobil – XTO Energy Included 1 million
acres of various
shale gas acreage
Dec 09 US$41b
BG Group – EXCO Resources Haynesville Aug 09 US$1.1b
Some recent US shale gas transactions
31
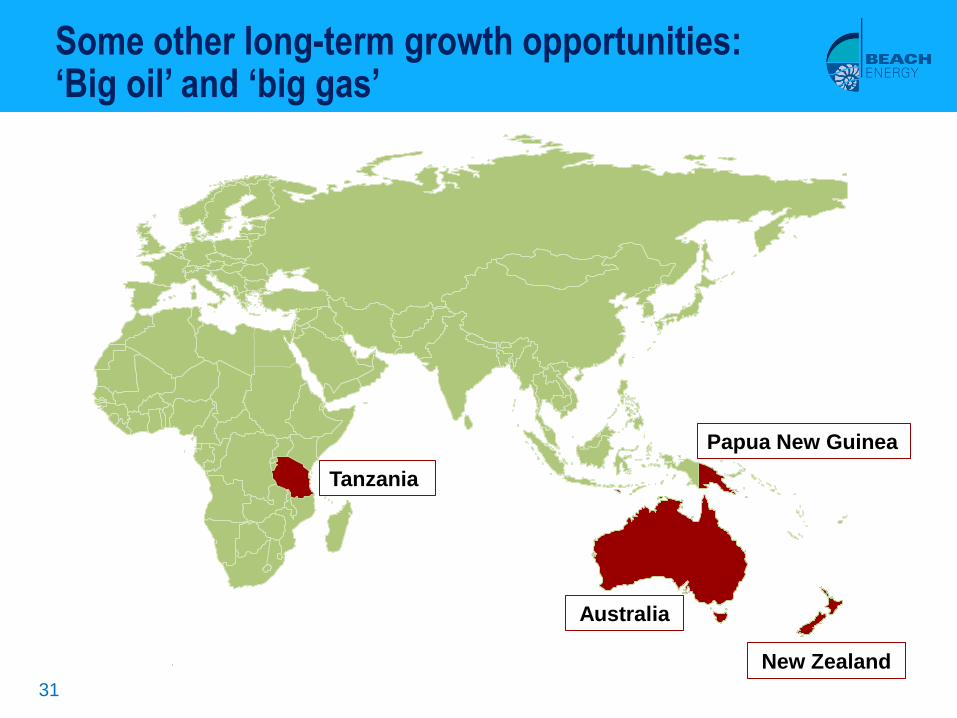
Some other long-term growth opportunities: ‘Big oil’ and ‘big gas’
Tanzania
Papua New Guinea
Australia
New Zealand
32
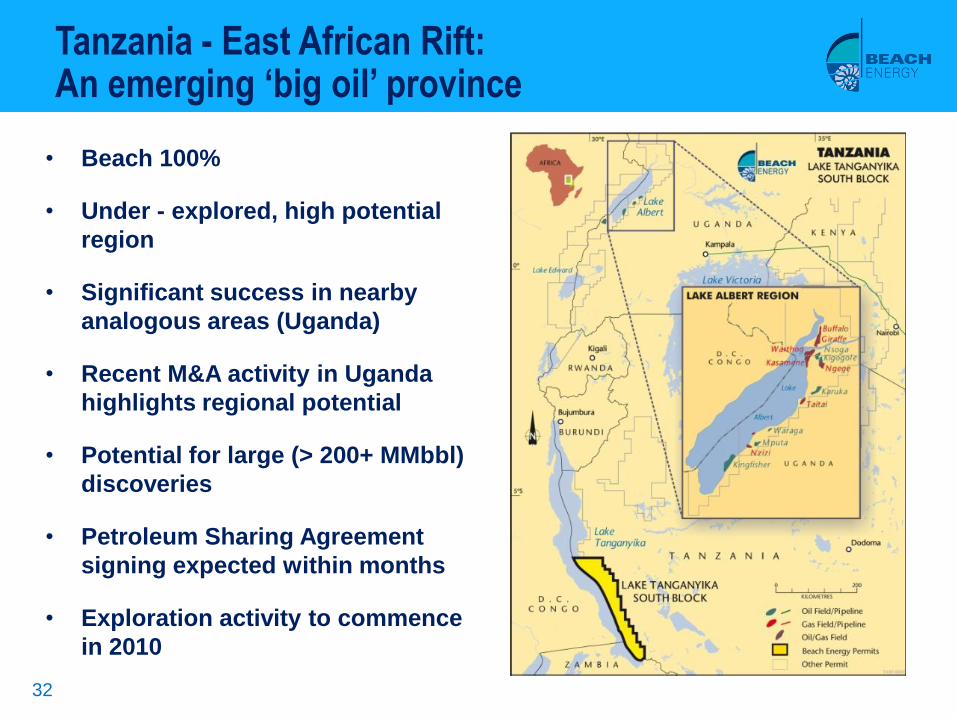
Tanzania - East African Rift:An emerging ‘big oil’ province
• Beach 100%
• Under - explored, high potential
region
• Significant success in nearby
analogous areas (Uganda)
• Recent M&A activity in Uganda
highlights regional potential
• Potential for large (> 200+ MMbbl)
discoveries
• Petroleum Sharing Agreement
signing expected within months
• Exploration activity to commence
in 2010

33
Two rift systems of comparable size –And potential?
Note: Maps depicted at approximate scale Source: Google
Gulf of Suez Lake Tanganyika

Offshore ‘big gas’ opportunities
• LNG supply potential from existing portfolio:
– Burnside (multi-Tcf discovery made in 2009, Beach 7.34%)
– Pandora (mean gas resource approx. 0.8 Tcf, Beach 6.36%)
– Barque gas prospect (multi-Tcf potential, Beach 20%)
Browse Basin Gulf of Papua Canterbury Basin
34
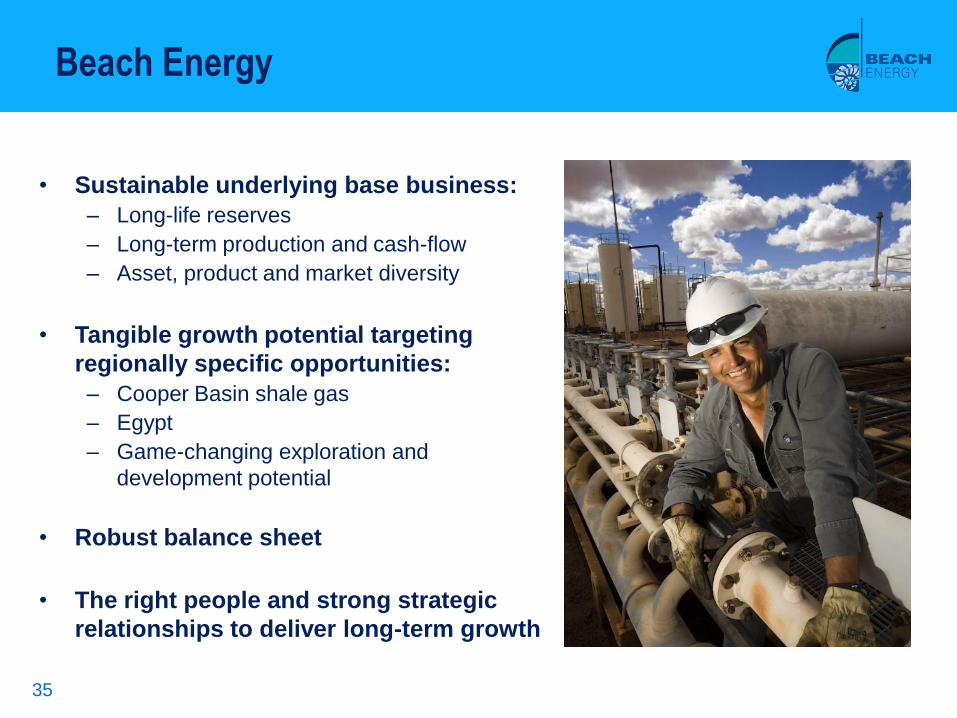
• Sustainable underlying base business:
– Long-life reserves
– Long-term production and cash-flow
– Asset, product and market diversity
• Tangible growth potential targeting
regionally specific opportunities:
– Cooper Basin shale gas
– Egypt
– Game-changing exploration and
development potential
• Robust balance sheet
• The right people and strong strategic
relationships to deliver long-term growth
Beach Energy
35

Reference Slides
36

Aim: To double production and reserves within 2 - 5 years
Corporate strategy
37
Risk / Reward Timeframe: 2 – 5 years Timeframe: 5 – 10 years
Low
(60%)
• Add up to 20 MMboe new reserves via
exploration
• Develop contingent Cooper conventional
gas resource of approx. 500 PJ
• Continue Cooper exploration for oil and
unconventional gas
• Develop contingent shale gas resource
in Cooper
Moderate
(30%)
• Add up to 30 MMbbl+ of new reserves in
Egypt
• Acquire assets suited to Beach‟s skills
with upside potential
• Expand into other regions targeting up
to 100 MMboe opportunities
• Acquire assets suited to Beach‟s skills
with upside potential
High
(10%)
• Mature Cooper shale gas opportunity
• Drill high value exploration and appraisal
targets
• Early entry into emerging new
provinces with 200 MMbbl+ targets
• Drill high value exploration and
appraisal targets
Low carbon /
value adding
• Continue to build value / new markets through downstream alliances
• Pursue clean fuel and commodity markets
• Pursue low carbon energy opportunities, e.g., biodiesel, geothermal, carbon
sequestration
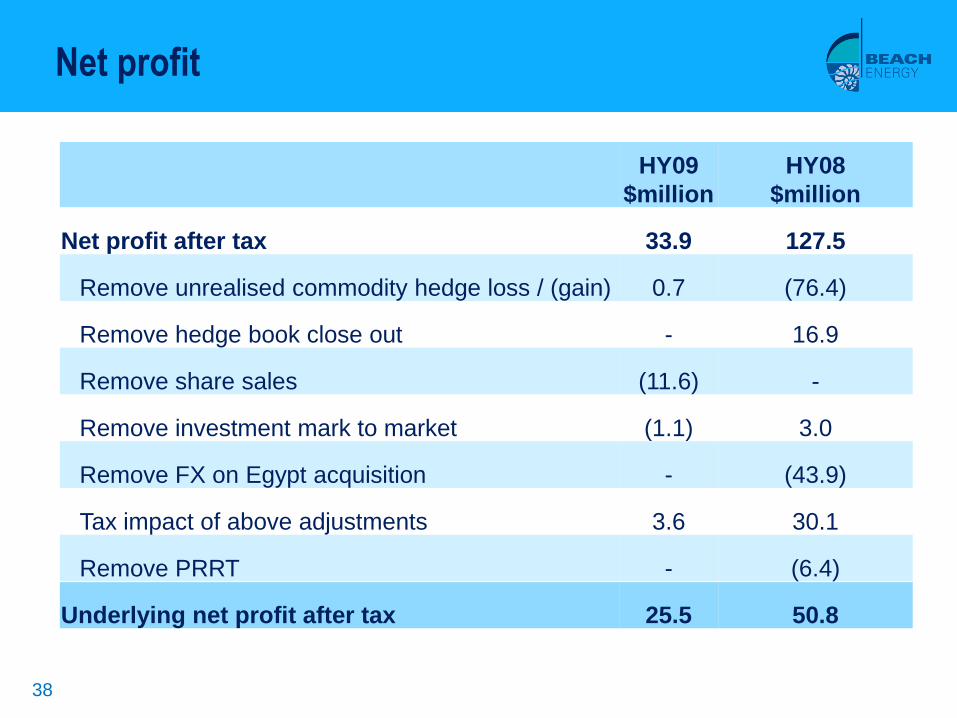
Net profit
38
HY09
$million
HY08
$million
Net profit after tax 33.9 127.5
Remove unrealised commodity hedge loss / (gain) 0.7 (76.4)
Remove hedge book close out - 16.9
Remove share sales (11.6) -
Remove investment mark to market (1.1) 3.0
Remove FX on Egypt acquisition - (43.9)
Tax impact of above adjustments 3.6 30.1
Remove PRRT - (6.4)
Underlying net profit after tax 25.5 50.8

Net profit
39
HY08
Tax
Borrowing expense Other expenses
and revenue
Gross profit
HY09
$50.8
$19.3
$8.3
$25.5
$13.7
$39.2
0
10
20
30
40
50
60
70
80
90
$m
Underlying net profit after tax comparison
$25.3 million
total decrease

40
Gross profit
HY08
Depreciation
Cash production
costs
Inventory3rd party
purchases
Sales revenue
HY09
$84.1
$23.7
$15.6
$7.8
$44.9
$11.8
$74.5
0
20
40
60
80
100
120
140
$m
Gross profit comparison
$39.2 million
total decrease
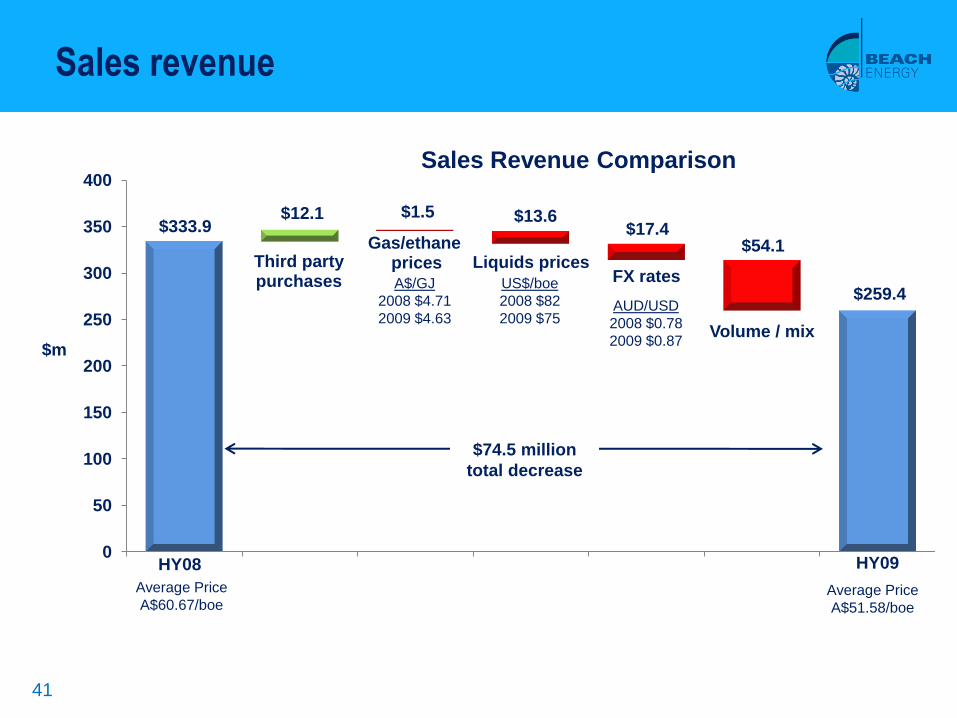
Sales revenue
41
HY08
Third party purchases
Gas/ethaneprices Liquids prices
FX rates
Volume / mix
HY09
$333.9 $12.1
$259.4
$1.5 $13.6 $17.4
$54.1
0
50
100
150
200
250
300
350
400
$m
Sales Revenue Comparison
AUD/USD
2008 $0.78
2009 $0.87
A$/GJ
2008 $4.71
2009 $4.63
US$/boe
2008 $82
2009 $75
Average Price
A$60.67/boeAverage Price
A$51.58/boe
$74.5 million
total decrease

Sales revenue
42
• Sales revenue $259 million –
down 22%:
– Lower oil price
– Lower BMG production
– Sale of Tipton West
– Softer demand from gas customers
• HY09 average gas price
$4.63/GJ – down 2%
• HY09 average oil price
$86/bbl – down 20%
-
20
40
60
80
100
120
2005/06 2006/07 2007/08 2008/09 2009/10 (H)
A$/bbl
Oil Price
Actual Average ($92/bbl)
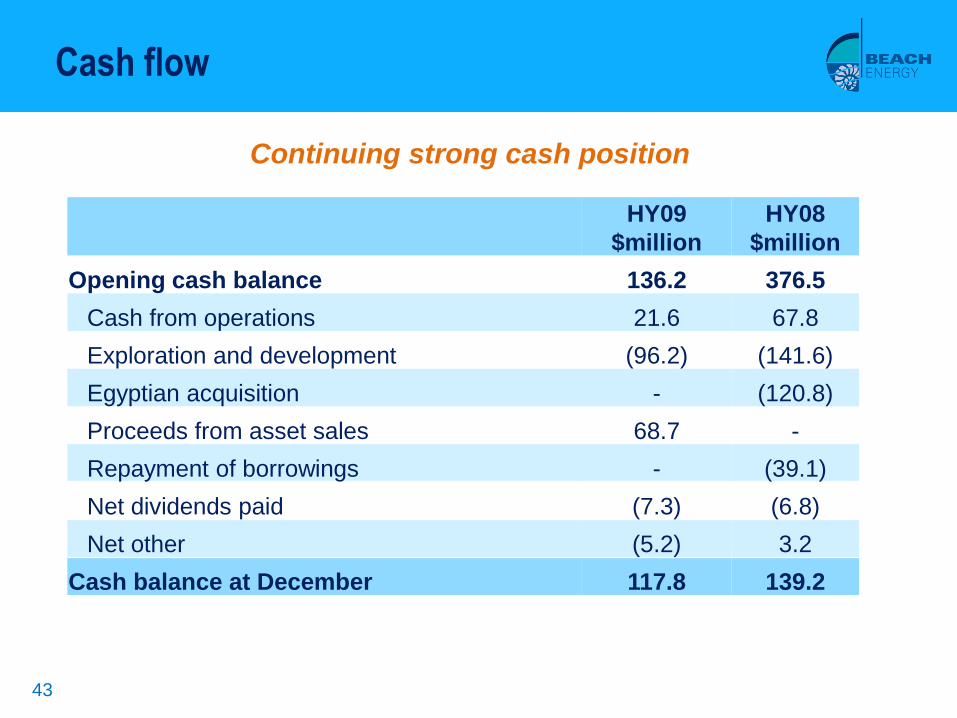
Cash flow
43
HY09
$million
HY08
$million
Opening cash balance 136.2 376.5
Cash from operations 21.6 67.8
Exploration and development (96.2) (141.6)
Egyptian acquisition - (120.8)
Proceeds from asset sales 68.7 -
Repayment of borrowings - (39.1)
Net dividends paid (7.3) (6.8)
Net other (5.2) 3.2
Cash balance at December 117.8 139.2
Continuing strong cash position

Current financial risk management
44
Oil Price
Period
Floor
US$80/bbl
TAPIS
Floor
US$55/bbl
WTI
Total Hedged
Volume
(bbls)
FY 2010 300,000 - 300,000
FY 2011 - 300,000 300,000
Total Hedged 300,000 300,000 600,000
• US$108 million (A$120.0
million) in foreign exchange
hedged
• Aim to hedge 50% of net USD
exposure
Currency
Period
Collars &
Ceilings
$A million
Collars &
Ceilings
$US million
FY 2010 $40.0 $36.0
FY 2011 $80.0 $72.0
Total Hedged $120.0 $108.0
• Uncomplicated oil price floors to limit downside commodity price risk
• 25% of oil production currently hedged

45


