Faculty of Science and Technology MASTER’S THESIS Study program/ Specialization: Offshore Technology / Industrial Asset Management Spring semester, 2012 Open / Restricted access Writer: Nii Nortey B. C. Lokko ………………………………………… (W riter’s signature) Faculty supervisor: Prof. Jayantha P. Liyanage, PhD External supervisor(s): Jawad Raza, PhD Title of thesis: The Role and Use of Expert systems for Offshore Assets on the Norwegian Continental Shelf: Status quo and value creating measures Credits (ECTS): 30 Key words: Expert Systems, Integrated Operations, Asset Management, Maintenance, Knowledge- Based Systems, Oil and Gas, Technical Integrity, Reliability, Availability, Value Creation Pages: ………100… + enclosure: ………… Stavanger, …14 June 2012…….. Date/year
Transcript
Faculty of Science and Technology
MASTER’S THESIS
Study program/ Specialization:
Offshore Technology / Industrial Asset
Management
Spring semester, 2012
Open / Restricted access
Writer: Nii Nortey B. C. Lokko
………………………………………… (Writer’s signature)
Faculty supervisor: Prof. Jayantha P. Liyanage, PhD
External supervisor(s): Jawad Raza, PhD
Title of thesis:
The Role and Use of Expert systems for Offshore Assets on the Norwegian Continental
Shelf: Status quo and value creating measures
Credits (ECTS): 30
Key words:
Expert Systems, Integrated Operations, Asset
Management, Maintenance, Knowledge-
Based Systems, Oil and Gas, Technical
Integrity, Reliability, Availability, Value
Creation
Pages: ………100…
+ enclosure: …………
Stavanger, …14 June 2012……..
Date/year
Nii Nortey B.C. Lokko Page ii 6/14/2012
Nii Nortey B.C. Lokko Page iii 6/14/2012
The Role and Use of Expert systems for Offshore Assets on the Norwegian
Continental Shelf: Status quo and value creating measures
by
Nii Nortey Basil Clarence Lokko
A Thesis Presented to the Faculty of Science and Technology
of University of Stavanger in Fulfillment of the Requirements for the Degree of
The ultimate goal of collaborative operating environments is value creation. All over the world, Expert Systems (ES) are being employed by various industrial sectors to foster this value creation process. Subsequently, what this project sought to do was to examine the current role and use of expert systems for value creation in the Norwegian offshore oil and gas industry through asset management, and more specifically maintenance. Through literature reviews and vendor surveys, we were able to establish that the Norwegian industry closely mimics the global O&G industry in its adoption and use of expert systems technology. This portion of the report also suggests that the lack of widespread adoption within maintenance is a contributory factor to the proliferation of preventive maintenance strategies on the Norwegian Continental Shelf. In the final analysis, we also highlight a possible relationship between the use of expert systems and value creation which we were able to observe through a questionnaire assessment of five maintenance support systems. With this report, we would like to initiate a process that would help solve the biggest challenge that hinders the adoption and use of expert systems, i.e. lack of knowledge and thorough understanding.
Nii Nortey B.C. Lokko Page vi 6/14/2012
Acknowledgements You would almost never come across a project that does not require team
effort. This report, though I present here as my master thesis, is the result of a unique collaboration between student, professor and industry professionals. Thus special acknowledgement goes:
To Jawad Raza, Kristian Helland and the entire Apply Sorco Asset Management team, I am most grateful for initially conceiving this project and lending their time, expertise and company resources to see this through to a successful completion.
To Prof. JP Liyanage, my academic supervisor, whom I (and this project) benefited immensely from advice and guidance, and quality checks resulting in this professional output. I was privileged to have been supervised by you.
To all the companies and industry professionals that I am unable to name due to confidentiality issues, I am grateful for the all your invaluable insights (without which this project would not have been so informative).
Also,
To Tore Markeset and the entire Centre for Industrial Asset Management (CIAM) group, I am grateful for all your input.
To all my colleagues of the 2012 Offshore Technology graduating class, who are too many for me to name individually, I am humbled to have studied and shared ideas with you all. A talented group of students you all are.
To my parents, sister and all the members of my huge family, I am ever so indebted to for their unwavering support and constant prayers.
And my personal thanks go to my girlfriend for constantly encouraging me and putting up with my idiosyncrasies.
1.1 Background .................................................................................................................... 1 1.2 Aim of the Thesis.......................................................................................................... 3 1.3 Objective of Work ........................................................................................................ 3 1.4 Limitations ..................................................................................................................... 4 1.5 Methodology .................................................................................................................. 4 1.6 Report Structure ............................................................................................................ 4
Chapter 2 THE NORWEGIAN CONTINENTAL SHELF (NCS) .................. 6
2.1 An Overview of the NCS ............................................................................................ 7 2.2 Making Experts of Non-Experts .............................................................................. 10
Chapter 3 EXPERT SYSTEMS .......................................................................... 13
3.1 What are Expert Systems? ......................................................................................... 13 3.2 How Do We Identify These Systems? ..................................................................... 16 3.3 Database Management Systems vs. Knowledge-based Expert Systems? ........... 18 3.4 Expert Systems Application ...................................................................................... 20 3.5 Global Oil and Gas Applications of Expert Systems ............................................ 22 3.6 Maintenance Applications of Expert Systems ........................................................ 24 3.7 Expert Systems on the NCS ...................................................................................... 25
Chapter 4 Case Studies: Multiple Companies ....................................................33
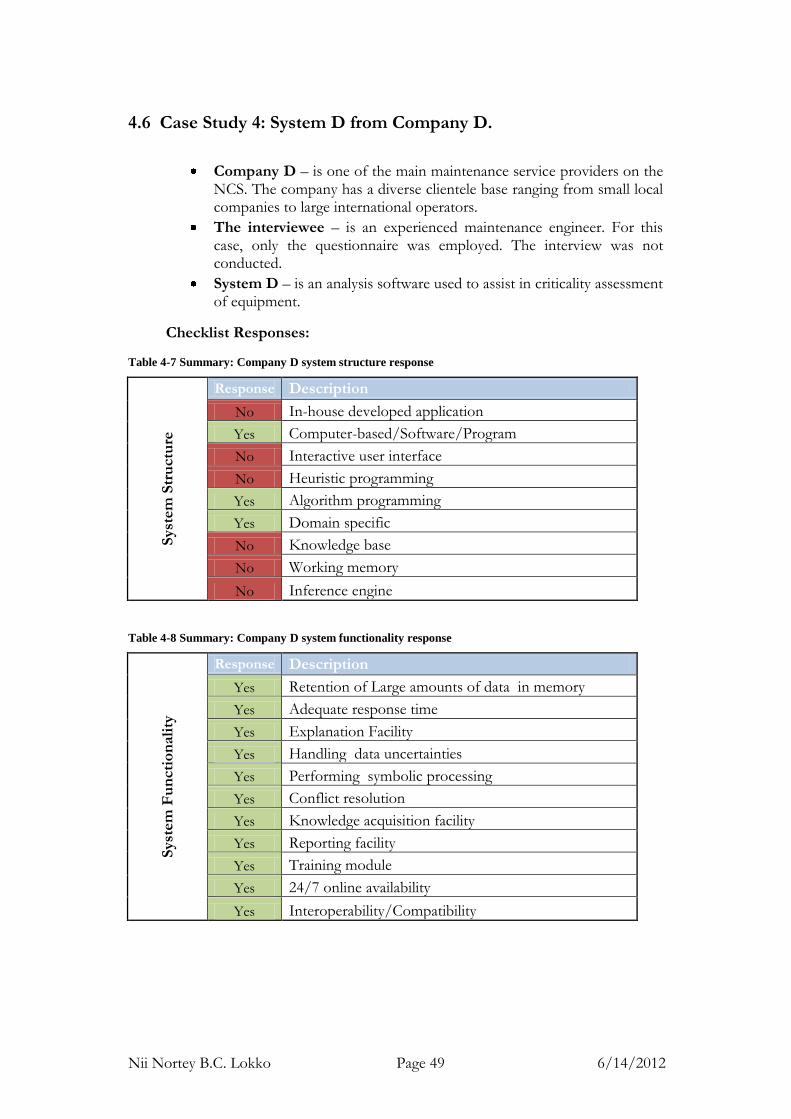
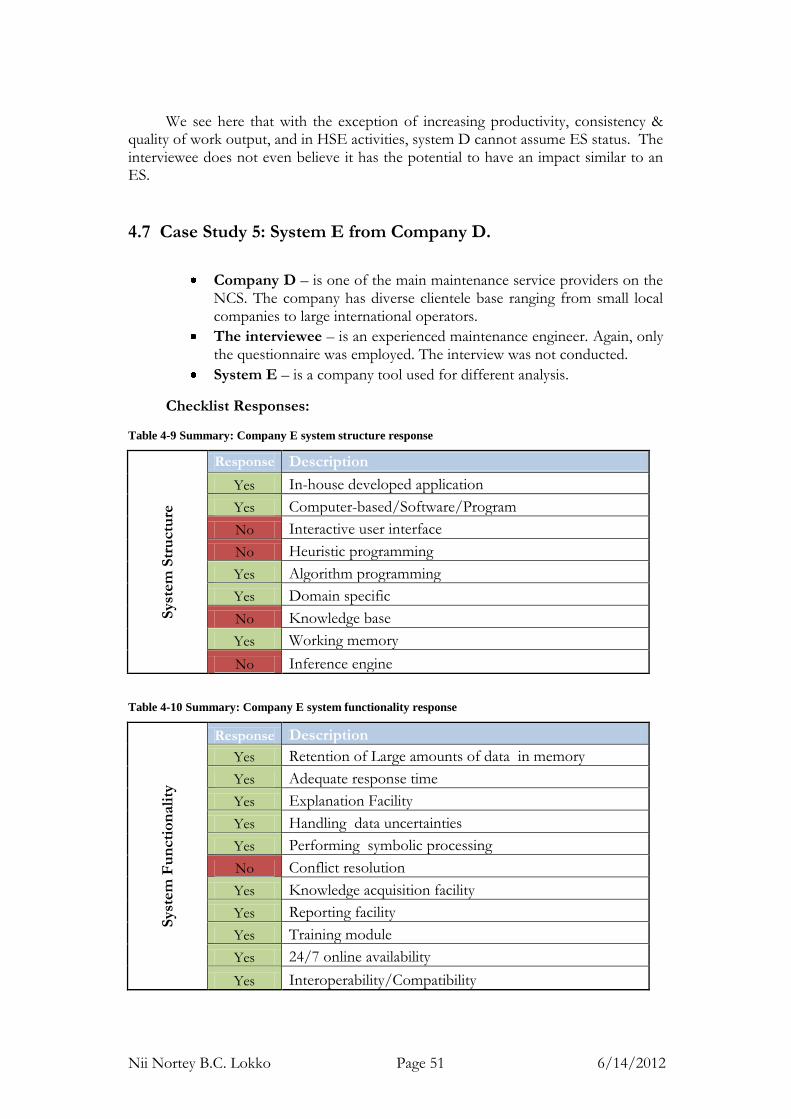
4.1 The Industrial Survey ................................................................................................. 33 4.2 Presentation of Survey Results .................................................................................. 36 4.3 Case Study 1: System A from Company A.............................................................. 37 4.4 Case Study 2: System B from Company B. ............................................................. 41 4.5 Case Study 3: System C from Company C. ............................................................. 45 4.6 Case Study 4: System D from Company D. ............................................................ 49 4.7 Case Study 5: System E from Company D. ............................................................ 51
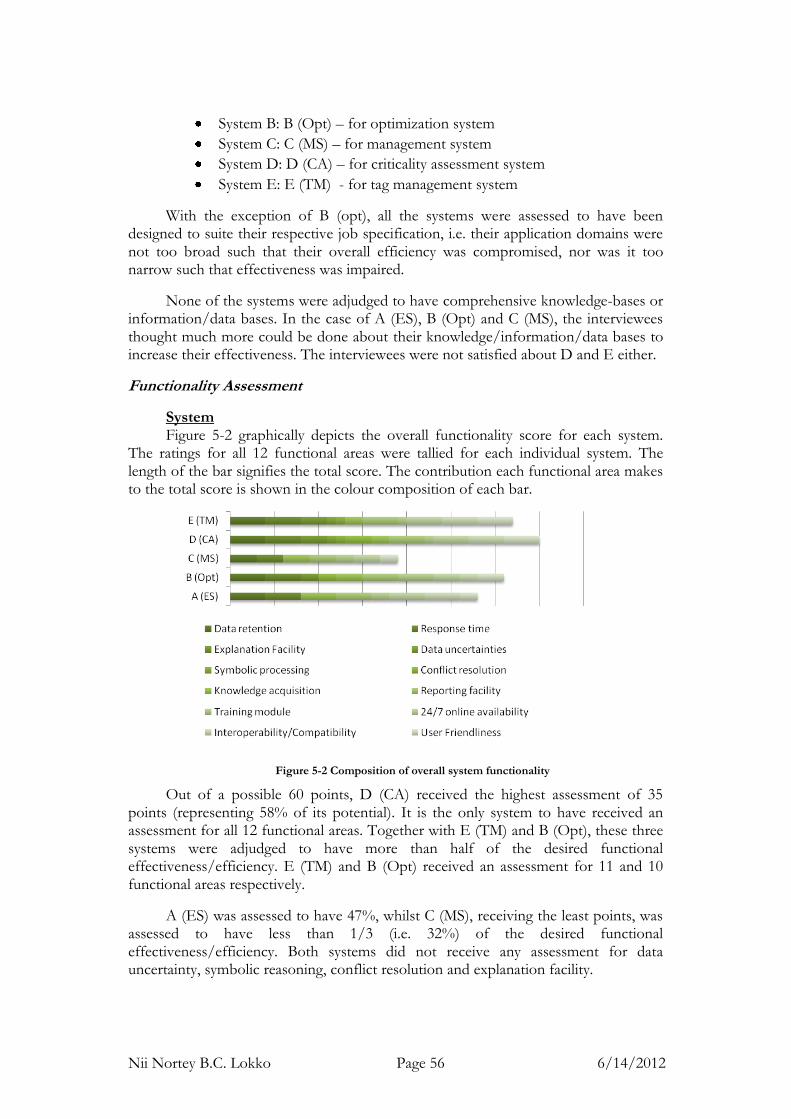
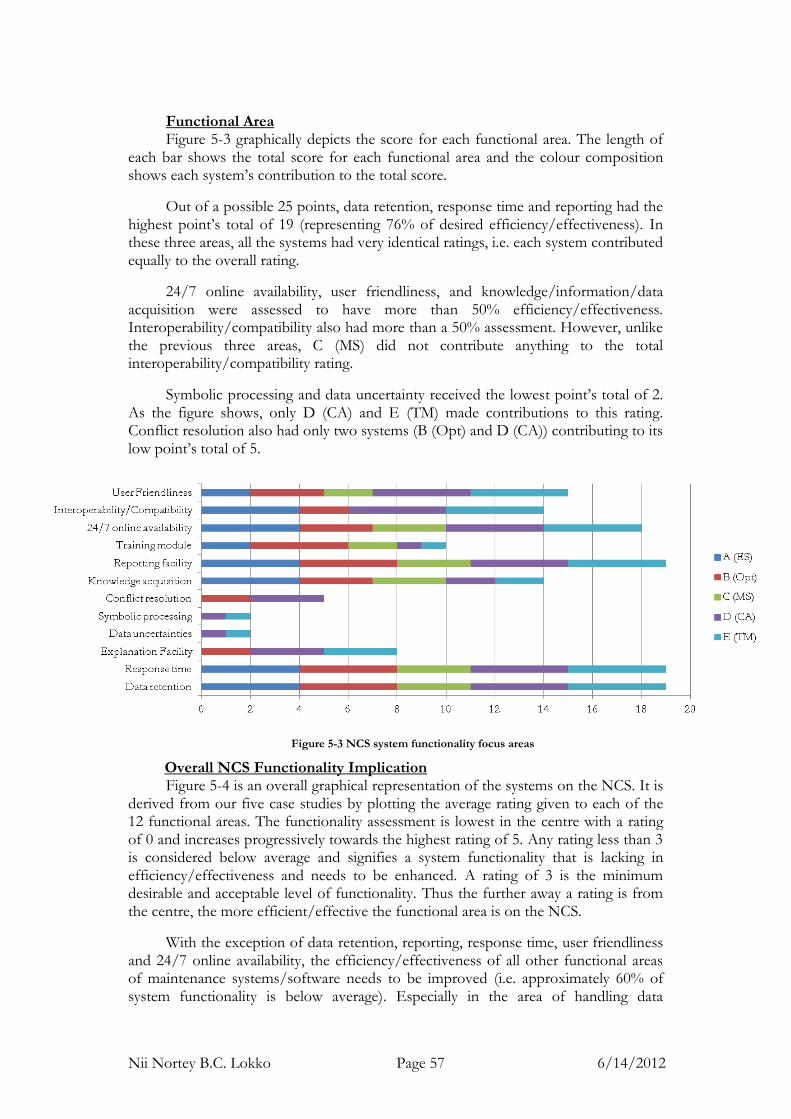
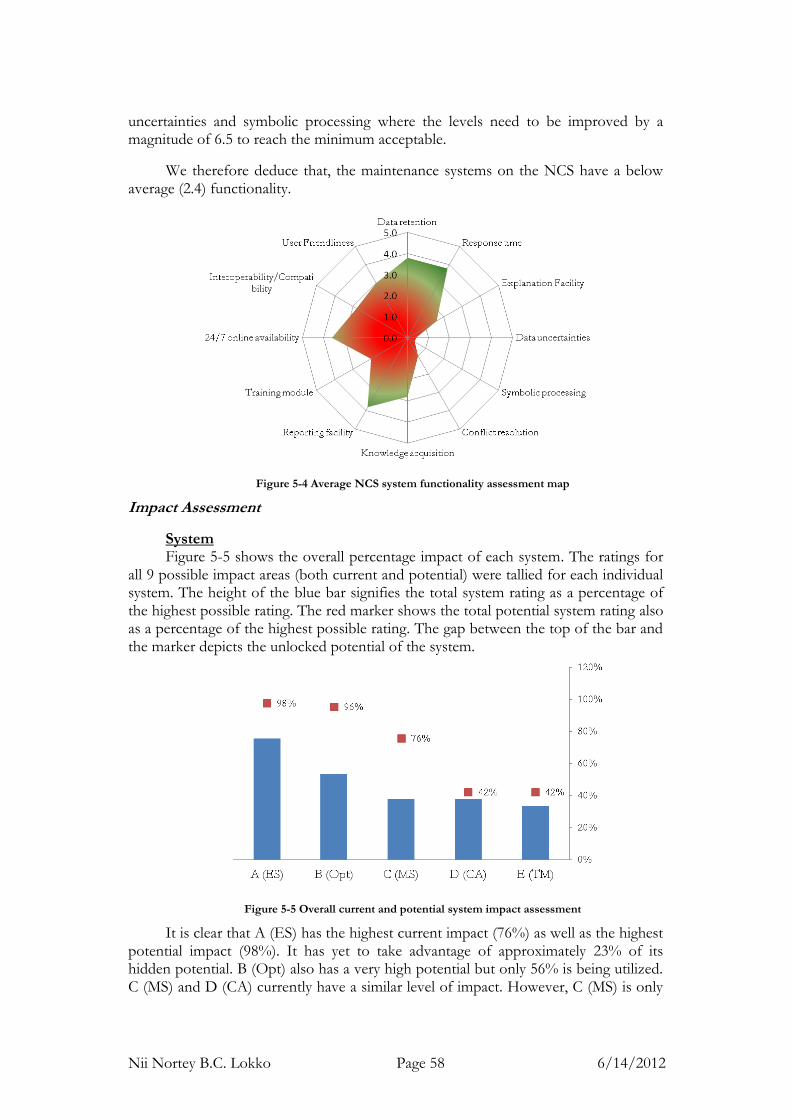
5.1 Analysis of Questionnaire Results ............................................................................ 55 5.2 Further Discussion/Observations ............................................................................ 60
Chapter 6 Issues, Recommendations and Suggested Application Areas ..........63
6.1 ES Application Issues/Challenges for the NCS..................................................... 63 6.2 Suggested Remedies .................................................................................................... 66 6.3 Suggested ES Application Areas ............................................................................... 69
7.1 Final Remarks .............................................................................................................. 71 7.2 Areas for Further Study ............................................................................................. 73
Appendix 1: Map of PSA Area of Authority................................................................. 77 Appendix 2: Checklist for Expert Systems .................................................................... 78 Appendix 3: List of Vendors/Suppliers/Providers of Computer-based Systems ... 79 Appendix 4: List of Surveyed Systems Available on the NCS ................................... 80 Appendix 5: Sample Questionnaire and Interview Questions .................................... 81 Appendix 6: NCS Field Details from NPD .................................................................. 86
Nii Nortey B.C. Lokko Page ix 6/14/2012
List of Figures
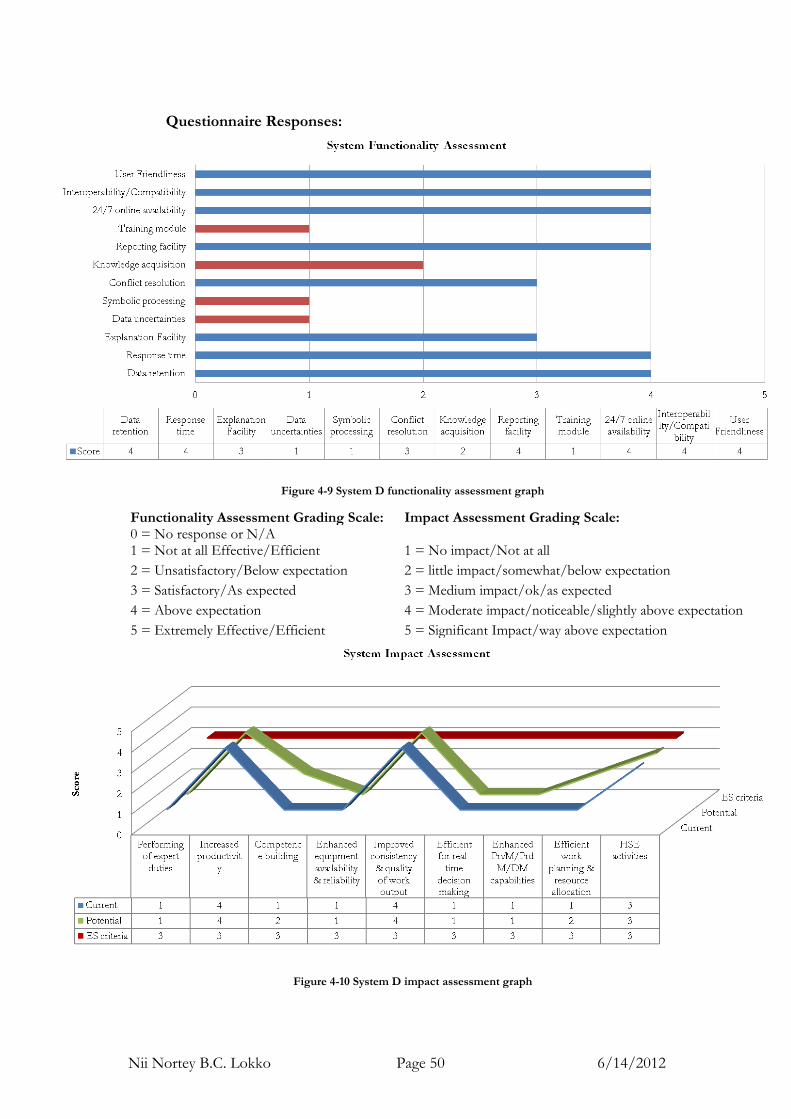
Figure 1-1 Uncovering the Myth of Expert Systems ........................................................... 1 Figure 1-2 Value creation through technical integrity ......................................................... 2 Figure 2-1 Topside Offshore Assets ...................................................................................... 6 Figure 2-2 Overview statistics on the NCS........................................................................... 7 Figure 2-3 Regulatory organizational collaboration on the NCS....................................... 8 Figure 2-4 OLF’s Plan for IO (2005)..................................................................................... 9 Figure 2-5 Age demographics showing most likely expert zone ..................................... 10 Figure 2-6 Overview statistics on the NCS......................................................................... 10 Figure 2-7 Role of ES in HSE improvement and value creation .................................... 11 Figure 3-1 ES for Decision Support .................................................................................... 13 Figure 3-2 Knowledge transfer in expert systems (Romem, 2010) ................................. 13 Figure 3-3 Major milestones in the development of ES (Noran) .................................... 15 Figure 3-4 Integration of expert systems components (Badiru & Cheung, 2002) ........ 17 Figure 3-5 Engineering problem categorization and evaluation ...................................... 20 Figure 3-6 Experts domain and ES application area for engineering problems ........... 21 Figure 3-7 Maintenance problem solving process ............................................................. 21 Figure 3-8 ES potential in reducing time & cost of asset problem solving ................... 22 Figure 3-9 Time series of some notable ES application in the O&G industry ............. 24 Figure 3-10 Time series of ES applications in maintenance ............................................ 25 Figure 3-11 Category of surveyed systems on available on the NCS .............................. 26 Figure 3-12 Maintenance strategy effects on asset performance and uptime ................ 29 Figure 3-13 Composition of maintenance strategies on the NCS ................................... 30 Figure 3-14 Available asset problem solving time & cost reducing potential on the
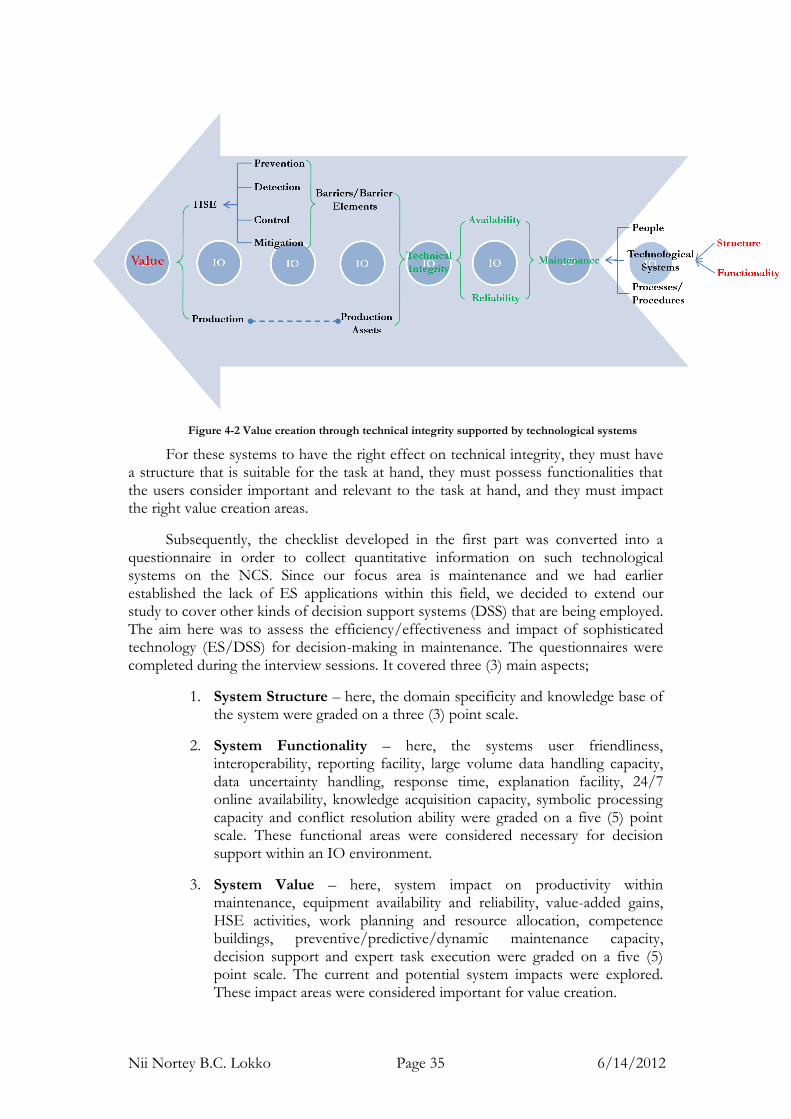
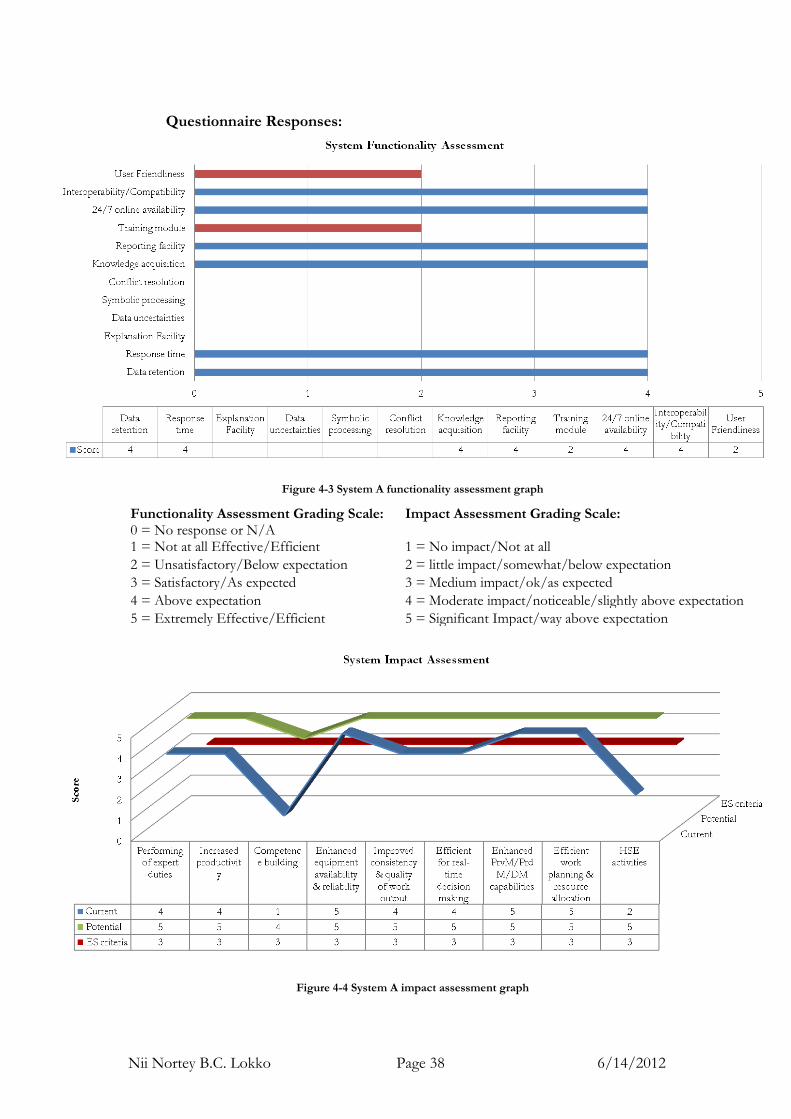
NCS ................................................................................................................................ 31 Figure 3-15 ES application in the global offshore O&G industry and on the NCS .... 32 Figure 4-1 A Sample of potential survey candidates ......................................................... 33 Figure 4-2 Value creation through technical integrity supported by technological
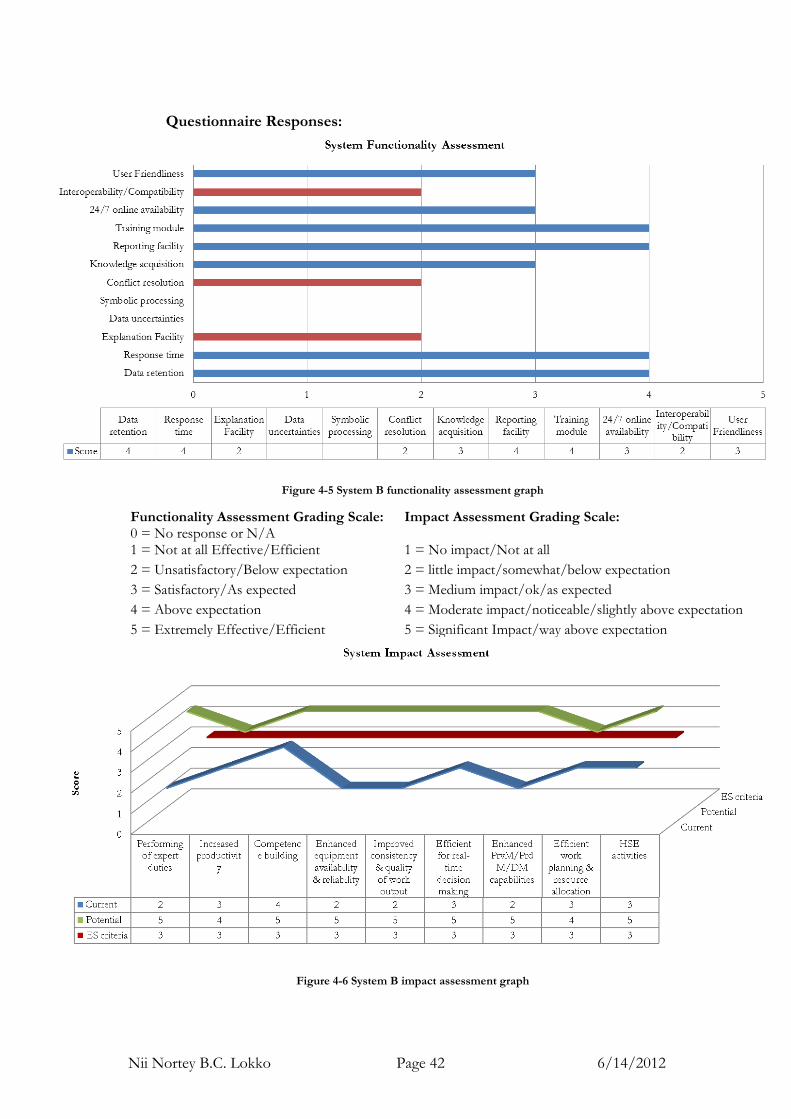
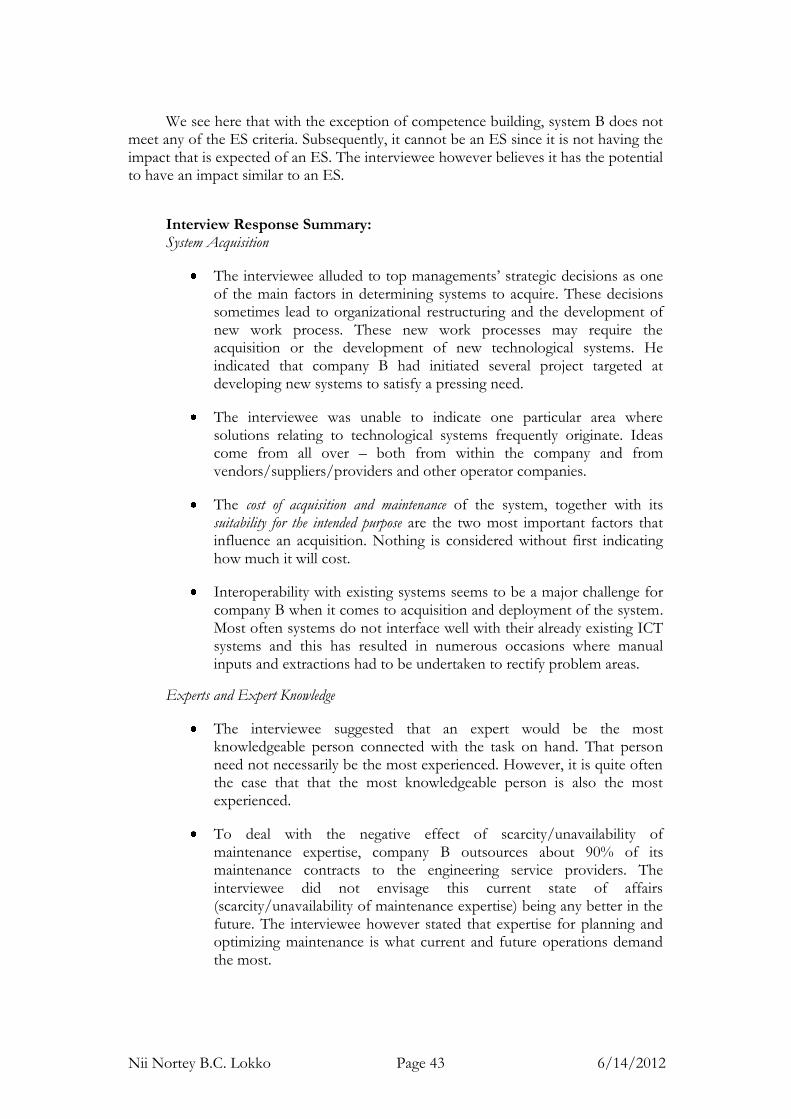
systems ........................................................................................................................... 35 Figure 4-3 System A functionality assessment graph ........................................................ 38 Figure 4-4 System A impact assessment graph .................................................................. 38 Figure 4-5 System B functionality assessment graph......................................................... 42 Figure 4-6 System B impact assessment graph ................................................................... 42 Figure 4-7 System C functionality assessment graph ........................................................ 46 Figure 4-8 System C impact assessment graph................................................................... 46 Figure 4-9 System D functionality assessment graph ........................................................ 50 Figure 4-10 System D impact assessment graph ................................................................ 50 Figure 4-11 System E functionality assessment graph ...................................................... 53 Figure 4-12 System E impact assessment graph ................................................................ 53 Figure 5-1 Viewpoints around the expert table .................................................................. 55 Figure 5-2 Composition of overall system functionality ................................................... 56 Figure 5-3 NCS system functionality focus areas .............................................................. 57 Figure 5-4 Average NCS system functionality assessment map ...................................... 58 Figure 5-5 Overall current and potential system impact assessment .............................. 58 Figure 5-6 NCS current systems impact areas .................................................................... 59 Figure 5-7 Average NCS maintenance systems impact assessment map ....................... 60
Nii Nortey B.C. Lokko Page x 6/14/2012
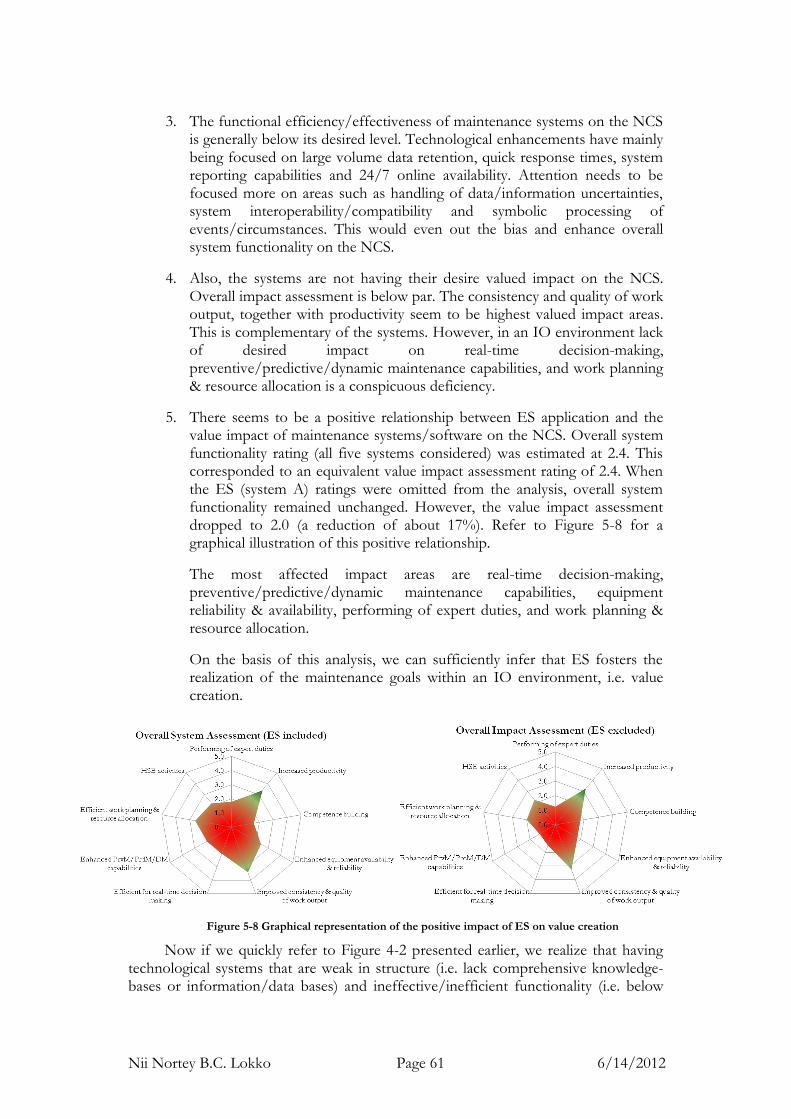
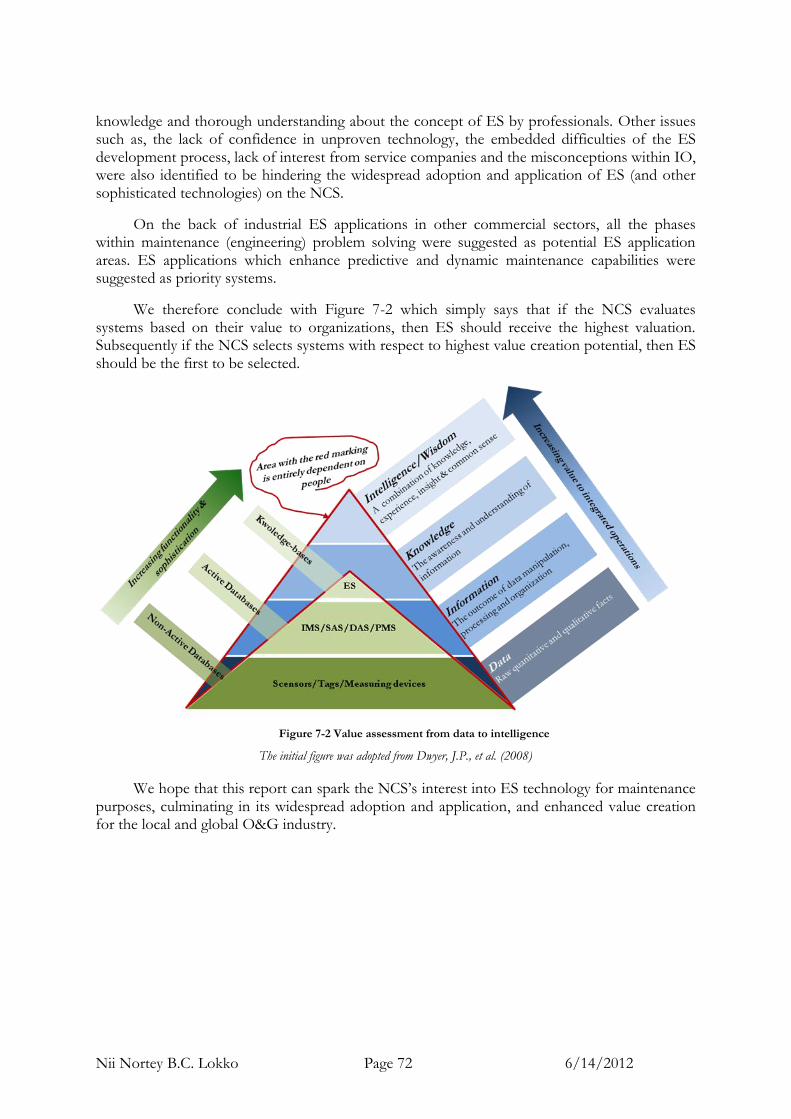
Figure 5-8 Graphical representation of the positive impact of ES on value creation .. 61 Figure 6-1 Deciding the next critical step forward ............................................................ 63 Figure 7-1 Graphical representation of this study ............................................................. 71 Figure 7-2 Value assessment from data to intelligence ..................................................... 72
List of Tables
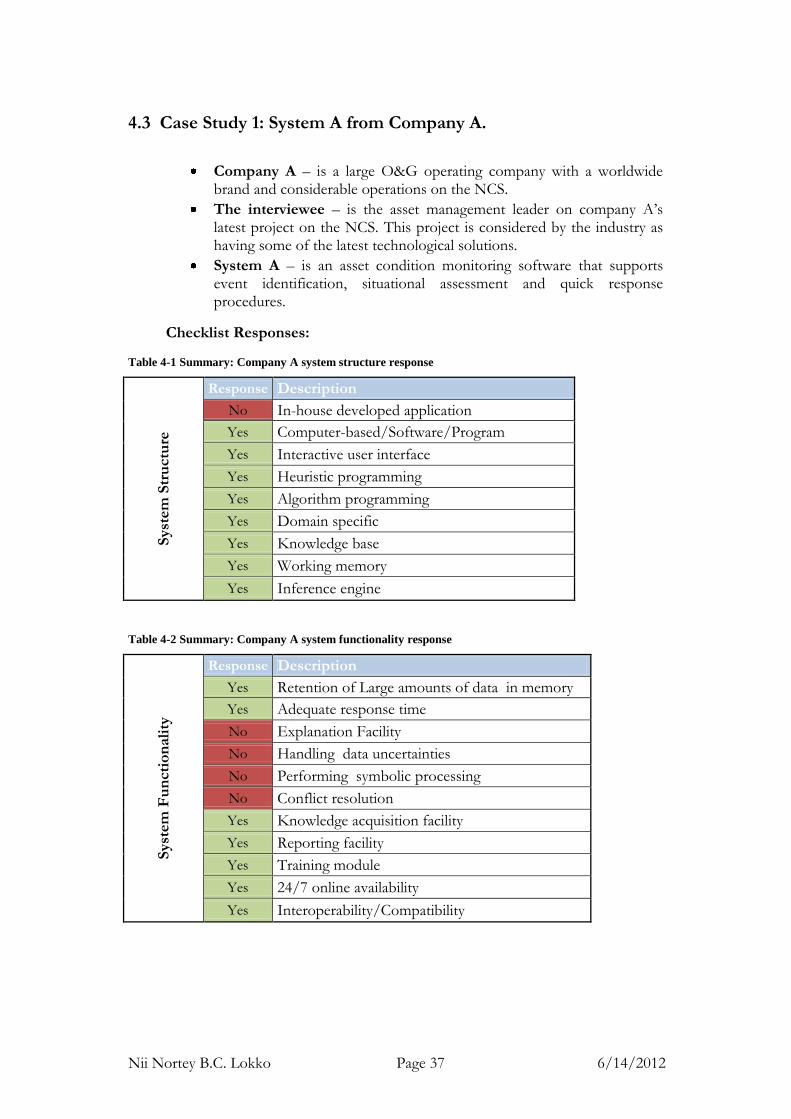
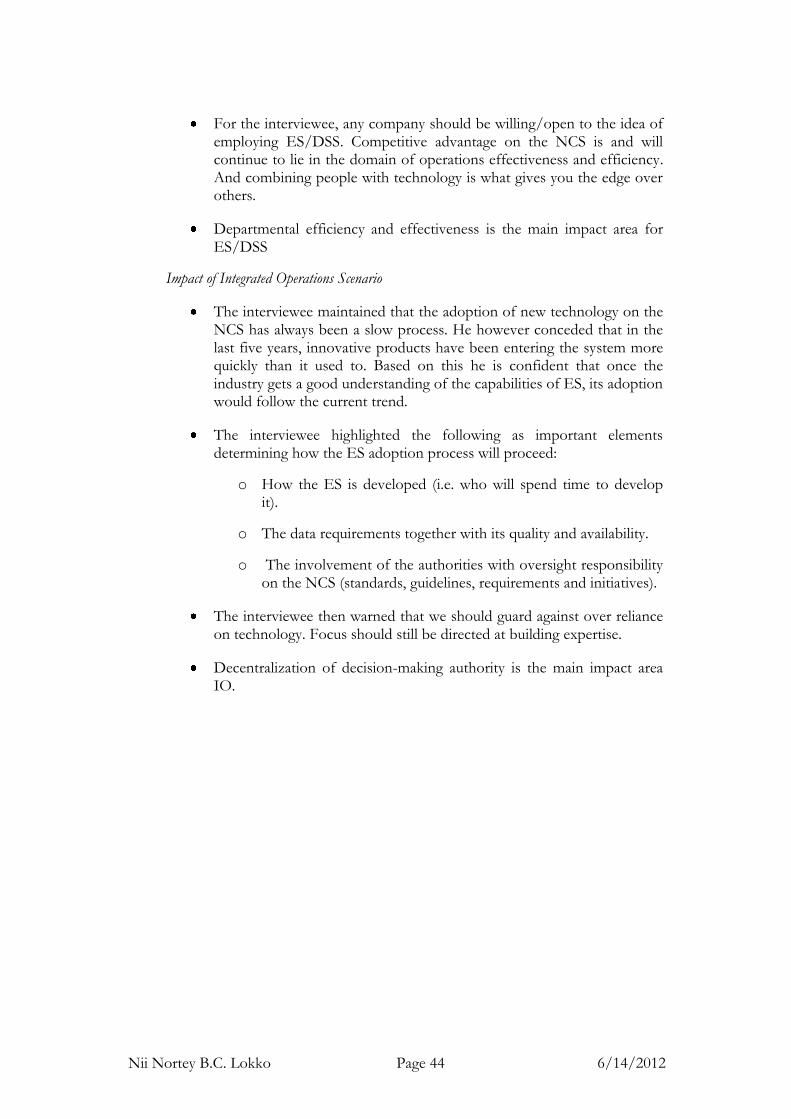
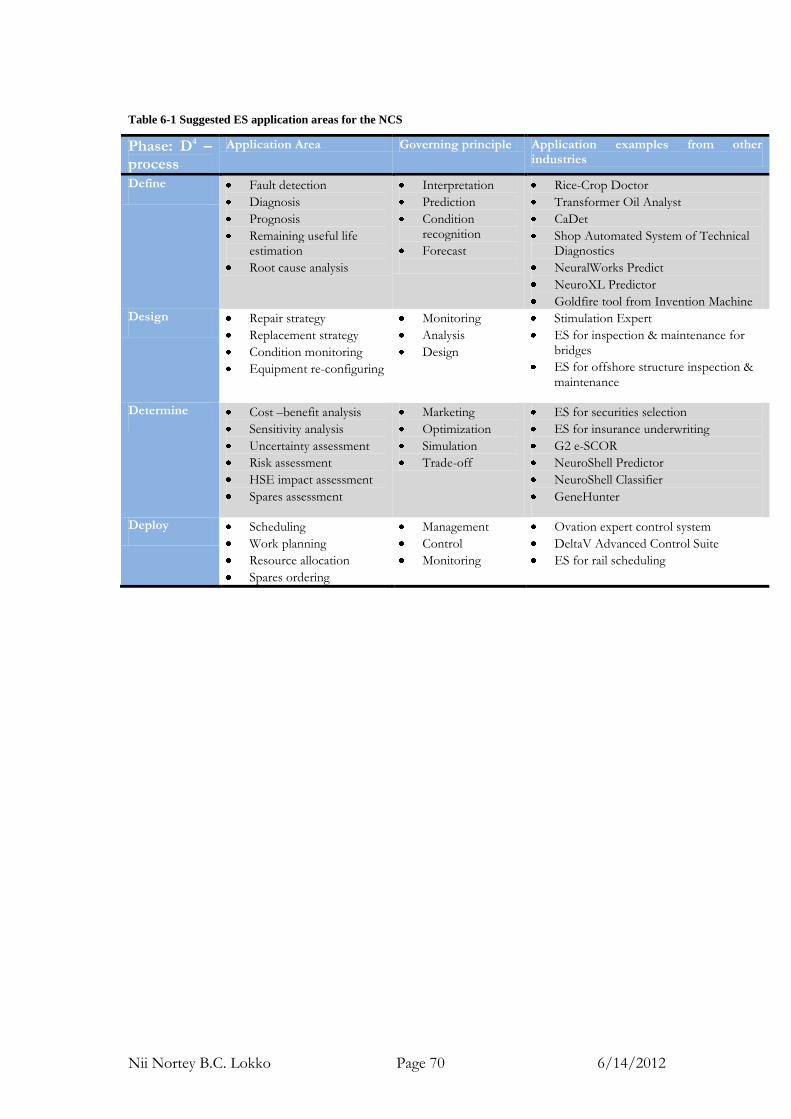
Table 3-1 Summary: Expert Systems vs. Convention Computer Systems ..................... 18 Table 4-1 Summary: Company A system structure response ........................................... 37 Table 4-2 Summary: Company A system functionality response .................................... 37 Table 4-3 Summary: Company B system structure response ........................................... 41 Table 4-4 Summary: Company B system functionality response .................................... 41 Table 4-5 Summary: Company C system structure response ........................................... 45 Table 4-6 Summary: Company C system functionality response .................................... 45 Table 4-7 Summary: Company D system structure response .......................................... 49 Table 4-8 Summary: Company D system functionality response .................................... 49 Table 4-9 Summary: Company E system structure response ........................................... 51 Table 4-10 Summary: Company E system functionality response .................................. 51 Table 6-1 Suggested ES application areas for the NCS .................................................... 70
Nii Nortey B.C. Lokko Page xi 6/14/2012
List of Abbreviations
AI Artificial Intelligence
ANN Artificial Neural Network
CBM Condition Based Maintenance
CM Condition Monitoring
DAS Data Analysis Systems
DBMS Database Management System
DNV Det Noske Veritas
DSS Decision Support System
EN European Standard
ES Expert System
FPSO Floating Production Storage and Offloading
GA Genetic Algorithm
HSE Health, Safety and Environment
ICT Information and Communication Technology
IEC International Electrotechnical Commission
IM Information Manager
IMS Information Management System
IO Integrated Operations
ISO International Standards Organisation
MOL Ministry of Labour
MPE Ministry of Petroleum and Energy
MTBF Mean Time Between Failure
MTTR Mean Time To Repair
NCS Norwegian Continental Shelf
NORSOK Norsk Sokkels Konkuranseposisjon
NPD National Petroleum Directorate
NTNU Norwegian University of Science and Technology
O&G Oil and Gas
O&M Operations and Maintenance
OLF Norwegian Oil Industry Association
PMS Project Management Systems
PSA Petroleum Safety Authority
SAS Statistical Analysis System
SINTEF The Foundation for Scientific and Industrial Research
TLP Tension-Leg Platform
Nii Nortey B.C. Lokko Page 1 6/14/2012
Chapter 1 Introduction
1.1 Background
Since the last quarter of 2004, the buzz word/phrase within the Norwegian Continental Shelf (NCS) has been Integrated Operations (IO). The centre for IO at the Norwegian University of Science and Technology (NTNU) defines it as the, “integration of people, work processes and technology to make smarter decisions and better execution.” This initiative, introduced by the Norwegian Oil Industry Association (OLF), emphasizes the need to use “ubiquitous real time data, collaborative techniques and multiple expertise across disciplines, organizations and geographical locations.” In relation to operations and maintenance (O&M), JP
Figure 1-1 Uncovering the Myth of Expert Systems (www. atariarchives.org)
Nii Nortey B.C. Lokko Page 2 6/14/2012
Liyanage (Integrated eOperations – eMaintenance: Applications in North Sea offshore assets, 2008) interprets this to mean:
o testing out and implementing new technological solutions to especially enable
predictive maintenance capabilities;
o implementing more robust technical platforms for effective O&M data
management;
o establishing new organizational forms as compensation for the lack and/or
short of experienced O&M workforce;
o standardizing the technical language used by different stakeholders
communication and cooperation enhancement purposes ;
o providing fast access to technical expertise in challenging and urgent scenarios;
o building a lively competence network to enhance decisions-making and the
execution of activities.
This state of affairs, according to ‘Information Managers (IM)’ and O&M
supervisors/engineers, translates into an increased complexity of maintenance management activities. Consequently, there is an escalated need for more effective equipment fault diagnosis and prognosis capabilities and efficient decision support systems. IO has significantly influenced the development and use of tools/systems and processes that churn-out and store millions of data in various forms and formats. Thus the biggest challenge lies in employing powerful problem solving tools/systems that effectively use all of such data. These systems should be able to obtain, transform and analyze information from multiple databases, for more reliable decision-making, as would a human expert.
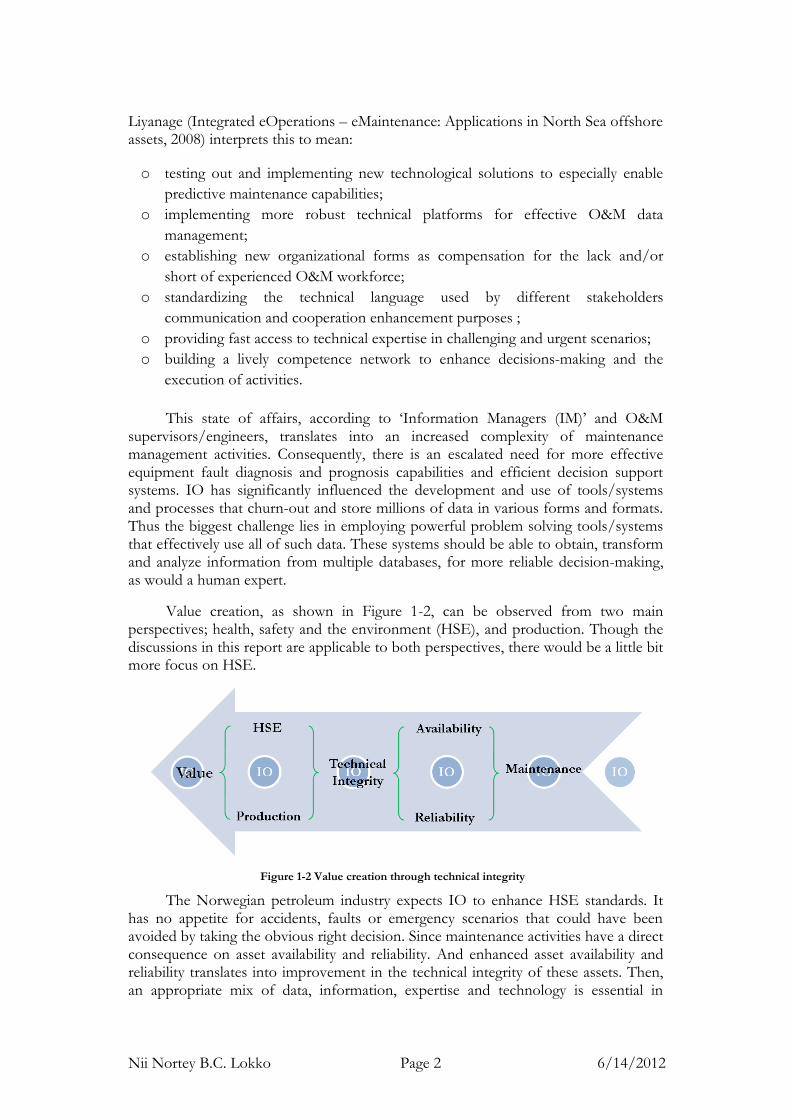
Value creation, as shown in Figure 1-2, can be observed from two main perspectives; health, safety and the environment (HSE), and production. Though the discussions in this report are applicable to both perspectives, there would be a little bit more focus on HSE.
Figure 1-2 Value creation through technical integrity
The Norwegian petroleum industry expects IO to enhance HSE standards. It has no appetite for accidents, faults or emergency scenarios that could have been avoided by taking the obvious right decision. Since maintenance activities have a direct consequence on asset availability and reliability. And enhanced asset availability and reliability translates into improvement in the technical integrity of these assets. Then, an appropriate mix of data, information, expertise and technology is essential in
Nii Nortey B.C. Lokko Page 3 6/14/2012
ensuring that under IO, asset management does not compromise HSE standards on the NCS. The intelligent combination of data, information, expertise and technology for enhanced decision-making purposes in complex environments are the building blocks for computer based tools known as Expert Systems (ES).
IO is to realize a complex interactive environment of equipment, personnel, systems, processes and organizations on the back of information and communication technology (ICT). Subsequently, the use of ES can only serve to foster the realization of a collaborative operating environment and improve the overall integrity of offshore assets.
The concept of ES is an example of the tools/systems that, if efficiently employed, has the potential to significantly improve the decision-making ability of IM’s and O&M engineers and managers. However there is one basic yet significant impediment to its widespread utilization – many professionals within the NCS are not thoroughly acquainted with the concept of ES.
1.2 Aim of the Thesis
The purpose of this thesis is to elaborate on the state of the art of existing ES in use by large oil and gas companies in the NCS. Additionally, it investigates how sophisticated tools & technologies, such as ES, can contribute to value creation on the NCS under the new operating concept of IO.
Given the practical complexities of IO, this report also identifies potential challenges, obstacles and factors that can hinder their use and application
1.3 Objective of Work
The following project tasks were undertaken:
1. Undertake a literature review on ES to gain a better understanding on the subject matter
2. Identify state of the art for existing ES in the O&G industry and current application areas
3. Survey of available vendors offering ES to support O&G activities to the NCS 4. Map existing ES in use in the Norwegian O&G industry and current
application areas. 5. Develop a questionnaire/basis for conducting survey with major O&G
companies in the NCS. 6. A selection of business cases within O&G companies for investigation 7. As a result of survey and analysis, Identify any potential challenges, obstacles,
factors to the use and application of such sophisticated tools & technologies in the Norwegian O&G sector
8. Analyze and identify industrial trends, future needs and highlight possible future application areas for ES within the O&G industry
9. Recommendations/suggestions to the Norwegian petroleum industry
Nii Nortey B.C. Lokko Page 4 6/14/2012
1.4 Limitations
The study is limited to existing ES within the field of asset maintenance. It is also limited to the topside assets. The results and deductions are limited by the data obtained from only a few of the companies operating on the NCS.
1.5 Methodology
The first part of this thesis report is based on a comprehensive literature survey and a field study of ES developed for the global oil and gas industry and for the NCS. A survey of existing ES in the local and global market was conducted to acquire necessary field data. Expert opinion was also included to evaluate the practical need and application of ES for the Norwegian oil industry.
The second part is based on multiple case studies conducted to investigate the role of ES/DSS in enhancing technical integrity towards value creation under the ongoing developments in offshore environment. Data was collected through questionnaires and formal interviews with experts from oil and gas companies. The study explored the role of ES/DSS with respect to asset data forming the basis for enhanced decision making capability.
1.6 Report Structure
The remainder of this report is presented as follows:
Part 1
Chapter 2 looks at a brief overview of the NCS, with a focus on HSE and its relation with expertise and asset maintenance, to provide a platform for our study. The motivation for the use of ES is thus presented here.
Chapter 3 then looks more closely at understanding the concept of ES, establishing ways of identifying such systems, and possible application areas with maintenance. The chapter then presents the status of ES application on the NCS and the global O&G industry.
Part 2
Chapter 4 looks at the presentation of the results of multiple case studies within O&G companies on the NCS. The focus of the investigation was assessing the functionality and impact of maintenance systems, to help establish the value of ES in asset management.
Chapter 5 then discusses the results of the survey and highlights some interesting observations.
Nii Nortey B.C. Lokko Page 5 6/14/2012
Chapter 6 presents some application issues and provides some thoughts on how to tackle the challenge of finding remedies.
Finally, we conclude with a short presentation of our findings and suggestions on possible areas for further study in chapter 7.
Nii Nortey B.C. Lokko Page 6 6/14/2012
Chapter 2 THE NORWEGIAN CONTINENTAL
SHELF (NCS)
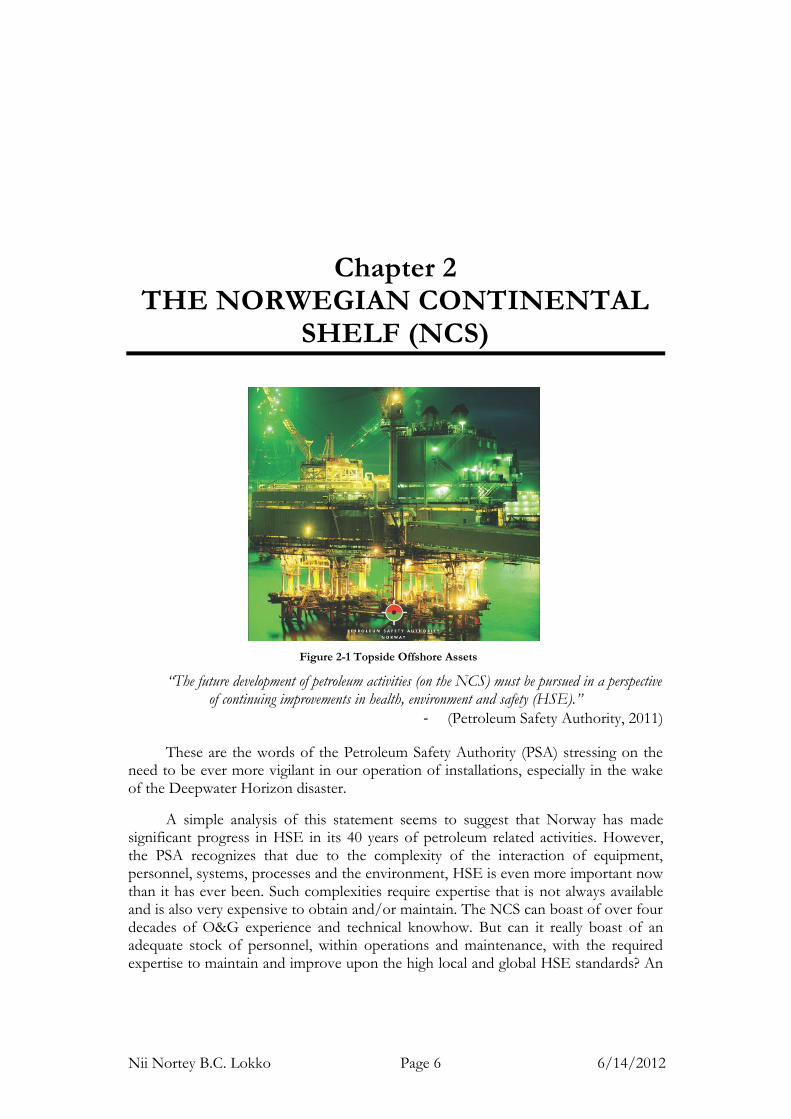
Figure 2-1 Topside Offshore Assets
“The future development of petroleum activities (on the NCS) must be pursued in a perspective of continuing improvements in health, environment and safety (HSE).”
- (Petroleum Safety Authority, 2011)
These are the words of the Petroleum Safety Authority (PSA) stressing on the need to be ever more vigilant in our operation of installations, especially in the wake of the Deepwater Horizon disaster.
A simple analysis of this statement seems to suggest that Norway has made significant progress in HSE in its 40 years of petroleum related activities. However, the PSA recognizes that due to the complexity of the interaction of equipment, personnel, systems, processes and the environment, HSE is even more important now than it has ever been. Such complexities require expertise that is not always available and is also very expensive to obtain and/or maintain. The NCS can boast of over four decades of O&G experience and technical knowhow. But can it really boast of an adequate stock of personnel, within operations and maintenance, with the required expertise to maintain and improve upon the high local and global HSE standards? An
Nii Nortey B.C. Lokko Page 7 6/14/2012
overview of the NCS is undoubtedly a necessary basis for a better analysis of this subject matter.
2.1 An Overview of the NCS
The Structure
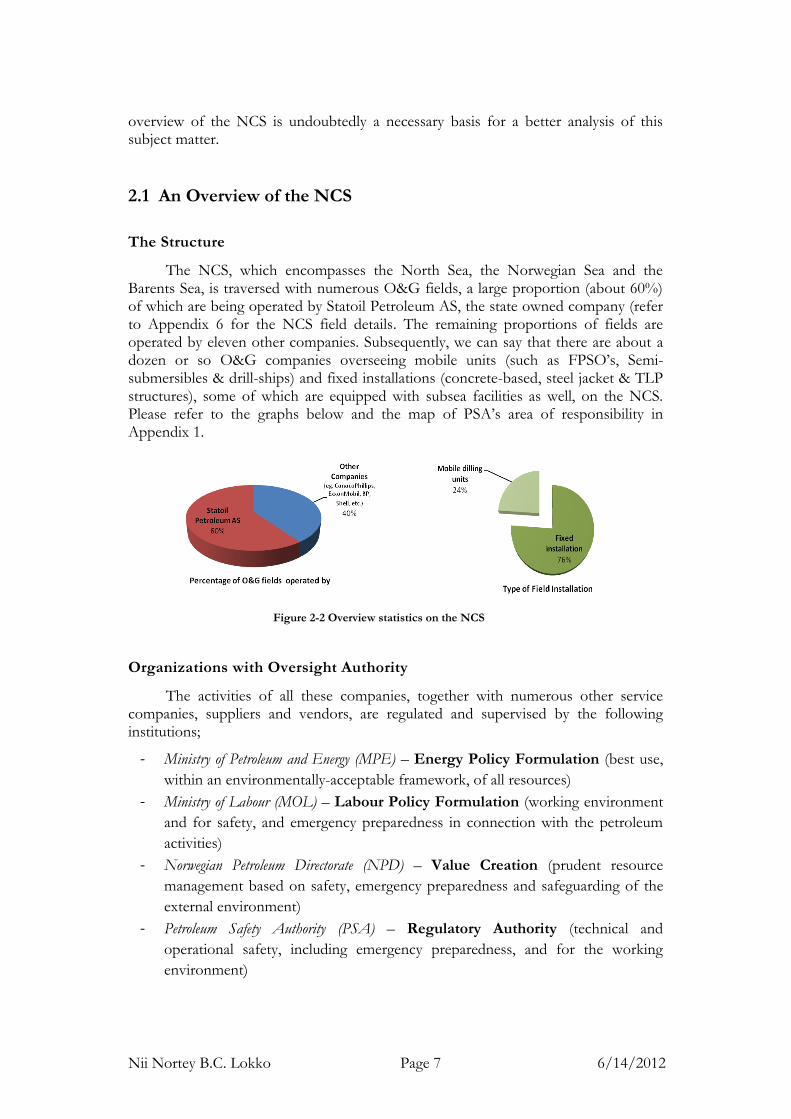
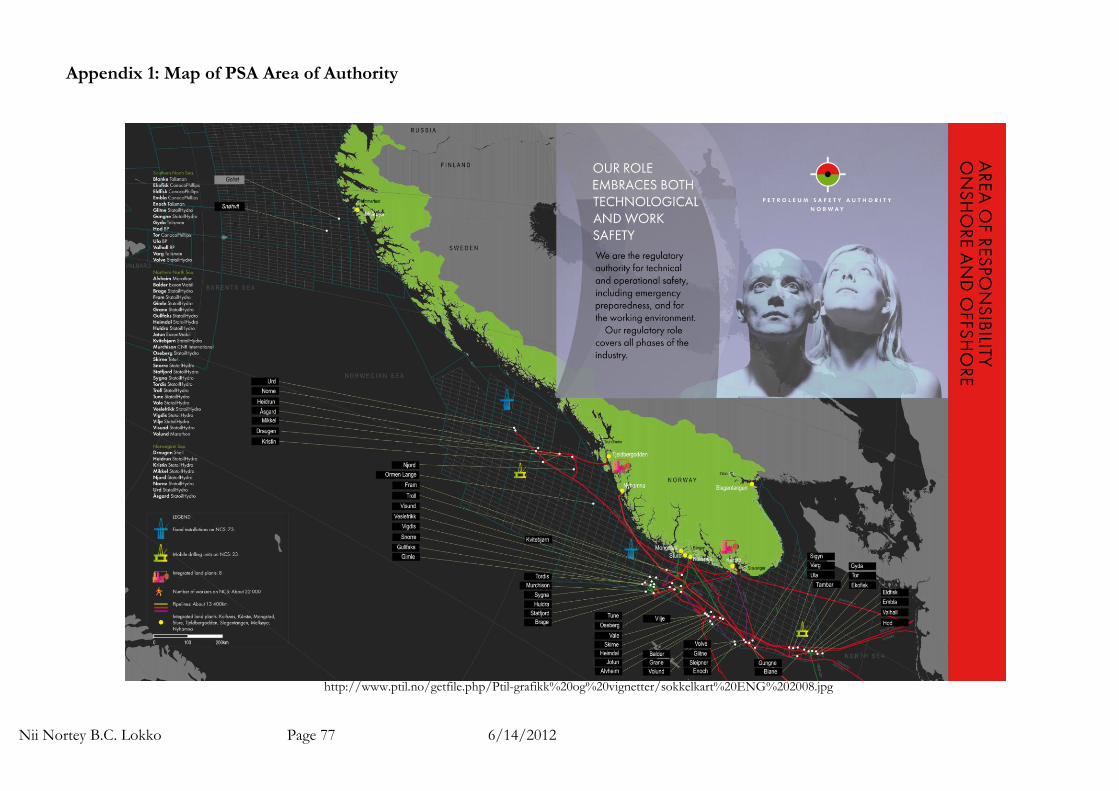
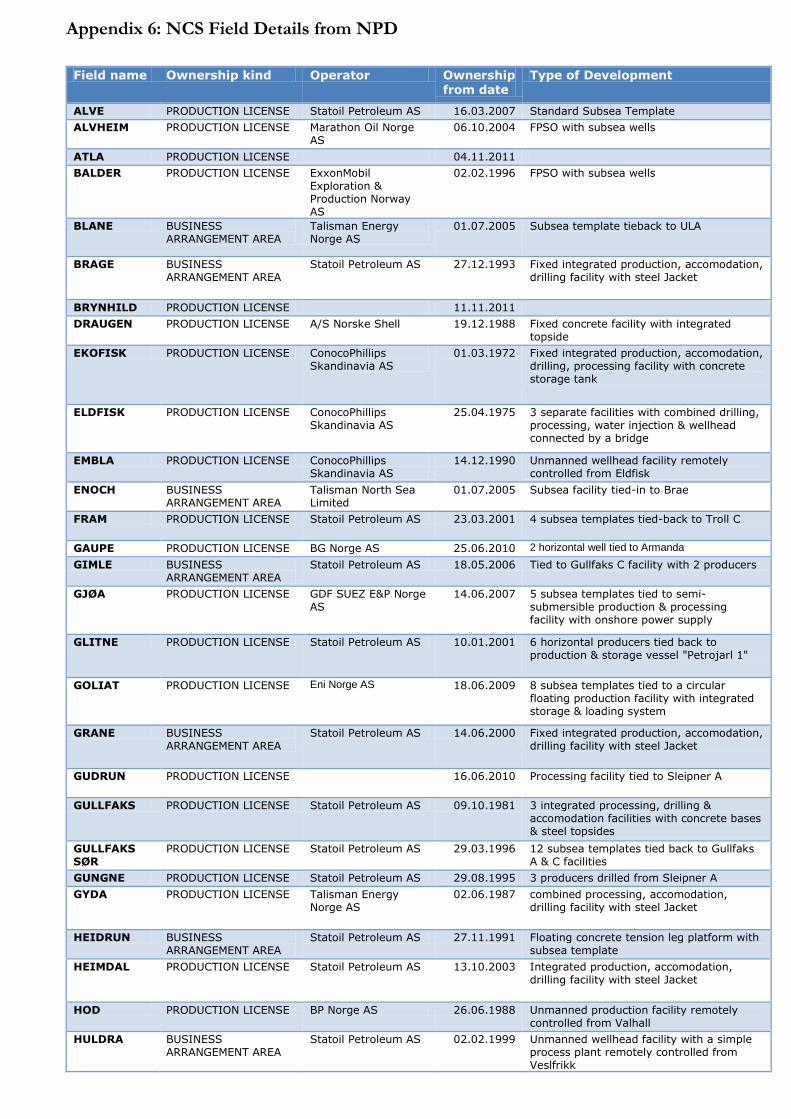
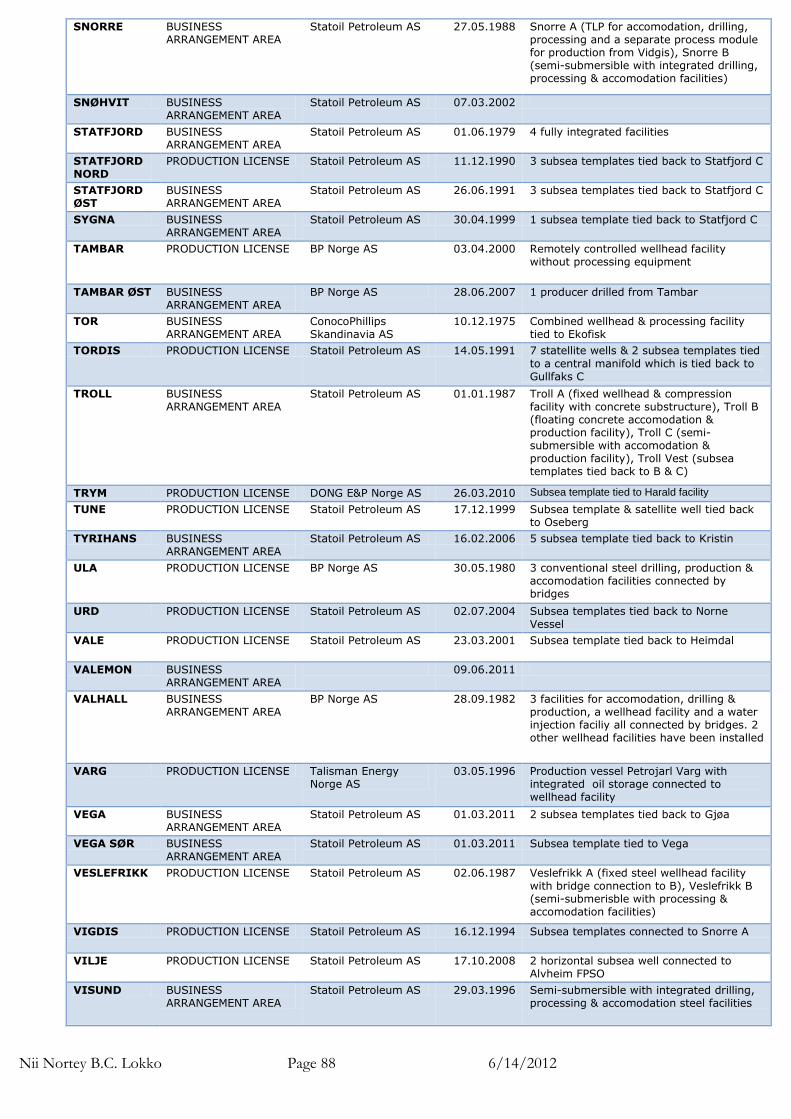
The NCS, which encompasses the North Sea, the Norwegian Sea and the Barents Sea, is traversed with numerous O&G fields, a large proportion (about 60%) of which are being operated by Statoil Petroleum AS, the state owned company (refer to Appendix 6 for the NCS field details. The remaining proportions of fields are operated by eleven other companies. Subsequently, we can say that there are about a dozen or so O&G companies overseeing mobile units (such as FPSO’s, Semi-submersibles & drill-ships) and fixed installations (concrete-based, steel jacket & TLP structures), some of which are equipped with subsea facilities as well, on the NCS. Please refer to the graphs below and the map of PSA’s area of responsibility in Appendix 1.
Figure 2-2 Overview statistics on the NCS
Organizations with Oversight Authority
The activities of all these companies, together with numerous other service companies, suppliers and vendors, are regulated and supervised by the following institutions;
- Ministry of Petroleum and Energy (MPE) – Energy Policy Formulation (best use,
within an environmentally-acceptable framework, of all resources)
- Ministry of Labour (MOL) – Labour Policy Formulation (working environment
and for safety, and emergency preparedness in connection with the petroleum
activities)
- Norwegian Petroleum Directorate (NPD) – Value Creation (prudent resource
management based on safety, emergency preparedness and safeguarding of the
external environment)
- Petroleum Safety Authority (PSA) – Regulatory Authority (technical and
operational safety, including emergency preparedness, and for the working
environment)
Nii Nortey B.C. Lokko Page 8 6/14/2012
- Det Noske Veritas (DNV) – Managing Risk (safeguarding life, property, and the
environment)
All the above institutions perform numerous and varying tasks in relation to the NCS, however (as can be seen for the above), they all have one underlying theme, “HSE”.
Through the collaborative work of these institutions and others (both local and foreign that remains unmentioned here), acts and regulations with which companies
are to abide by have been formulated for the petroleum industry. Guidelines and interpretations are also provided by these institutions on how the legislation and provisions within the regulations should be understood and applied, thus providing a basis for the best possible way of adhering to the regulations. These guidelines and interpretations normally refer to internationals standards such as those from ISO, IEC and EN, and the more petroleum focused ones such as NORSOK, DnV and OLF, as a means to the fulfillment of the requirements of the legislation and provisions within the regulations.
Figure 2-3 Regulatory organizational collaboration on the NCS
All these laws, regulation, guidelines and interpretations, and the application of
the standards are ultimately implemented by the professionals who are employed to run and manage the affairs of the O&G companies on the NCS. In order to continue the culture of maintaining the high HSE requirements and also improving upon it, these professionals need to have a thorough understanding of the legislation and regulations, and be very conversant with the applicable standards so as to be able to design and engineer systems and processes that are in tandem with the requirements, and be able to quickly respond to situations where deviations from these requirements are encountered (i.e. they must possess the required expertise to ensure strict adherence to the HSE requirements of operating on the NCS).
Current Operating Environment
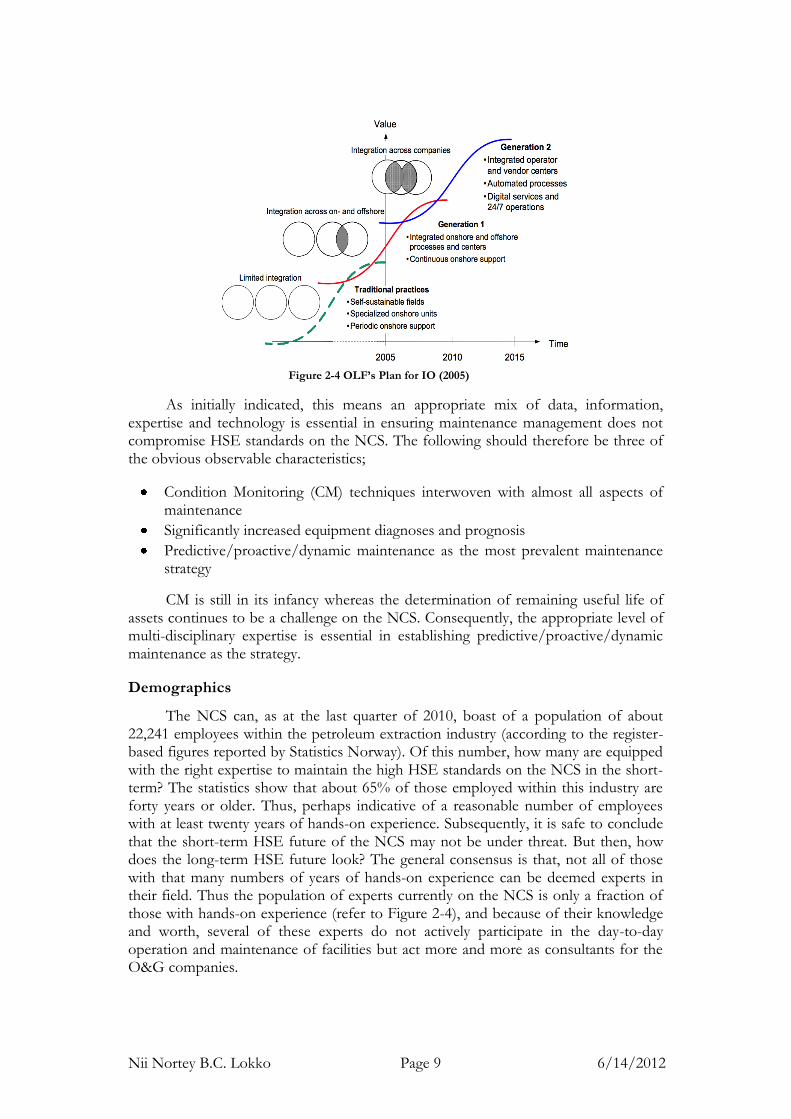
Assuming that the IO implementation is progressing as envisaged by the OLF, the NCS should thus be getting to the tale-end of 1st Generation (G1) and already entered the 2nd Generation (G2) (See Figure 2-4 below).
Nii Nortey B.C. Lokko Page 9 6/14/2012
Figure 2-4 OLF’s Plan for IO (2005)
As initially indicated, this means an appropriate mix of data, information, expertise and technology is essential in ensuring maintenance management does not compromise HSE standards on the NCS. The following should therefore be three of the obvious observable characteristics;
Condition Monitoring (CM) techniques interwoven with almost all aspects of maintenance
Significantly increased equipment diagnoses and prognosis
Predictive/proactive/dynamic maintenance as the most prevalent maintenance strategy
CM is still in its infancy whereas the determination of remaining useful life of assets continues to be a challenge on the NCS. Consequently, the appropriate level of multi-disciplinary expertise is essential in establishing predictive/proactive/dynamic maintenance as the strategy.
Demographics
The NCS can, as at the last quarter of 2010, boast of a population of about 22,241 employees within the petroleum extraction industry (according to the register-based figures reported by Statistics Norway). Of this number, how many are equipped with the right expertise to maintain the high HSE standards on the NCS in the short-term? The statistics show that about 65% of those employed within this industry are forty years or older. Thus, perhaps indicative of a reasonable number of employees with at least twenty years of hands-on experience. Subsequently, it is safe to conclude that the short-term HSE future of the NCS may not be under threat. But then, how does the long-term HSE future look? The general consensus is that, not all of those with that many numbers of years of hands-on experience can be deemed experts in their field. Thus the population of experts currently on the NCS is only a fraction of those with hands-on experience (refer to Figure 2-4), and because of their knowledge and worth, several of these experts do not actively participate in the day-to-day operation and maintenance of facilities but act more and more as consultants for the O&G companies.
Nii Nortey B.C. Lokko Page 10 6/14/2012
Figure 2-5 Age demographics showing most likely expert zone
As earlier stated, complex operations, complex systems and complex
interactions characterize the industry today. These complexities (which will only intensify in the future) require a much higher level of expertise, which is already scarce today, to manage and respond to issues in real-time. The Deepwater Horizon’s accident investigation report provides a reference for how current complexities within the industry demand a higher level of competence than previously considered acceptable.
Consequently, the mid to long-term future of HSE on the NCS may be under threat unless concrete steps are taken to ensure a minimum level of expertise.
2.2 Making Experts of Non-Experts
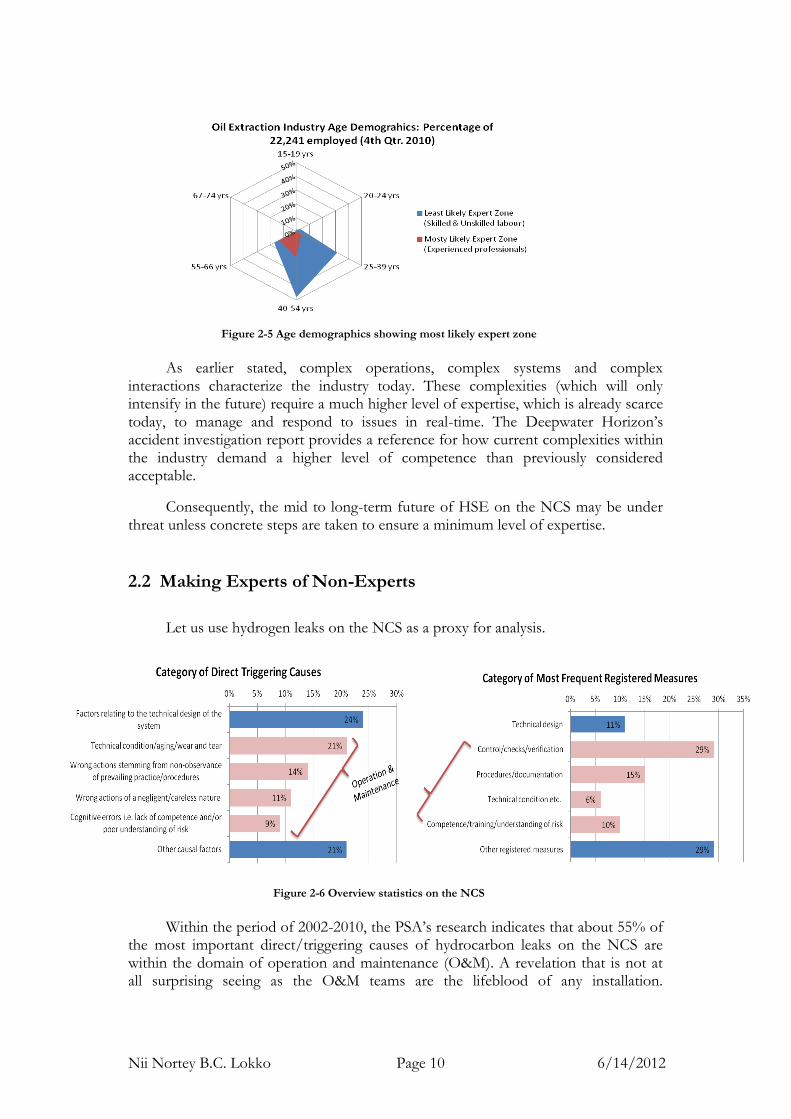
Let us use hydrogen leaks on the NCS as a proxy for analysis.
Figure 2-6 Overview statistics on the NCS
Within the period of 2002-2010, the PSA’s research indicates that about 55% of
the most important direct/triggering causes of hydrocarbon leaks on the NCS are within the domain of operation and maintenance (O&M). A revelation that is not at all surprising seeing as the O&M teams are the lifeblood of any installation.
Nii Nortey B.C. Lokko Page 11 6/14/2012
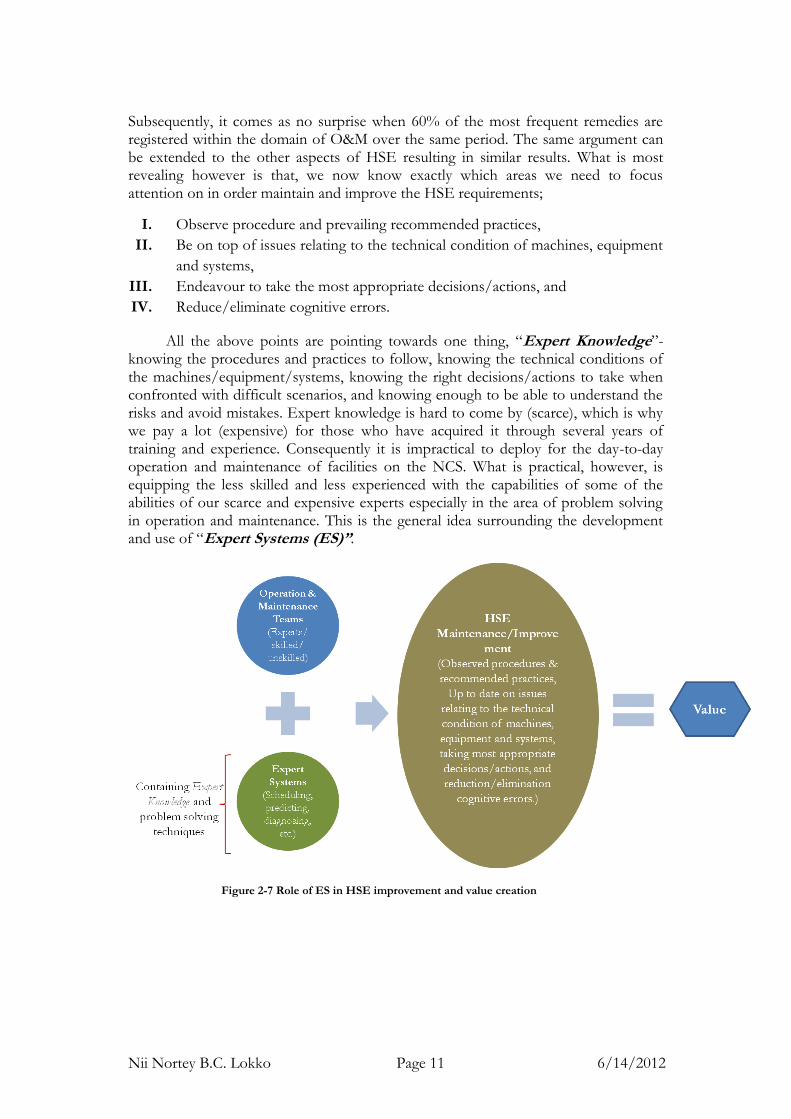
Subsequently, it comes as no surprise when 60% of the most frequent remedies are registered within the domain of O&M over the same period. The same argument can be extended to the other aspects of HSE resulting in similar results. What is most revealing however is that, we now know exactly which areas we need to focus attention on in order maintain and improve the HSE requirements;
I. Observe procedure and prevailing recommended practices,
II. Be on top of issues relating to the technical condition of machines, equipment
and systems,
III. Endeavour to take the most appropriate decisions/actions, and
IV. Reduce/eliminate cognitive errors.
All the above points are pointing towards one thing, “Expert Knowledge”- knowing the procedures and practices to follow, knowing the technical conditions of the machines/equipment/systems, knowing the right decisions/actions to take when confronted with difficult scenarios, and knowing enough to be able to understand the risks and avoid mistakes. Expert knowledge is hard to come by (scarce), which is why we pay a lot (expensive) for those who have acquired it through several years of training and experience. Consequently it is impractical to deploy for the day-to-day operation and maintenance of facilities on the NCS. What is practical, however, is equipping the less skilled and less experienced with the capabilities of some of the abilities of our scarce and expensive experts especially in the area of problem solving in operation and maintenance. This is the general idea surrounding the development and use of “Expert Systems (ES)”.
Figure 2-7 Role of ES in HSE improvement and value creation
Nii Nortey B.C. Lokko Page 12 6/14/2012
Let us consider an early example of the conceptual illustration of ES from the NCS.
“On a cold day on the North Sea in 1995, a group of British Petroleum (BP) Exploration drilling engineers had a problem. Equipment failure had brought operations to a halt — and because they couldn’t diagnose the trouble, they faced the prospect of taking the mobile drilling ship (leased at a cost of $150,000 a day) back to port indefinitely. Instead, they hauled the faulty hardware in front of a tiny video camera connected to a newly installed computer workstation. Using a satellite link, they dialed up a BP drilling equipment expert in Aberdeen. To him, the problem was apparent, and he guided them quickly through the repair. The down time, as it turned out, lasted only a few hours.” (Cohen, 1998)
You ask yourself, what would have happened if the expert was unavailable? What would have happened if he was available but his expertise was urgently needed on some other tasks? Then you can finally ask what would have happened if the drilling engineers had an ES for this purpose?
Let us analyze this real life example as follows
1. The expert is knowledgeable in drilling equipment because of his technical background and experiences – Knowledge Base.
2. He interacts with drilling engineers (non-drilling equipment experts) via a computer workstation and a video camera – Interactive User Interface.
3. The drilling engineers provide him with data/information (including visual) about the problem – Working Memory.
4. Based on the information provided he applies his technical knowhow and provides a solution to the problem – Inference Engine.
Put all these together on the back of a computer-based application and you have an ES that is capable of assisting in critical decision-making.
Now let us find out what exactly an ES is.
Nii Nortey B.C. Lokko Page 13 6/14/2012
Chapter 3 EXPERT SYSTEMS
Figure 3-1 ES for Decision Support Courtesy: (Executive Information Systems)
3.1 What are Expert Systems?
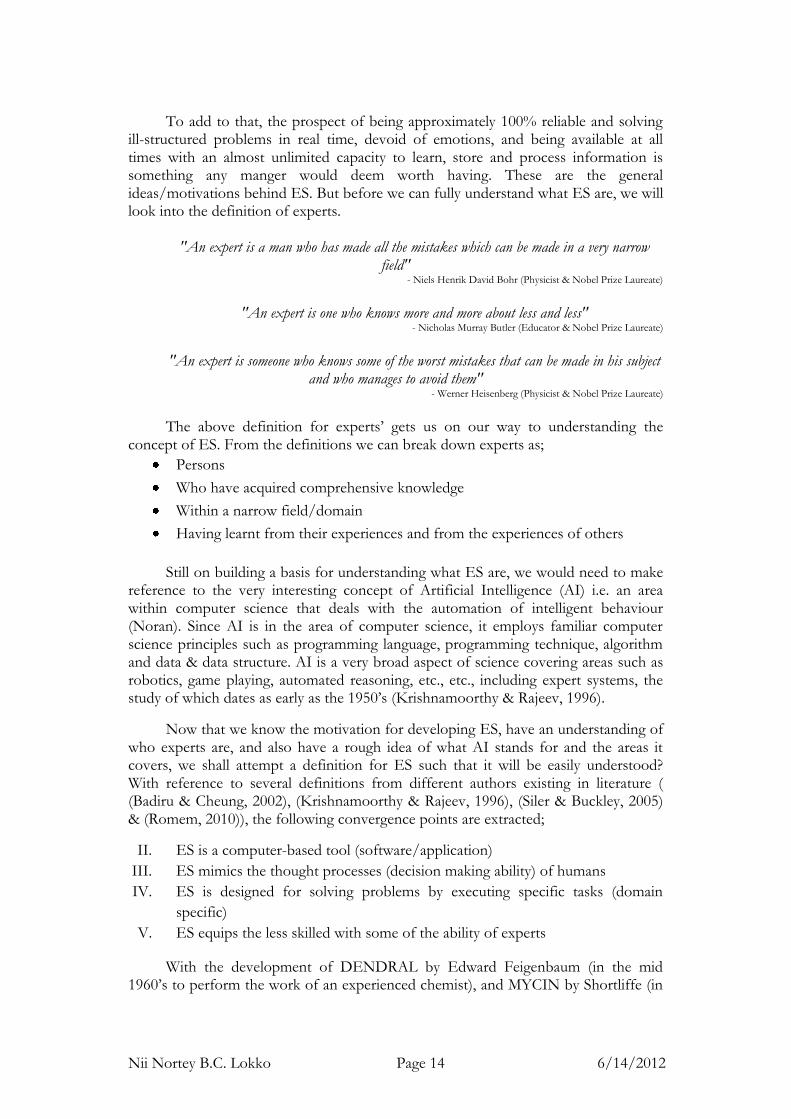
The previous section indicated that the ability to furnish less skilled workers with the capacity to do the work of highly experienced, scarce and expensive professionals, is something any manager in a competitive industry (such as O&G) would lend a willing ear. The figure below shows the process of knowledge transfer from expert to the non-expert through the codification of knowledge by a Knowledge Engineer (KE) into a Knowledge-Base (KB) of an ES.
Figure 3-2 Knowledge transfer in expert systems (Romem, 2010)
Nii Nortey B.C. Lokko Page 14 6/14/2012
To add to that, the prospect of being approximately 100% reliable and solving ill-structured problems in real time, devoid of emotions, and being available at all times with an almost unlimited capacity to learn, store and process information is something any manger would deem worth having. These are the general ideas/motivations behind ES. But before we can fully understand what ES are, we will look into the definition of experts.
"An expert is a man who has made all the mistakes which can be made in a very narrow field"
- Niels Henrik David Bohr (Physicist & Nobel Prize Laureate)
"An expert is one who knows more and more about less and less"
- Nicholas Murray Butler (Educator & Nobel Prize Laureate)
"An expert is someone who knows some of the worst mistakes that can be made in his subject
and who manages to avoid them" - Werner Heisenberg (Physicist & Nobel Prize Laureate)
The above definition for experts’ gets us on our way to understanding the
concept of ES. From the definitions we can break down experts as;
Persons
Who have acquired comprehensive knowledge
Within a narrow field/domain
Having learnt from their experiences and from the experiences of others
Still on building a basis for understanding what ES are, we would need to make
reference to the very interesting concept of Artificial Intelligence (AI) i.e. an area within computer science that deals with the automation of intelligent behaviour (Noran). Since AI is in the area of computer science, it employs familiar computer science principles such as programming language, programming technique, algorithm and data & data structure. AI is a very broad aspect of science covering areas such as robotics, game playing, automated reasoning, etc., etc., including expert systems, the study of which dates as early as the 1950’s (Krishnamoorthy & Rajeev, 1996).
Now that we know the motivation for developing ES, have an understanding of who experts are, and also have a rough idea of what AI stands for and the areas it covers, we shall attempt a definition for ES such that it will be easily understood? With reference to several definitions from different authors existing in literature ( (Badiru & Cheung, 2002), (Krishnamoorthy & Rajeev, 1996), (Siler & Buckley, 2005) & (Romem, 2010)), the following convergence points are extracted;
II. ES is a computer-based tool (software/application)
III. ES mimics the thought processes (decision making ability) of humans
IV. ES is designed for solving problems by executing specific tasks (domain
specific)
V. ES equips the less skilled with some of the ability of experts
With the development of DENDRAL by Edward Feigenbaum (in the mid 1960’s to perform the work of an experienced chemist), and MYCIN by Shortliffe (in
Nii Nortey B.C. Lokko Page 15 6/14/2012
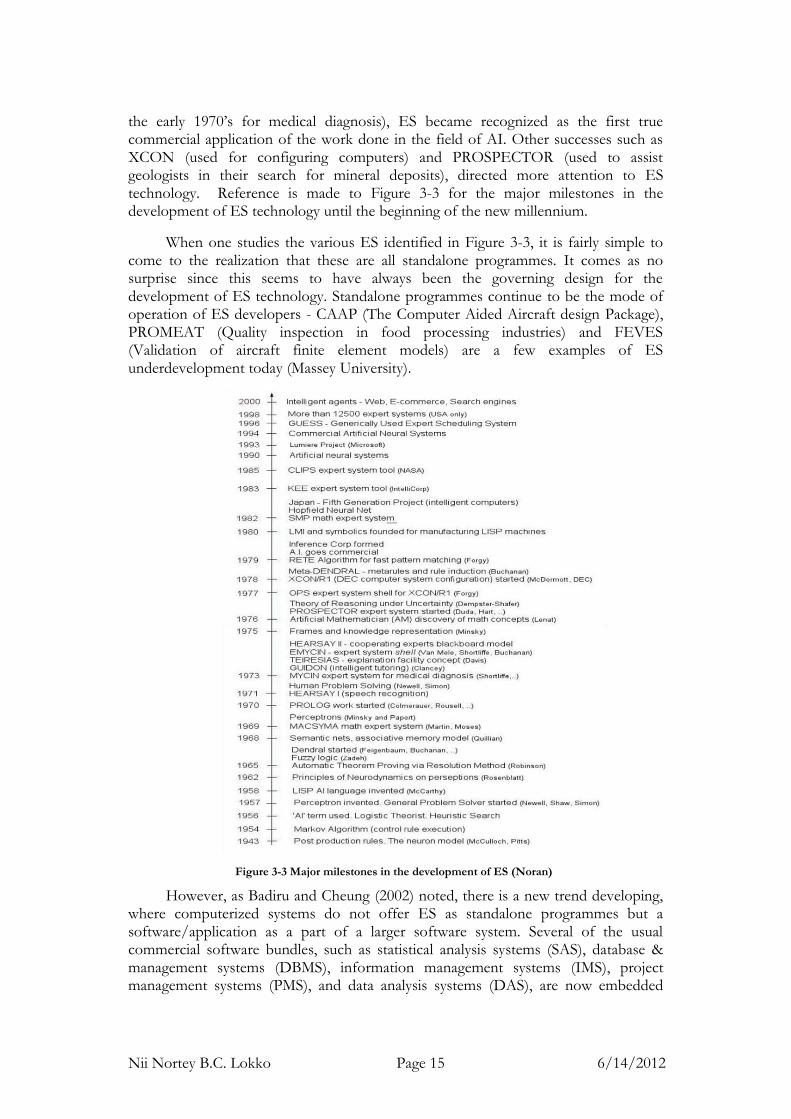
the early 1970’s for medical diagnosis), ES became recognized as the first true commercial application of the work done in the field of AI. Other successes such as XCON (used for configuring computers) and PROSPECTOR (used to assist geologists in their search for mineral deposits), directed more attention to ES technology. Reference is made to Figure 3-3 for the major milestones in the development of ES technology until the beginning of the new millennium.
When one studies the various ES identified in Figure 3-3, it is fairly simple to come to the realization that these are all standalone programmes. It comes as no surprise since this seems to have always been the governing design for the development of ES technology. Standalone programmes continue to be the mode of operation of ES developers - CAAP (The Computer Aided Aircraft design Package), PROMEAT (Quality inspection in food processing industries) and FEVES (Validation of aircraft finite element models) are a few examples of ES underdevelopment today (Massey University).
Figure 3-3 Major milestones in the development of ES (Noran)
However, as Badiru and Cheung (2002) noted, there is a new trend developing, where computerized systems do not offer ES as standalone programmes but a software/application as a part of a larger software system. Several of the usual commercial software bundles, such as statistical analysis systems (SAS), database & management systems (DBMS), information management systems (IMS), project management systems (PMS), and data analysis systems (DAS), are now embedded
Nii Nortey B.C. Lokko Page 16 6/14/2012
with heuristics that represent the ES components of the software bundles. We even have web-based applications that utilize ES technology to capture logic and problem solving processes to deliver online solution e.g. Exsys Corvid (Exsys Inc.).
3.2 How Do We Identify These Systems?
Having been alerted to the shift in the commercial representation of ES, knowing their definition alone will be insufficient information when attempting to identify them from a line of software products. Consequently, we need to be aware of their characteristics, and understand the basic structure and components of any expert system.
Characteristics
Unlike conventional computer programmes, ES are interactive systems, i.e. they respond to questions, ask for clarification, and more importantly make recommendations and assist in the overall decision-making processes (Badiru & Cheung, 2002). These systems do not simply re-organize and re-represent data, file and/or retrieve data, and perform simple/complex calculation as is the case for traditional spreadsheets and decision-support systems, but actually analyze and assess input data/information by using both factual and heuristic knowledge. They have all these added characteristics because they are designed to mimic the thought process of a human expert. Basic reasoning is what most conventional computer programmes are built for. A human expert, on the other hand, solves problems by reasoning logically and by inferring from how much knowledge he/she possesses about the problem. These ES are generally categorized according to their functions as follows:
Learning, interpreting and identifying (e.g. speech/voice identification)
Planning and scheduling (e.g. Just-in-Time production)
Monitoring (e.g. Nuclear facilities)
Debugging and testing (e.g. telephone repair)
Controlling (e.g. air-traffic control in airports)
Instructing and training (e.g. space training simulation)
As already indicated, ES are designed to function within a very narrow area (domain specific) meaning, a diagnostic ES for rotating equipment, such as a turbine, would be programmed to perform only exactly what is needed to troubleshoot a turbine as would a real human turbine expert. So just as a human diagnostic expert may not necessarily be a design expert, a diagnostic ES cannot be used to solve design problems.
Unlike conventional computer programmes that use programming languages such as C, C++ and Fortran, ES employ programming languages as LIPS, PROLOG,
Nii Nortey B.C. Lokko Page 17 6/14/2012
CLIPS and OPS (Siler & Buckley, 2005). We shall however leave the topic of programming languages here because it is out of the scope of the paper. The main purpose here is to know that ES really on programming languages that help emulate thought patterns of human experts.
Structure and Components
As indicated by Badiru and Cheung (2002), and so many other authors, the art of solving complex problems by the use of ES lies within the complex combination of factual and heuristic knowledge. This activity requires that knowledge be organized in a manner that fosters easy retrieval and in a format that can distinguish between data, control structures (parameters) and heuristics. Thus the organization of ES is composed around three main structures:
1. Knowledge base – this is the nucleus of all ES. It consists of a combination
of the organized knowledge (a specific set of rules & procedures within the
application domain for problem solving, that have been captured by a
knowledge engineer using knowledge representation techniques such as
frames, semantic networks, and IF-Then rules) and the database (data & facts
that may or may not be directly related to the application domain).
2. Working memory – this is where all the initial data about the problem are
inputted/received, and the intermediate and final results/recommendations
are displayed/retrieved.
3. Inference engine – this is the physical link between problem and possible
solution. It is the control mechanism that organizes and matches knowledge in
the knowledge base with the problem-specific data so that conclusions can be
drawn and solutions can be found. It employs AI technologies such as ANN,
GA, Fuzzy Logics, etc., that may be used singly or in combination.
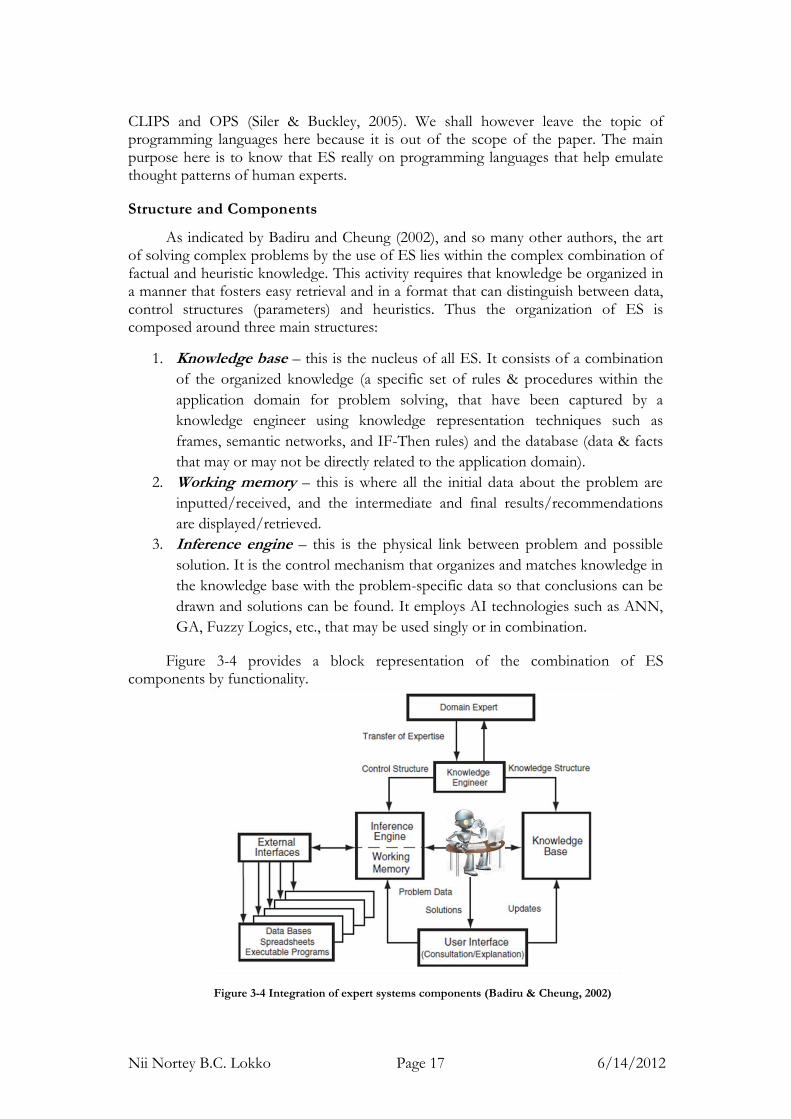
Figure 3-4 provides a block representation of the combination of ES components by functionality.
Figure 3-4 Integration of expert systems components (Badiru & Cheung, 2002)
Nii Nortey B.C. Lokko Page 18 6/14/2012
The inference engine and the working memory together form what developers call the ‘ES shell’.
From the Figure 3-4, we can deduce that the knowledge engineer, who plays a very important role in capturing the domain expert’s knowledge (employing common knowledge acquisition techniques such as protocol-generation, limited information and matrix-based) and designing the control structure, ultimately determines the efficiency and effectiveness of the system. Also, the user (expert/non-expert as the case may be) has the responsibility for providing feedback about the system and the problem scenario such that the knowledge base remains effective.
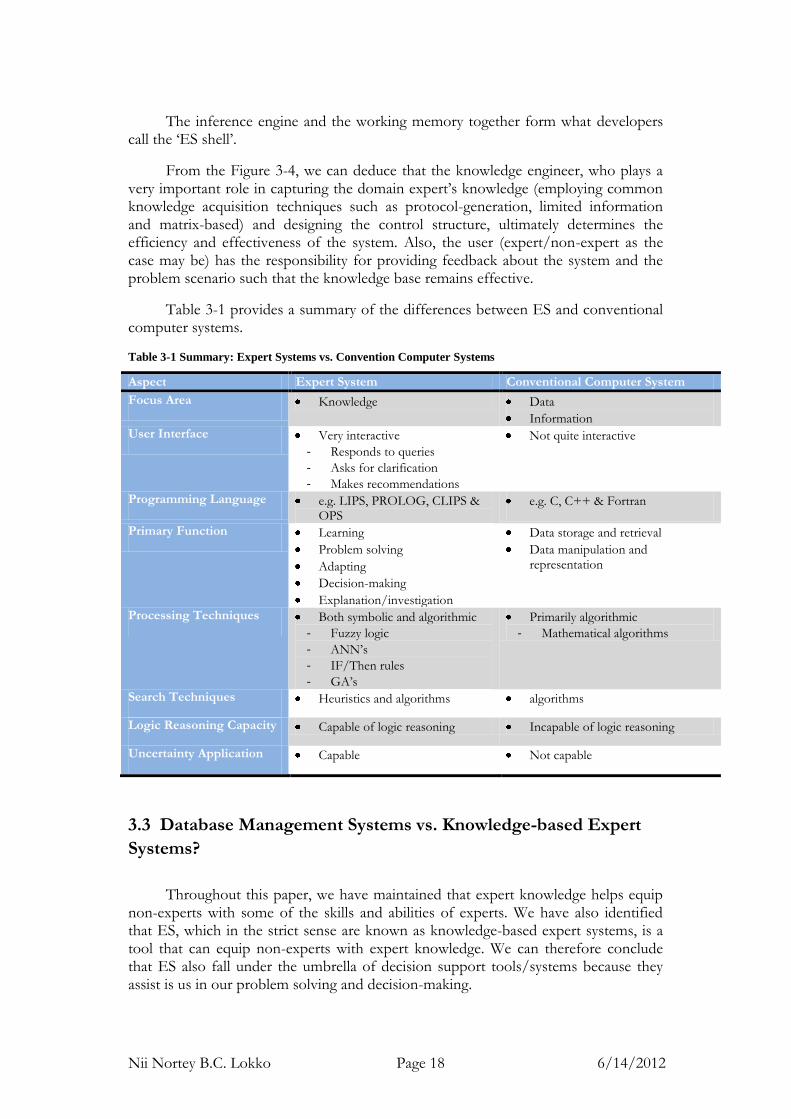
Table 3-1 provides a summary of the differences between ES and conventional computer systems.
Table 3-1 Summary: Expert Systems vs. Convention Computer Systems
Aspect Expert System Conventional Computer System
Focus Area Knowledge Data
Information User Interface Very interactive
- Responds to queries
- Asks for clarification
- Makes recommendations
Not quite interactive
Programming Language e.g. LIPS, PROLOG, CLIPS & OPS
e.g. C, C++ & Fortran
Primary Function Learning
Problem solving
Adapting
Decision-making
Explanation/investigation
Data storage and retrieval
Data manipulation and representation
Processing Techniques Both symbolic and algorithmic
- Fuzzy logic
- ANN’s
- IF/Then rules
- GA’s
Primarily algorithmic
- Mathematical algorithms
Search Techniques Heuristics and algorithms algorithms
Logic Reasoning Capacity Capable of logic reasoning Incapable of logic reasoning
Uncertainty Application Capable Not capable
3.3 Database Management Systems vs. Knowledge-based Expert
Systems?
Throughout this paper, we have maintained that expert knowledge helps equip non-experts with some of the skills and abilities of experts. We have also identified that ES, which in the strict sense are known as knowledge-based expert systems, is a tool that can equip non-experts with expert knowledge. We can therefore conclude that ES also fall under the umbrella of decision support tools/systems because they assist is us in our problem solving and decision-making.
Nii Nortey B.C. Lokko Page 19 6/14/2012
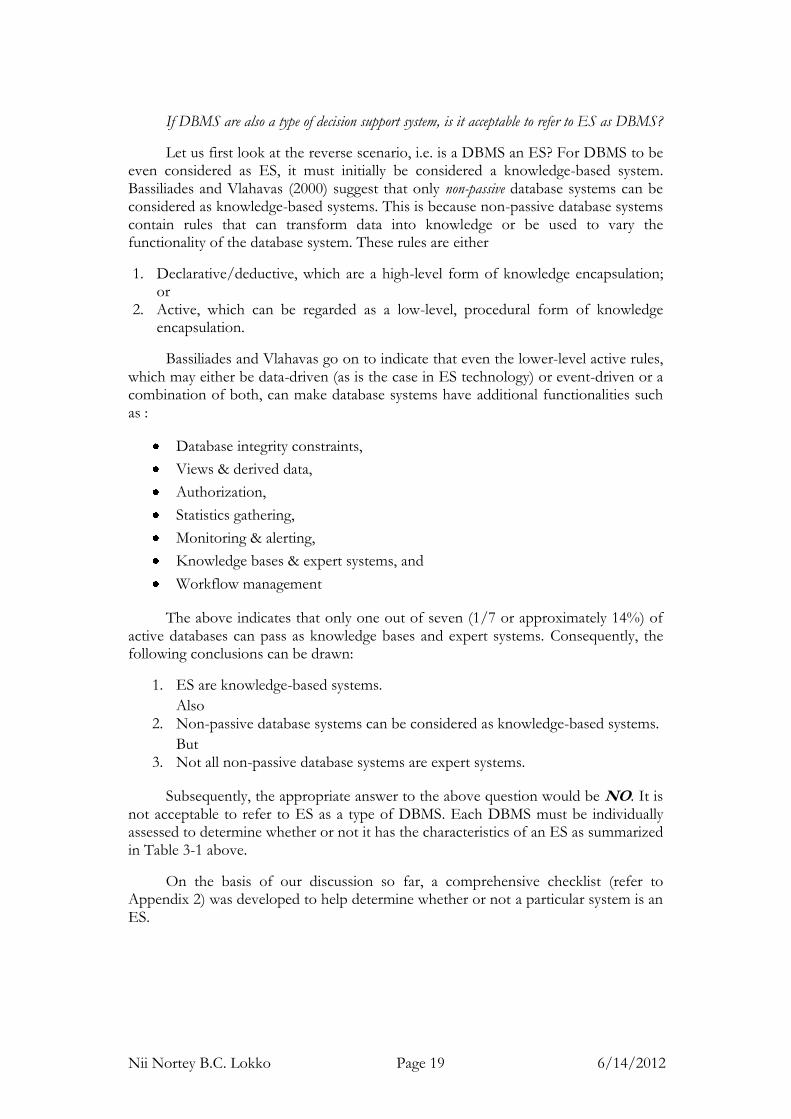
If DBMS are also a type of decision support system, is it acceptable to refer to ES as DBMS?
Let us first look at the reverse scenario, i.e. is a DBMS an ES? For DBMS to be even considered as ES, it must initially be considered a knowledge-based system. Bassiliades and Vlahavas (2000) suggest that only non-passive database systems can be considered as knowledge-based systems. This is because non-passive database systems contain rules that can transform data into knowledge or be used to vary the functionality of the database system. These rules are either
1. Declarative/deductive, which are a high-level form of knowledge encapsulation; or
2. Active, which can be regarded as a low-level, procedural form of knowledge encapsulation.
Bassiliades and Vlahavas go on to indicate that even the lower-level active rules, which may either be data-driven (as is the case in ES technology) or event-driven or a combination of both, can make database systems have additional functionalities such as :
Database integrity constraints,
Views & derived data,
Authorization,
Statistics gathering,
Monitoring & alerting,
Knowledge bases & expert systems, and
Workflow management
The above indicates that only one out of seven (1/7 or approximately 14%) of active databases can pass as knowledge bases and expert systems. Consequently, the following conclusions can be drawn:
1. ES are knowledge-based systems.
Also 2. Non-passive database systems can be considered as knowledge-based systems.
But 3. Not all non-passive database systems are expert systems.
Subsequently, the appropriate answer to the above question would be NO. It is not acceptable to refer to ES as a type of DBMS. Each DBMS must be individually assessed to determine whether or not it has the characteristics of an ES as summarized in Table 3-1 above.
On the basis of our discussion so far, a comprehensive checklist (refer to Appendix 2) was developed to help determine whether or not a particular system is an ES.
Nii Nortey B.C. Lokko Page 20 6/14/2012
3.4 Expert Systems Application
We know ES was generally developed for problem solving. Consequently we will now establish which type of problems and in which areas ES is most applicable.
Problems
Engineering (and our focus area, asset maintenance) problems can be
categorized in two ways;
Category 1 – by the frequency of occurrence or
Category 2 – by the manner in which it propagates (or is modeled).
Combining them provides a 2x2 matrix as shown in Figure 3-5 below.
Figure 3-5 Engineering problem categorization and evaluation
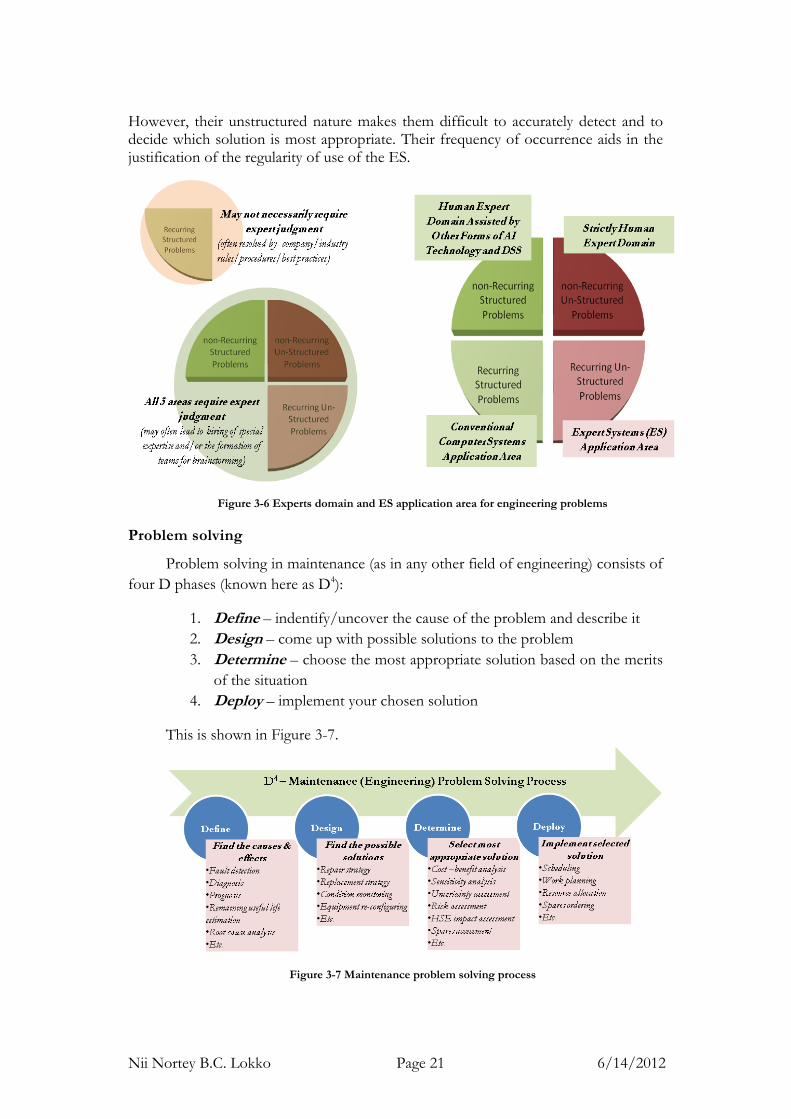
Unstructured problems are generally the most difficult to diagnose because they almost never happen in the same manner. Specific expertise is required to be able to make any diagnosis that is close to being accurate. Non-recurring problems are generally the most difficult to solve because not much information on them has been captured. Here also, expertise is required to be able to design solutions from first principles. Consequently, this makes non-recurring unstructured problems the most difficult to deal with.
On the other hand, recurring unstructured problems are perfect candidates for ES application. Enough is known about them from their frequent occurrences.
Nii Nortey B.C. Lokko Page 21 6/14/2012
However, their unstructured nature makes them difficult to accurately detect and to decide which solution is most appropriate. Their frequency of occurrence aids in the justification of the regularity of use of the ES.
Figure 3-6 Experts domain and ES application area for engineering problems
Problem solving
Problem solving in maintenance (as in any other field of engineering) consists of
four D phases (known here as D4):
1. Define – indentify/uncover the cause of the problem and describe it
2. Design – come up with possible solutions to the problem
3. Determine – choose the most appropriate solution based on the merits
of the situation
4. Deploy – implement your chosen solution
This is shown in Figure 3-7.
Figure 3-7 Maintenance problem solving process
Nii Nortey B.C. Lokko Page 22 6/14/2012
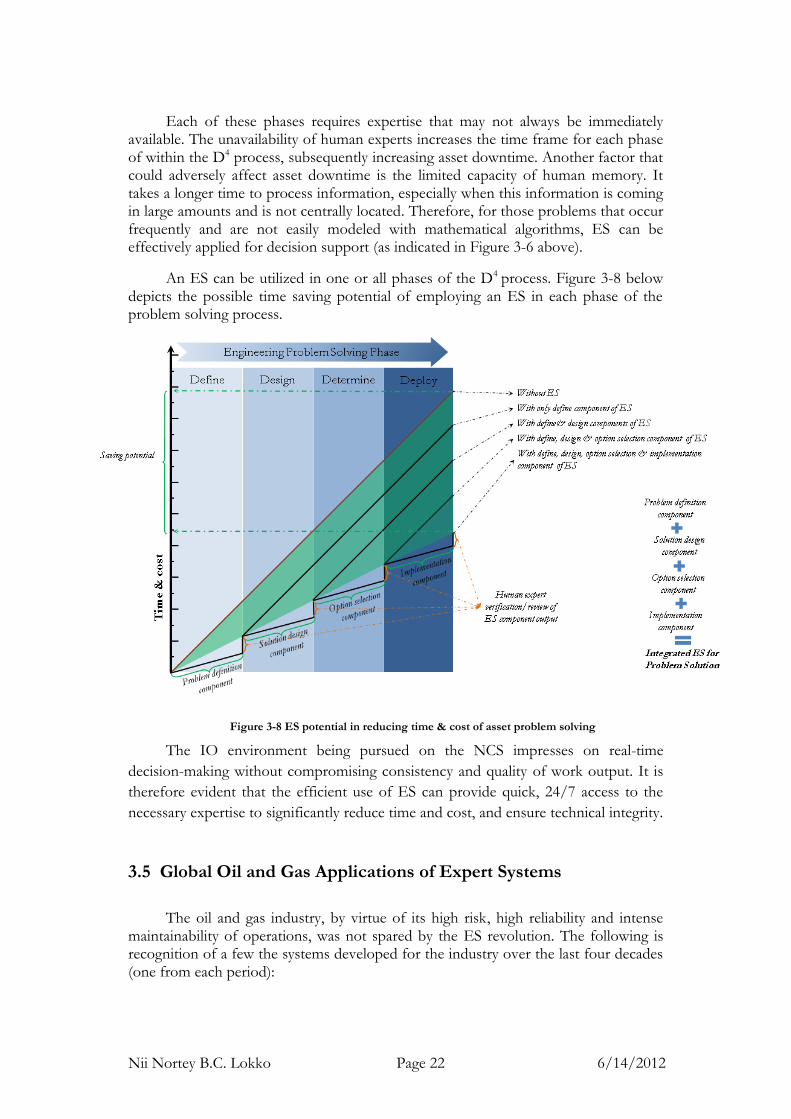
Each of these phases requires expertise that may not always be immediately available. The unavailability of human experts increases the time frame for each phase of within the D4 process, subsequently increasing asset downtime. Another factor that could adversely affect asset downtime is the limited capacity of human memory. It takes a longer time to process information, especially when this information is coming in large amounts and is not centrally located. Therefore, for those problems that occur frequently and are not easily modeled with mathematical algorithms, ES can be effectively applied for decision support (as indicated in Figure 3-6 above).
An ES can be utilized in one or all phases of the D4 process. Figure 3-8 below depicts the possible time saving potential of employing an ES in each phase of the problem solving process.
Figure 3-8 ES potential in reducing time & cost of asset problem solving
The IO environment being pursued on the NCS impresses on real-time
decision-making without compromising consistency and quality of work output. It is
therefore evident that the efficient use of ES can provide quick, 24/7 access to the
necessary expertise to significantly reduce time and cost, and ensure technical integrity.
3.5 Global Oil and Gas Applications of Expert Systems
The oil and gas industry, by virtue of its high risk, high reliability and intense maintainability of operations, was not spared by the ES revolution. The following is recognition of a few the systems developed for the industry over the last four decades (one from each period):
Nii Nortey B.C. Lokko Page 23 6/14/2012
The 1st international conference on Industrial and engineering applications of
artificial intelligence and expert systems saw the presentation of APDS
(Automated Project Design System). This system, when provided with
feedstock and product specifications, delivers a preliminary process flow
diagram that indicates all the major pieces of equipment needed and
determines all utility system requirements i.e. it was developed, “to assist
process and facilities engineers in performing preliminary feasibility studies,
optimization studies, and provide the basic information required for the
initiation of the detailed design for offshore oil and gas production facilities”
(Aghili, Montgomery, Amlani, & Shah, 1988)
In the field of corrosion control design, WELLMATE (an expert system
developed by Agip SpA in collaboration with Cescor) was presented in a 1994
Society of Petroleum Engineers conference paper. It was developed as, “an
advisor for corrosion evaluation in oil and gas production wells and to support
the user in the proper selection of metallic materials, as well as of the optimum
corrosion control option” (Kopliku & Condanni, 1994).
The LDSO (Laser Drilling System Optimizer) presented in the Computational
Intelligence for Modelling, Control and Automation, 2005 and International
Conference on Intelligent Agents, Web Technologies and Internet Commerce
International Conference, is supposed to be the, “first type of system for laser
drilling in the oil and gas industry,” that helps reduce drilling time, decrease
A recent publication in InTech (an internet open access for free available
academic resources in the fields of Science, Technology and Medicine) by
Ahmed Hegazy (2012) presents, ‘A New Expert System for Load Shedding in
Oil & Gas Plants.’ This system is developed using MATHLAB and is
supported by another tool (software package for power system analysis)
known as ETAP. The paper suggests that this new expert system is, “better
than the traditional stand-alone under frequency relays that sense the
frequency and trip under pre-defined values which are not responsive
dynamically to the system.”
Figure 3-9 depicts some notable ES applications in the O&G industry over the last four decades.
Nii Nortey B.C. Lokko Page 24 6/14/2012
Figure 3-9 Time series of some notable ES application in the O&G industry
The above list of ES application with the O&G industry highlights corrosion control as the most popular area within O&M that has seen its application. Kopliku and Cescor (1994) say this is due to the fact that, “the role of the human expert is still fundamental” in the field of material selection and corrosion. They attribute this to the fact that the high degree of uncertainty with regards the knowledge on corrosion phenomena renders it unsuitable (with very few exceptions) for mathematical algorithmic modeling/representation.
3.6 Maintenance Applications of Expert Systems
This study is directed at HSE as regards technical integrity. Consequently, we shift our focus of ES applications to maintenance. Kobbacy (2008) acknowledges that maintenance in many industrial organizations is such a key area that AI technologies (in this case ES) have been applied to and successfully employed for decision-making, modeling and the optimization of maintenance problems.
Figure 3-10 depicts notable ES applications in maintenance across different industries.
Nii Nortey B.C. Lokko Page 25 6/14/2012
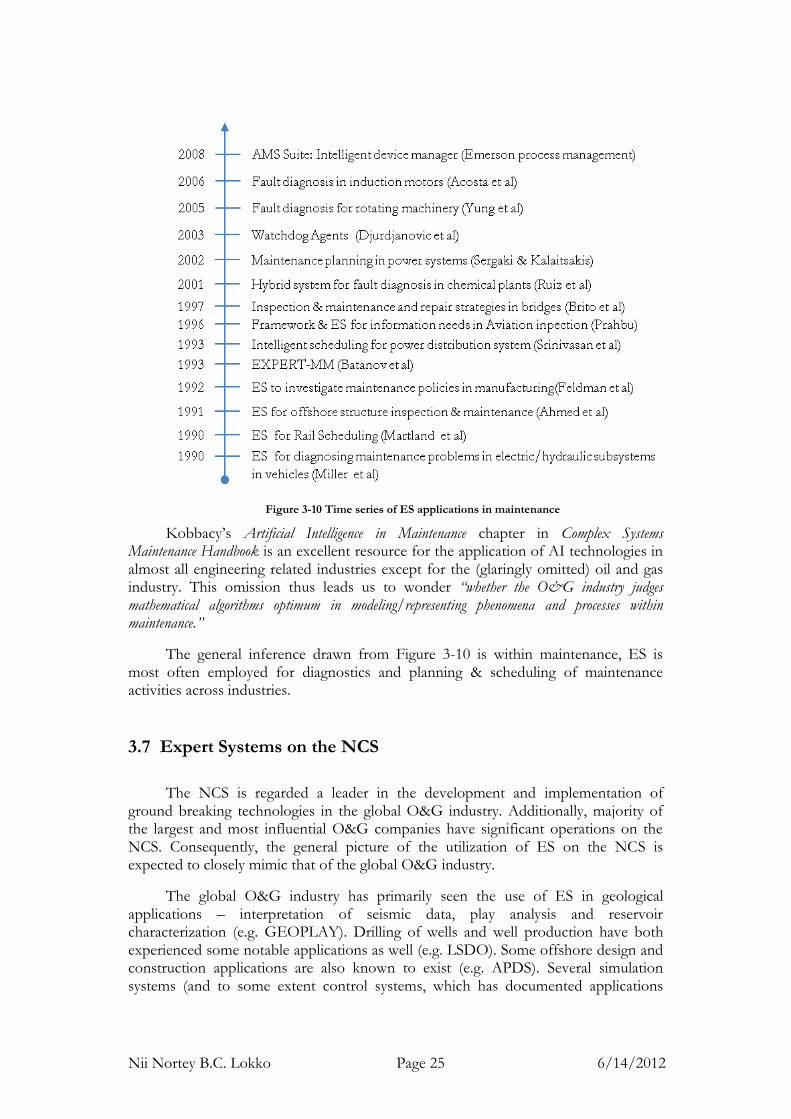
Figure 3-10 Time series of ES applications in maintenance
Kobbacy’s Artificial Intelligence in Maintenance chapter in Complex Systems Maintenance Handbook is an excellent resource for the application of AI technologies in almost all engineering related industries except for the (glaringly omitted) oil and gas industry. This omission thus leads us to wonder “whether the O&G industry judges mathematical algorithms optimum in modeling/representing phenomena and processes within maintenance.”
The general inference drawn from Figure 3-10 is within maintenance, ES is most often employed for diagnostics and planning & scheduling of maintenance activities across industries.
3.7 Expert Systems on the NCS
The NCS is regarded a leader in the development and implementation of ground breaking technologies in the global O&G industry. Additionally, majority of the largest and most influential O&G companies have significant operations on the NCS. Consequently, the general picture of the utilization of ES on the NCS is expected to closely mimic that of the global O&G industry.
The global O&G industry has primarily seen the use of ES in geological applications – interpretation of seismic data, play analysis and reservoir characterization (e.g. GEOPLAY). Drilling of wells and well production have both experienced some notable applications as well (e.g. LSDO). Some offshore design and construction applications are also known to exist (e.g. APDS). Several simulation systems (and to some extent control systems, which has documented applications
Nii Nortey B.C. Lokko Page 26 6/14/2012
within the nuclear industry) are known to possess some ES components. Subsequently, we reluctantly add operations to the list.
To get a picture of the utilization of ES on the NCS, a vendor/supplier search was conducted looking at providers of hardware, software and information management products/services. Bearing in mind that the focus of this study is in the area of asset management (maintenance of topside equipment), companies that provided inspection, maintenance and repair products/services were also considered in this search. The main criterion for selecting a vendor/supplier/provider was that it had a footprint on the NCS. This means at least one of three things:
1. The company’s head office is registered/located in Norway;
2. The company has one of its branch offices in Norway; or
3. The company has O&G clients in the NCS.
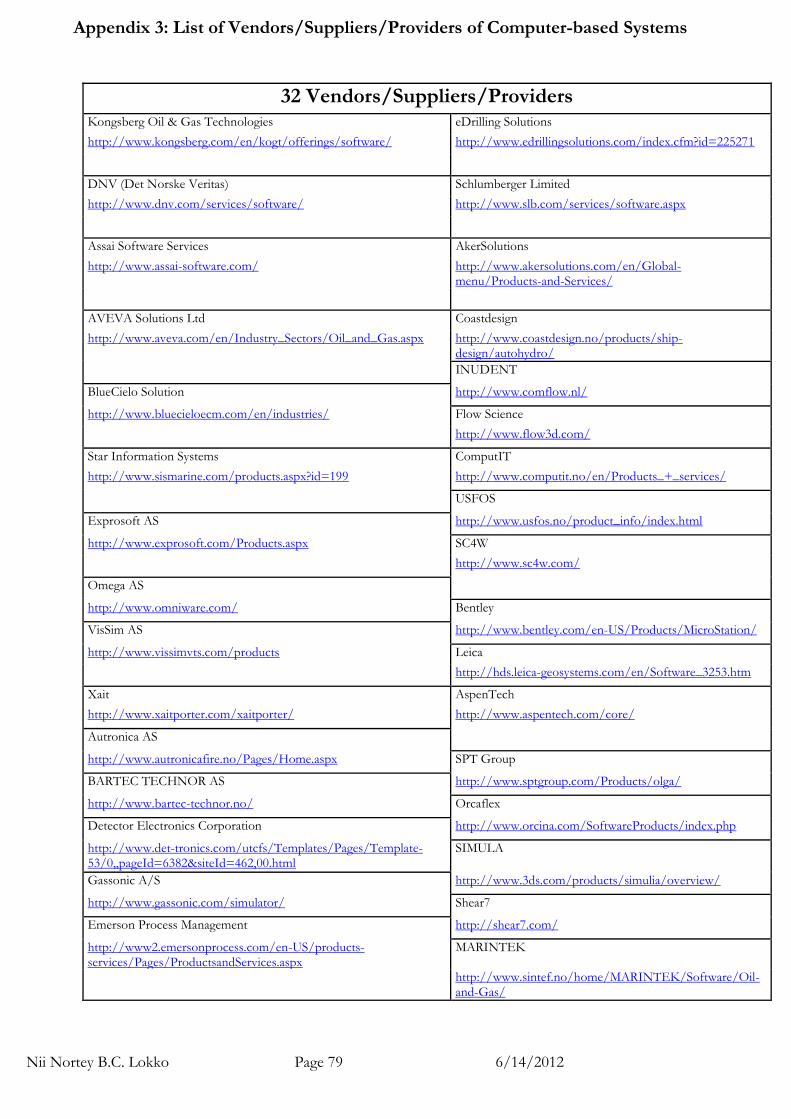
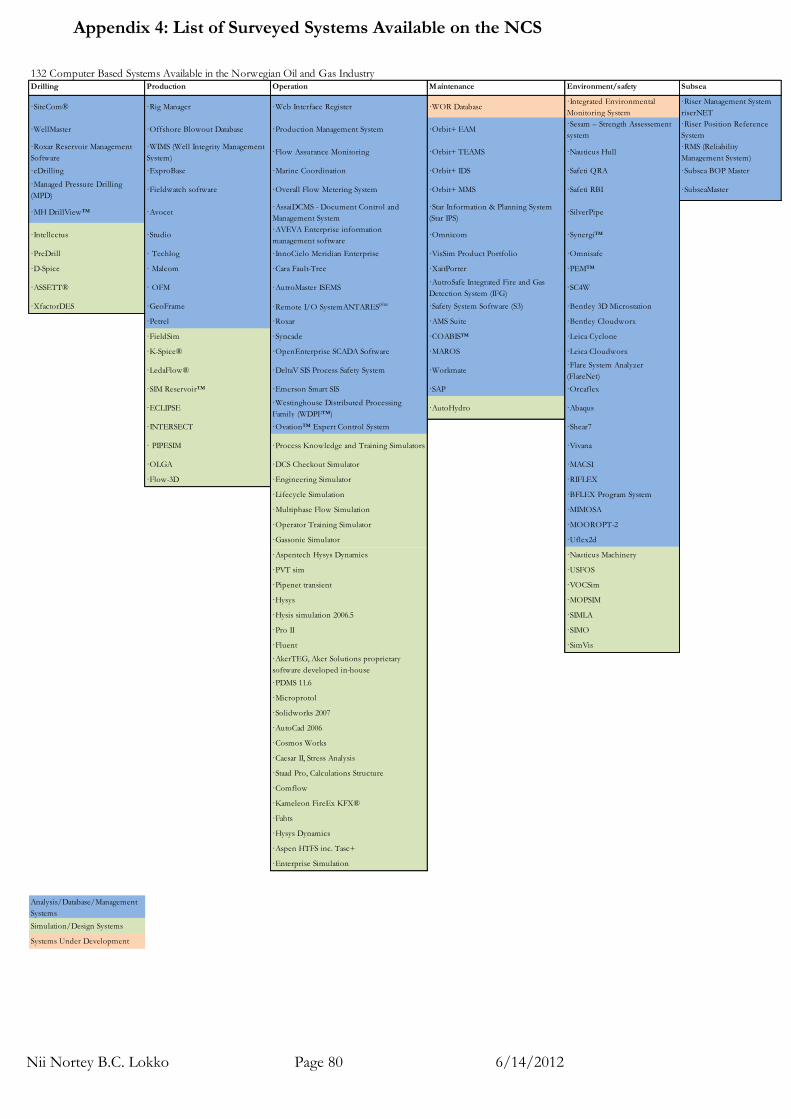
Thirty two (32) such vendors/suppliers/providers were investigated. Refer to Appendix 3 for the full list of companies.
Since we have already established a trend where systems providers/developers present ES applications as a part of a larger software system, we added statistical analysis systems, database & management systems, information management systems, project management systems, and data analysis systems to the search criteria. On the basis of this, one hundred and thirty two (132) software applications/systems were investigated. The functional description of these systems were analyzed and categorized according to its main area of application as indicated in the Figure 3-7 below. It is worth noting that in-house developed applications/systems were not covered in this search. This was due to time constraints and the fact that information about such applications/systems is not readily available to the general public. Refer to Appendix 4 for a list of all surveyed software applications/systems available to (or being used by) O&G companies on the NCS.
Figure 3-11 Category of surveyed systems on available on the NCS
Nii Nortey B.C. Lokko Page 27 6/14/2012
About half (48%) of the software/systems surveyed were in the domain of operations and maintenance. Add environment/safety to it and we have close to three quarters (72%). This gives an indication of the main target areas for software/system developers – operations, environment/safety and production respectively.
Most simulation and design systems (especially within drilling and production) are universally known to contain expert rules which have been collected from human experts based on their numerous years of experience dealing with problems within those areas. Simulators assist in:
Investigating the consequences of alterations/deviations.
Recognizing possible problematic area.
Forecasting the outcome and direction of events.
Providing insight into why observable events occur.
Assessing system inadequacies.
Overall, simulators are designed to behave like experts (i.e. establish the feasibility of potential actions). Subsequently, majority of these systems may be considered ES. Of the 132 software/systems surveyed, less than 40% were either simulation or design. Drilling (45%), production (48%) and operation (59%) together averaged about 50% simulation/design software/systems. Consequently, we may infer that the NCS has some application of ES within drilling, production and facilities operation. A similar conclusion cannot be drawn for maintenance, environment/safety or subsea (which together average less than 10% simulation/design software/systems).
The remaining 63% of the software/systems surveyed were analysis, database or management related. Basing our argument only on the fact that 1/7 active database management systems may be knowledge bases (ES), as earlier indicated, then this implies 11 of the 83 software/systems may be ES. For maintenance, this would translate to 2 of the 16. For environment/safety this translates to 3 of the 25. This gives inconclusive results. Consequently, we tried to match the functional product descriptions with the ES summary table and checklist we had developed previously. Again, the results were inconclusive because information provided about these systems was not detailed enough. One thing was evident though, almost all did not indicate an interactive user interface (an interface that requests information provides feedback and is able to explain its results and make recommendations). However for environment/safety we may say there is some kind of ES application because this area deals with a considerable level of uncertainty modeling and as such, the software/systems would have to contain some form of expert rules for this purpose. Also there was an acceptable number of simulation/design systems identified in this area.
Turning our attention to our focus area, another approach may be used to establish the application of ES in maintenance. We shall examine the type of maintenance strategy being practiced on the NCS. Lee and Wang (2008) suggest that the maintenance strategy during the course of history has been dependent on the maintenance technologies available. They describe these strategies as follows:
Nii Nortey B.C. Lokko Page 28 6/14/2012
No maintenance (NM) – no repair is made because the technology/maintenance technique is unavailable or it just isn’t worth fixing due to extreme costs.
Reactive maintenance (RM) – the maintenance technique/technology is available for cost effective repairs but since not much information is known about failure modes and frequencies and as such, failure has to occur before any maintenance actions are taken.
Preventive maintenance (PrvM) – information is available about failure frequencies. Subsequently, maintenance actions are scheduled/undertaken to prevent failure. Either age-dependent policies (using indices such as MTBF and MTTR) or periodic policies (using fixed time intervals) are employed. There is still not much knowledge on failure modes and rates, and as a result maintenance actions are time-based with little consideration for the prevailing equipment health.
Predictive maintenance (PrdM) – the technology for monitoring current equipment health status and identifying failure modes and establishing failure rates is available and as such maintenance actions are more on a just-in-time basis. The predictive maintenance regime demands a technology – human collaboration that utilizes all available data (design, performance, diagnostic, operator logs and maintenance history) for timely maintenance decisions.
Proactive maintenance (which we prefer to call Dynamic maintenance (DM)) – an emerging concept which looks at seamlessly integrating information over remote access networks (e.g. wireless internet or satellite). It bothers on three dimensions: 1) enhanced monitoring, prediction and optimization of equipment performance; 2) avoiding the conditions that lead to faults and degradation (i.e. prevent/fix root causes); and 3) improving all aspects of equipment lifecycle by sharing maintenance information with equipment designers and production & operation teams.
Self-maintenance (SM) – a new design and systems concept that seeks to make equipment undertake the monitoring, diagnosis and repair by themselves. Higher levels of machine intelligence are required to ensure that the machine is clever enough to recover and maintain the required functionality. The self-maintenance concept also looks at self-service triggering abilities. This implies that the machine sends a service request, based on its self monitoring and prognostic capabilities, before failure actually occurs.
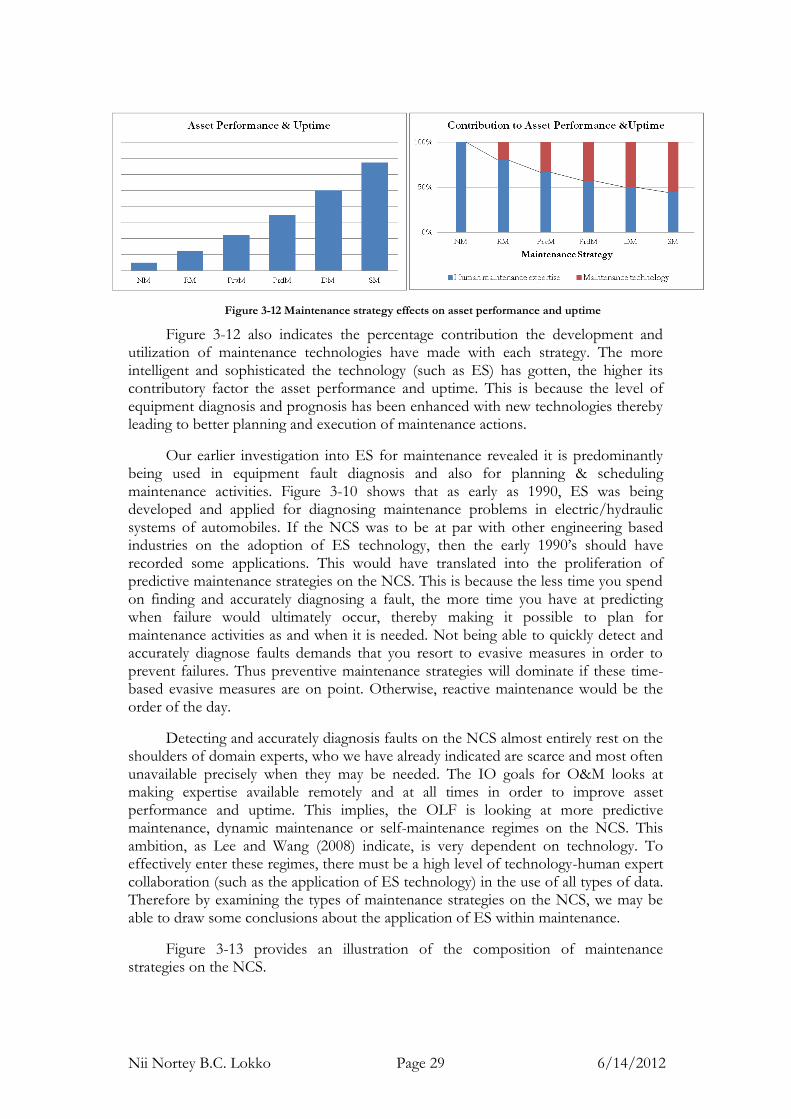
It is evident here that the level each maintenance strategy improves upon the previous, is mainly due to the development and incorporation of more sophisticated maintenance technologies. This has contributed to increasing asset performance and uptime as shown in Figure 3-12.
Nii Nortey B.C. Lokko Page 29 6/14/2012
Figure 3-12 Maintenance strategy effects on asset performance and uptime
Figure 3-12 also indicates the percentage contribution the development and utilization of maintenance technologies have made with each strategy. The more intelligent and sophisticated the technology (such as ES) has gotten, the higher its contributory factor the asset performance and uptime. This is because the level of equipment diagnosis and prognosis has been enhanced with new technologies thereby leading to better planning and execution of maintenance actions.
Our earlier investigation into ES for maintenance revealed it is predominantly being used in equipment fault diagnosis and also for planning & scheduling maintenance activities. Figure 3-10 shows that as early as 1990, ES was being developed and applied for diagnosing maintenance problems in electric/hydraulic systems of automobiles. If the NCS was to be at par with other engineering based industries on the adoption of ES technology, then the early 1990’s should have recorded some applications. This would have translated into the proliferation of predictive maintenance strategies on the NCS. This is because the less time you spend on finding and accurately diagnosing a fault, the more time you have at predicting when failure would ultimately occur, thereby making it possible to plan for maintenance activities as and when it is needed. Not being able to quickly detect and accurately diagnose faults demands that you resort to evasive measures in order to prevent failures. Thus preventive maintenance strategies will dominate if these time-based evasive measures are on point. Otherwise, reactive maintenance would be the order of the day.
Detecting and accurately diagnosis faults on the NCS almost entirely rest on the shoulders of domain experts, who we have already indicated are scarce and most often unavailable precisely when they may be needed. The IO goals for O&M looks at making expertise available remotely and at all times in order to improve asset performance and uptime. This implies, the OLF is looking at more predictive maintenance, dynamic maintenance or self-maintenance regimes on the NCS. This ambition, as Lee and Wang (2008) indicate, is very dependent on technology. To effectively enter these regimes, there must be a high level of technology-human expert collaboration (such as the application of ES technology) in the use of all types of data. Therefore by examining the types of maintenance strategies on the NCS, we may be able to draw some conclusions about the application of ES within maintenance.
Figure 3-13 provides an illustration of the composition of maintenance strategies on the NCS.
Nii Nortey B.C. Lokko Page 30 6/14/2012
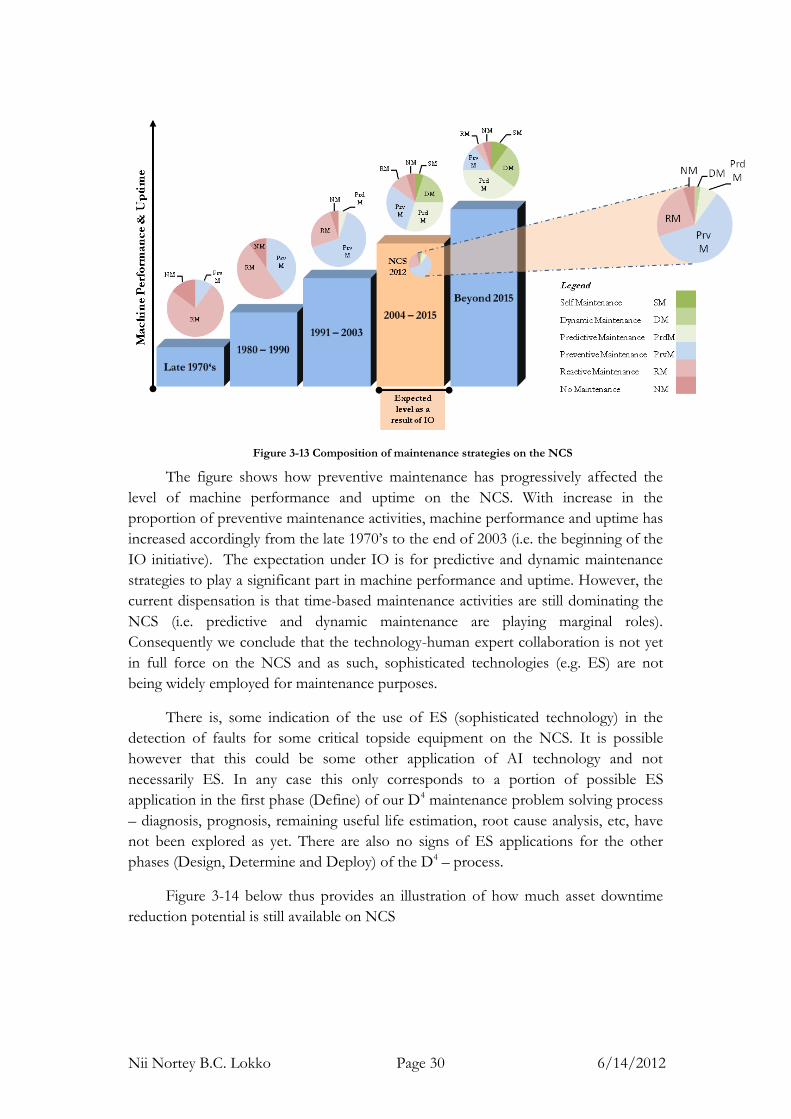
Figure 3-13 Composition of maintenance strategies on the NCS
The figure shows how preventive maintenance has progressively affected the
level of machine performance and uptime on the NCS. With increase in the
proportion of preventive maintenance activities, machine performance and uptime has
increased accordingly from the late 1970’s to the end of 2003 (i.e. the beginning of the
IO initiative). The expectation under IO is for predictive and dynamic maintenance
strategies to play a significant part in machine performance and uptime. However, the
current dispensation is that time-based maintenance activities are still dominating the
NCS (i.e. predictive and dynamic maintenance are playing marginal roles).
Consequently we conclude that the technology-human expert collaboration is not yet
in full force on the NCS and as such, sophisticated technologies (e.g. ES) are not
being widely employed for maintenance purposes.
There is, some indication of the use of ES (sophisticated technology) in the
detection of faults for some critical topside equipment on the NCS. It is possible
however that this could be some other application of AI technology and not
necessarily ES. In any case this only corresponds to a portion of possible ES
application in the first phase (Define) of our D4 maintenance problem solving process
– diagnosis, prognosis, remaining useful life estimation, root cause analysis, etc, have
not been explored as yet. There are also no signs of ES applications for the other
phases (Design, Determine and Deploy) of the D4 – process.
Figure 3-14 below thus provides an illustration of how much asset downtime
reduction potential is still available on NCS
Nii Nortey B.C. Lokko Page 31 6/14/2012
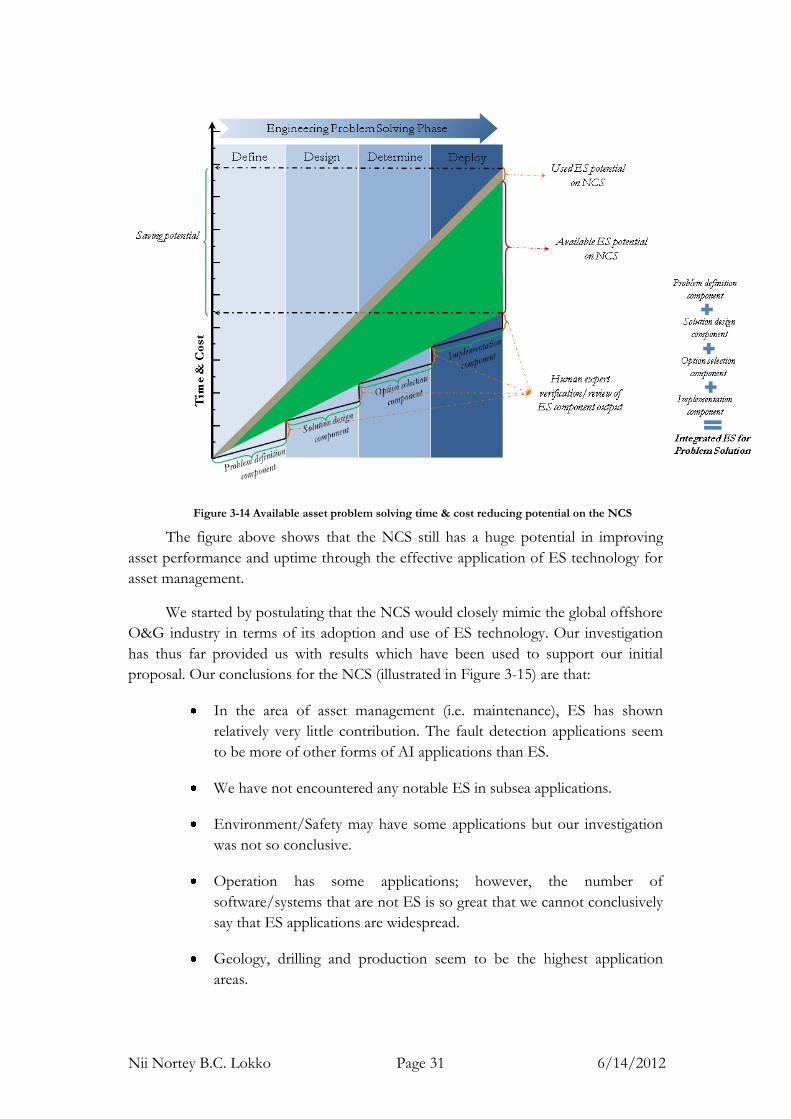
Figure 3-14 Available asset problem solving time & cost reducing potential on the NCS
The figure above shows that the NCS still has a huge potential in improving
asset performance and uptime through the effective application of ES technology for
asset management.
We started by postulating that the NCS would closely mimic the global offshore
O&G industry in terms of its adoption and use of ES technology. Our investigation
has thus far provided us with results which have been used to support our initial
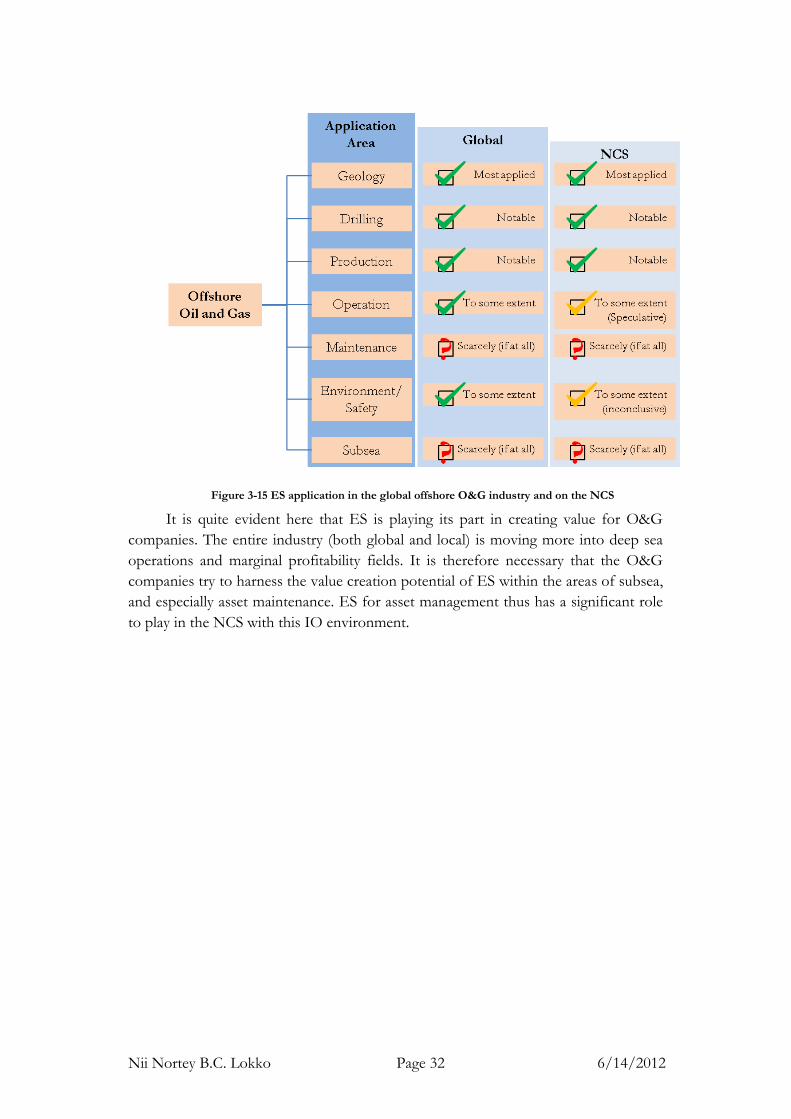
proposal. Our conclusions for the NCS (illustrated in Figure 3-15) are that:
In the area of asset management (i.e. maintenance), ES has shown
relatively very little contribution. The fault detection applications seem
to be more of other forms of AI applications than ES.
We have not encountered any notable ES in subsea applications.
Environment/Safety may have some applications but our investigation
was not so conclusive.
Operation has some applications; however, the number of
software/systems that are not ES is so great that we cannot conclusively
say that ES applications are widespread.
Geology, drilling and production seem to be the highest application
areas.
Nii Nortey B.C. Lokko Page 32 6/14/2012
Figure 3-15 ES application in the global offshore O&G industry and on the NCS
It is quite evident here that ES is playing its part in creating value for O&G
companies. The entire industry (both global and local) is moving more into deep sea
operations and marginal profitability fields. It is therefore necessary that the O&G
companies try to harness the value creation potential of ES within the areas of subsea,
and especially asset maintenance. ES for asset management thus has a significant role
to play in the NCS with this IO environment.
Nii Nortey B.C. Lokko Page 33 6/14/2012
Chapter 4 Case Studies: Multiple Companies
Figure 4-1 A Sample of potential survey candidates
This section begins the second part of this report and builds upon the literature review and analysis carried out in the first part. The second part is based on multiple case studies conducted to investigate the role of ES/DSS in value creation under the ongoing developments on the NCS.
4.1 The Industrial Survey
Four (4) persons from four (4) companies took part in the survey:
One (1) from company A – an O&G operating company
One (1) from company B – an O&G operating company
One (1) from company C – an O&G operating company
One (1) from company D – an O&G maintenance service provider
Due to matters relating to company and product confidentially, this report will not directly name or refer to any individual/product/company. We will simply go by the, Case 1: interviewee from company A about system A, Case 2: interviewee from company B about system B, and so on and so forth.
Nii Nortey B.C. Lokko Page 34 6/14/2012
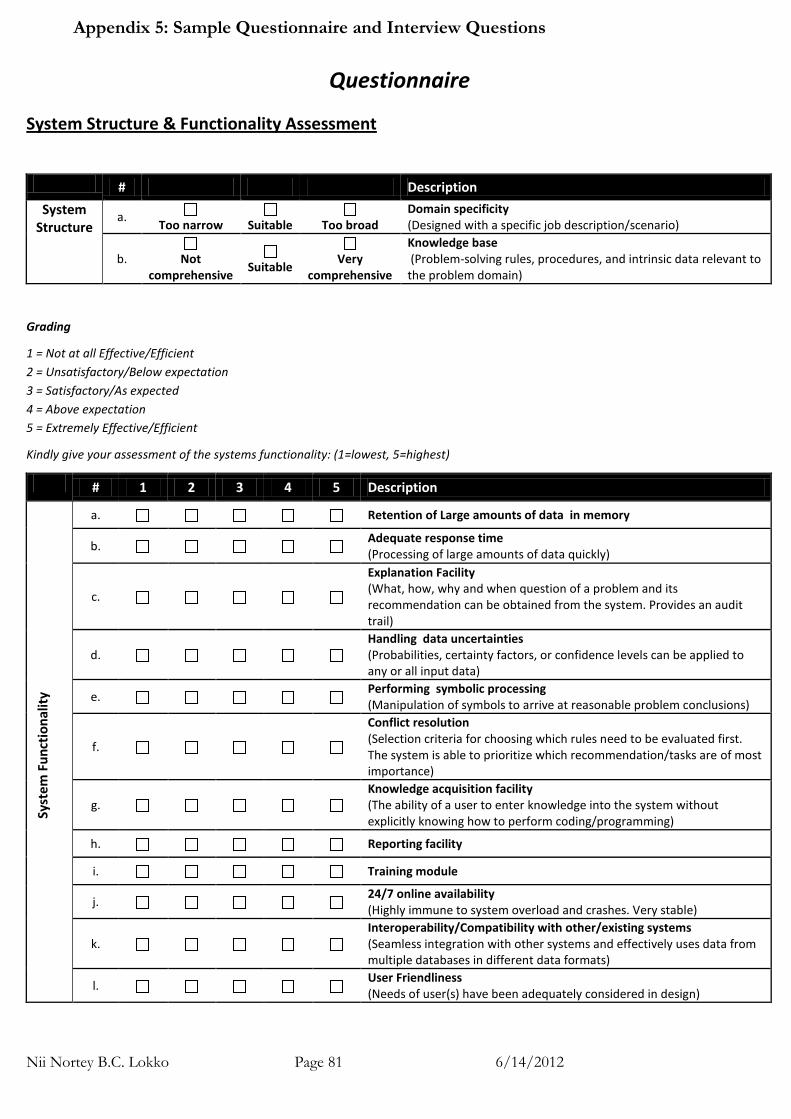
This survey was in two parts: interviews and questionnaire administration.
The Interview
Interview sessions were scheduled with highly experienced persons from O&G companies whose area of responsibility was either in asset management of topside equipment or in integrated operations command centers. Each interview session as conducted over a 30 minute period (sometimes less or more depending on whether the interviewee had enough time to spare). The interview session covered three (3) main areas;
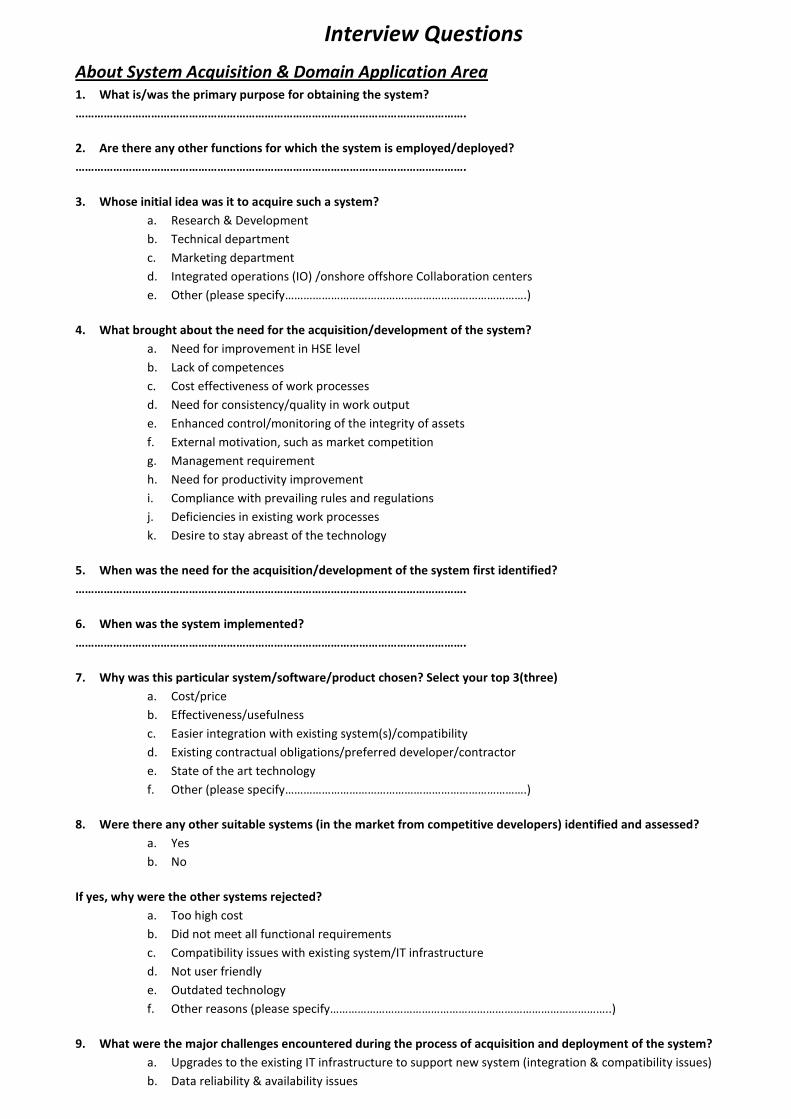
1. System acquisition and domain application area – the purpose was to look for ‘what’, ‘why’ and ‘how’ ES/DSS were acquired and also tried to identify factors/challenges that affected their implementation. 9 questions were asked.
2. Experts and expert knowledge – the aim was to explore the availability/scarcity of expertise within maintenance and how this affected maintenance activities. We also looked at willingness to use ES/DSS and where their impact is most observable. 10 questions were asked.
3. Impact of IO on organization and work processes – the focus was IO’s impact on the need for innovative technology and the acceptance of such technology by employees, expertise requirement under IO, and the part ES/DSS play (or will play) in the attainment of the O&M goals under IO. 8 questions were asked.
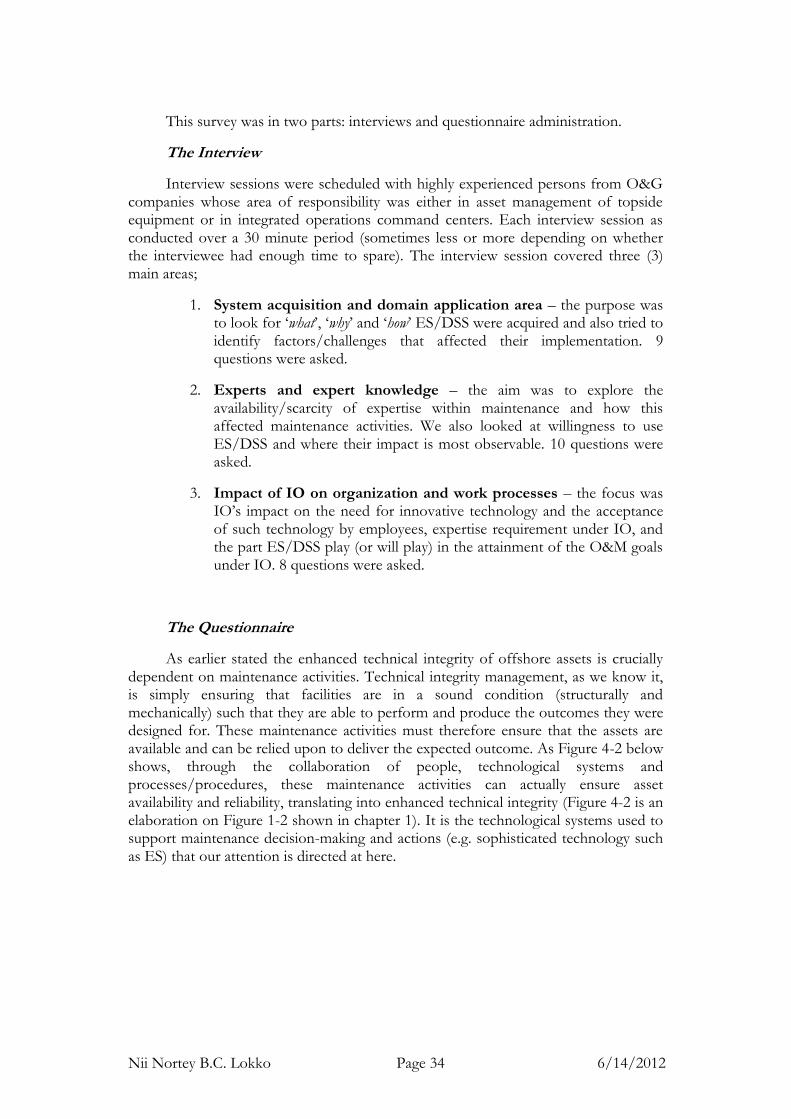
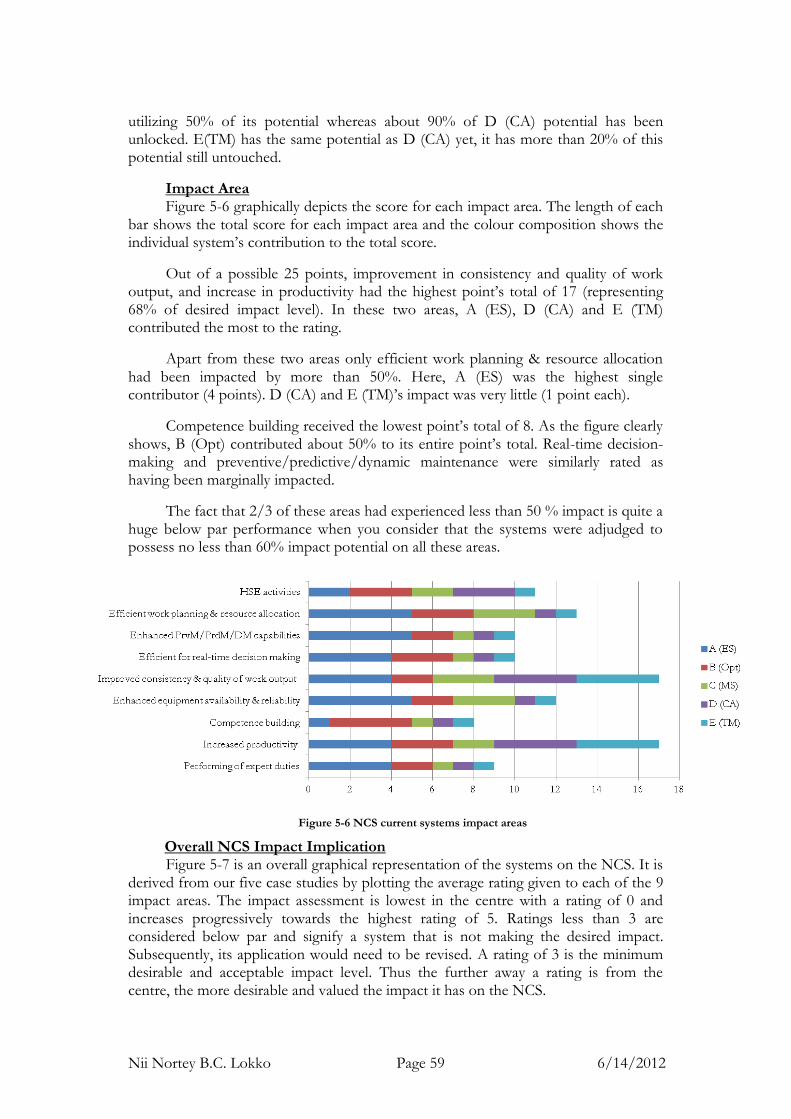
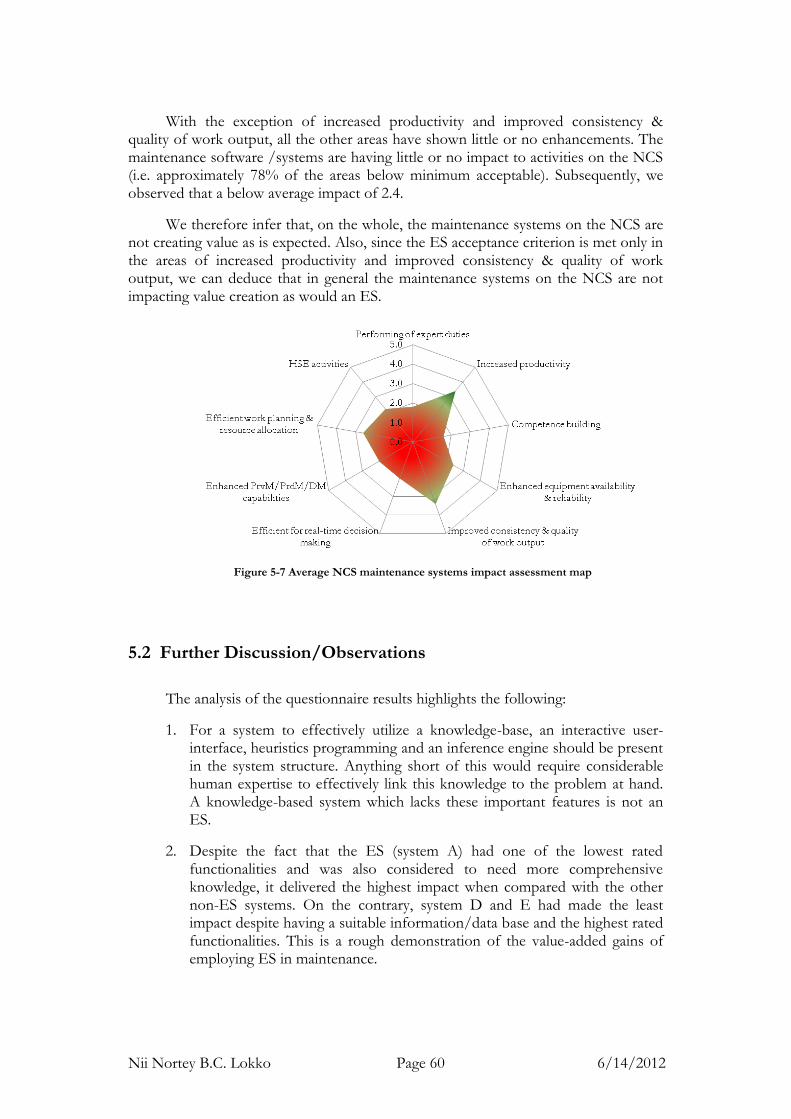
The Questionnaire
As earlier stated the enhanced technical integrity of offshore assets is crucially dependent on maintenance activities. Technical integrity management, as we know it, is simply ensuring that facilities are in a sound condition (structurally and mechanically) such that they are able to perform and produce the outcomes they were designed for. These maintenance activities must therefore ensure that the assets are available and can be relied upon to deliver the expected outcome. As Figure 4-2 below shows, through the collaboration of people, technological systems and processes/procedures, these maintenance activities can actually ensure asset availability and reliability, translating into enhanced technical integrity (Figure 4-2 is an elaboration on Figure 1-2 shown in chapter 1). It is the technological systems used to support maintenance decision-making and actions (e.g. sophisticated technology such as ES) that our attention is directed at here.
Nii Nortey B.C. Lokko Page 35 6/14/2012
Figure 4-2 Value creation through technical integrity supported by technological systems
For these systems to have the right effect on technical integrity, they must have a structure that is suitable for the task at hand, they must possess functionalities that the users consider important and relevant to the task at hand, and they must impact the right value creation areas.
Subsequently, the checklist developed in the first part was converted into a questionnaire in order to collect quantitative information on such technological systems on the NCS. Since our focus area is maintenance and we had earlier established the lack of ES applications within this field, we decided to extend our study to cover other kinds of decision support systems (DSS) that are being employed. The aim here was to assess the efficiency/effectiveness and impact of sophisticated technology (ES/DSS) for decision-making in maintenance. The questionnaires were completed during the interview sessions. It covered three (3) main aspects;
1. System Structure – here, the domain specificity and knowledge base of the system were graded on a three (3) point scale.
2. System Functionality – here, the systems user friendliness, interoperability, reporting facility, large volume data handling capacity, data uncertainty handling, response time, explanation facility, 24/7 online availability, knowledge acquisition capacity, symbolic processing capacity and conflict resolution ability were graded on a five (5) point scale. These functional areas were considered necessary for decision support within an IO environment.
3. System Value – here, system impact on productivity within maintenance, equipment availability and reliability, value-added gains, HSE activities, work planning and resource allocation, competence buildings, preventive/predictive/dynamic maintenance capacity, decision support and expert task execution were graded on a five (5) point scale. The current and potential system impacts were explored. These impact areas were considered important for value creation.
Nii Nortey B.C. Lokko Page 36 6/14/2012
The literature review findings were combined with the results obtained from the questionnaire and the interview sessions. This depicts a triangulation of methods – literature review plus qualitative interviews plus quantitative questionnaire survey. Refer to Appendix 5 for a sample of the questionnaire and the interview questions used in the survey. It is worth noting that due to time constraints, not all the questions were answered by each interviewee. Consequently our discussions are based on the responses we were able to obtain.
4.2 Presentation of Survey Results
Each presentation would begin with a brief description of the company, the interviewee and the system being studied (in that order). The descriptions are kept very brief in order that one may not be able to easily identify the company, the interviewee and/or the system.
Each company’s results shall be presented individually either in tabular form, graphically or in written text. Except for the written text (which will not be a reproduction of every statement made by the interviewees), everything shall be presented as provided.
The next chapter (5) will provide a discussion of the results presented in this section.
The ES Acceptance Criterion
With regards, system value, we propose an ES accept criteria of at least 3. This is the least grade we expect any system considered to be an ES to have. Our argument for this acceptance criterion is that, we rely on our human experts to assist us in making informed decisions to enhance our value creation process. When the services of an expert are sought, we expect nothing less than quality work. Consequently, if we are to employ ES in our operations, the least valued impact we can tolerate is exactly what a human expert would have delivered (i.e. the system should meet and/or exceed or expectation). Anything less and we would be better off using conventional systems and making do with the few human experts available.
Subsequently, in our presentation of the survey results, we show this acceptance criterion as a red in the impact assessment graphs.
Nii Nortey B.C. Lokko Page 37 6/14/2012
4.3 Case Study 1: System A from Company A.
Company A – is a large O&G operating company with a worldwide brand and considerable operations on the NCS.
The interviewee – is the asset management leader on company A’s latest project on the NCS. This project is considered by the industry as having some of the latest technological solutions.
System A – is an asset condition monitoring software that supports event identification, situational assessment and quick response procedures.
Checklist Responses:
Table 4-1 Summary: Company A system structure response
Syst
em
Str
uctu
re
Response Description
No In-house developed application
Yes Computer-based/Software/Program
Yes Interactive user interface
Yes Heuristic programming
Yes Algorithm programming
Yes Domain specific
Yes Knowledge base
Yes Working memory
Yes Inference engine
Table 4-2 Summary: Company A system functionality response
Syst
em
Fu
ncti
on
ali
ty
Response Description
Yes Retention of Large amounts of data in memory
Yes Adequate response time
No Explanation Facility
No Handling data uncertainties
No Performing symbolic processing
No Conflict resolution
Yes Knowledge acquisition facility
Yes Reporting facility
Yes Training module
Yes 24/7 online availability
Yes Interoperability/Compatibility
Nii Nortey B.C. Lokko Page 38 6/14/2012
Questionnaire Responses:
Figure 4-3 System A functionality assessment graph
Functionality Assessment Grading Scale: Impact Assessment Grading Scale: 0 = No response or N/A 1 = Not at all Effective/Efficient 1 = No impact/Not at all
2 = Unsatisfactory/Below expectation 2 = little impact/somewhat/below expectation
3 = Satisfactory/As expected 3 = Medium impact/ok/as expected
We see here that with the exception of competence building and HSE activities, system A is meets the ES criteria and is subsequently having the impact that is expected of an ES.
Interview Response Summary:
System Acquisition
The interviewee stressed that because they are part of a larger institution, several decisions they take are as a result to strategic decisions taken higher up in the institution. Processes, procedures and systems are decided upon based on the conformity with their own internal regulations and plans. Consequently, adhering to materials and safety regulations together with the requirement by the management are two major factors that influence their acquisition of systems. The company A therefore tries to meet all these requirements when acquiring any new system.
Most often service providers/vendors/suppliers are the main source(s) in terms of recommendations about technologies/systems that would be appropriate for company A’s operations. Ideas do not normally originate from within.
One important factor which is always considered when making a choice is their existing contractual obligations. Systems from vendors/suppliers/providers that already have a standing agreement with the company or have been successfully engaged by the company stand a higher chance of being selected over systems from other competing parties (i.e. outsourcing). Ultimately, however, the cost of acquisition and maintenance of the system, together with its suitability for the intended purpose determines which system is chosen.
With regards challenges in the process of acquisition and implementation of the system, the interviewee highlights gaining a thorough understanding as their major challenge. Understanding the systems structure, functions and how it can be effectively utilized is what company A often struggles to overcome.
Experts and Expert Knowledge
The interviewee indicated that the word expert is seldom used to describe individuals in company A. They prefer referring to their highly knowledgeable personnel as technical authorities.
To deal with the negative effect of scarcity/unavailability of maintenance expertise, company A outsources a large proportion of its maintenance activities. The interviewee did not envisage this current state of affairs (scarcity/unavailability of maintenance expertise) being any better in the future. In fact the interviewee suggests that a further worsening of the situation would not be surprising at all. It probably is what is the company (and the industry as a whole) is expecting.
Nii Nortey B.C. Lokko Page 40 6/14/2012
For the interviewee, company A would be willing/open to the idea of employing more ES/DSS in their operations because the future of O&G companies is dependent on their ability to harness the power of technology.
The quality of decision-making is the main impact area for ES/ESS
Impact of Integrated Operations Scenario
The interviewee maintained that the need for innovative technology has always been around. What IO has contributed to this need is the creation of greater access to old and new data. This has increased the need for a much higher analysis of all this data.
Because of this increased need, O&G companies now have to employ more professionals with data analysis skills. They now have to find people who enjoy sitting behind computers and looking at numbers and figures.
The interviewee then warned that even though we need ES/DSS to enhance our decision-making, we should not for one second think of these technologies as substitutes for our experts. The experts are needed now even more than ever.
Decentralization of decision-making authority is the main impact area of IO.
Nii Nortey B.C. Lokko Page 41 6/14/2012
4.4 Case Study 2: System B from Company B.
Company B – is a large international O&G operating company with a significant proportion of its operations within the NCS. It is making inroads into other geographical areas such as Africa, Asia and the Americas.
The interviewee – is a multi-disciplinary professional with several years of experience within maintenance.
System B – is a spare-parts inventory management and optimization tool.
Checklist Responses:
Table 4-3 Summary: Company B system structure response
Syst
em
Str
uctu
re
Response Description
Yes In-house developed application
Yes Computer-based/Software/Program
No Interactive user interface
No Heuristic programming
Yes Algorithm programming
Yes Domain specific
Yes Knowledge base
Yes Working memory
No Inference engine
Table 4-4 Summary: Company B system functionality response
Syst
em
Fu
ncti
on
ali
ty
Response Description
Yes Retention of Large amounts of data in memory
Yes Adequate response time
Yes Explanation Facility
No Handling data uncertainties
No Performing symbolic processing
Yes Conflict resolution
Yes Knowledge acquisition facility
Yes Reporting facility
Yes Training module
Yes 24/7 online availability
Yes Interoperability/Compatibility
Nii Nortey B.C. Lokko Page 42 6/14/2012
Questionnaire Responses:
Figure 4-5 System B functionality assessment graph
Functionality Assessment Grading Scale: Impact Assessment Grading Scale: 0 = No response or N/A 1 = Not at all Effective/Efficient 1 = No impact/Not at all
2 = Unsatisfactory/Below expectation 2 = little impact/somewhat/below expectation
3 = Satisfactory/As expected 3 = Medium impact/ok/as expected
We see here that with the exception of competence building, system B does not meet any of the ES criteria. Subsequently, it cannot be an ES since it is not having the impact that is expected of an ES. The interviewee however believes it has the potential to have an impact similar to an ES.
Interview Response Summary: System Acquisition
The interviewee alluded to top managements’ strategic decisions as one of the main factors in determining systems to acquire. These decisions sometimes lead to organizational restructuring and the development of new work process. These new work processes may require the acquisition or the development of new technological systems. He indicated that company B had initiated several project targeted at developing new systems to satisfy a pressing need.
The interviewee was unable to indicate one particular area where solutions relating to technological systems frequently originate. Ideas come from all over – both from within the company and from vendors/suppliers/providers and other operator companies.
The cost of acquisition and maintenance of the system, together with its suitability for the intended purpose are the two most important factors that influence an acquisition. Nothing is considered without first indicating how much it will cost.
Interoperability with existing systems seems to be a major challenge for company B when it comes to acquisition and deployment of the system. Most often systems do not interface well with their already existing ICT systems and this has resulted in numerous occasions where manual inputs and extractions had to be undertaken to rectify problem areas.
Experts and Expert Knowledge
The interviewee suggested that an expert would be the most knowledgeable person connected with the task on hand. That person need not necessarily be the most experienced. However, it is quite often the case that that the most knowledgeable person is also the most experienced.
To deal with the negative effect of scarcity/unavailability of maintenance expertise, company B outsources about 90% of its maintenance contracts to the engineering service providers. The interviewee did not envisage this current state of affairs (scarcity/unavailability of maintenance expertise) being any better in the future. The interviewee however stated that expertise for planning and optimizing maintenance is what current and future operations demand the most.
Nii Nortey B.C. Lokko Page 44 6/14/2012
For the interviewee, any company should be willing/open to the idea of employing ES/DSS. Competitive advantage on the NCS is and will continue to lie in the domain of operations effectiveness and efficiency. And combining people with technology is what gives you the edge over others.
Departmental efficiency and effectiveness is the main impact area for ES/DSS
Impact of Integrated Operations Scenario
The interviewee maintained that the adoption of new technology on the NCS has always been a slow process. He however conceded that in the last five years, innovative products have been entering the system more quickly than it used to. Based on this he is confident that once the industry gets a good understanding of the capabilities of ES, its adoption would follow the current trend.
The interviewee highlighted the following as important elements determining how the ES adoption process will proceed:
o How the ES is developed (i.e. who will spend time to develop it).
o The data requirements together with its quality and availability.
o The involvement of the authorities with oversight responsibility on the NCS (standards, guidelines, requirements and initiatives).
The interviewee then warned that we should guard against over reliance on technology. Focus should still be directed at building expertise.
Decentralization of decision-making authority is the main impact area IO.
Nii Nortey B.C. Lokko Page 45 6/14/2012
4.5 Case Study 3: System C from Company C.
Company C – is also a large O&G operating company with a worldwide brand. The company has had operations on the NCS from the very beginning of petroleum activities in Norway.
The interviewee – is a multi-disciplinary professional with several years of experience within maintenance, operations, project management and economic evaluation of fields.
System C – is a computerized maintenance management system.
Checklist Responses:
Table 4-5 Summary: Company C system structure response
Syst
em
Str
uctu
re
Response Description
No In-house developed application
Yes Computer-based/Software/Program
No Interactive user interface
No Heuristic programming
Yes Algorithm programming
No Domain specific
No Knowledge base
Yes Working memory
No Inference engine
Table 4-6 Summary: Company C system functionality response
Syst
em
Fu
ncti
on
ali
ty
Response Description
Yes Retention of Large amounts of data in memory
Yes Adequate response time
No Explanation Facility
No Handling data uncertainties
No Performing symbolic processing
No Conflict resolution
Yes Knowledge acquisition facility
Yes Reporting facility
Yes Training module
Yes 24/7 online availability
No Interoperability/Compatibility
Nii Nortey B.C. Lokko Page 46 6/14/2012
Questionnaire Responses:
Figure 4-7 System C functionality assessment graph
Functionality Assessment Grading Scale: Impact Assessment Grading Scale: 0 = No response or N/A 1 = Not at all Effective/Efficient 1 = No impact/Not at all
2 = Unsatisfactory/Below expectation 2 = little impact/somewhat/below expectation
3 = Satisfactory/As expected 3 = Medium impact/ok/as expected
We see here that system C has the potential to have an impact similar to an ES. However it only just meets the ES criteria in the areas of equipment availability & reliability, consistency & quality of work output, and work planning & resource allocation.
Interview Response Summary: System Acquisition
The interviewee agreed with the assertion that top managements’ strategic decisions a main factor in determining systems to acquire. However he declared that cost effectiveness of work process and even regulatory compliance most often trump the impact of management decisions.
The interviewee was unable to indicate one particular area where solutions relating to technological systems frequently originate. Perhaps the initiative lies more with the vendors/suppliers/service providers. But considering all things, ideas come from all over – both from within the company and from external sources.
The cost of acquisition and maintenance of the system, together with HSE are the two most important factors that influence an acquisition. Everything can be linked directly back to cost. Sometimes companies hesitate to admit this fact but everything they do is about profits and cost reduction.
The interviewee highlights change management as a key issue when a company is embarking on the acquisition and deployment of a system. End user buy-in needs to be established very early on during the acquisition process. They need to feel like they own the system and are responsible for its success. Anything less and you experience a long gestation period where the impact of the system is almost inexistent.
Experts and Expert Knowledge
The interviewee suggested that an expert would be anyone who was more knowledgeable in a specific area than himself. Despite him having over eighteen years of experience, he did not say this because he thought too highly of himself. The statement is simply because when there is the need to showcase knowledge in a certain domain, the resource with arguably the most comprehensive store of knowledge is the expert.
Since maintenance service companies were in the business of capturing and maintaining a pool of maintenance experts, the O&G operators companies approach them with their maintenances challenges. Due to the high cost of maintaining offshore personnel and the need for specialized competences that are seldom required, the operators are comfortable outsourcing a large portion of their maintenance activities. However, they maintain some level of expertise within their operations mainly because of regulatory requirements.
Nii Nortey B.C. Lokko Page 48 6/14/2012
For the interviewee, any company should be willing/open to the idea of employing ES/DSS. This is the ideal scenario. The challenge here is proving the functionality and impact of such technologies. The NCS (and the O&G industry for that matter) is all about adopting proven technologies due to the riskiness of its operations.
Departmental efficiency and effectiveness is the main impact area for ES/DSS
Impact of Integrated Operations Scenario
The interviewee did not want to make any comments on IO because, as he put it, “in this case I am not an expert.”
Nii Nortey B.C. Lokko Page 49 6/14/2012
4.6 Case Study 4: System D from Company D.
Company D – is one of the main maintenance service providers on the NCS. The company has a diverse clientele base ranging from small local companies to large international operators.
The interviewee – is an experienced maintenance engineer. For this case, only the questionnaire was employed. The interview was not conducted.
System D – is an analysis software used to assist in criticality assessment of equipment.
Checklist Responses:
Table 4-7 Summary: Company D system structure response
Syst
em
Str
uctu
re
Response Description
No In-house developed application
Yes Computer-based/Software/Program
No Interactive user interface
No Heuristic programming
Yes Algorithm programming
Yes Domain specific
No Knowledge base
No Working memory
No Inference engine
Table 4-8 Summary: Company D system functionality response
Syst
em
Fu
ncti
on
ali
ty
Response Description
Yes Retention of Large amounts of data in memory
Yes Adequate response time
Yes Explanation Facility
Yes Handling data uncertainties
Yes Performing symbolic processing
Yes Conflict resolution
Yes Knowledge acquisition facility
Yes Reporting facility
Yes Training module
Yes 24/7 online availability
Yes Interoperability/Compatibility
Nii Nortey B.C. Lokko Page 50 6/14/2012
Questionnaire Responses:
Figure 4-9 System D functionality assessment graph
Functionality Assessment Grading Scale: Impact Assessment Grading Scale: 0 = No response or N/A 1 = Not at all Effective/Efficient 1 = No impact/Not at all
2 = Unsatisfactory/Below expectation 2 = little impact/somewhat/below expectation
3 = Satisfactory/As expected 3 = Medium impact/ok/as expected
We see here that with the exception of increasing productivity, consistency & quality of work output, and in HSE activities, system D cannot assume ES status. The interviewee does not even believe it has the potential to have an impact similar to an ES.
4.7 Case Study 5: System E from Company D.
Company D – is one of the main maintenance service providers on the NCS. The company has diverse clientele base ranging from small local companies to large international operators.
The interviewee – is an experienced maintenance engineer. Again, only the questionnaire was employed. The interview was not conducted.
System E – is a company tool used for different analysis.
Checklist Responses:
Table 4-9 Summary: Company E system structure response
Syst
em
Str
uctu
re
Response Description
Yes In-house developed application
Yes Computer-based/Software/Program
No Interactive user interface
No Heuristic programming
Yes Algorithm programming
Yes Domain specific
No Knowledge base
Yes Working memory
No Inference engine
Table 4-10 Summary: Company E system functionality response
Syst
em
Fu
ncti
on
ali
ty
Response Description
Yes Retention of Large amounts of data in memory
Yes Adequate response time
Yes Explanation Facility
Yes Handling data uncertainties
Yes Performing symbolic processing
No Conflict resolution
Yes Knowledge acquisition facility
Yes Reporting facility
Yes Training module
Yes 24/7 online availability
Yes Interoperability/Compatibility
Nii Nortey B.C. Lokko Page 52 6/14/2012
Nii Nortey B.C. Lokko Page 53 6/14/2012
Questionnaire Responses:
Figure 4-11 System E functionality assessment graph
Functionality Assessment Grading Scale: Impact Assessment Grading Scale: 0 = No response or N/A 1 = Not at all Effective/Efficient 1 = No impact/Not at all
2 = Unsatisfactory/Below expectation 2 = little impact/somewhat/below expectation
3 = Satisfactory/As expected 3 = Medium impact/ok/as expected
We see here that with the exception of increasing productivity, and consistency & quality of work output, system E cannot assume ES status. The interviewee does not even believe it has the potential to have an impact similar to an ES.
Nii Nortey B.C. Lokko Page 55 6/14/2012
Chapter 5 Discussion
Figure 5-1 Viewpoints around the expert table
The case studies are being regarded as a representative sample of the systems found on the NCS. Our analysis is thus based on this premise.
5.1 Analysis of Questionnaire Results
Structure Assessment
Of all the 5 systems considered, only system A can be considered an ES because it possesses all the necessary structural components. Most importantly, it checked yes for interactive user-interface, heuristics programming and an inference engine. These were three very important ES determinants in our checklist. Since only system A is an ES the others are considered to have information/data bases and not knowledge-bases. This is because for a system to effectively utilize a knowledge- base, an interactive user-interface, heuristics programming and an appropriate inference engine should be present in the system structure.
Subsequently, we will be referring to the systems as follows;
System A: A (ES) – for expert system
Nii Nortey B.C. Lokko Page 56 6/14/2012
System B: B (Opt) – for optimization system
System C: C (MS) – for management system
System D: D (CA) – for criticality assessment system
System E: E (TM) - for tag management system
With the exception of B (opt), all the systems were assessed to have been designed to suite their respective job specification, i.e. their application domains were not too broad such that their overall efficiency was compromised, nor was it too narrow such that effectiveness was impaired.
None of the systems were adjudged to have comprehensive knowledge-bases or information/data bases. In the case of A (ES), B (Opt) and C (MS), the interviewees thought much more could be done about their knowledge/information/data bases to increase their effectiveness. The interviewees were not satisfied about D and E either.
Functionality Assessment
System Figure 5-2 graphically depicts the overall functionality score for each system.
The ratings for all 12 functional areas were tallied for each individual system. The length of the bar signifies the total score. The contribution each functional area makes to the total score is shown in the colour composition of each bar.
Figure 5-2 Composition of overall system functionality
Out of a possible 60 points, D (CA) received the highest assessment of 35 points (representing 58% of its potential). It is the only system to have received an assessment for all 12 functional areas. Together with E (TM) and B (Opt), these three systems were adjudged to have more than half of the desired functional effectiveness/efficiency. E (TM) and B (Opt) received an assessment for 11 and 10 functional areas respectively.
A (ES) was assessed to have 47%, whilst C (MS), receiving the least points, was assessed to have less than 1/3 (i.e. 32%) of the desired functional effectiveness/efficiency. Both systems did not receive any assessment for data uncertainty, symbolic reasoning, conflict resolution and explanation facility.
Nii Nortey B.C. Lokko Page 57 6/14/2012
Functional Area Figure 5-3 graphically depicts the score for each functional area. The length of
each bar shows the total score for each functional area and the colour composition shows each system’s contribution to the total score.
Out of a possible 25 points, data retention, response time and reporting had the highest point’s total of 19 (representing 76% of desired efficiency/effectiveness). In these three areas, all the systems had very identical ratings, i.e. each system contributed equally to the overall rating.
24/7 online availability, user friendliness, and knowledge/information/data acquisition were assessed to have more than 50% efficiency/effectiveness. Interoperability/compatibility also had more than a 50% assessment. However, unlike the previous three areas, C (MS) did not contribute anything to the total interoperability/compatibility rating.
Symbolic processing and data uncertainty received the lowest point’s total of 2. As the figure shows, only D (CA) and E (TM) made contributions to this rating. Conflict resolution also had only two systems (B (Opt) and D (CA)) contributing to its low point’s total of 5.
Figure 5-3 NCS system functionality focus areas
Overall NCS Functionality Implication Figure 5-4 is an overall graphical representation of the systems on the NCS. It is
derived from our five case studies by plotting the average rating given to each of the 12 functional areas. The functionality assessment is lowest in the centre with a rating of 0 and increases progressively towards the highest rating of 5. Any rating less than 3 is considered below average and signifies a system functionality that is lacking in efficiency/effectiveness and needs to be enhanced. A rating of 3 is the minimum desirable and acceptable level of functionality. Thus the further away a rating is from the centre, the more efficient/effective the functional area is on the NCS.
With the exception of data retention, reporting, response time, user friendliness and 24/7 online availability, the efficiency/effectiveness of all other functional areas of maintenance systems/software needs to be improved (i.e. approximately 60% of system functionality is below average). Especially in the area of handling data
Nii Nortey B.C. Lokko Page 58 6/14/2012
uncertainties and symbolic processing where the levels need to be improved by a magnitude of 6.5 to reach the minimum acceptable.
We therefore deduce that, the maintenance systems on the NCS have a below average (2.4) functionality.
Figure 5-4 Average NCS system functionality assessment map
Impact Assessment
System Figure 5-5 shows the overall percentage impact of each system. The ratings for
all 9 possible impact areas (both current and potential) were tallied for each individual system. The height of the blue bar signifies the total system rating as a percentage of the highest possible rating. The red marker shows the total potential system rating also as a percentage of the highest possible rating. The gap between the top of the bar and the marker depicts the unlocked potential of the system.
Figure 5-5 Overall current and potential system impact assessment
It is clear that A (ES) has the highest current impact (76%) as well as the highest potential impact (98%). It has yet to take advantage of approximately 23% of its hidden potential. B (Opt) also has a very high potential but only 56% is being utilized. C (MS) and D (CA) currently have a similar level of impact. However, C (MS) is only
Nii Nortey B.C. Lokko Page 59 6/14/2012
utilizing 50% of its potential whereas about 90% of D (CA) potential has been unlocked. E(TM) has the same potential as D (CA) yet, it has more than 20% of this potential still untouched.
Impact Area Figure 5-6 graphically depicts the score for each impact area. The length of each
bar shows the total score for each impact area and the colour composition shows the individual system’s contribution to the total score.
Out of a possible 25 points, improvement in consistency and quality of work output, and increase in productivity had the highest point’s total of 17 (representing 68% of desired impact level). In these two areas, A (ES), D (CA) and E (TM) contributed the most to the rating.
Apart from these two areas only efficient work planning & resource allocation had been impacted by more than 50%. Here, A (ES) was the highest single contributor (4 points). D (CA) and E (TM)’s impact was very little (1 point each).
Competence building received the lowest point’s total of 8. As the figure clearly shows, B (Opt) contributed about 50% to its entire point’s total. Real-time decision-making and preventive/predictive/dynamic maintenance were similarly rated as having been marginally impacted.
The fact that 2/3 of these areas had experienced less than 50 % impact is quite a huge below par performance when you consider that the systems were adjudged to possess no less than 60% impact potential on all these areas.
Figure 5-6 NCS current systems impact areas
Overall NCS Impact Implication Figure 5-7 is an overall graphical representation of the systems on the NCS. It is
derived from our five case studies by plotting the average rating given to each of the 9 impact areas. The impact assessment is lowest in the centre with a rating of 0 and increases progressively towards the highest rating of 5. Ratings less than 3 are considered below par and signify a system that is not making the desired impact. Subsequently, its application would need to be revised. A rating of 3 is the minimum desirable and acceptable impact level. Thus the further away a rating is from the centre, the more desirable and valued the impact it has on the NCS.
Nii Nortey B.C. Lokko Page 60 6/14/2012
With the exception of increased productivity and improved consistency & quality of work output, all the other areas have shown little or no enhancements. The maintenance software /systems are having little or no impact to activities on the NCS (i.e. approximately 78% of the areas below minimum acceptable). Subsequently, we observed that a below average impact of 2.4.
We therefore infer that, on the whole, the maintenance systems on the NCS are not creating value as is expected. Also, since the ES acceptance criterion is met only in the areas of increased productivity and improved consistency & quality of work output, we can deduce that in general the maintenance systems on the NCS are not impacting value creation as would an ES.
Figure 5-7 Average NCS maintenance systems impact assessment map
5.2 Further Discussion/Observations
The analysis of the questionnaire results highlights the following:
1. For a system to effectively utilize a knowledge-base, an interactive user-interface, heuristics programming and an inference engine should be present in the system structure. Anything short of this would require considerable human expertise to effectively link this knowledge to the problem at hand. A knowledge-based system which lacks these important features is not an ES.
2. Despite the fact that the ES (system A) had one of the lowest rated functionalities and was also considered to need more comprehensive knowledge, it delivered the highest impact when compared with the other non-ES systems. On the contrary, system D and E had made the least impact despite having a suitable information/data base and the highest rated functionalities. This is a rough demonstration of the value-added gains of employing ES in maintenance.
Nii Nortey B.C. Lokko Page 61 6/14/2012
3. The functional efficiency/effectiveness of maintenance systems on the NCS is generally below its desired level. Technological enhancements have mainly being focused on large volume data retention, quick response times, system reporting capabilities and 24/7 online availability. Attention needs to be focused more on areas such as handling of data/information uncertainties, system interoperability/compatibility and symbolic processing of events/circumstances. This would even out the bias and enhance overall system functionality on the NCS.
4. Also, the systems are not having their desire valued impact on the NCS. Overall impact assessment is below par. The consistency and quality of work output, together with productivity seem to be highest valued impact areas. This is complementary of the systems. However, in an IO environment lack of desired impact on real-time decision-making, preventive/predictive/dynamic maintenance capabilities, and work planning & resource allocation is a conspicuous deficiency.
5. There seems to be a positive relationship between ES application and the value impact of maintenance systems/software on the NCS. Overall system functionality rating (all five systems considered) was estimated at 2.4. This corresponded to an equivalent value impact assessment rating of 2.4. When the ES (system A) ratings were omitted from the analysis, overall system functionality remained unchanged. However, the value impact assessment dropped to 2.0 (a reduction of about 17%). Refer to Figure 5-8 for a graphical illustration of this positive relationship.
The most affected impact areas are real-time decision-making, preventive/predictive/dynamic maintenance capabilities, equipment reliability & availability, performing of expert duties, and work planning & resource allocation.
On the basis of this analysis, we can sufficiently infer that ES fosters the realization of the maintenance goals within an IO environment, i.e. value creation.
Figure 5-8 Graphical representation of the positive impact of ES on value creation
Now if we quickly refer to Figure 4-2 presented earlier, we realize that having technological systems that are weak in structure (i.e. lack comprehensive knowledge-bases or information/data bases) and ineffective/inefficient functionality (i.e. below
Nii Nortey B.C. Lokko Page 62 6/14/2012
expectation), limits the technological systems’ contribution to ensuring asset availability and reliability. Within an IO environment, this implies that the people (the unavailable/scarce experts) must try to make-up for the systems’ shortcomings. Failure to do so effectively would negatively influence technical integrity and subsequently impair the value creation process. Consequently, the NCS will need to focus on enhancing the functionality of its maintenance systems, especially in the areas of handling of data/information uncertainties, system interoperability/compatibility and symbolic processing of events/circumstances, to foster the IO objectives.
Basically, all the analysis and discussions are pointing to the need for more ES for value creation through enhance asset management:
1. IO is directed at transforming data/information into knowledge for decision-making → ES are the main technological systems that use knowledge-bases efficiently/effectively.
2. IO is directed at dynamic operating regimes → ES fosters and enhances the quality of real-time decision-making, improves predictive & dynamic maintenance capabilities, and has the functional capacity to handle uncertainties.
3. IO is directed at enhancing HSE → ES has functionalities that foster asset availability and reliability, which in turn influences the technical integrity of safety critical equipment.
4. Ultimately, IO is directed at enhancing value creation → ES has the most valued impact assessment.
The NCS therefore will benefit immensely from more ES applications for asset management.
Nii Nortey B.C. Lokko Page 63 6/14/2012
Chapter 6 Issues, Recommendations and Suggested Application Areas
Figure 6-1 Deciding the next critical step forward
6.1 ES Application Issues/Challenges for the NCS
In this section, we take a step back to look at our study so far and try to identify some major ES related issues/challenges from a holistic point of view. This section is mainly derived from the interview responses.
1. Lack of Understanding
People generally have very little knowledge about AI and its areas of application. The best guess is normally in the area of robotics because this is what is broadcast to society as AI. Seeing as ES was the first successful industrial application of AI technology, this creates a huge challenge in terms of identifying potential application areas especially within maintenance.
Nii Nortey B.C. Lokko Page 64 6/14/2012
The level of knowledge about the existence of ES within the O&G industry in Norway is extremely low. You spend several minutes trying to explain what ES is and what its capabilities are, and the type of response you receive is “I don’t think we have/use anything like that, all we have are software that performs complex calculations.” Even those who happen to be using ES in their daily activities do not know exactly what it is. They consider it a decision support tool (which it is) that makes their work simpler (which it is supposed to do). But ES, as we have seen, is no ordinary decision support tool. For those whose activities revolve around maintenance, several of them are of the opinion that this is a tool for the production and operations departments, and not for maintenance.
The main reason we highlight for the lack of ES knowledge and understanding on the NCS (especially in maintenance) is branding. When a new type of robot is designed, everybody still refers to it as simply a robot. It may be a domestic robot, an industrial robot, a service robot, or even a space robot but ultimately we all still call it a robot. Even when it has special brand/trade names such as ASIMO or TOPIO, it is nothing more than a robot. ES however are more often referred to by their special brand/trade names (and in some cases by their functions) rather than just simply known as ES. This makes it very difficult for people to recognize and familiarize with the ES technology/concept.
2. Business Case for Service Providers
A huge proportion of maintenance expertise on the NCS is located outside the operating companies. Since maintenance is not part of the core business of operating companies, they are better served by seeking expertise elsewhere. Businesses have thus been formed around these expertises and are sold as services to the operating companies. The business model of maintenance service providers is to gather and provide maintenance expertise to whoever needs it. If a particular expertise is lacking, acquire it or show that you are capable of acquiring it when it is needed. Value is created by selling hours of expertise. This has been and continuous to be the mode of operation of maintenance service providers.
Subsequently, there is no business case if a product they develop turns out to erode their value to the operating companies. ES is therefore considered a threat to service value and as such they have no motivation to develop or introduce or initiate the development of such competing technologies to their clients. Their interest in ES will only be obtained if they can be assured of, at least, an increase in value creation through the development and application of ES.
The challenge here is that, the maintenance service providers need to find ways to overcome the same initial challenge - a lack of thorough understanding of the functional capabilities of ES. Consequently, they are unable to identify ways of designing new business lines around ES to help capture and provide expertise which ultimately will increase their value to the operating companies
3. Confidence in Technology
Like all other types of technology that has tried to break into the O&G industry, ES is faced with the problem of lack of confidence. The O&G industry being as high risk as it is, has almost no tolerance for unproven technology. The NCS is surrounded
Nii Nortey B.C. Lokko Page 65 6/14/2012
by regulations and guidelines that indicate the application of proven technologies. These regulations and guidelines may either be internal (company policy/strategy) or external (regulatory/supervisory bodies). Lean operations, marginal fields and cost reduction are key words that currently characterize the NCS today. Signifying, unless it is demonstrated that ES is a priority, there may be no room to prove its functionality and impact on the NCS.
The NCS is dominated by an aged/aging population of O&G professionals. And since it is a well-known fact that younger people are more likely to adopt and use new technology more than older people, the widespread use of ES in maintenance is even more challenging. The magnitude of this challenge is enhanced when we factor in the realization that it is these aged/aging population whose expertise is in danger of being lost completely. ES should be seen as a way of capturing and storing such expertise for current and future application.
4. The ES Development Process
Developing an ES in its self in not a simple task. It requires several long man-hours, dedication and ingenuity, and above all the development process is costly.
The development process involves the identification of suitable application areas. We have indicated that ES is most suitable for problems that occur frequently but are ill-structured. However, not all the problems within this said category are suitable for ES application. The challenge here is to find the ones that are. This assessment looks at;
The criticality of the problem with respect to operations and system integrity.
The length of time it takes to generate a solution to the problem.
The availability of good quality and reliable data that the system will rely on.
The nature of the expertise required for problem solving and decision-making.
The likelihood of acquiring the knowledge from one or multiple experts. This in itself is an issue because most times, different experts have different ways of solving the same problem.
Which programming language(s) would be most appropriate in capturing the required expertise for building the knowledge base?
(Ultimately) the cost related benefits of solving the problem with an ES as against just simply relying on human experts together with conventional computer systems, and the issues that come with that.
As already indicated lean operations, marginal fields and cost reduction are key words that currently characterize the NCS. Add on the ever present issue of scarcity of expertise and you have a situation that almost seems impossible. Looking at the
Nii Nortey B.C. Lokko Page 66 6/14/2012
above list (which is not an exhaustive one for that matter), who would be willing to dedicated priceless expertise to an activity that is not currently yielding any benefits when there may be other pressing matters at hand? What we know however, is that, companies would be willing to use ES should they find its application justifiable.
5. The threat of collaborative operating environments
The report for this study began with us highlighting the O&M goals/objectives under IO. In summary, IO is expected to boost the quality of real-time decision-making via a higher level utilization of data/information supported by the enhanced availability of expertise. On the back of ICT, experts within the company (onshore & offshore), experts from service providers (vendors/suppliers/manufacturers), experts overseas (consultants/researchers), and even experts on vacation (or retired) have the potential to work on the same problem in real-time irrespective of geographical location. This prospect is so convincing, one is easily susceptible to draw the conclusion that enhancing the availability of expertise diminishes the value and justification for ES.
Ultimately, the justification of ES begins with an assessment of the demand for expertise. Economic theory teaches that demand and supply of goods are closely correlated. Subsequently, we infer that if the demand for expertise does not significantly surpass the supply of experts, there is perhaps, no need to provide an ES to increase the availability (or reduce scarcity) of their expertise. Simple reasoning arrives at the same conclusion – provide what is needed when it is needed. This direction of reasoning, as regards the value of ES to ones operations, needs to be guarded against.
6.2 Suggested Remedies
In this section, we take a holistic look at how to approach the major ES related issues/challenges identified above. The discussion below is not meant to provide concrete steps/solutions, but rather, the direction in which we should be thinking in out attempt to deal with the issues.
1. Lack of Understanding
There is a general need to enhance the knowledge/understanding of the concepts behind the technological aids we use in our homes and especially at our workplaces. Much too often we focus on learning how to use the system so much so that we forget what it is exactly that the system is doing for us that is so important. Knowing precisely why we need the system is the starting point in establishing, how it performs its functions, what it needs to effectively perform those functions, and ultimately what type of system it is.
Branding (or lack of it for that matter) has been identified as a major contributory factor to the lack of wide spread knowledge about ES. This is something that needs to be addressed on a global scale i.e. if we want to take ES applications further. Once these systems are properly branded, knowledge about them would increase. Proper branding also means that systems can easily be tagged and
Nii Nortey B.C. Lokko Page 67 6/14/2012
categorized, and this makes it easier to search for them in the market. Proper branding therefore benefits everyone:
A larger population gets to know and understand what ES is;
Developers and manufacturers have their products reaching a wider potential ES market; and
Academicians and researches are able to better conduct studies on much identifiable case application.
2. Business Case for Service Providers
It may be necessary to remind maintenance service providers that their revenue stream is the operators’ expense stream. This simply means when operators talk about cost cutting in maintenance, they are indirectly referring to reducing the revenue of service providers.
As already indicated these service providers sell expertise. They do so mainly by charging man-hours to maintenance projects for the operators. One way of increasing profits for these service providers is by charging more for the same amount of work done. This strategy is often disliked by the operators. A more value for value strategy is increasing the number of chargeable projects whilst maintaining the same level of expenses (i.e. enhanced efficiency).
What service providers would need to do therefore is to redirect some of the operators’ avoidable periodic maintenance costs into their revenue stream. This would be the added chargeable projects. Maintaining the same level of expenses would be to employ ES to complement the available expertise. Now the same available experts are able to complete more projects without actually increasing their own chargeable hours.
3. Confidence in Technology
Confidence in technology can always be tied back to how much knowledge we have about the technology. Understanding the way the technology works, how it can be applied, how it impacts work delivery and its limitations will make accepting it much simpler. For instance, Microsoft excel is an application that is used in almost all industries for several analysis related tasks. Yet only a small handful of people actually have the knowhow to unlock its full potential. For those who only construct tables and draw graphs, suggesting Microsoft excel as a tool for modeling processes and phenomena will be met with such apprehension, that one would be forced to conclude these users know next to nothing about the application. The best reaction you might receive is genuine surprise. Most would think it impossible. Thus, the more the NCS familiarizes itself with the concept of ES the more likely it is that personnel will be willing to use it.
Since we identified that the older generation are less likely to adopt the use of new technology, it would be prudent to get them to feel ownership of the ES. When people somehow find themselves involved in the acquisition/development and implementation of any new system/technology, they develop a strong sense of responsibility to ensure its success (no one likes to be responsible for a failure).
Nii Nortey B.C. Lokko Page 68 6/14/2012
Consequently, they will be driven to have more confidence in the ES simply because they were part of the process.
Also, we believe a higher level of confidence in ES is attainable if the institutions with oversight responsibility on the NCS, and notable research organizations, such as SINTEF, can endorse its widespread application in maintenance.
4. The ES Development Process
The answer to the question, ‘who would be willing to dedicated priceless expertise to an activity that is not currently yielding any benefits when there may be other pressing matters at hand?’ is a visionary. Going with Albert Einstein that, "we cannot solve our problems with the same thinking we used when we created them", tells us that we will not rid ourselves of the problem if we do not dedicated time and effort to it. This time and effort is costly. However, the ES development process should be seen as a necessary investment that will help attain our goals of overall cost reduction and HSE improvement.
A lot of work has been done in ES, albeit not so easily attainable. Consequently, learning from the development and application experiences of other industries and departments is a sure way to help avoid unnecessary delays and expenses. Knowledge capture and representation methodologies and technologies are constantly being improved, and as such this process can only get simpler. More and more information about data quality and availability is readily accessible due to improvement in acquisition and storage technologies. Current best knowledge management practices mean everything (such as problem areas, expertise requirements for problem-solving, problem impact assessment, etc.) is being documented and referenced.
All of these suggest that the ES development process is going to be much simpler than it was previously. All there is to do now is to believe in the merits of ES applications and begin the process.
5. The threat of collaborative operating environments
A much more accurate assessment of the IO situation on the NCS is that, having collaborative operations increases the need for expertise more than it increases the availability of experts. Formally isolated departments now have access to volumes of new data and information from various other departments and companies that they need to transform into knowledge for value creation. They may have access to expertise alright, but so do other departments and companies. They are all competing for the same expertise which, by the way, is still scarce. To compound the situation, responses are now required faster than previously demanded. An ES in this case assists the experts to respond quicker, and they support the non-experts by improving the quality of their decision-making.
The misconception about the value of ES within collaborative operating environments is entirely dependent on how well the concept of knowledge management is understood. Seeing as knowledge management is a mandatory requirement under IO, it should be emphasized that ES is part of the process of
Nii Nortey B.C. Lokko Page 69 6/14/2012
knowledge acquisition, sharing and utilization for value creating and continuous improvement. Subsequently, we agree with Jarrar and Zairi (2010) in their research paper, Knowledge Management: Learning for Organizational Experience – that ES is there to support knowledge management. Consequently, we must promote ES as an integral part of IO.
6.3 Suggested ES Application Areas
In the first part of this study, the literature review and market survey led us to the following conclusions:
1. There is a lack of widespread application of ES for maintenance purposes on the NCS.
2. The very few maintenance applications have been in the area of equipment fault detection and diagnosis.
3. There were no observable ES applications in the other three phases of the D4 – process.
These conclusions were graphically illustrated in Figure 3-14.
It therefore came as no surprise when, in the second part of the study, the only ES from our case studies was being employed for diagnosis (in this case, event identification & situational assessment) and condition monitoring.
Preventive maintenance strategies pre-dominate the NCS today, as a result we suggest the immediate ES application focus be directed at all the areas within the define phase of the D4 – process (i.e. fault detection, diagnosis, prognosis, remaining useful life estimation, root cause analysis, etc). Attaining the desired predictive and dynamic maintenance regimes will demand an enhancement of these capabilities. In principle however, the NCS should be looking at applications within all the identified areas.
With subsequent reference to the D4 – process in Figure 3-5, we consequently suggest the possible application areas for the NCS. Our suggestions are captured in Table 6-1.
Nii Nortey B.C. Lokko Page 70 6/14/2012
Table 6-1 Suggested ES application areas for the NCS
Phase: D4 – process
Application Area Governing principle Application examples from other industries
Define Fault detection
Diagnosis
Prognosis
Remaining useful life estimation
Root cause analysis
Interpretation
Prediction
Condition recognition
Forecast
Rice-Crop Doctor
Transformer Oil Analyst
CaDet
Shop Automated System of Technical Diagnostics
NeuralWorks Predict
NeuroXL Predictor
Goldfire tool from Invention Machine Design Repair strategy
Replacement strategy
Condition monitoring
Equipment re-configuring
Monitoring
Analysis
Design
Stimulation Expert
ES for inspection & maintenance for bridges
ES for offshore structure inspection &
maintenance
Determine Cost –benefit analysis
Sensitivity analysis
Uncertainty assessment
Risk assessment
HSE impact assessment
Spares assessment
Marketing
Optimization
Simulation
Trade-off
ES for securities selection
ES for insurance underwriting
G2 e-SCOR
NeuroShell Predictor
NeuroShell Classifier
GeneHunter
Deploy Scheduling
Work planning
Resource allocation
Spares ordering
Management
Control
Monitoring
Ovation expert control system
DeltaV Advanced Control Suite
ES for rail scheduling
Nii Nortey B.C. Lokko Page 71 6/14/2012
Chapter 7 Conclusion
Figure 7-1 Graphical representation of this study
7.1 Final Remarks
It is often said that an organization’s most valued assets are its employees. Looking at the NCS and the current IO environment, this ideology becomes even more meaningful. Real-time quality decision-making lies in the hands of O&G professionals, and especially the few experts available. Improvements in technical integrity, through enhanced asset availability and reliability are dependent on the intellectual capacities and technological systems capabilities within organizations. Asset availability, reliability and ultimately technical integrity are important variables in value creation through HSE. Again we are talking about the importance of scare expertise. Expert systems are computer-based knowledge systems that enhance the intellectual capacities of organizations.
This thesis report has presents a study into the role ES is playing on the NCS with respect to value creation by improving asset availability and reliability, and ensuring its integrity. The study has indicated that ES has a much diminished role in the maintenance of topside O&G assets, which appears to be a significant determinant in the NCS’s capability to employ more predictive and dynamic maintenance strategies. This state of affairs is primarily due to the lack of
Nii Nortey B.C. Lokko Page 72 6/14/2012
knowledge and thorough understanding about the concept of ES by professionals. Other issues such as, the lack of confidence in unproven technology, the embedded difficulties of the ES development process, lack of interest from service companies and the misconceptions within IO, were also identified to be hindering the widespread adoption and application of ES (and other sophisticated technologies) on the NCS.
On the back of industrial ES applications in other commercial sectors, all the phases within maintenance (engineering) problem solving were suggested as potential ES application areas. ES applications which enhance predictive and dynamic maintenance capabilities were suggested as priority systems.
We therefore conclude with Figure 7-2 which simply says that if the NCS evaluates systems based on their value to organizations, then ES should receive the highest valuation. Subsequently if the NCS selects systems with respect to highest value creation potential, then ES should be the first to be selected.
Figure 7-2 Value assessment from data to intelligence
The initial figure was adopted from Dwyer, J.P., et al. (2008)
We hope that this report can spark the NCS’s interest into ES technology for maintenance purposes, culminating in its widespread adoption and application, and enhanced value creation for the local and global O&G industry.
Nii Nortey B.C. Lokko Page 73 6/14/2012
7.2 Areas for Further Study
This study sought to obtain a general feel about the status of ES applications on the NCS, especially within the domain of maintenance. Due to the limited scale of this investigation, generalizations were made in order to arrive at more deductive but reasonable conclusions. Consequently, a broader and much detailed investigation may be required in order to verify these results and establish the status of ES applications on the NCS. This detailed investigation should also cover internally developed software/systems and not only the commercially available ones.
In the final analysis, this study sought to stir up interest into this area of ES (and in a much broader sense AI) which seems to have been lost on the NCS. If the purpose for which this study was undertaken has been achieved, then all the issues raised in the previous chapter should also warrant some further study:
1. Lack of Understanding
A thorough investigation into how the NCS can enhance its level of knowledge about ES, their value and application areas may be embarked upon. This study could highlight specific problems, especially in maintenance, that are perfectly suited for ES application.
2. Business Case for Service Providers
An investigation aimed at developing new services around ES which can be offered to operators on the NCS. This study should focus on value creation for the service provider.
3. Confidence in Technology
An investigation into the development of a framework which enhances the likelihood of adopting and using unproven technologies on the NCS.
4. The ES Development Process
An investigation aimed at finding innovative ways of simplifying the ES development process for application on the NCS.
5. The threat of collaborative operating environments
An investigation aimed at quantifying the expertise requirement on the NCS that had resulted from the implementation of IO and compare it with the expertise available now. This study could also establish how to meet any identified shortfalls in expertise on the NCS.
Nii Nortey B.C. Lokko Page 74 6/14/2012
Bibliography
1. Aghili, H., Montgomery, G., Amlani, A., & Shah, J. (1988). Process design of oil and gas production facilities using expert systems. IEA/AIE '88 Proceedings of the 1st international conference on Industrial and engineering applications of artificial intelligence and expert systems , 1, 421-429.
2. Badiru, A., & Cheung, J. (2002). Fuzzy engineering expert systems with neural network applications. New York: John Wiley & Sons.
3. Bassiliades, N., & Vlahavas, I. (2000). Active Knowledge-Based Systems. In C. T. Leondes (Ed.), Knowledged-Based System: Techniques and Applications (pp. 1-34). San Diego: Academic Press.
4. Dwyer, J., Chmela, W., Lamborn, R., Colomb, C., & Quinn, T. (2008). Real-time Connectivity and Potential Benefits to Appalachian Operations. SPE Eastern Regional/AAPG Eastern Section Joint Meeting (pp. 1-9). Pittsburg, Pennsylvannia: Society of Petroleum Engineers.
5. Executive Information Systems. (n.d.). Expert System And Artificial Intelligence. Retrieved from Executive Information Systems: http://t3.gstatic.com/images?q=tbn:ANd9GcTnegrmcGFCjdB8S-bjYRTOHocRpF4Q2Zon99-lADIWzv1H0QQiyVlRVvfirw
6. Exsys Inc. (2011). Exsys Inc - The Expert System Experts. Retrieved April 2012, from http://www.exsys.com/
7. Hegazy, A. (2012). A New Expert System for Load Shedding in Oil & Gas Plants – A Practical Case Study. In M. Rasul (Ed.), Thermal Power Plants (pp. 111-126). InTech.
8. Jarrar, Y., & Zairi, M. (2010). Knowledge Management: Learning for Organisational Experience. European Centre for Best Practice Management.
9. Ketata, C., Satish, M., & Islam, M. (2005). Expert System Knowledge Management for Laser Drilling in the Oil and Gas Industry. International Conference on Computational Intelligence for Modelling, Control and Automation and International Conference on Intelligent Agents, Web Technologies and Internet Commerce, New York, USA , 1, 930-938.
10. Kobbacy, K. (2008). Artificial Intelligence in Maintenance. In K. Kobbacy, & D. Murthy (Eds.), Complex System Maintenance Handbook (pp. 209-231). London: Springer-Verlag London Limited.
11. Kopliku, A., & Condanni, D. (1994). Expert System for Corrosion Evaluation and Material Selection in Oil and Gas Wells. European Petroleum Computer Conference, Aberdeen, United Kingdom, Society of Petroleum Engineers .
Nii Nortey B.C. Lokko Page 75 6/14/2012
12. Krishnamoorthy, C., & Rajeev, S. (1996). Artificial Intelligence and Expert Systems for Engineers. CRC Press.
13. Lee, J., & Wang, H. (2008). New Technologies in Maintenance. In K. Kobbacy, & D. Murthy (Eds.), Complex System Maintenance Handbook (pp. 49-78). London: Springer-Verlag London Limited.
14. Liao, S. (2005). Expert system methodologies and applications—a decade review from 1995 to 2004. Expert Systems with Applications , 28 (1), 93–103.
15. Liyanage, J. (2008). Integrated eOperations – eMaintenance: Applications in North Sea offshore assets. In K. Kobbacy, & M. D.N.P. (Eds.), Complex System Maintenance Handbook (pp. 585-610). London: Springer-Verlag London Limited.
16. Massey University. (n.d.). CLIPS Applications. Retrieved April 2012, from http://www.massey.ac.nz/~wlxu/paper472/expsyshm/clipsapplication.htm
17. Miller, B. (1995). GEOPLAY: A knowledge-based expert system - A model for exploration play analysis . Washington: U.S. Geological Survey Bulletin 2118.
18. Ministry of Petroleum and Energy & Norwegian Petroleum Directorate. (2011). Facts 2011 - The Norwegian Petroleum Sector. Oslo: MPE and NPD.
19. Mitten Software Inc. (2011). The Future has Arrived for Data-Driven Expert System Software. Retrieved April 2012, from http://www.mittensoftware.com/Expert-System-Software.htm
20. Noran, O. (n.d.). The Evolution of Expert Systems. Retrieved April 2012, from http://www.ict.griffith.edu.au/noran/Docs/ES-Evolution.pdf
21. Norwegian Oil Industry Association (OLF). (2005). Integrated Work Processes: Future work processes on the Norwegian Continental Shelf. Stavanger: Integrated Work Processes: Future work processes on the Norwegian Continental Shelf.
22. Norwegian Petroleum Directorate. (2012). Fact Pages. Retrieved April 2012, from http://factpages.npd.no/factpages/Default.aspx?culture=en
23. Norwegian University of Science and Technology (NTNU). (n.d.). Center for Integrated Operations in the Petroleum Industry. Retrieved April 2012, from http://www.ntnu.edu/iocenter
24. Oracle Think Quest. (n.d.). Expert Systems. Retrieved April 2012, from http://library.thinkquest.org/11534/expert.htm
25. Petroleum Safety Authority. (2008). Area of Responsibility Onshore and Offshore. Retrieved April 2012, from http://www.ptil.no/getfile.php/Ptil-grafikk%20og%20vignetter/sokkelkart%20ENG%202008.jpg
26. Petroleum Safety Authority. (2011). Trends in Risk Level in the Petroleum Activity: Summary Annual Report 2010 – Norwegian Continental Shelf. Stavanger: Petroleum Safety Authority.
27. Romem, Y. (2010). Darwin, Culture and Expert Systems. In P. Vizureanu (Ed.), Expert Systems (pp. 1-16). India: Intech.
28. Siler, W., & Buckley, J. (2005). Fuzzy expert systems and fuzzy reasoning . New Jersey: John Wiley & Sons.
29. Statistics Norway. (2012). Employed persons 15-74 years, by age and industri division. 4th quarter 2010. Per cent. Retrieved April 2012, from http://www.ssb.no/english/subjects/06/01/regsys_en/tab-2011-06-14-08-en.html
30. U.S. Department of Energy (DOE) - National Energy Technology Laboratory (NETL). (1998). Oil and Gas Industry Software. Retrieved April 2012, from http://www.netl.doe.gov/KMD/cds/disk30/html%5Cindex.html
Nii Nortey B.C. Lokko Page 76 6/14/2012
Appendices
Appendix 1: Map of PSA Area of Authority
Appendix 2: Checklist for Expert Systems
Appendix 3: List of Vendors/Suppliers/Providers of Computer-based Systems
Appendix 4: List of Surveyed Systems Available on the NCS
Appendix 5: Sample Questionnaire and Interview Questions
Name of System ………………………………………………………………………………………..
Name of Vendor/Supplier/Developer/Third-Party ………………………………………………………………………………………..
Date of installation/purchase/commissioning ………………………………………………………………………………………..
Name of Company ………………………………………………………………………………………..
ES/DSS Criteria/Features
# Tick Description
Syst
em
Str
uctu
re
0. In-house developed application
1. Computer-based/Software/Program
2. Interactive user interface (User needs have been considered in the design)
3.
Heuristic programming (Solves problems using logics/‘rules of thumb’ that are been based on experience, experimentation, evaluation and/or trial & error. The system is also self-learning)
4.
Algorithm programming (Solves problems based on based on mathematically provable procedures, data driven methods or fixed set of rules. Computational in nature )
5. Domain specific (Designed with a specific job description/scenario)
6. Knowledge base (Problem-solving rules, procedures, and intrinsic data relevant to the problem domain)
7. Working memory (Task-specific data for the problem under consideration)
8.
Inference engine (Generic control mechanism that applies the axiomatic knowledge in the knowledge base to the task-specific data to arrive at some solution or conclusion. Forward chaining, backward chaining or both)
Abilities of the ES/DSS
# Tick Description
Syst
em
Fu
ncti
on
ali
ty
1. Retention of Large amounts of data in memory
2. Adequate response time (Processing of large amounts of data quickly)
3.
Explanation Facility (What, how, why and when question of a problem and its recommendation can be obtained from the system. Provides an audit trail)
4. Handling data uncertainties (Probabilities, certainty factors, or confidence levels can be applied to any or all input data)
5. Performing symbolic processing (Manipulation of symbols to arrive at reasonable problem conclusions)
6.
Conflict resolution (Selection criteria for choosing which rules need to be evaluated first. The system is able to prioritize which recommendation/tasks are of most importance)
7.
Knowledge acquisition facility (The ability of a user to enter knowledge into the system without explicitly knowing how to perform coding/programming)
8. Reporting facility
9 Training module
10. 24/7 online availability (Highly immune to system overload and crashes. Very stable)
11. Interoperability/Compatibility (Seamless integration with other systems and effectively using data from multiple databases in different data formats)
Nii Nortey B.C. Lokko Page 79 6/14/2012
Appendix 3: List of Vendors/Suppliers/Providers of Computer-based Systems
32 Vendors/Suppliers/Providers Kongsberg Oil & Gas Technologies eDrilling Solutions
·LedaFlow® ·DeltaV SIS Process Safety System ·Workmate·Flare System Analyzer
(FlareNet)
·SIM Reservoir™ ·Emerson Smart SIS ·SAP ·Orcaflex
·ECLIPSE·Westinghouse Distributed Processing
Family (WDPF™)·AutoHydro ·Abaqus
·INTERSECT ·Ovation™ Expert Control System ·Shear7
· PIPESIM ·Process Knowledge and Training Simulators ·Vivana
·OLGA ·DCS Checkout Simulator ·MACSI
·Flow-3D ·Engineering Simulator ·RIFLEX
·Lifecycle Simulation ·BFLEX Program System
·Multiphase Flow Simulation ·MIMOSA
·Operator Training Simulator ·MOOROPT-2
·Gassonic Simulator ·Uflex2d
·Aspentech Hysys Dynamics ·Nauticus Machinery
·PVT sim ·USFOS
·Pipenet transient ·VOCSim
·Hysys ·MOPSIM
·Hysis simulation 2006.5 ·SIMLA
·Pro II ·SIMO
·Fluent ·SimVis
·AkerTEG, Aker Solutions proprietary
software developed in-house
·PDMS 11.6
·Microprotol
·Solidworks 2007
·AutoCad 2006
·Cosmos Works
·Caesar II, Stress Analysis
·Staad Pro, Calculations Structure
·Comflow
·Kameleon FireEx KFX®
·Fahts
·Hysys Dynamics
·Aspen HTFS inc. Tasc+
·Enterprise Simulation
Analysis/Database/Management
Systems
Simulation/Design Systems
Systems Under Development
Nii Nortey B.C. Lokko Page 81 6/14/2012
Appendix 5: Sample Questionnaire and Interview Questions
Questionnaire
System Structure & Functionality Assessment
# Description
System Structure
a. Too narrow
Suitable
Too broad
Domain specificity (Designed with a specific job description/scenario)
b.
Not comprehensive
Suitable
Very
comprehensive
Knowledge base (Problem-solving rules, procedures, and intrinsic data relevant to the problem domain)
Grading
1 = Not at all Effective/Efficient
2 = Unsatisfactory/Below expectation
3 = Satisfactory/As expected
4 = Above expectation
5 = Extremely Effective/Efficient
Kindly give your assessment of the systems functionality: (1=lowest, 5=highest)
# 1 2 3 4 5 Description
Syst
em
Fu
nct
ion
alit
y
a. Retention of Large amounts of data in memory
b. Adequate response time (Processing of large amounts of data quickly)
c.
Explanation Facility (What, how, why and when question of a problem and its recommendation can be obtained from the system. Provides an audit trail)
d.
Handling data uncertainties (Probabilities, certainty factors, or confidence levels can be applied to any or all input data)
e. Performing symbolic processing (Manipulation of symbols to arrive at reasonable problem conclusions)
f.
Conflict resolution (Selection criteria for choosing which rules need to be evaluated first. The system is able to prioritize which recommendation/tasks are of most importance)
g.
Knowledge acquisition facility (The ability of a user to enter knowledge into the system without explicitly knowing how to perform coding/programming)
h. Reporting facility
i. Training module
j. 24/7 online availability (Highly immune to system overload and crashes. Very stable)
k.
Interoperability/Compatibility with other/existing systems (Seamless integration with other systems and effectively uses data from multiple databases in different data formats)
l. User Friendliness (Needs of user(s) have been adequately considered in design)
Current System Status (kindly give your assessment on the systems impact now): 1=lowest, 5=highest
# 1 2 3 4 5 Description
Syst
em
Val
ue
a. Adequately performs the duties of an expert/experienced professional
b. Increased productivity (reduced time and cost of maintenance activities)
c.
Additions to personnel’s general knowledge in areas such as event recognition, problem solving, fault diagnosis & prognosis, etc., (knowledge transfer/competence building)
d. Significant enhancement in equipment availability and reliability
e. Significant improvement in the consistency and quality of work output (Value added gains)
f. Efficient for real-time decision making (Decision support effectiveness)
g. Enhances preventive/predictive/proactive/dynamic maintenance capabilities
h. Efficient work planning and resource allocation
i. Positively impacted HSE activities
System Potential (Kindly give your opinion on how significant you think the system can/should impact these areas): 1=lowest, 5=highest
# 1 2 3 4 5 Description
Syst
em
Val
ue
a. Adequately performs the duties of an expert/experienced professional
b. Increased productivity (reduced time and cost of maintenance activities)
c.
Additions to personnel’s general knowledge in areas such as event recognition, problem solving, fault diagnosis & prognosis, etc., (knowledge transfer/competence building)
d. Significant enhancement in equipment availability and reliability
e. Significant improvement in the consistency and quality of work output (Value added gains)
f. Efficient for real-time decision making (Decision support effectiveness)
g. Enhances preventive/predictive/proactive/dynamic maintenance capabilities
h. Efficient work planning and resource allocation
i. Positively impacted HSE activities
Interview Questions
About System Acquisition & Domain Application Area 1. What is/was the primary purpose for obtaining the system?
…………………………………………………………………………………………………………….
2. Are there any other functions for which the system is employed/deployed?
…………………………………………………………………………………………………………….
3. Whose initial idea was it to acquire such a system?
a. Research & Development
b. Technical department
c. Marketing department
d. Integrated operations (IO) /onshore offshore Collaboration centers
e. Other (please specify…………………………………………………………………….)
4. What brought about the need for the acquisition/development of the system?
a. Need for improvement in HSE level
b. Lack of competences
c. Cost effectiveness of work processes
d. Need for consistency/quality in work output
e. Enhanced control/monitoring of the integrity of assets
f. External motivation, such as market competition
g. Management requirement
h. Need for productivity improvement
i. Compliance with prevailing rules and regulations
j. Deficiencies in existing work processes
k. Desire to stay abreast of the technology
5. When was the need for the acquisition/development of the system first identified?
…………………………………………………………………………………………………………….
6. When was the system implemented?
…………………………………………………………………………………………………………….
7. Why was this particular system/software/product chosen? Select your top 3(three)
a. Cost/price
b. Effectiveness/usefulness
c. Easier integration with existing system(s)/compatibility
d. Existing contractual obligations/preferred developer/contractor
e. State of the art technology
f. Other (please specify…………………………………………………………………….)
8. Were there any other suitable systems (in the market from competitive developers) identified and assessed?
a. Yes
b. No
If yes, why were the other systems rejected?
a. Too high cost
b. Did not meet all functional requirements
c. Compatibility issues with existing system/IT infrastructure
d. Not user friendly
e. Outdated technology
f. Other reasons (please specify………………………………………………………………………………..)
9. What were the major challenges encountered during the process of acquisition and deployment of the system?
a. Upgrades to the existing IT infrastructure to support new system (integration & compatibility issues)
b. Data reliability & availability issues
Nii Nortey B.C. Lokko Page 84 6/14/2012
c. Data quality issues
d. Legal liability issues
e. System IT maintenance issues
f. Unwillingness of staff to adopt & use new system
g. Training of the staff/system users
h. Other (please specify…………………………………………………………………….)
About Experts and Expert Knowledge
# Yes No Additional Comments
1. How would you define who an expert is?
2. Does the company significantly rely on outsourced maintenance expertise?
3. Does the unavailability of experts negatively impact your work output? Explain
4. Do you (your department) have any particular way of dealing with the absence/unavailability of desired experts in problem scenarios?
5. Do you foresee a possible change in the availability/scarcity of experts for problem solving and decision making?
6. Do you foresee a change in the knowledge/expertise requirements of maintenance professionals in 10-15 years?
7. Do you think/believe expert knowledge can be preserved (should be preserved)?
8. Do you foresee (more) experts systems (ES) being developed for maintenance purposes in your company/oil and gas industry?
9. Would you be willing/open to use/rely on (other) expert systems in your company/department?
Kindly rank the following according to the level of impact the Expert System (ES) is (or should be) having on the maintenance
department (1-4, 1 as lowest and 4 as highest)
a. Quality of decision-making ……………………….
b. Degree of centralization/decentralization of decision-making authority ……………………….
c. Departmental structure ……………………….
d. Departmental efficiency and effectiveness ……………………….
Nii Nortey B.C. Lokko Page 85 6/14/2012
Impact of Integrated Operation on Organization and Work Processes
# Yes No Additional Comments
1. Has integrated operations (IO) significantly impacted the need for innovative products/systems within the field of operation and maintenance?
2. Has IO increased in-house development of new technology more than it has increased market search for existing products/systems.
3. Do you think IO has made it easier for personnel to open-up to using/relying on new technologies?
4. Since the introduction of IO, has there been a need for special expertise? As regards teams in IO…
5. Do you see any major changes, particularly within maintenance management, due to IO (Generation 1&2)?
6. What is would be the role of ES/DSS in: a) Improving cost efficient maintenance? b) Safety/HSE of maintenance management/tasks (e.g.
avoiding unwanted events)? c) Asset performance and condition assessment?
7. Would you say the use of ES/DSS is (and will continue to be central to fully achieving the maintenance goals within IO)?
Kindly rank the following according to the level of impact integrated operations (IO) is having on the organization (1-4, 1 as
lowest and 4 as highest)
a. Quality of decision-making ……………………….
b. Degree of centralization/decentralization of decision-making authority ……………………….
c. Organizational structure ……………………….
d. Organizational efficiency and effectiveness ……………………….
Appendix 6: NCS Field Details from NPD
Field name Ownership kind Operator Ownership from date
Type of Development
ALVE PRODUCTION LICENSE Statoil Petroleum AS 16.03.2007 Standard Subsea Template
ALVHEIM PRODUCTION LICENSE Marathon Oil Norge AS
06.10.2004 FPSO with subsea wells
ATLA PRODUCTION LICENSE 04.11.2011
BALDER PRODUCTION LICENSE ExxonMobil Exploration & Production Norway AS
02.02.1996 FPSO with subsea wells
BLANE BUSINESS ARRANGEMENT AREA
Talisman Energy Norge AS
01.07.2005 Subsea template tieback to ULA
BRAGE BUSINESS ARRANGEMENT AREA
Statoil Petroleum AS 27.12.1993 Fixed integrated production, accomodation, drilling facility with steel Jacket
BRYNHILD PRODUCTION LICENSE 11.11.2011
DRAUGEN PRODUCTION LICENSE A/S Norske Shell 19.12.1988 Fixed concrete facility with integrated topside
EKOFISK PRODUCTION LICENSE ConocoPhillips Skandinavia AS
01.03.1972 Fixed integrated production, accomodation, drilling, processing facility with concrete storage tank
ELDFISK PRODUCTION LICENSE ConocoPhillips Skandinavia AS
25.04.1975 3 separate facilities with combined drilling, processing, water injection & wellhead connected by a bridge
EMBLA PRODUCTION LICENSE ConocoPhillips Skandinavia AS
14.12.1990 Unmanned wellhead facility remotely controlled from Eldfisk
ENOCH BUSINESS ARRANGEMENT AREA
Talisman North Sea Limited
01.07.2005 Subsea facility tied-in to Brae
FRAM PRODUCTION LICENSE Statoil Petroleum AS 23.03.2001 4 subsea templates tied-back to Troll C
GAUPE PRODUCTION LICENSE BG Norge AS 25.06.2010 2 horizontal well tied to Armanda
GIMLE BUSINESS ARRANGEMENT AREA
Statoil Petroleum AS 18.05.2006 Tied to Gullfaks C facility with 2 producers
GJØA PRODUCTION LICENSE GDF SUEZ E&P Norge AS
14.06.2007 5 subsea templates tied to semi-submersible production & processing facility with onshore power supply
GLITNE PRODUCTION LICENSE Statoil Petroleum AS 10.01.2001 6 horizontal producers tied back to production & storage vessel "Petrojarl 1"
GOLIAT PRODUCTION LICENSE Eni Norge AS 18.06.2009 8 subsea templates tied to a circular floating production facility with integrated storage & loading system
GRANE BUSINESS ARRANGEMENT AREA
Statoil Petroleum AS 14.06.2000 Fixed integrated production, accomodation, drilling facility with steel Jacket
GUDRUN PRODUCTION LICENSE 16.06.2010 Processing facility tied to Sleipner A
GULLFAKS PRODUCTION LICENSE Statoil Petroleum AS 09.10.1981 3 integrated processing, drilling & accomodation facilities with concrete bases & steel topsides
GULLFAKS SØR
PRODUCTION LICENSE Statoil Petroleum AS 29.03.1996 12 subsea templates tied back to Gullfaks A & C facilities
GUNGNE PRODUCTION LICENSE Statoil Petroleum AS 29.08.1995 3 producers drilled from Sleipner A
GYDA PRODUCTION LICENSE Talisman Energy Norge AS
02.06.1987 combined processing, accomodation, drilling facility with steel Jacket
HEIDRUN BUSINESS ARRANGEMENT AREA
Statoil Petroleum AS 27.11.1991 Floating concrete tension leg platform with subsea template
HEIMDAL PRODUCTION LICENSE Statoil Petroleum AS 13.10.2003 Integrated production, accomodation, drilling facility with steel Jacket
HOD PRODUCTION LICENSE BP Norge AS 26.06.1988 Unmanned production facility remotely controlled from Valhall
HULDRA BUSINESS ARRANGEMENT AREA
Statoil Petroleum AS 02.02.1999 Unmanned wellhead facility with a simple process plant remotely controlled from Veslfrikk
Nii Nortey B.C. Lokko Page 87 6/14/2012
HYME PRODUCTION LICENSE 24.06.2011
ISLAY PRODUCTION LICENSE 05.07.2010
JETTE BUSINESS ARRANGEMENT AREA
17.02.2012
JOTUN BUSINESS ARRANGEMENT AREA
ExxonMobil Exploration & Production Norway AS
01.01.1998 Juton A (FPSO), Juton B (wellhead facility)
KNARR PRODUCTION LICENSE 09.06.2011
KRISTIN BUSINESS ARRANGEMENT AREA
Statoil Petroleum AS 17.12.2001 4 subsea templates tied back to semi-submersible for processing
KVITEBJØRN PRODUCTION LICENSE Statoil Petroleum AS 14.06.2000 Integrated processing, accomodation, drilling facility with steel Jacket
MARULK PRODUCTION LICENSE Statoil Petroleum AS 15.07.2010 Subsea template tied to Norne vessel
MIKKEL BUSINESS ARRANGEMENT AREA
Statoil Petroleum AS 14.09.2001 2 subsea templates tied back to Åsgard B
MORVIN PRODUCTION LICENSE Statoil Petroleum AS 25.04.2000 2 subsea templates tied back to Åsgard B
MURCHISON BUSINESS ARRANGEMENT AREA
CNR International (UK) Limited
01.04.1979 combined production, accomodation, drilling facility with steel Jacket
NJORD BUSINESS ARRANGEMENT AREA
Statoil Petroleum AS 12.06.1995 Subsea well tied to semi-submersible with drilling, accomodation & production facilities, and a storage vessel
NORNE BUSINESS ARRANGEMENT AREA
Statoil Petroleum AS 09.03.1995 FPSO with 7 subsea wells
ODIN PRODUCTION LICENSE 16.02.2007
ORMEN LANGE
BUSINESS ARRANGEMENT AREA
A/S Norske Shell 02.04.2004 3 subsea templates
OSEBERG BUSINESS ARRANGEMENT AREA
Statoil Petroleum AS 16.06.2004 Osberg A (processing & accomodation), Osberg B (drilling & water injection), Osberg C (integrated PDQ), Osberg D (gas processing), Osberg Vestflanke (subsea template tied back to Osberg B), Osberg Delta (subsea template tied back to Osberg D)
OSEBERG SØR
BUSINESS ARRANGEMENT AREA
Statoil Petroleum AS 16.06.2004 Integrated steel facility with drilling, accomodation & first stage separation tied to Osberg Field Centre (A & B)
OSEBERG ØST
BUSINESS ARRANGEMENT AREA
Statoil Petroleum AS 16.06.2004 Integrated steel facility with drilling, accomodation & first stage separation tied to Osberg Field Centre (A & B)
OSELVAR PRODUCTION LICENSE DONG E&P Norge AS 19.06.2009 Subsea template tied to Ula by pipeline
REV PRODUCTION LICENSE Talisman Energy Norge AS
15.06.2007 3 subsea gas producers connected to Amanda Field
RINGHORNE ØST
BUSINESS ARRANGEMENT AREA
ExxonMobil Exploration & Production Norway AS
10.11.2005 3 producers drilled from Ringhorne facility on Blader field
SIGYN PRODUCTION LICENSE ExxonMobil Exploration & Production Norway AS
31.08.2001 Subsea template tied back to Sleipner Øst
SKARV BUSINESS ARRANGEMENT AREA
BP Norge AS 18.12.2007 5 subsea templates tied to FPSO
SKIRNE PRODUCTION LICENSE Total E&P Norge AS 05.07.2002 2 subsea templates tied to Heimdal by pipeline
SKULD PRODUCTION LICENSE 20.01.2012
SLEIPNER VEST
BUSINESS ARRANGEMENT AREA
Statoil Petroleum AS 01.07.1994 Wellhead facility & processing facility connected to Sleipner Øst by bridge
SLEIPNER ØST
BUSINESS ARRANGEMENT AREA
Statoil Petroleum AS 15.01.1993 Integrated processing, accomodation, drilling facility with concrete gravity base structure
Nii Nortey B.C. Lokko Page 88 6/14/2012
SNORRE BUSINESS ARRANGEMENT AREA
Statoil Petroleum AS 27.05.1988 Snorre A (TLP for accomodation, drilling, processing and a separate process module for production from Vidgis), Snorre B (semi-submersible with integrated drilling, processing & accomodation facilities)
SNØHVIT BUSINESS ARRANGEMENT AREA
Statoil Petroleum AS 07.03.2002
STATFJORD BUSINESS ARRANGEMENT AREA
Statoil Petroleum AS 01.06.1979 4 fully integrated facilities
STATFJORD NORD
PRODUCTION LICENSE Statoil Petroleum AS 11.12.1990 3 subsea templates tied back to Statfjord C
STATFJORD ØST
BUSINESS ARRANGEMENT AREA
Statoil Petroleum AS 26.06.1991 3 subsea templates tied back to Statfjord C
SYGNA BUSINESS ARRANGEMENT AREA
Statoil Petroleum AS 30.04.1999 1 subsea template tied back to Statfjord C
TAMBAR PRODUCTION LICENSE BP Norge AS 03.04.2000 Remotely controlled wellhead facility without processing equipment
TAMBAR ØST BUSINESS ARRANGEMENT AREA
BP Norge AS 28.06.2007 1 producer drilled from Tambar
TOR BUSINESS ARRANGEMENT AREA
ConocoPhillips Skandinavia AS
10.12.1975 Combined wellhead & processing facility tied to Ekofisk
TORDIS PRODUCTION LICENSE Statoil Petroleum AS 14.05.1991 7 statellite wells & 2 subsea templates tied
to a central manifold which is tied back to Gullfaks C
TROLL BUSINESS ARRANGEMENT AREA
Statoil Petroleum AS 01.01.1987 Troll A (fixed wellhead & compression facility with concrete substructure), Troll B (floating concrete accomodation & production facility), Troll C (semi-submersible with accomodation & production facility), Troll Vest (subsea templates tied back to B & C)
TRYM PRODUCTION LICENSE DONG E&P Norge AS 26.03.2010 Subsea template tied to Harald facility
TUNE PRODUCTION LICENSE Statoil Petroleum AS 17.12.1999 Subsea template & satellite well tied back to Oseberg
TYRIHANS BUSINESS ARRANGEMENT AREA
Statoil Petroleum AS 16.02.2006 5 subsea template tied back to Kristin
ULA PRODUCTION LICENSE BP Norge AS 30.05.1980 3 conventional steel drilling, production & accomodation facilities connected by bridges
URD PRODUCTION LICENSE Statoil Petroleum AS 02.07.2004 Subsea templates tied back to Norne Vessel
VALE PRODUCTION LICENSE Statoil Petroleum AS 23.03.2001 Subsea template tied back to Heimdal
VALEMON BUSINESS ARRANGEMENT AREA
09.06.2011
VALHALL BUSINESS ARRANGEMENT AREA
BP Norge AS 28.09.1982 3 facilities for accomodation, drilling & production, a wellhead facility and a water injection faciliy all connected by bridges. 2 other wellhead facilities have been installed
VARG PRODUCTION LICENSE Talisman Energy Norge AS
03.05.1996 Production vessel Petrojarl Varg with integrated oil storage connected to wellhead facility
VEGA BUSINESS ARRANGEMENT AREA
Statoil Petroleum AS 01.03.2011 2 subsea templates tied back to Gjøa
VEGA SØR BUSINESS ARRANGEMENT AREA
Statoil Petroleum AS 01.03.2011 Subsea template tied to Vega
VESLEFRIKK PRODUCTION LICENSE Statoil Petroleum AS 02.06.1987 Veslefrikk A (fixed steel wellhead facility with bridge connection to B), Veslefrikk B (semi-submerisble with processing & accomodation facilities)
VIGDIS PRODUCTION LICENSE Statoil Petroleum AS 16.12.1994 Subsea templates connected to Snorre A
VILJE PRODUCTION LICENSE Statoil Petroleum AS 17.10.2008 2 horizontal subsea well connected to Alvheim FPSO
VISUND BUSINESS ARRANGEMENT AREA
Statoil Petroleum AS 29.03.1996 Semi-submersible with integrated drilling, processing & accomodation steel facilities
Nii Nortey B.C. Lokko Page 89 6/14/2012
VISUND SØR BUSINESS ARRANGEMENT AREA
10.06.2011
VOLUND PRODUCTION LICENSE Marathon Oil Norge AS
18.01.2007 Subsea tie back to Alvheim FPSO
VOLVE PRODUCTION LICENSE Statoil Petroleum AS 28.11.2006 Jack-up processng & drilling facility with Navion Saga stabilised oil storage vessel
YME PRODUCTION LICENSE Talisman Energy Norge AS
18.06.2004 Jack-up production facility placed above a storage tank for oil
YTTERGRYTA PRODUCTION LICENSE Statoil Petroleum AS 21.05.2008 Subsea template tied to Midgard
ÅSGARD BUSINESS ARRANGEMENT AREA
Statoil Petroleum AS 14.06.1996 Åsgard A (production & storage vessel connected to subsea wells), Åsgard B(semi-submersible for processing of gas & condensate), Åsgard C (storage vessel for condensate)