+ All Categories
Home > Documents > The role of a University curriculum design in intercultural sensitivity...

The role of a University curriculum design in intercultural sensitivity...

Date post: 12-Mar-2018
Category:
Upload: nguyenbao
View: 216 times
Download: 1 times
Share this document with a friend
30
The role of a University curriculum design in intercultural sensitivity of students Author: Luuk R. M. Geurts University of Twente P.O. Box 217, 7500AE Enschede The Netherlands [email protected] This 3-year research project is about an extend, to what the perceived intercultural orientation of the teaching style, group work and the environment determine the intercultural sensitivity of university graduates. This paper reports on the second round of data collection. A surprising finding is shown there is no significant change in the level of intercultural sensitivity or its five scales between the two samples. Doing correlation and regressions analysis it showed the research model as 10.1% of the variance in the intercultural sensitivity of students. Perceived intercultural orientation of the teaching style and intercultural orientation of the environment had a minor significant positive relationship with intercultural sensitivity, where intercultural orientation of the group work had no significant correlation with intercultural sensitivity. Based on these findings, we dare to assume that active mixing students in cross-cultural project groups does not necessarily lead to a stronger intercultural sensitivity. Future research should explore and test other antecedents of intercultural sensitivity that can be brought about by the university curriculum design. Supervisors: Prof. Dr. T. Bondarouk Dr. H. G. van der Kaap Keywords Intercultural sensitivity, university curriculum, group work, teaching style, environment Permission to make digital or hard copies of all or part of this work for personal or classroom use is granted without fee provided that copies are not made or distributed for profit or commercial advantage and that copies bear this notice and the full citation on the first page. To copy otherwise, or republish, to post on servers or to redistribute to lists, requires prior specific permission and/or a fee. 3 rd IBA Bachelor Thesis Conference, July 3rd, 2014, Enschede, The Netherlands. Copyright 2014, University of Twente, Faculty of Behaviourial, Management & Social sciences.
Transcript

The role of a University curriculum design in

intercultural sensitivity of students

Author: Luuk R. M. Geurts University of Twente

P.O. Box 217, 7500AE Enschede The Netherlands

[email protected]

This 3-year research project is about an extend, to what the perceived intercultural

orientation of the teaching style, group work and the environment determine the

intercultural sensitivity of university graduates. This paper reports on the second

round of data collection. A surprising finding is shown there is no significant

change in the level of intercultural sensitivity or its five scales between the two

samples. Doing correlation and regressions analysis it showed the research model as

10.1% of the variance in the intercultural sensitivity of students. Perceived

intercultural orientation of the teaching style and intercultural orientation of the

environment had a minor significant positive relationship with intercultural

sensitivity, where intercultural orientation of the group work had no significant

correlation with intercultural sensitivity. Based on these findings, we dare to assume

that active mixing students in cross-cultural project groups does not necessarily lead

to a stronger intercultural sensitivity. Future research should explore and test other

antecedents of intercultural sensitivity that can be brought about by the university

curriculum design.

Supervisors:

Prof. Dr. T. Bondarouk

Dr. H. G. van der Kaap

Keywords Intercultural sensitivity, university curriculum, group work, teaching style, environment

Permission to make digital or hard copies of all or part of this work for personal or classroom use is granted without fee provided that copies are

not made or distributed for profit or commercial advantage and that copies bear this notice and the full citation on the first page. To copy otherwise, or republish, to post on servers or to redistribute to lists, requires prior specific permission and/or a fee.

3rd IBA Bachelor Thesis Conference, July 3rd, 2014, Enschede, The Netherlands.

Copyright 2014, University of Twente, Faculty of Behaviourial, Management & Social sciences.

2

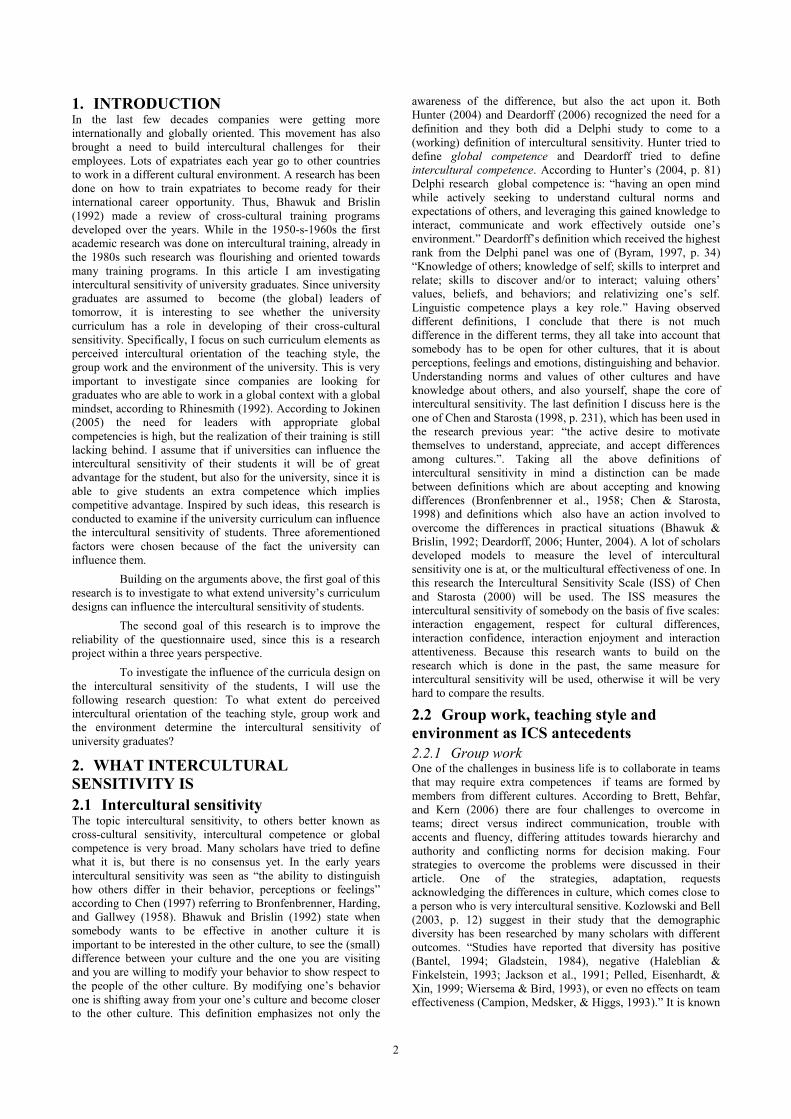
1. INTRODUCTION In the last few decades companies were getting more

internationally and globally oriented. This movement has also

brought a need to build intercultural challenges for their

employees. Lots of expatriates each year go to other countries

to work in a different cultural environment. A research has been

done on how to train expatriates to become ready for their

international career opportunity. Thus, Bhawuk and Brislin

(1992) made a review of cross-cultural training programs

developed over the years. While in the 1950-s-1960s the first

academic research was done on intercultural training, already in

the 1980s such research was flourishing and oriented towards

many training programs. In this article I am investigating

intercultural sensitivity of university graduates. Since university

graduates are assumed to become (the global) leaders of

tomorrow, it is interesting to see whether the university

curriculum has a role in developing of their cross-cultural

sensitivity. Specifically, I focus on such curriculum elements as

perceived intercultural orientation of the teaching style, the

group work and the environment of the university. This is very

important to investigate since companies are looking for

graduates who are able to work in a global context with a global

mindset, according to Rhinesmith (1992). According to Jokinen

(2005) the need for leaders with appropriate global

competencies is high, but the realization of their training is still

lacking behind. I assume that if universities can influence the

intercultural sensitivity of their students it will be of great

advantage for the student, but also for the university, since it is

able to give students an extra competence which implies

competitive advantage. Inspired by such ideas, this research is

conducted to examine if the university curriculum can influence

the intercultural sensitivity of students. Three aforementioned

factors were chosen because of the fact the university can

influence them.

Building on the arguments above, the first goal of this

research is to investigate to what extend university’s curriculum

designs can influence the intercultural sensitivity of students.

The second goal of this research is to improve the

reliability of the questionnaire used, since this is a research

project within a three years perspective.

To investigate the influence of the curricula design on

the intercultural sensitivity of the students, I will use the

following research question: To what extent do perceived

intercultural orientation of the teaching style, group work and

the environment determine the intercultural sensitivity of

university graduates?

2. WHAT INTERCULTURAL

SENSITIVITY IS

2.1 Intercultural sensitivity The topic intercultural sensitivity, to others better known as

cross-cultural sensitivity, intercultural competence or global

competence is very broad. Many scholars have tried to define

what it is, but there is no consensus yet. In the early years

intercultural sensitivity was seen as “the ability to distinguish

how others differ in their behavior, perceptions or feelings”

according to Chen (1997) referring to Bronfenbrenner, Harding,

and Gallwey (1958). Bhawuk and Brislin (1992) state when

somebody wants to be effective in another culture it is

important to be interested in the other culture, to see the (small)

difference between your culture and the one you are visiting

and you are willing to modify your behavior to show respect to

the people of the other culture. By modifying one’s behavior

one is shifting away from your one’s culture and become closer

to the other culture. This definition emphasizes not only the

awareness of the difference, but also the act upon it. Both

Hunter (2004) and Deardorff (2006) recognized the need for a

definition and they both did a Delphi study to come to a

(working) definition of intercultural sensitivity. Hunter tried to

define global competence and Deardorff tried to define

intercultural competence. According to Hunter’s (2004, p. 81)

Delphi research global competence is: “having an open mind

while actively seeking to understand cultural norms and

expectations of others, and leveraging this gained knowledge to

interact, communicate and work effectively outside one’s

environment.” Deardorff’s definition which received the highest

rank from the Delphi panel was one of (Byram, 1997, p. 34)

“Knowledge of others; knowledge of self; skills to interpret and

relate; skills to discover and/or to interact; valuing others’

values, beliefs, and behaviors; and relativizing one’s self.

Linguistic competence plays a key role.” Having observed

different definitions, I conclude that there is not much

difference in the different terms, they all take into account that

somebody has to be open for other cultures, that it is about

perceptions, feelings and emotions, distinguishing and behavior.

Understanding norms and values of other cultures and have

knowledge about others, and also yourself, shape the core of

intercultural sensitivity. The last definition I discuss here is the

one of Chen and Starosta (1998, p. 231), which has been used in

the research previous year: “the active desire to motivate

themselves to understand, appreciate, and accept differences

among cultures.”. Taking all the above definitions of

intercultural sensitivity in mind a distinction can be made

between definitions which are about accepting and knowing

differences (Bronfenbrenner et al., 1958; Chen & Starosta,

1998) and definitions which also have an action involved to

overcome the differences in practical situations (Bhawuk &

Brislin, 1992; Deardorff, 2006; Hunter, 2004). A lot of scholars

developed models to measure the level of intercultural

sensitivity one is at, or the multicultural effectiveness of one. In

this research the Intercultural Sensitivity Scale (ISS) of Chen

and Starosta (2000) will be used. The ISS measures the

intercultural sensitivity of somebody on the basis of five scales:

interaction engagement, respect for cultural differences,

interaction confidence, interaction enjoyment and interaction

attentiveness. Because this research wants to build on the

research which is done in the past, the same measure for

intercultural sensitivity will be used, otherwise it will be very

hard to compare the results.

2.2 Group work, teaching style and

environment as ICS antecedents

2.2.1 Group work One of the challenges in business life is to collaborate in teams

that may require extra competences if teams are formed by

members from different cultures. According to Brett, Behfar,

and Kern (2006) there are four challenges to overcome in

teams; direct versus indirect communication, trouble with

accents and fluency, differing attitudes towards hierarchy and

authority and conflicting norms for decision making. Four

strategies to overcome the problems were discussed in their

article. One of the strategies, adaptation, requests

acknowledging the differences in culture, which comes close to

a person who is very intercultural sensitive. Kozlowski and Bell

(2003, p. 12) suggest in their study that the demographic

diversity has been researched by many scholars with different

outcomes. “Studies have reported that diversity has positive

(Bantel, 1994; Gladstein, 1984), negative (Haleblian &

Finkelstein, 1993; Jackson et al., 1991; Pelled, Eisenhardt, &

Xin, 1999; Wiersema & Bird, 1993), or even no effects on team

effectiveness (Campion, Medsker, & Higgs, 1993).” It is known

3

groups or teams are, in general, harder to manage when they

consist of members from different cultural backgrounds. If it is

known how group work affects the level of somebody’s

intercultural sensitivity, universities can adapt their curriculum

design to improve the quality of the students. That is why group

work is taken as one of the independent variables in this

research.

2.2.2 Teaching style Previous research has shown the importance of multicultural

education. For example in the paper of Barry and Lechner

(1995) the conclusion was drawn that students see multicultural

education as something positive. Although the conclusion of the

authors is that teacher training programs have to have both

theory and practice during the whole duration of the program,

on the long term. In that way students can acquire the skills of

dealing with other cultures. Their research shows that the

teacher is an important factor for students able to impact

intercultural sensitivity since students see the teachers as

somebody who trains them dealing with multicultural problems

in education. Also Leeman and Ledoux (2003) recognize the

fact that preservice teachers need training and practice to learn

about diversity and intercultural education. Leeman and Ledoux

(2003) argue that teachers have to be able to take ethnic-cultural

diversity and racism into account and to overcome problems

when they occur and “be able to implement several intercultural

approaches” (Leeman & Ledoux, 2003, p. 282). Gay (2002)

brings the message that teaching requires “mastery of content

knowledge and pedagogical skills” (Gay, 2002, p. 106). She

argues that too many teachers have not the skills to teach to a

multicultural group of students. She claims that culturally

responsive teaching let students learn more thoroughly and

easily (Gay, 2000). As argued in the beginning, in this research

teaching style will be an independent variable to see the

influence of teaching style on intercultural sensitivity.

2.2.3 Environment With the environment in this research is meant all

environmental ‘prerequisites’ on the university campus, like

English signs, English speaking personnel, and a well-equipped

campus for multicultural groups. In their article, Lee and Janda

(2006) give ten recommendations to create a successful

multicultural campus. One of them, for example, is starting an

office on diversity and equality which have experts on the field

of multiculturalism and give advice how to create multicultural

friendly environment. Also for expatriates it is very important

to feel well in their new environment. For expatriates it is

shown that the family situation and relational abilities are the

two main factors which determine the chance the expatriates

will leave earlier or stay in his new country (Tung, 1987). I

argue that also student’s at a university need ways to be social

active and have other multicultural supportive facilities to feel

well at the university. This is why in this research environment

is the third independent variable of whom the influence on

intercultural sensitivity will be investigated.

2.3 Research framework The influence of the group work, the teaching style and the

environment on intercultural sensitivity will be investigated

because each of these variables is assumed to be linked in the

business environment to coping with culture. I think all three

variables are also connected to the educational field, especially

in the field of coping with different cultures in classrooms and

curricula. The concept of Intercultural Sensitivity is the one

made by Chen and Starosta (2000), which consists out of five

different aspects: interaction engagement, respect for cultural

differences, interaction confidence, interaction enjoyment and

interaction attentiveness. The relationship between the

independent and dependent variable is shown in figure 1.

Figure 1. Relationship between the three independent

variables with the intercultural sensitivity of students

Since this is the first research project where teaching style

(training), group work (team work) and the environment are

taking into a perspective of education instead of the business

environment, I built three hypotheses to test if these factors

really are related to the concept of intercultural sensitivity in an

educational environment.

H1: There is a significant strong positive relation between the

perceived intercultural orientation of the teaching style and

intercultural sensitivity: a. with interaction engagement; b. with

respect for cultural differences; c. with interaction confidence;

d. with interaction enjoyment; e. with interaction attentiveness.

H2: There is a significant strong positive relation between the

perceived intercultural orientation of the group work and

intercultural sensitivity: a. with interaction engagement; b. with

respect for cultural differences; c. with interaction confidence;

d. with interaction enjoyment; e. with interaction attentiveness.

H3: There is a significant strong positive relation between the

perceived intercultural orientation of the environment and

intercultural sensitivity: a. with interaction engagement; b. with

respect for cultural differences; c. with interaction confidence;

d. with interaction enjoyment; e. with interaction attentiveness.

With a significant strong relation I mean a relation of at least β

> 0.7, with a significance level of at least p < 0.5.

3. METHODOLOGY

3.1 Study design This study is a longitudinal study of a population students at the

University of Twente, the Netherlands. The students started

with their study in September 2012. There were two measuring

moments, one in 2013 and one in 2014 and a third will be in

2015. In 2014 it was not recorded which students were asked

and could not be linked to the 2013 responses, so no paired

sampling was conducted. 11 bachelor studies at the first

measuring moment and at 8 bachelor studies at the second

measuring moment were included in the empirical research. The

selection of studies of the year 2014 was based on the responses

in 2013, where studies with less than 20 respondents were

excluded. The study was performed through a questionnaire,

where all scales were measured by a 5-point Likert scale, see

appendix 1 and 2. The intercultural sensitivity part is taken over

from Chen and Starosta (2000). At the second measurement a

sample of the same population was questioned to see the change

of the dependent variable. In 2015, the third measurement will

take place, to see if some trends could be discovered.

4

3.2 Operationalization of the constructs The definitions I use for the aspects of the dependent variable

and the number of items used to measure these aspects are

shown in table 1. The perceived cultural orientation of the

teaching style, the perceived cultural orientation of the group

work and the perceived intercultural orientation of the

environment are self-administered. The definitions are, in the

same order as above: The perceived openness of a teacher

towards other cultures, encouragement of cross-cultural

sensitivity and activities during lessons, and the invitation to

learn from different cultures; The perceived students group

composition of different cultural backgrounds, and students’

cross-cultural approach to group work processes; The perceived

excellence of the university facilities and support for students

from different cultural backgrounds.

Table 2. Definitions of the dependent variables (Chen &

Starosta, 2000)

Interaction Engagement

Feeling of participation in

intercultural communication

Respect for cultural

differences

How participants orient to or

tolerate their counterparts'

culture and opinion

Interaction Confidence

How confident participates are

in the intercultural setting

Interaction Enjoyment

Participants' positive or

negatieve reaction toward

communicating with people

from different cultures

Interaction Attentiveness

Participants' effort to understand

what is going on in intercultural

interaction

3.3 Sampling The selection procedure of the sample was done on basis of a

study year. It was intended to hand out the questionnaire to

people who started their study in September 2012 at the

University of Twente. In 2014 I tried to reach the same group of

people to compare the results and possibly see interesting

changes. At the second measuring moment the following

studies were covered: Bedrijfskunde (Dutch Business

Administration), International Business Administration,

Bestuurskunde (Dutch Public Administration), Civiele

Techniek (Dutch Civil Engineering) Electrical Engineering,

Gezondheidswetenschappen (Dutch Health Sciences),

Industrieel Ontwerpen (Dutch Industrial Design), European

Studies. The studies Psychologie (Dutch Psychology),

Scheikundige technology (Dutch Chemical Technology) and

Advanced Technology were not covered in the second

measuring moment, but were measured during the first

measuring moment. The questionnaire for International

Business Administration and European Studies was handed-out

online since they had no lectures at the university. A Facebook

group with 342 members has been used and an website for users

registered for the Internship course where also 256 people were

reached. It is assumed that people were a member of the

website and of the Facebook group but I don’t assume the same

people filled the questionnaire out since I only collected 35

responses from them. In total I handed out 161 questionnaires

of which 150 were returned, so the response rate was 93%. The

online response rate is 8.8 percent, with 46 responses. Looking

at the gender of the respondents in 2013 58.6 percent of the

respondents were male, in 2014 64.3 percent. Most of the

respondents in 2013 and 2014 live in the Netherlands or

Germany, others are from all over the world. Both gender and

country of origin can be found in table 2.

3.4 Changes in questionnaire and its

reliability Since I wanted to improve the reliability of the questionnaire

I’ve changed a few items. All the changes in the second

questionnaire you can see in appendix 3. The first measuring

moment looked at the influence of the three independent

variables on the intercultural sensitivity. But, in a consensus

with other researchers, it was decided to explore additionally to

what extent intercultural sensitive people behave in reality, and

how this corresponds with their perceived intercultural

sensitivity. Therefore I have developed eight questions to

measure the actual behavior of the participants. I did this by

formulating questions related to intercultural sensitivity, but

show the actual behaviour. For example, if somebody actively

tries to mingle with people with a different cultural background

in project groups. This is just a beginning and needs to be

developed in the future years for this research project. At the

moment I want to use actual behavior as a control variable The

actual behavior questions also can be found in appendix 2.

Since I wanted to look at the relation between intercultural

sensitivity and group work, teaching style and the environment

and use and compare it with results from previous year, I

decided to use the same questionnaire with slight adjustments,

appendix 3, so the results aren’t influenced by the design of the

questionnaire. The reliability test results are shown in table 3.

The Interaction Engagement scale has a Cronbach’s Alpha of

.620, which is not very high to consider the scale reliable.

Looking at the change in the alpha when leaving items out of

the questionnaire, the highest increase of the reliability is when

leaving out item IEng_06, appendix 4. The reliability would

increase to .632, an increase of just .012, making the scale less

valid because of using less items to measure what I want to

measure. This is why I didn’t skip any item and used the scale

was surprisingly low, the scale had a Cronbach’s Alpha of only

.408, which is too low to consider this scale to be reliable.

Looking at the scale, it only consisted out of three items, which

is not much to measure a scale. Comparing the items it seemed

that leaving out item IAtt_03 would increase the Cronbach’s

Alpha to .481, an increase of .073, which is much for just

leaving out one item (appendix 5). Looking at the frequency of

item three many people answered possibility 3 out of 5

(appendix 6), this was an indication to compare it with the

other items of the scale in a crosstab (appendix 7).

Table 1. Countries of origin and gender of respondents

(2013 and 2014)

Year 2013 % 2014 %

The Netherlands 273 64.5 148 75.5

Germany 113 26.7 29 9.7

Other Countries 37 8.7 19 9.7

Male 248 58.6 126 64.3

Female 168 39.7 68 34.7

Other gender – no answer 7 1.7 2 1.0

Total N 423 - 196 -

5

In the crosstab I expected to see a pattern from upper left to

lower right, which was not true for these crosstabs. This was

also an indication something was wrong with the item. Keep

using the item is not good for the reliability, deleting the item is

not good for the scale, since it only consists out of two items

which makes the scale even less valid. Rewriting the item was

the best option, since also I myself didn’t fully understand the

meaning of the questions as a non-native English speaking

person. Therefore I have rewritten the item to: I have a feeling

of enjoyment towards differences between my culturally-distinct

counterpart and me. I also decided to add another item to make

the scale more valid and hopefully more reliable: During

interactions with people from other cultures I try to check that

the other person understands what I mean. (Appendix 3) The

Cronbach’s Alpha’s of the independent variables all are above

or near the .700, except for the Alpha of the Perceived

intercultural orientation of the environment, which Alpha is

.653 (table 3). Leaving out one item doesn't increase the Alpha.

For the purpose of this research, comparing the results of this

measurement with the results of last years’ measurement, it is

not wise to change the questionnaire too much, so that is why I

decided that I’m happy with these Alpha levels and continued

with the research with the slightly revised version of the

questionnaire.

All α-levels have risen in comparison with the previous year. Of

the first four scales of the dependent variable in the table no

questions were changed in a way the meaning is different. The

α-level of the interaction attentiveness scale increased

dramatically with 0.140. Comparing the reliability of the items

of this scale, I conclude that rewriting the third item and adding

a forth item were the right thing to increase the reliability. In the

future the reliability of this scale has to be increased more, since

the reliability of this scale still is too low to consider it reliable

enough, around .70. The reason the overall reliability increased

can be related to the fact that the student understands the

questionnaire more since the level of the English languish skills

has assumingly increased in their second year at the University.

The reliability of the actual behavior scale with eight items is

very low, 0.479. Factor analysis of the scale suggested three

dimensions (appendix 8). Looking at the content of the

questionnaire I discovered even two more

dimensions resulting in a total of five

dimensions. Dimension 1 covers item 26

and 32 (appendix 2), they are both about

how the culturally distinct counterpart

could interpret my words or actions.

Dimension 2 covers question item 27 and

33, they are both about being part of a

multicultural diverse group of people.

Dimension 3 covers item 28, it is not

related to item 29 as suggested by the

statistics. It is not about working together

with people from different cultures as

item 29 is. Dimension 4 covers item 29, it

is not related to item 28 content wise. The

last dimension, dimension 5, covers item

30 and 30, which both are about showing

interest in the norms of the other culture

(appendix 2, 3 & 8). Since there are so

many dimensions and the reliability is

very low, I decided not to use this ‘scale’

in the analysis this year. The actual

behavior ‘scale’ needs an improvement

for further use. Firstly a theoretical basis

is needed, then questions have to be

made, not the other way around.

3.5 Analysis To check for the dimensions of the actual behavior variable I

did a Varimax factor analysis. Compared with the statistical

results I used the content of the questionnaire to distinguish

different dimensions of Actual Behavior since it was shown it

was not a scale. To see if there are significant differences over

years I looked at the mean, standard deviation and the

significance level to make conclusions. Because the data is of

nominal or ordinal level I used independent t-tests to see

whether the difference in values is significant, since the data is

of different samples of the same group on different times. I use

.05 significance levels and I assumed that the variance of the

two samples was the same, unless the Levene’s Test showed a

significance level <.05. I controlled the dependent variable and

its scales for gender, English or non-English language-based

study program, if somebody lives shorter or longer than five

years in the Netherlands, if somebody origins from the

Netherlands or Germany, if somebody ever lived abroad, is

somebody has the intention to study abroad and for the fact if

somebody has foreign friends. To analyze the correlations

between the independent and the dependent variable Kendall’s

Tau-b was used because of the ordinal level of the

measurement. A linear regression analysis was used to estimate

the effect of the independent variable on intercultural

sensitivity. Multicollinearity analysis was used to check for a

high correlation between the independent variables, if this

occurs this is a problem.

4. FINDINGS

4.1 Comparing the dependent variable and

its scales Comparing the means and standard deviation for the dependent

variable a difference is shown, as can be seen in appendix 9 and

10. This difference is not significant as p=.245, this means that

there is no significant difference in the intercultural sensitivity

level between both years. In appendix 9 the results for checking

each of the scales for significant differences between the years

are shown precisely. Only interaction confidence and

interaction attentiveness show significant difference. Interaction

Table 3. Alpha levels of the dependent variable, scales of the dependent variables,

independent variables and actual behaviour

α 2013 #items 2013 α 2014 # items 2014

Intercultural Sensitivity

Interaction Engagement 0.620 7 0.727 7

Respect for cultural differences 0.740 6 0.800 6

Interaction Confidence 0.766 5 0.768 5

Interaction Enjoyment 0.689 3 0.692 3

Interaction Attentiveness 0.408 3 0.548 4

Perceived cultural orientation of

the teaching style

0.695 6 - -

Perceived cultural orientation of

the group work

0.726 3 - -

Perceived cultural orientation of

the environment

0.653 4 - -

Actual Behaviour - - 0.479 8

6

confidence showed a significant drop in 2014, but interaction

attentiveness show a significant raise in 2014.

When controlling the intercultural sensitivity for gender in both

years it is obvious that in 2013 there was a significant

difference between male and female levels of ICS. For the

variable and for all the scales except interaction enjoyment,

there was a significant difference between male and female.

Female have a significant higher score on intercultural

sensitivity and all its scales, except for interaction confidence,

than male. In 2014 this difference has disappeared, only for the

interaction confidence scale there still is a significant

difference, but for both male and female the score is lower than

in 2013.

When controlling for the language of the programme, in 2013

the variable show a significant difference. People who follow

an English language-based study programme are significantly

more intercultural sensitive than people who do not follow an

English language-based study programme. In 2014 this effect is

not present any more.

Only in the year 2014 there was asked about the duration of

stay in the Netherlands. I made a distinction between people

who lived for a maximum of five years in the Netherlands and

people who lived more than 5 years in the Netherlands. 5 years

is an arbitrary boundary. Only for the interaction attentiveness

scale there is a significant difference. People who live shorter in

the Netherlands than five years show a significant higher

interaction attentiveness level than people who live longer in

the Netherlands.

There is a remarkable difference in the year 2013 between

people who originate from the Netherlands and Germany.

People from Germany score significantly higher on the

dependent variable, and also on its scales. Looking at 2014,

this effect only exists for the interaction attentiveness scale.

In 2013 there is a significant difference when somebody has

lived abroad. On the dependent variable and its scales the scores

from people who ever lived abroad are significantly higher than

people who did not live abroad. In 2014 this effect is still there

for the dependent variable, but not for every scale. The scales

respect for cultural differences and interaction enjoyment do not

show a significant effect any more.

When somebody has the intention to study abroad there is a

significant effect for the dependent variable and its scales, for

both years. If somebody wants to study abroad the score on

intercultural sensitivity is significantly higher than people who

do not want to study abroad.

If somebody has foreign friends, for both years there is a

significant difference on the dependent variable and its scales.

Somebody who have foreign friends scores higher on

intercultural sensitivity than somebody who does not have

foreign friends. In 2014 this effect only is not applicable for the

Table 4. Correlations between independent variables and dependent variable with its scales

Mean Std. 1 2 3 4 5 6 7 8

1. Intercultural

sensitivity

Correlation Coefficient 3.68 0.44

2.Interaction

Engagement

Correlation Coefficient 3.52 0.48 .62**

3. Respect for

cultural differences

Correlation Coefficient 4.06 0.62 .57** .42

**

4. Interaction

Confidence

Correlation Coefficient 3.60 0.64 .52** .33

** .22

**

5. Interaction

Enjoyment

Correlation Coefficient 4.00 0.70 .63** .40

** .44

** .41

**

6.Interaction

Attantiveness

Correlation Coefficient 3.21 .060 .40** .32

** .19

** .17

** .11

**

7.Perceived

cultural orientation

of the teaching

style

Correlation Coefficient 2.92 0.61 .09** .08

* .08

* .08

* -.01 .15

**

8. Perceived

cultural orientation

of the group work

Correlation Coefficient 2.30 0.84 -.05 -.03 -.07* .01 -.15

** .07

* .34

**

9. Perceived

cultural orientation

of the environment

Correlation Coefficient 3.80 0.63 .20** .20

** .19

** .15

** .13

** .11

** .20

** .09

**

**. Correlation is significant at the 0.01 level (1-tailed).

*. Correlation is significant at the 0.05 level (1-tailed).

7

respect for cultural differences scale.

4.2 Relation between the independent and

dependent variable Performing the Kendall’s-Tau b test to check for correlations,

there are actually two significant correlations found. The

perceived intercultural orientation of the teaching style and the

perceived intercultural orientation of the environment are

significantly positively correlated with intercultural sensitivity.

As can be seen in table 4, the correlations are very weak, .20

and .09, but both are very significant p<.01. The perceived

intercultural orientation of the group work is not significantly

correlated with intercultural sensitivity, but shows a few

correlations with some of the scales. The perceived cultural

orientation of the teaching style is significantly positively

correlated with each of the scales, except of interaction

enjoyment. For the perceived intercultural orientation of the

environment the findings are all significantly positive

correlations with each of the five scales. But the correlations are

weak, between .11 and .20 with all significant levels below

p=.01. The perceived intercultural orientation of the teaching

style is only not significantly correlated with the interaction

enjoyment scale.

First I controlled for multicollinearity, but all the levels are

below 5, so there is no multicollinearity. The R square value of

the model is .101, which means 10.1 percent of the variance can

be explained by the three independent variables, which is very

low. Other factors account for almost 90 percent of the total

variance. (Appendix 11) Looking for each of the independent

variables separately, the perceived intercultural orientation of

the teaching style counts for 2 percent of the variance, the

intercultural orientation of the group work for just 0.2 percent,

but the environment accounts for 6.6 percent.

The regression levels of the independent variables can be found

in table 5. As can be seen, all the independent variables are

significant when taken into account together. The biggest

regression is for the perceived intercultural orientation of the

environment, with a 0.237 positive regression.

5. DISCUSSION

5.1 Changes in intercultural sensitivity It is a great surprise that the score of intercultural sensitivity of

students between both years does not differ significantly. It

could be expected to have raised, since at the University of

Twente there are a lot of international students with whom you

can get in touch. It is surprisingly that two scales do change,

meaning there is difference between the different aspects of

intercultural sensitivity. Students seem to become less confident

when interacting with people from a different cultures. This can

be as they did not have any actual international contact, but

when having it was very difficult. This can be an explanation

why the interaction attentiveness has raised significantly. That

the scores controlled for gender in 2013 were significantly

different for male and female was not that surprising, but that

these significant scores were almost gone in 2014, except for

interaction confidence, was very surprising. Research to explain

this difference would be interesting. In 2014 there was no

significant difference between people who follow an English

language-based programme and those who do not. I can

imagine that the students in between the two measuring

moments got active at sport-, culture-, study-, student- or other

associations at the campus of the University of Twente. This

can bring together all the students and mingle them with each

other so that the difference in the intercultural sensitivity faded

away. It is very remarkable to see that the only difference

between people who live longer and shorter than five years in

the Netherlands is the level of interaction attentiveness. I

assume that people who live shortly at the a new place have to

put extra effort into being understood and understand the

conversation partner. This finding is very strange when

compared with the results which came from if somebody has

the intention to study abroad in the future. If somebody wants to

study abroad, he is significantly more intercultural sensitive

than those who do not want. This can be an interesting subject

for future research, since this effect is shown for both years.

Also other studies suggest that actually study abroad can

increase the intercultural sensitivity even more (Anderson,

Lawton, Rexeisen, & Hubbard, 2006), which is interesting to

investigate further in future research. Students who live shorter

than five years in the Netherlands are foreigners who planned to

study abroad. But when they live for a short period (shorter than

Table 5. Regression analysis of the independent variables (grouped and alone) with intercultural sensitivity

Model

Unstandardized

Coefficients

Standardized

Coefficients

t Sig.

Correlations

B Std. Error Beta Zero-order Partial Part

1 (Constant) 2.930 .142 20.681 .000

Teaching style .121 .041 .164 2.947 .003 .150 .143 .137

Group work -.102 .029 -.190 -3.569 .000 -.075 -.173 -.166

Environment .166 .035 .237 4.814 .000 .262 .230 .224

1 (Constant) 3.352 .107 31.318 .000

Teaching Style .112 .036 .151 3.114 .002 .151 .151 .151

1 (Constant) 3.765 .064 58.781 .000

Group Work -.037 .026 -.070 -1.426 .155 -.070 -.070 -.070

1 (Constant) 2.982 .128 23.351 .000

Environment .184 .033 .262 5.534 .000 .262 .262 .262

8

five years) in the foreign country, they only are more

concerned about understanding and being understood by the

locals. Maybe the arbitrary boundary of five years it too large

since most of the students came to the Netherlands in the

summer of 2012, which actually is two years. For future

research and next years’ measurement it is wise to set the limit

to three years and do new analysis with this data with also that

boundary. Comparing the Dutch students with the German

students the results are the same with the duration of stay in the

Netherlands in 2014. In 2013 the duration of stay was not

measured, so no conclusions can be drawn. It would be

interesting to see if there is going to be a difference between

these two control variables. It is interesting to see that within

one year only interaction attentiveness is higher at German

students, but the four other scales are on the same level as the

Dutch students. On the dependent variable the scores of the

Dutch raised, the scores of the German students lowered at the

second measuring moment. It is interesting to do research if this

will be a trend or just a onetime phenomenon. The fact that

people who have lived abroad are more intercultural sensitive in

2013 seems not very strange, since they already have

intercultural experience. The fact that the differences are

becoming smaller in 2014 could be no surprise if you’ve taken

into account the lively campus and association’s life at the

University of Twente which means there is a lot of intercultural

activity. Maybe this also is an explanation for the fact that in

2014 the respect for cultural differences scale is not

significantly different any more between people who have or do

not have international friends. This also can be because of

someone had to work together with international people, or

because of international conflicts which stressed the differences

between cultures, for example the war in Syria or the war

between Ukraine and Russia.

5.2 Relations between the independent

variable with intercultural sensitivity It is very surprising to see that the correlations of the

independent variables are very low. Since I expected from the

literature to have significant strong positive relations between

the independent variables and the dependent variable and its

scales. The total variance which can be explained is 10.1

percent. The negative relation between the perceived cultural

orientation of the group work and the level of intercultural

sensitivity is very surprising to see, although not significantly,

but also in the literature studies show that group work do not

affect or do negatively affect team effectiveness (Campion et

al., 1993; Wiersema & Bird, 1993). This research suggests

group work is not related to intercultural sensitivity. Some

programmes are very active with mingle students into groups

which consists out of people with different cultural background

to make students be intercultural sensitive. This research shows

that this has nothing to do with becoming more interculturally

sensitive. This can be an interesting development to take into

account for future research. Due to the fact these three

independent variables only explain 10.1 percent of the variance

other factors have to be of more influence on intercultural

sensitivity. The perceived intercultural orientation of the

environment has to greatest influence on intercultural

sensitivity, although still little. For the future maybe

composition of the cultures within the classroom, international

experience, and the level of intercultural teaching materials

(books, powerpoint presentations etcetera) can be research done

about.

The limitations of this research project are at first the low

reliability of the interaction attentiveness scale, this needs to be

improved to do more reliable statements. Also because of the

change of two questions of the interaction attentiveness scale , I

can’t exclude this change as a factor of the change in value of

the scale. Also the actual behaviour scale needs improvement,

this year the scale was not developed enough so it couldn’t be

used in this research project. The sample was not paired, but

this makes it possible to do more in-depth research and do more

funded statements about the outcomes. The questions in the

questionnaire were not all the same, for next year a combination

of both the questionnaires would be favorable.

6. CONCLUSIONS Despite of acknowledged limitations, this research has shown

some very interesting results. Looking at the levels of

intercultural sensitivity, I observe that they did not significantly

change during this research project. Two of the five dimensions

changed over time, but it can be that they are negatively

correlated. People who lived abroad, want to study abroad or

have international friends are significantly more intercultural

sensitive than people who do not. At the first measuring

moment there were a lot of significant differences when

controlling for gender, living abroad etcetera. In 2014 there was

less differences, which implies that in earlier years there may be

differences between male and female, but that over time these

differences fade away because of some factor. One interesting

fact is the total significance in both years of students who have

the intention to study abroad. In future research it can be of

value to see why this effects persists. The relation of the

perceived intercultural orientation of the teaching style and

environment with intercultural sensitivity is very weak but

significantly positive. The relation with the perceived cultural

orientation of the group work with intercultural sensitivity is not

significant.

At the beginning of the research paper I formulated three main

hypothesis, which resulted in 15 sub-hypotheses. I did not find

any significant strong positive relation between one of the

independent variables with the intercultural sensitivity of one of

its scales. So I rejects all the hypotheses. (Table 4)

This study was motivated by the research question, To what

extent do perceived intercultural orientation of the teaching

style, group work and the environment determine the

intercultural sensitivity of university graduates. As I showed,

the intercultural orientation of the teaching style, group work

and environment determine only 10.1 percent of the

intercultural sensitivity of university graduates, this means 89.9

percent of the variances has to be explained by other factors.

I conclude that the perceived intercultural orientation of the

teaching style has a minor effect on the determination of

intercultural sensitivity of university graduates. This means that

the teacher has only very little influence on the intercultural

sensitivity of university graduates. For future research I suggest

to take learning materials into account, since a lot of students do

not go to every lecture, but are supposed to read the materials

for the preparation for their exams. For education it makes no

influence to have a teacher who has less attention for cultural

differences during lectures, since it only determines 2 percent of

the variance of intercultural sensitivity.

I conclude the perceived intercultural orientation of the group

work does not determine the intercultural sensitivity of

university graduates. This shows that programmes which are

very actively mingling people with cultural different

backgrounds between groups do not achieve a higher

intercultural sensitivity among their university graduates. If the

goal is to create a higher intercultural sensitivity among the

students, stop mingling them. For theoretical purposes there has

to be looked at other possible antecedents for intercultural

9

sensitivity, since the perceived intercultural orientation of the

group work is not correlated to intercultural sensitivity.

The perceived intercultural orientation of the environment

determines for more than 6.5 percent the level of intercultural

sensitivity of university graduates, which is an interesting fact.

For future research I want to suggest to look at the effect of the

environment on the antecedents of intercultural sensitivity. It

may be that if the environment is supportive, meaning that the

antecedents determining intercultural sensitivity are higher

when the environment is perceived supportive than when the

environment is not perceived supportive.

If actual behaviour is taken in to account next year the concept

of actual behaviour needs to be developed more, since this year

it was not thought about it thoroughly enough, an in-depth

theoretical background is needed.

Since this is a research project with a scope of three years I

want to make a few recommendations. At first, the next

researcher should try to get a paired sample as this makes

analyzing more interesting. Also, to look if it is possible to

analyze the duration of stay in the Netherlands in smaller steps.

When talking about new research fields I suggest to look for

other antecedents of intercultural sensitivity since these are not

the ones determining intercultural sensitivity very strong;

specifically to look at the content of the teaching materials, the

composition of different cultures in the classrooms and the

international experience a student can gain during his study, as

the data shows for both years students who want to study

abroad show a significantly higher intercultural sensitivity than

students who do not.

7. AKNOWLEGDEMENTS This research was not done on my own. I did this research for a

big part together with Julia Bönte, who also wrote an interesting

paper about the results (Bönte, 2014). Together we made the

questionnaire, collected results and analyzed the results. Tanya

Bondarouk was the one who got me interested in the

intercultural sensitivity of students and she helped me a lot with

building a theoretical framework, but also was of great

emotional help. At last I want to thank Harry van der Kaap,

with his statistical skill we were able to analyze our results very

thoroughly. Even when things went wrong Harry, and Tanya,

kept me, but also Julia, on the right track to finish this research

project on time, with joy and with a good feeling. A big thank

you to you all.

8. REFERENCES

Anderson, P. H., Lawton, L., Rexeisen, R. J., & Hubbard, A. C.

(2006). Short-term study abroad and intercultural

sensitivity: A pilot study. International Journal of

Intercultural Relations, 30(4), 457-469.

Bantel, K. A. (1994). Strategic Planning Openness The Role of

Top Team Demography. Group & Organization

Management, 19(4), 406-424.

Barry, N. H., & Lechner, J. V. (1995). Preservice teachers'

attitudes about and awareness of multicultural

teaching and learning. Teaching and Teacher

Education, 11(2), 149-161.

Bhawuk, D. P., & Brislin, R. (1992). The measurement of

intercultural sensitivity using the concepts of

individualism and collectivism. International Journal

of Intercultural Relations, 16(4), 413-436.

Bönte, J. K. L. (2014). Intercultural Sensitivity as a Result of

Educational Design: A Continued Panel Study. Paper

presented at the 3rdIBA Bachelor Thesis Conference,

Enschede, The Netherlands.

Brett, J., Behfar, K., & Kern, M. C. (2006). Managing

multicultural teams. Harvard business review, 84(11),

84.

Bronfenbrenner, U., Harding, J., & Gallwey, M. (1958). The

measurement of skill in social perception. Talent and

society, 29-111.

Byram, M. (1997). Teaching and assessing intercultural

communicative competence: Multilingual Matters.

Campion, M. A., Medsker, G. J., & Higgs, A. C. (1993).

Relations between work group characteristics and

effectiveness: Implications for designing effective

work groups. Personnel psychology, 46(4), 823-847.

Chen, G.-M. (1997). A Review of the Concept of Intercultural

Sensitivity.

Chen, G.-M., & Starosta, W. J. (1998). Foundations of

intercultural communication: Allyn and Bacon

Boston, MA.

Chen, G.-M., & Starosta, W. J. (2000). The development and

validation of the intercultural sensitivity scale.

Deardorff, D. K. (2006). Identification and assessment of

intercultural competence as a student outcome of

internationalization. Journal of studies in

international education, 10(3), 241-266.

Gay, G. (2000). Culturally responsive teaching: Theory,

practice and research. New York: Teachers

CollegePress.

Gay, G. (2002). Preparing for culturally responsive teaching.

JOURNAL OF TEACHER EDUCATION-

WASHINGTON DC-, 53(2), 106-116.

Gladstein, D. L. (1984). Groups in context: A model of task

group effectiveness. Administrative science quarterly,

499-517.

Haleblian, J., & Finkelstein, S. (1993). Top management team

size, CEO dominance, and firm performance: The

moderating roles of environmental turbulence and

discretion. Academy of Management Journal, 36(4),

844-863.

Hunter, W. D. (2004). Knowledge, skills, attitudes, and

experiences necessary to become globally competent.

Lehigh University.

Jackson, S. E., Brett, J. F., Sessa, V. I., Cooper, D. M., Julin, J.

A., & Peyronnin, K. (1991). Some differences make a

difference: Individual dissimilarity and group

heterogeneity as correlates of recruitment,

promotions, and turnover. Journal of applied

psychology, 76(5), 675.

Jokinen, T. (2005). Global leadership competencies: a review

and discussion. Journal of European Industrial

Training, 29(3), 199-216.

Kozlowski, S. W., & Bell, B. S. (2003). Work groups and teams

in organizations. Handbook of psychology.

Lee, G.-L., & Janda, L. (2006). Successful Multicultural

Campus: Free from Prejudice toward Minority

Professors. Multicultural Education, 14(1), 27-30.

Leeman, Y., & Ledoux, G. (2003). Preparing teachers for

intercultural education. Teaching Education, 14(3),

279-291.

Pelled, L. H., Eisenhardt, K. M., & Xin, K. R. (1999).

Exploring the black box: An analysis of work group

diversity, conflict and performance. Administrative

science quarterly, 44(1), 1-28.

Rhinesmith, S. H. (1992). Global mindsets for global managers.

Training & Development, 46(10), 63-69.

10

Tung, R. L. (1987). Expatriate assignments: Enhancing success

and minimizing failure. The Academy of Management

Executive (1987-1989), 117-125.

Wiersema, M. F., & Bird, A. (1993). Organizational

demography in Japanese firms: Group heterogeneity,

individual dissimilarity, and top management team

turnover. Academy of Management Journal, 36(5),

996-1025.

11

9. APPENDICES

1. Questionnaire 2013

2. Questionnaire 2014

3. Changes in questionnaire

4. Cronbach’s alpha after leaving out IEng_06

5. Cronbach’s alpha after leaving out IAtt_03

6. Frequency of item IAtt_03

7. Crosstab of IAtt_03 with items IAtt_01 and IAtt_02

8. Factor analysis actual behavior with the three dimensions and with the five dimensions

9. Independent t-tests for the control variables with the dependent variable and its scales

10. Number of respondents, mean, standard deviation of all independent t-tests

11. Multicollinearity check of the independent variables

12

Appendix 1: Questionnaire 2013

Intercultural Sensitivity Survey

Part I

Indicate your choice by marking an ‘x’ in the blank before your choice.

1. Your Age: _____ [Age]

2. Your gender: __ Female __ Male __ I prefer not to answer [Gender]

3. Your student number: s_______ (Your student number will not be used for analyzing results and will be treated

confidentially.) [Student_number]

4. Your study programme: __ BK __ IBA (Hereafter we use the word “programme”.) [Study_programme]

5. Which year did you start with this study programme? _____ [Start_programme]

6. Which country are you from? ____________________________ [Country]

7. Have you ever lived abroad? __ No __ Yes [Live_abroad], Where? _______________________

[Live_abroad_where]

8. Do you plan to study abroad in the near future? (E.g. for your minor or master) __ Yes __ No

[Study_abroad]

9. Do you have friend(s) from countries other than your home country? __ Yes __ No

[International_friends]

Part II

Below is a series of statements, which do not imply right or wrong answers. Please work quickly and

record your first impression by indicating the degree to which you agree or disagree with the statement.

Put the number corresponding to your answer in the blank before the statement.

5 = strongly agree; 4 = agree; 3 = uncertain; 2 = disagree; 1 = strongly disagree

__ 1. Overall, teachers are aware of the culturally-diverse groups in the programme. [OTS_01]

__ 2. I feel that teachers usually prepare the lectures taking in consideration the cultural diversity of the

students. [OTS_02]

__ 3. In my view, teachers try to make students aware of the cultural differences within the classroom.

[OTS_03]

__ 4. Teachers encourage foreign students to express and present examples from their home cultures,

and cases modeled by their cultural settings. [OTS_04]

__ 5. Teachers usually use examples from different cultural and educational settings for exposing the

theories during the lectures. [OTS_05]

__ 6. I feel that the courses encourage an atmosphere of respect towards cultural differences. [OTS_06]

__ 7. The programme stimulates the integration of diverse cultural backgrounds when creating group

assignments. [OGW_01]

__ 8 It is usually required to form project groups with a mixture of people with different countries of

origin. [OGW_02]

__ 9. The group assignments require an application of diverse cultural backgrounds. [OGW_03]

__ 10. The university campus is well-equipped for foreign students. [OEnv_01]

__ 11. Student support personnel speak English well. [OEnv_02]

__ 12. Documents, necessary for the study progress, are available in English. [OEnv_03]

13

__ 13. Accommodation on the UT campus is friendly for an international audience. [OEnv_04]

Part III

Below is a series of statements concerning intercultural communication. There are no right or wrong

answers. Please work quickly and record your first impression by indicating the degree to which you agree

or disagree with the statement. Put the number corresponding to your answer in the blank before the

statement.

5 = strongly agree; 4 = agree; 3 = uncertain; 2 = disagree; 1 = strongly disagree

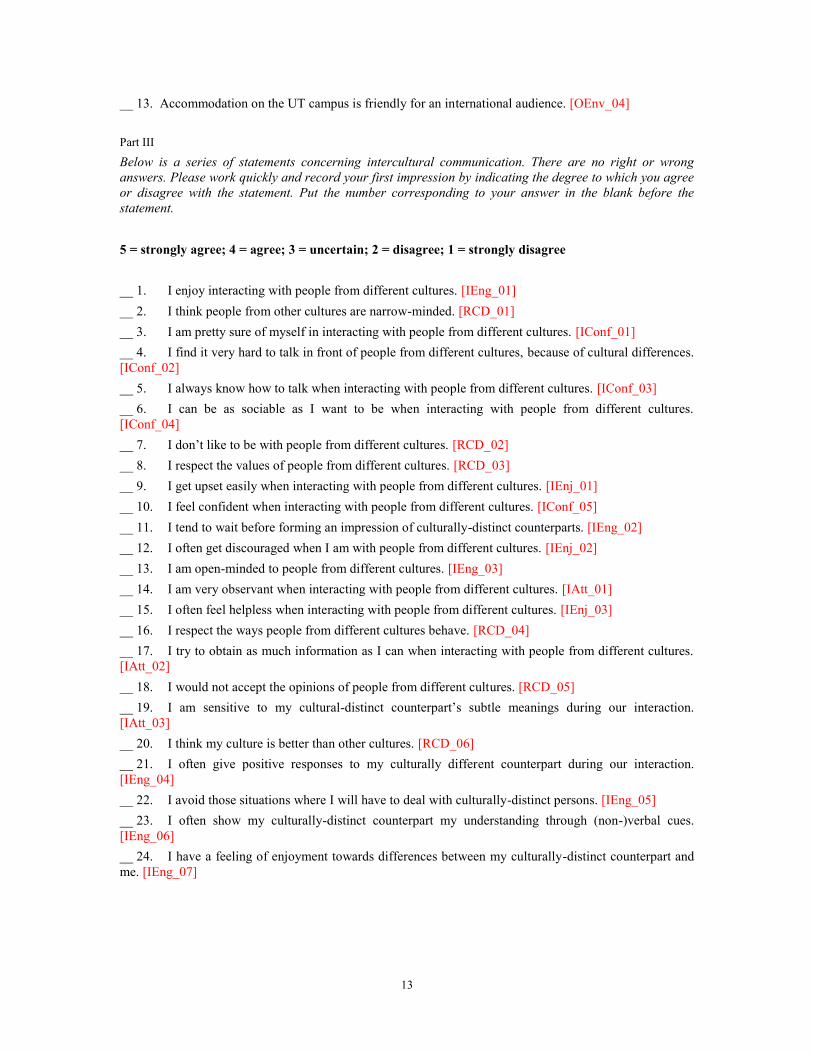
__ 1. I enjoy interacting with people from different cultures. [IEng_01]

__ 2. I think people from other cultures are narrow-minded. [RCD_01]

__ 3. I am pretty sure of myself in interacting with people from different cultures. [IConf_01]

__ 4. I find it very hard to talk in front of people from different cultures, because of cultural differences.

[IConf_02]

__ 5. I always know how to talk when interacting with people from different cultures. [IConf_03]

__ 6. I can be as sociable as I want to be when interacting with people from different cultures.

[IConf_04]

__ 7. I don’t like to be with people from different cultures. [RCD_02]

__ 8. I respect the values of people from different cultures. [RCD_03]

__ 9. I get upset easily when interacting with people from different cultures. [IEnj_01]

__ 10. I feel confident when interacting with people from different cultures. [IConf_05]

__ 11. I tend to wait before forming an impression of culturally-distinct counterparts. [IEng_02]

__ 12. I often get discouraged when I am with people from different cultures. [IEnj_02]

__ 13. I am open-minded to people from different cultures. [IEng_03]

__ 14. I am very observant when interacting with people from different cultures. [IAtt_01]

__ 15. I often feel helpless when interacting with people from different cultures. [IEnj_03]

__ 16. I respect the ways people from different cultures behave. [RCD_04]

__ 17. I try to obtain as much information as I can when interacting with people from different cultures.

[IAtt_02]

__ 18. I would not accept the opinions of people from different cultures. [RCD_05]

__ 19. I am sensitive to my cultural-distinct counterpart’s subtle meanings during our interaction.

[IAtt_03]

__ 20. I think my culture is better than other cultures. [RCD_06]

__ 21. I often give positive responses to my culturally different counterpart during our interaction.

[IEng_04]

__ 22. I avoid those situations where I will have to deal with culturally-distinct persons. [IEng_05]

__ 23. I often show my culturally-distinct counterpart my understanding through (non-)verbal cues.

[IEng_06]

__ 24. I have a feeling of enjoyment towards differences between my culturally-distinct counterpart and

me. [IEng_07]

14

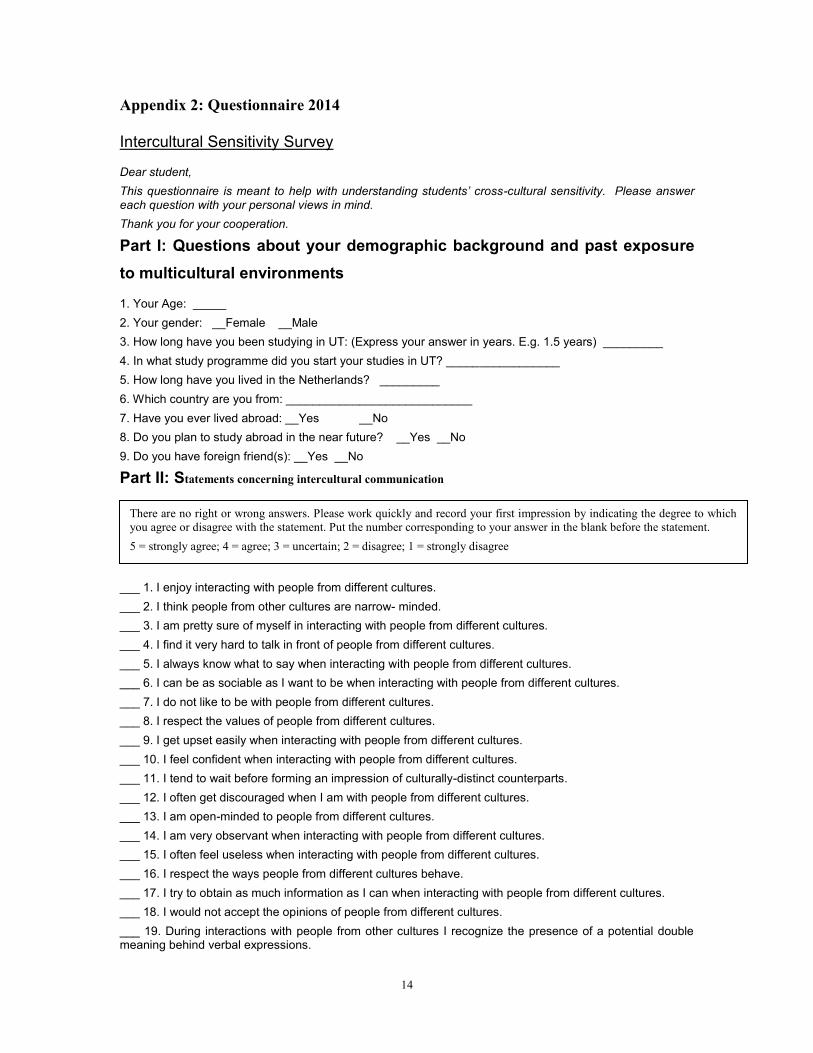
Appendix 2: Questionnaire 2014

Intercultural Sensitivity Survey

Dear student,

This questionnaire is meant to help with understanding students’ cross-cultural sensitivity. Please answer each question with your personal views in mind.

Thank you for your cooperation.

Part I: Questions about your demographic background and past exposure

to multicultural environments

1. Your Age: _____

2. Your gender: __Female __Male

3. How long have you been studying in UT: (Express your answer in years. E.g. 1.5 years) _________

4. In what study programme did you start your studies in UT? _________________

5. How long have you lived in the Netherlands? _________

6. Which country are you from: ____________________________

7. Have you ever lived abroad: __Yes __No

8. Do you plan to study abroad in the near future? __Yes __No

9. Do you have foreign friend(s): __Yes __No

Part II: Statements concerning intercultural communication

___ 1. I enjoy interacting with people from different cultures.

___ 2. I think people from other cultures are narrow- minded.

___ 3. I am pretty sure of myself in interacting with people from different cultures.

___ 4. I find it very hard to talk in front of people from different cultures.

___ 5. I always know what to say when interacting with people from different cultures.

___ 6. I can be as sociable as I want to be when interacting with people from different cultures.

___ 7. I do not like to be with people from different cultures.

___ 8. I respect the values of people from different cultures.

___ 9. I get upset easily when interacting with people from different cultures.

___ 10. I feel confident when interacting with people from different cultures.

___ 11. I tend to wait before forming an impression of culturally-distinct counterparts.

___ 12. I often get discouraged when I am with people from different cultures.

___ 13. I am open-minded to people from different cultures.

___ 14. I am very observant when interacting with people from different cultures.

___ 15. I often feel useless when interacting with people from different cultures.

___ 16. I respect the ways people from different cultures behave.

___ 17. I try to obtain as much information as I can when interacting with people from different cultures.

___ 18. I would not accept the opinions of people from different cultures.

___ 19. During interactions with people from other cultures I recognize the presence of a potential double meaning behind verbal expressions.

There are no right or wrong answers. Please work quickly and record your first impression by indicating the degree to which

you agree or disagree with the statement. Put the number corresponding to your answer in the blank before the statement.

5 = strongly agree; 4 = agree; 3 = uncertain; 2 = disagree; 1 = strongly disagree

15

___ 20. I think my culture is better than other cultures.

___ 21. I often give positive responses to my culturally different counterpart during our interaction.

___ 22. I avoid those situations where I will have to deal with culturally-distinct persons.

___ 23. I often show my culturally-distinct counterpart my understanding through verbal or nonverbal cues.

___ 24. I have a feeling of enjoyment towards differences between my culturally-distinct counterpart and me.

___ 25. During interactions with people from other cultures I try to check that the other person understands what I mean.

___ 26. I am sensitive to how people from other cultures can interpret my words.

___ 27. I actively try to mingle with people from other cultures.

___ 28. I base my opinion about other cultures only on my personal experience with them.

___ 29. When I work in a group with people with a different mother tongue, I propose to communicate in my own mother tongue/native language

___ 30. When working with people with cultural backgrounds different from my own, I ask them questions about problem solving approaches in their cultures.

___ 31. I talk to other group members about recent developments in their home countries (like the conflicts in Syria).

___ 32. When working with people from other cultures, I avoid sensitive topics (like 9/11 with Americans or gay rights with Russians).

___ 33. I have friends with a different cultural background than my own.

16

Appendix 3: Changes in questionnaire

Item Question 2013

Gender Your gender: __ Female __ Male __ I prefer not to answer

Student number

Your student number: s_______ (Your student number will not be used for analyzing results

and will be treated confidentially.)

Study duration Which year did you start with this study programme? _____

Study programme Your study programme: __ BK __ IBA

Duration in the

Netherlands -

Lived abroad Have you ever lived abroad? __ No __ Yes, Where? _______________________

Iconf_02

I find it very hard to talk in front of people from different cultures, because of cultural

differences.

Iconf_03 I always know how to talk when interacting with people from different cultures.

IEnj_02 I often feel helpless when interacting with people from different cultures.

OTS_01 Overall, teachers are aware of the culturally-diverse groups in the programme.

OTS_02

I feel that teachers usually prepare the lectures taking in consideration the cultural diversity of

the students.

OTS_03

In my view, teachers try to make students aware of the cultural differences within the

classroom.

OTS_04

Teachers encourage foreign students to express and present examples from their home

cultures, and cases modeled by their cultural settings.

OTS_05

Teachers usually use examples from different cultural and educational settings for exposing

the theories during the lectures.

OTS_06 I feel that the courses encourage an atmosphere of respect towards cultural differences.

OGW_01

The programme stimulates the integration of diverse cultural backgrounds when creating

group assignments.

OGW_02

It is usually required to form project groups with a mixture of people with different countries

of origin.

OWG_03 The group assignments require an application of diverse cultural backgrounds.

Oenv_01 The university campus is well-equipped for foreign students.

Oenv_02 Student support personnel speak English well.

Oenv_03 Documents, necessary for the study progress, are available in English.

Oenv_04 Accommodation on the UT campus is friendly for an international audience.

IAtt_03 I am sensitive to my cultural-distinct counterpart’s subtle meanings during our interaction.

IAtt_04 -

AB_01 -

AB_02 -

AB_03 -

AB_04 -

AB_05 -

AB_06 -

AB_07 -

AB_08 -

Item Questionnaire 2014

Gender Your gender: __Female __Male

Student number -

Study duration How long have you been studying in UT: (Express your answer in years. E.g. 1.5 years)

Study programme In what study programme did you start your studies in UT? _________________

Duration in the

Netherlands How long have you lived in the Netherlands? _________

Lived abroad Have you ever lived abroad: __Yes __No

17

Iconf_02 I find it very hard to talk in front of people from different cultures.

Iconf_03 I always know what to say when interacting with people from different cultures.

IEnj_02 I often feel useless when interacting with people from different cultures.

OTS_01 -

OTS_02 -

OTS_03 -

OTS_04 -

OTS_05 -

OTS_06 -

OGW_01 -

OGW_02 -

OWG_03 -

Oenv_01 -

Oenv_02 -

Oenv_03 -

Oenv_04 -

IAtt_03

During interactions with people from other cultures I recognize the presence of a potential

double meaning behind verbal expressions.

IAtt_04

During interactions with people from other cultures I try to check that the other person

understands what I mean.

AB_01 I am sensitive to how people from other cultures can interpret my words.

AB_02 I actively try to mingle with people from other cultures.

AB_03 I base my opinion about other cultures only on my personal experience with them.

AB_04

When I work in a group with people with a different mother tongue, I propose to communicate

in my own mother tongue/native language

AB_05

When working with people with cultural backgrounds different from my own, I ask them

questions about problem solving approaches in their cultures.

AB_06

I talk to other group members about recent developments in their home countries (like the

conflicts in Syria).

AB_07

When working with people from other cultures, I avoid sensitive topics (like 9/11 with

Americans or gay rights with Russians).

AB_08 I have friends with a different cultural background than my own.

18

Appendix 4: Cronbach’s alpha after leaving out IEng_06

Scale Mean if

Item Deleted

Scale Variance

if Item Deleted

Corrected Item-

Total

Correlation

Squared

Multiple

Correlation

Cronbach's

Alpha if Item

Deleted

IEng_01 20.5074 7.515 .471 .323 .534

IEng_02 21.3966 8.615 .206 .082 .625

IEng_03 20.5320 7.252 .558 .363 .504

IEng_04 21.3300 8.577 .325 .117 .586

IEng_05_r 20.8818 8.267 .250 .109 .613

IEng_06 21.6502 9.097 .163 .058 .632

IEng_07 21.2931 7.897 .391 .189 .563

19

Appendix 5: Cronbach’s alpha after leaving out IAtt_03

Scale Mean if

Item Deleted

Scale Variance

if Item Deleted

Corrected Item-

Total

Correlation

Squared

Multiple

Correlation

Cronbach's

Alpha if Item

Deleted

IAtt_01 6.29 1.875 .280 .104 .248

IAtt_02 6.28 1.558 .313 .115 .165

IAtt_03 6.63 2.155 .145 .023 .481

20

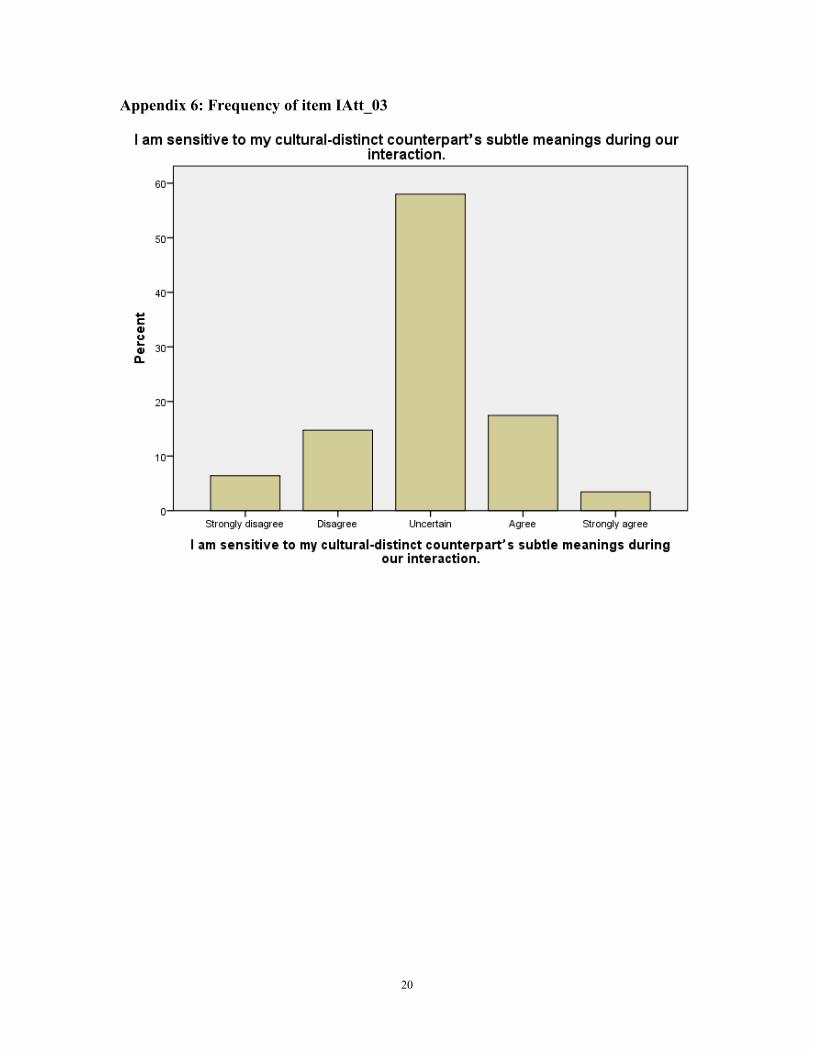
Appendix 6: Frequency of item IAtt_03

21

Appendix 7: Crosstab of IAtt_03 with items IAtt_01 and IAtt_02

Crosstab item IAtt_01 – IAtt_03

IAtt_03

Total

1 Strongly

disagree 2 Disagree 3 Uncertain 4 Agree 5 Strongly agree

IAtt_01 1 Strongly

disagree

Count 4 2 4 1 0 11

% of Total 1.0% 0.5% 1.0% 0.2% 0.0% 2.7%

2 Disagree Count 0 7 28 8 2 45

% of Total 0.0% 1.7% 6.9% 2.0% 0.5% 11.1%

3 Uncertain Count 11 25 119 21 5 181

% of Total 2.7% 6.2% 29.3% 5.2% 1.2% 44.6%

4 Agree Count 8 23 77 32 6 146

% of Total 2.0% 5.7% 19.0% 7.9% 1.5% 36.0%

5 Strongly

agree

Count 3 3 7 9 1 23

% of Total 0.7% 0.7% 1.7% 2.2% 0.2% 5.7%

Total Count 26 60 235 71 14 406

% of Total 6.4% 14.8% 57.9% 17.5% 3.4% 100.0%

Crosstab item IAtt_02 – IAtt_03

IAtt_03

Total

1 Strongly

disagree 2 Disagree 3 Uncertain 4 Agree 5 Strongly agree

IAtt_02 1 Strongly

disagree

Count 3 2 5 2 0 12

% of Total 0.7% 0.5% 1.2% 0.5% 0.0% 2.9%

2

Disagree

Count 5 11 39 7 2 64

% of Total 1.2% 2.7% 9.6% 1.7% 0.5% 15.7%

3

Uncertain

Count 9 20 98 25 3 155

% of Total 2.2% 4.9% 24.1% 6.1% 0.7% 38.1%

4 Agree Count 5 25 74 24 5 133

% of Total 1.2% 6.1% 18.2% 5.9% 1.2% 32.7%

5 Strongly

agree

Count 4 2 20 13 4 43

% of Total 1.0% 0.5% 4.9% 3.2% 1.0% 10.6%

Total Count 26 60 236 71 14 407

% of Total 6.4% 14.7% 58.0% 17.4% 3.4% 100.0%

22

Appendix 8: Factor analysis actual behavior with the three dimensions and with the

five dimensions

Rotated Component Matrixa

Component

1 2 3

AB_01 .673 .037 -.018

AB_02 .625 .434 .077

AB_03 .147 -.059 .584

AB_04 -.354 .088 .788

AB_05 .105 .786 .163

AB_06 .114 .761 -.266

AB_07 .515 -.364 .375

AB_08 .583 .256 -.342

Extraction Method: Principal Component

Analysis.

Rotation Method: Varimax with Kaiser

Normalization.

a. Rotation converged in 6 iterations.

23

Appendix 9: Independent t-tests for the control variables with the dependent

variable and its scales

Total scales

compared

Equal

variances

assumed

Both years compared

t Sig. (2-tailed) Mean Difference Std. Error Difference

ICS x

-1.16 .25 -.04 .04

IEng x -1.80 .07 -.08 .04

RCD x -.92 .36 -.05 .05

Iconf x 3.50 .00 .19 .06

IEnj x -1.12 .26 -.07 .06

IAtt x

-4.39 .00 -.23 .05

Gender Equal

variances

assumed

2013 Equal

variances

assumed

2014

t Sig. (2-tailed) Mean

Differen

ce

Std. Error

Differenc

e

t Sig. (2-tailed) Mean

Differ

ence

Std. Error

Difference ICS x 2.19 .03 .10 .04 x -.28 .78 -.02 .07

IEng x 2.47 .01 .12 .05 x 1.58 .12 .12 .08

RCD 5.98 .00 .34 .06 x .45 .65 .04 .10

Iconf x -3.11 .00 -.20 .06 x -2.51 .01 -.24 .10

IEnj x 1.38 .17 .10 .07 x -.13 .89 -.01 .10

IAtt x 1.86 .06 .11 .06 x -.01 .99 .00 .09

English

language-

based

programme

Equal

variances

assumed

2013 Equal

variances

assumed

2014

t Sig. (2-tailed) Mean

Differen

ce

Std. Error

Differenc

e

t Sig. (2-tailed) Mean

Differ

ence

Std. Error

Difference ICS x -6.64 .00 -.28 .04 x -.89 .38 -.06 .07

IEng x -6.47 .00 -.30 .05 x -1.50 .13 -.12 .08

RCD x -6.42 .00 -.38 .06 x -.04 .97 .00 .10

Iconf x -4.00 .00 -.25 .06 x -.44 .66 -.04 .10

IEnj x -4.01 .00 -.28 .07 -.43 .67 -.05 .11

IAtt -3.16 .00 -.19 .06 x -1.11 .27 -.10 .09

Lived longer

than 5 years in

Holland

Equal

variances

assumed

2013 Equal

variances

assumed

2014

t Sig. (2-tailed) Mean

Differen

ce

Std. Error

Differenc

e

t Sig. (2-tailed) Mean

Differ

ence

Std. Error

Difference ICS x .90 .37 .07 .08

24

IEng x 1.95 .05 .17 .09

RCD x -.33 .74 -.04 .11

Iconf x -.55 .58 -.06 .11

IEnj x -.16 .88 -.02 .12

IAtt x 2.96 .00 .30 .10

Dutch versus

German

Equal

variances

assumed

2013 Equal

variances

assumed

2014

t Sig. (2-tailed) Mean

Differen

ce

Std. Error

Differenc

e

t Sig. (2-tailed) Mean

Differ

ence

Std. Error

Difference ICS x -6.85 .00 -.32 .05 x -1.10 .27 -.10 .09

IEng x -6.59 .00 -.34 .05 x -1.69 .09 -.17 .10

RCD x -5.72 .00 -.38 .07 x -.17 .86 -.02 .13

Iconf x -3.72 .00 -.26 .07 x .32 .75 .04 .13

IEnj x -3.27 .00 -.25 .08 x -.79 .43 -.11 .13

IAtt x -5.38 .00 -.35 .07 x -2.07 .04 -.24 .11

Ever lived

abroad

Equal

variances

assumed

2013 Equal

variances

assumed

2014

t Sig. (2-tailed) Mean

Differen

ce

Std. Error

Differenc

e

t Sig. (2-tailed) Mean

Differ

ence

Std. Error

Difference ICS x 5.85 .00 .30 .05 x 2.92 .00 .20 .07

IEng x 4.67 .00 .27 .06 x 2.81 .01 .22 .08

RCD x 3.02 .00 .23 .07 x .84 .40 .08 .10

Iconf x 4.61 .00 .35 .08 x 3.62 .00 .36 .10

IEnj x 3.76 .00 .31 .08 x .41 .68 .04 .11

IAtt x 4.99 .00 .36 .07 x 3.30 .00 .29 .09

Want to study

abroad

Equal

variances

assumed

2013 Equal

variances

assumed

2014

t Sig. (2-tailed) Mean

Differen

ce

Std. Error

Differenc

e

t Sig. (2-tailed) Mean

Differ

ence

Std. Error

Difference ICS x 5.92 .00 .27 .05 x 4.32 .00 .27 .06

IEng x 5.71 .00 .28 .05 x 4.16 .00 .30 .07

RCD x 3.88 .00 .26 .07 x 2.54 .01 .23 .09

Iconf x 4.86 .00 .33 .07 x 3.07 .00 .28 .09

IEnj x 4.60 .00 .34 .07 x 2.22 .03 .21 .10

IAtt x 2.38 .02 .16 .07 x 3.87 .00 .31 .08

25

Have

international

friends

Equal

variances

assumed

2013 Equal

variances

assumed

2014

t Sig. (2-tailed) Mean

Differen

ce

Std. Error

Differenc

e

t Sig. (2-tailed) Mean

Differ

ence

Std. Error

Difference ICS x 6.85 .00 .33 .05 x 3.23 .00 .21 .07

IEng x 7.43 .00 .38 .05 x 3.12 .00 .24 .08

RCD 5.12 .00 .32 .06 x 1.53 .13 .15 .10

Iconf x 5.38 .00 .38 .07 3.14 .00 .28 .09

IEnj x 4.05 .00 .32 .08 x 2.03 .04 .20 .10

IAtt x 3.33 .00 .23 .07 x 2.23 .03 .19 .09

26

Appendix 10: Number of respondents, mean, standard deviation of all

independent t-tests, in the same order as in appendix 8

2013 2014

Year N Mean S.D. Std. Error Mean N Mean S.D. Std. Error Mean

Intercultural

sensitivity

2013 419 3.68 .44 .02 419 3.68 .44 .02

2014 196 3.72 .44 .03 196 3.72 .44 .03

Interaction

Engagement

2013 419 3.52 .48 .02 419 3.52 .48 .02

2014 196 3.60 .51 .04 196 3.60 .51 .04

Respect for

cultural

differences

2013 419 4.06 .62 .03 419 4.06 .62 .03

2014 196 4.11 .64 .05 196 4.11 .64 .05

Interaction

Confidence

2013 419 3.60 .64 .03 419 3.60 .64 .03

2014 196 3.41 .65 .05 196 3.41 .65 .05

Interaction

Enjoyment

2013 417 4.00 .70 .03 417 4.00 .70 .03

2014 196 4.07 .66 .05 196 4.07 .66 .05

Interaction

Attentiveness

2013 414 3.21 .60 .03 414 3.21 .60 .03

2014 196 3.43 .58 .04 196 3.43 .58 .04

Gender N Mean S.D. Std. Error Mean N Mean S.D. Std. Error Mean

Intercultural

sensitivity

1 Female 168 3.74 .42 .03 68 3.72 .45 .05

2 Male 246 3.64 .44 .03 126 3.73 .44 .04

Interaction

Engagement

1 Female 168 3.60 .46 .04 68 3.68 .48 .06

2 Male 246 3.48 .49 .03 126 3.56 .52 .05

Respect for

cultural

differences

1 Female 168 4.27 .50 .04 68 4.14 .67 .08

2 Male 246 3.93 .66 .04 126 4.10 .62 .06

Interaction

Confidence

1 Female 168 3.48 .65 .05 68 3.25 .66 .08

2 Male 246 3.68 .61 .04 126 3.49 .63 .06

Interaction

Enjoyment

1 Female 167 4.06 .67 .05 68 4.07 .69 .08

2 Male 245 3.97 .71 .05 126 4.08 .65 .06

Interaction

Attentivenes

s

1 Female 165 3.27 .58 .05 68 3.44 .58 .07

2 Male 244 3.16 .62 .04 126 3.44 .58 .05

English Program N Mean S.D. Std. Error Mean N Mean S.D. Std. Error Mean

Intercultural

sensitivity

No 221 3.55 .42 .03 107 3.68 .38 .04

Yes 190 3.83 .42 .03 71 3.74 .54 .06

27

Interaction

Engagement

No 221 3.39 .49 .03 107 3.54 .47 .05

Yes 190 3.69 .44 .03 71 3.66 .55 .07

Respect for

cultural

differences

No 221 3.89 .62 .04 107 4.09 .57 .06

Yes 190 4.27 .57 .04 71 4.09 .77 .09

Interaction

Confidence

No 221 3.49 .64 .04 107 3.36 .61 .06

Yes 190 3.74 .60 .04 71 3.41 .70 .08

Interaction

Enjoyment

No 221 3.88 .71 .05 107 4.03 .57 .06

Yes 188 4.15 .67 .05 71 4.08 .79 .09

Interaction

Attentivenes

s

No 220 3.12 .57 .04 107 3.39 .54 .05

Yes 186 3.31 .64 .05 71 3.49 .60 .07

Five years in the Netherlands N Mean S.D. Std. Error Mean N Mean S.D. Std. Error Mean

Intercultural

sensitivity

No 42 3.77 .52 .08

Yes 148 3.70 .42 .03

Interaction

Engagement

No 42 3.73 .57 .09

Yes 148 3.56 .49 .04

Respect for

cultural

differences

No 42 4.08 .78 .12

Yes 148 4.11 .60 .05

Interaction

Confidence

No 42 3.35 .67 .10

Yes 148 3.41 .65 .05

Interaction

Enjoyment

No 42 4.05 .75 .12

Yes 148 4.07 .64 .05

Interaction

Attentivenes

s

No 42 3.66 .59 .09

Yes 148 3.36 .57 .05

Dutch / German orignin N Mean S.D. Std. Error Mean N Mean S.D. Std. Error Mean

Intercultural

sensitivity

Dutch 272 3.57 .42 .03 148 3.69 .41 .03

German 112 3.89 .38 .04 29 3.79 .58 .11

Interaction

Engagement

Dutch 272 3.41 .47 .03 148 3.55 .49 .04

German 112 3.75 .44 .04 29 3.72 .60 .11

Respect for

cultural

differences

Dutch 272 3.94 .62 .04 148 4.11 .60 .05

German 112 4.33 .54 .05 29 4.13 .85 .16

Interaction

Confidence

Dutch 272 3.49 .65 .04 148 3.38 .63 .05

German 112 3.75 .57 .05 29 3.34 .71 .13

Interaction Dutch 271 3.93 .70 .04 148 4.05 .62 .05

28

Enjoyment German 111 4.18 .61 .06 29 4.16 .81 .15

Interaction

Attentiveness

Dutch 269 3.08 .59 .04 148 3.36 .56 .05

German 110 3.43 .54 .05 29 3.59 .59 .11

Have you ever lived abroad? N Mean S.D. Std. Error Mean N Mean S.D. Std. Error Mean

Intercultural

sensitivity

1 Yes 85 3.92 .43 .05 55 3.87 .47 .06

2 No 332 3.62 .42 .02 141 3.67 .42 .04

Interaction

Engagement

1 Yes 85 3.74 .48 .05 55 3.76 .54 .07

2 No 332 3.47 .47 .03 141 3.54 .48 .04

Respect for

cultural

differences

1 Yes 85 4.24 .59 .06 55 4.17 .68 .09

2 No 332 4.02 .62 .03 141 4.09 .62 .05

Interaction

Confidence

1 Yes 85 3.88 .58 .06 55 3.67 .62 .08

2 No 332 3.53 .63 .03 141 3.30 .63 .05

Interaction

Enjoyment

1 Yes 85 4.25 .71 .08 55 4.10 .69 .09

2 No 330 3.94 .68 .04 141 4.06 .65 .05

Interaction

Attentiveness

1 Yes 85 3.49 .52 .06 55 3.65 .58 .08

2 No 327 3.13 .61 .03 141 3.35 .56 .05

Do you plan to study abroad

in the near future? (E.g. for

your minor or master) N Mean S.D. Std. Error Mean N Mean S.D. Std. Error Mean

Intercultural

sensitivity

1 Yes 285 3.77 .43 .03 93 3.86 .42 .04

2 No 121 3.50 .42 .04 98 3.59 .43 .04

Interaction

Engagement

1 Yes 285 3.62 .46 .03 93 3.75 .49 .05

2 No 121 3.33 .46 .04 98 3.46 .49 .05

Respect for

cultural

differences

1 Yes 285 4.14 .60 .04 93 4.23 .60 .06

2 No 121 3.89 .63 .06 98 4.00 .66 .07

Interaction

Confidence

1 Yes 285 3.71 .60 .04 93 3.54 .64 .07

2 No 121 3.38 .65 .06 98 3.26 .63 .06

Interaction

Enjoyment

1 Yes 284 4.11 .66 .04 93 4.18 .62 .06

2 No 120 3.76 .73 .07 98 3.97 .69 .07

Interaction

Attentiveness

1 Yes 283 3.26 .60 .04 93 3.60 .57 .06

2 No 119 3.10 .61 .06 98 3.29 .55 .06

Do you have friend(s) from

countries other than your

home country? N Mean S.D. Std. Error Mean N Mean S.D. Std. Error Mean

Intercultural 1 Yes 316 3.76 .43 .02 133 3.79 .43 .04

29

sensitivity 2 No 103 3.43 .38 .04 63 3.58 .43 .05

Interaction

Engagement

1 Yes 316 3.62 .45 .03 133 3.68 .50 .04

2 No 103 3.24 .47 .05 63 3.44 .49 .06

Respect for

cultural

differences

1 Yes 316 4.14 .63 .04 133 4.16 .62 .05

2 No 103 3.82 .52 .05 63 4.01 .65 .08

Interaction

Confidence

1 Yes 316 3.69 .61 .03 133 3.50 .67 .06

2 No 103 3.32 .65 .06 63 3.21 .55 .07

Interaction

Enjoyment

1 Yes 314 4.08 .71 .04 133 4.13 .62 .05

2 No 103 3.76 .63 .06 63 3.93 .72 .09

Interaction

Attentiveness

1 Yes 311 3.26 .63 .04 133 3.50 .58 .05

2 No 103 3.04 .48 .05 63 3.30 .56 .07

30

Appendix 11: Multicollinearity check of the independent variables

Model Summary

Model R

R

Square

Adjusted R

Square

Std. Error of

the Estimate

Change Statistics

R Square

Change

F

Change df1 df2 Sig. F Change

Together .318a .101 .094 .41973 .101 15.487 3 414 .000

Teaching

style .151

a .023 .020 .43627 .023 9.697 1 417 .002

Group

work .070

a .005 .002 .44024 .005 2.032 1 417 .155

Environ-

ment .262

a .069 .066 .42617 .069 30.630 1 416 .000

a. Predictors: (Constant), OEnv_Scale_4, OGW_Scale_3, OTS_Scale_6


Recommended