www.scholarsresearchlibrary.com t Available online a Scholars Research Library Archives of Applied Science Research, 2014, 6 (2):115-121 (http://scholarsresearchlibrary.com/archive.html) ISSN 0975-508X CODEN (USA) AASRC9 115 Scholars Research Library The role of anodizing potentials in making TiO 2 nanotubes in (ethylene glycol / NH 4 F /water) electrolyte 1 Abdulkareem Mohammed Ali Alsammarraei, 2 Harith Ibrahim Jaafar and 2 Kareem Najim Abed 1 University of Baghdad, College of Science, Department of Chemistry, Iraq 2 University of Baghdad, College of Science, Department of Physics, Iraq _____________________________________________________________________________________________ ABSTRACT Titania (TiO 2 ) nanotube is considered a very important material due to its promising applications in many fields ranging from energy harvesting to sensors and photocatalytic applications. TiO 2 nanotubes were grown electrochemically in Plexiglas cell, the Ti foils (99.96%) serves as anode and platinum foil as cathode while the electrolyte was ethylene glycol containing (0.5%) NH 4 F and (4%) de-ionized water at 20 ◦ C for one hour. The effect of anodizing voltages at the range 10 to100v is studied by extensive current / voltage plots and microstructure examination using SEM, and AFM techniques. All potentials were led to highly ordered nanotubes but they have different micrographic parameters; tube length, tube diameter and tube wall thickness, a role these parameters with the values of anodizing potentials are investigated. Keywords: TiO2 nanotubes (TNTs), anodizing titanium oxide (ATO), highly ordered nanotubes _____________________________________________________________________________________________ INTRODUCTION Nano-sized objects show a great variety of interesting properties and this is the main driving force of the research in the field of nanotechnology today. The anodization of some metals, (ex;Ti,Al),under suitable conditions, leads to the formation of ordered arrays of pores in an oxide matrix. This technique has implemented and is now able to tune pore diameter and period. Highly ordered vertically oriented TiO 2 nanotube arrays outperform their colloidal counterpart for applications including sensors[1],water photoelectrolysis[2-3], Photocatalytic degradation of gas pollutants[4], dye-sensitized solar cells[5],and for super capacitors [6].In addition to biomedical applications including biosensors, molecular filtration, drug delivery and tissue engineering[7]. Furthermore, initial investigations indicate that they also may be useful for energy storage devices such as Li-ion batteries, and super- capacitors [8].The widespread technological use of titania is impaired by its wide band gap (3-3.2eV) which can be narrowed by different methodologies. The anodization method has attracted the most interest among the other fabrication methods due to its ability to produce integrative ,vertically oriented highly ordered nanotube arrays with controllable dimensions [9].This study aims at investigation of the effect of anodizing voltages on morphology , dimensions ,and degree of order of the grown titania nanotubes . MATERIALS AND METHODS Titanium (Ti) metal foils (99.7% purity of Alfa aesar) ,rectangular piece of 1.5* 1.0 cm and 0.25 mm thick, were cut out of a sheet ,then degreased by ultrasonic treatments in de-ionized water (DI μ 3 > s.sec), and ethanol for 10 min. The Ti foils were then anodized in homemade Plexiglas cell using a two electrode configuration, with Ti foil as anode and a platinum electrode(99.9% Sigma-Aldrich) with thickness of 0.1 mm, served as a cathode, the separation
Transcript
www.scholarsresearchlibrary.com tAvailable online a
Scholars Research Library
Archives of Applied Science Research, 2014, 6 (2):115-121
(http://scholarsresearchlibrary.com/archive.html)
ISSN 0975-508X CODEN (USA) AASRC9
115 Scholars Research Library
The role of anodizing potentials in making TiO2 nanotubes in (ethylene glycol / NH4F /water) electrolyte
1Abdulkareem Mohammed Ali Alsammarraei, 2Harith Ibrahim Jaafar and 2Kareem Najim Abed
1University of Baghdad, College of Science, Department of Chemistry, Iraq
2University of Baghdad, College of Science, Department of Physics, Iraq _____________________________________________________________________________________________
ABSTRACT
Titania (TiO2) nanotube is considered a very important material due to its promising applications in many fields ranging from energy harvesting to sensors and photocatalytic applications. TiO2 nanotubes were grown electrochemically in Plexiglas cell, the Ti foils (99.96%) serves as anode and platinum foil as cathode while the electrolyte was ethylene glycol containing (0.5%) NH4F and (4%) de-ionized water at 20C for one hour. The effect of anodizing voltages at the range 10 to100v is studied by extensive current / voltage plots and microstructure examination using SEM, and AFM techniques. All potentials were led to highly ordered nanotubes but they have different micrographic parameters; tube length, tube diameter and tube wall thickness, a role these parameters with the values of anodizing potentials are investigated.
Nano-sized objects show a great variety of interesting properties and this is the main driving force of the research in the field of nanotechnology today. The anodization of some metals, (ex;Ti,Al),under suitable conditions, leads to the formation of ordered arrays of pores in an oxide matrix. This technique has implemented and is now able to tune pore diameter and period. Highly ordered vertically oriented TiO2 nanotube arrays outperform their colloidal counterpart for applications including sensors[1],water photoelectrolysis[2-3], Photocatalytic degradation of gas pollutants[4], dye-sensitized solar cells[5],and for super capacitors [6].In addition to biomedical applications including biosensors, molecular filtration, drug delivery and tissue engineering[7]. Furthermore, initial investigations indicate that they also may be useful for energy storage devices such as Li-ion batteries, and super- capacitors [8].The widespread technological use of titania is impaired by its wide band gap (3-3.2eV) which can be narrowed by different methodologies. The anodization method has attracted the most interest among the other fabrication methods due to its ability to produce integrative ,vertically oriented highly ordered nanotube arrays with controllable dimensions [9].This study aims at investigation of the effect of anodizing voltages on morphology , dimensions ,and degree of order of the grown titania nanotubes .
MATERIALS AND METHODS
Titanium (Ti) metal foils (99.7% purity of Alfa aesar) ,rectangular piece of 1.5* 1.0 cm and 0.25 mm thick, were cut out of a sheet ,then degreased by ultrasonic treatments in de-ionized water (DI µ3> s.sec), and ethanol for 10 min. The Ti foils were then anodized in homemade Plexiglas cell using a two electrode configuration, with Ti foil as anode and a platinum electrode(99.9% Sigma-Aldrich) with thickness of 0.1 mm, served as a cathode, the separation
Abdulkareem Mohammed Ali Alsammarraei et al Arch. Appl. Sci. Res., 2014, 6 (2):115-121 _____________________________________________________________________________
116 Scholars Research Library
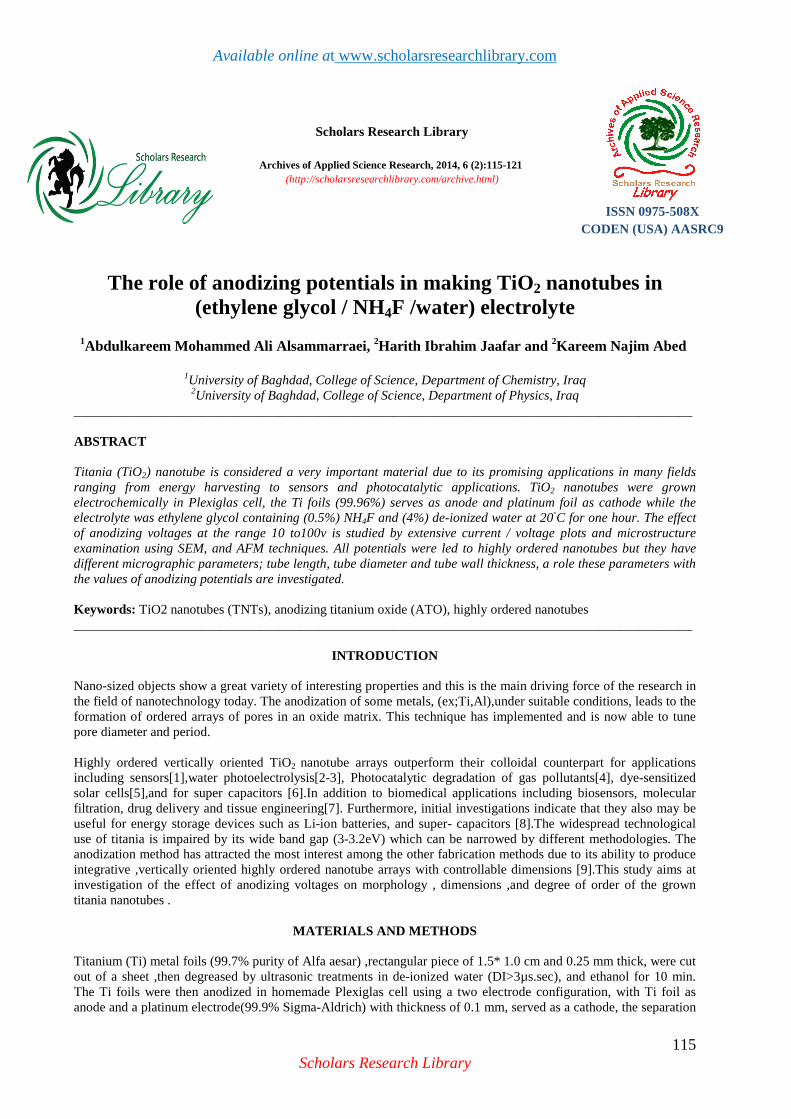
between the two electrodes was 2.0 cm, the electrolyte was 0.5 wt % NH4F (98% Sigma-Aldrich) with 4ml (DI) in ethylene glycol (Anhydrous, 99.8%, Sigma Aldrich). Anodization was carried out at different voltages in the range between 10 to 100 v ,the temperature kept constant at 20ºC by circulating cooled water through copper coil warped around the Plexiglas cell ,the anodizing duration was 1hour in all experiments. In each case the voltage was held constant using a DC voltage supply, during anodization period the current (mv throw 1Ω resistance) & voltage were recorded for time monitoring using two channels millivoltmeter XY recorder (siemense8800) as shown in schematic diagram in figure.1. The anodized samples were cleaned with distilled water to remove the occluded ions from the anodized solutions, and dried in a nitrogen gas then annealed at 500 C for 3hours. The produced anodized titanium oxide nanotubes (ATO) were examined for morphology and topography investigation by Scanning Electron Microscopy (Hitachi 4500) and Atomic Force Microscopy (AFM-AA3000 of Angstrom Advanced Inc.).
Figure 1.Setup of Titanium anodizing apparatus
RESULTS AND DISCUSSION
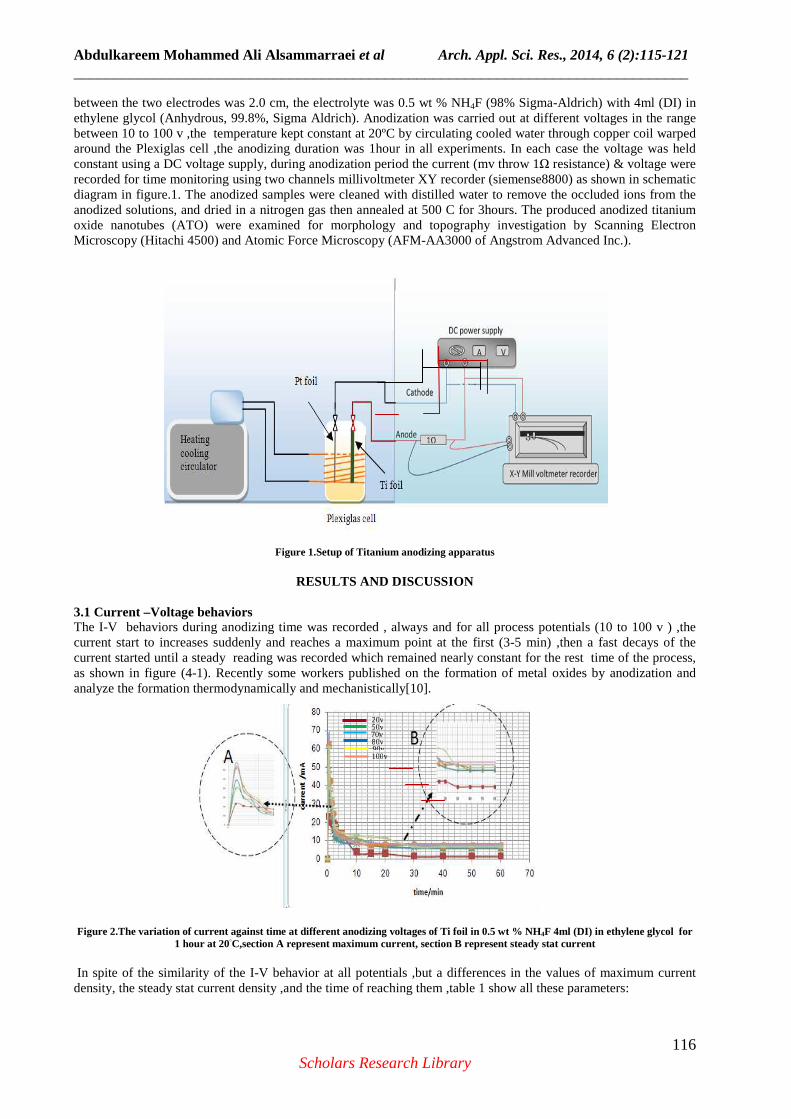
3.1 Current –Voltage behaviors The I-V behaviors during anodizing time was recorded , always and for all process potentials (10 to 100 v ) ,the current start to increases suddenly and reaches a maximum point at the first (3-5 min) ,then a fast decays of the current started until a steady reading was recorded which remained nearly constant for the rest time of the process, as shown in figure (4-1). Recently some workers published on the formation of metal oxides by anodization and analyze the formation thermodynamically and mechanistically[10]. Figure 2.The variation of current against time at different anodizing voltages of Ti foil in 0.5 wt % NH4F 4ml (DI) in ethylene glycol for
1 hour at 20C,section A represent maximum current, section B represent steady stat current In spite of the similarity of the I-V behavior at all potentials ,but a differences in the values of maximum current density, the steady stat current density ,and the time of reaching them ,table 1 show all these parameters:
20v 50v 70v 80v 90v 100v
Abdulkareem Mohammed Ali Alsammarraei et al Arch. Appl. Sci. Res., 2014, 6 (2):115-121 _____________________________________________________________________________
117 Scholars Research Library
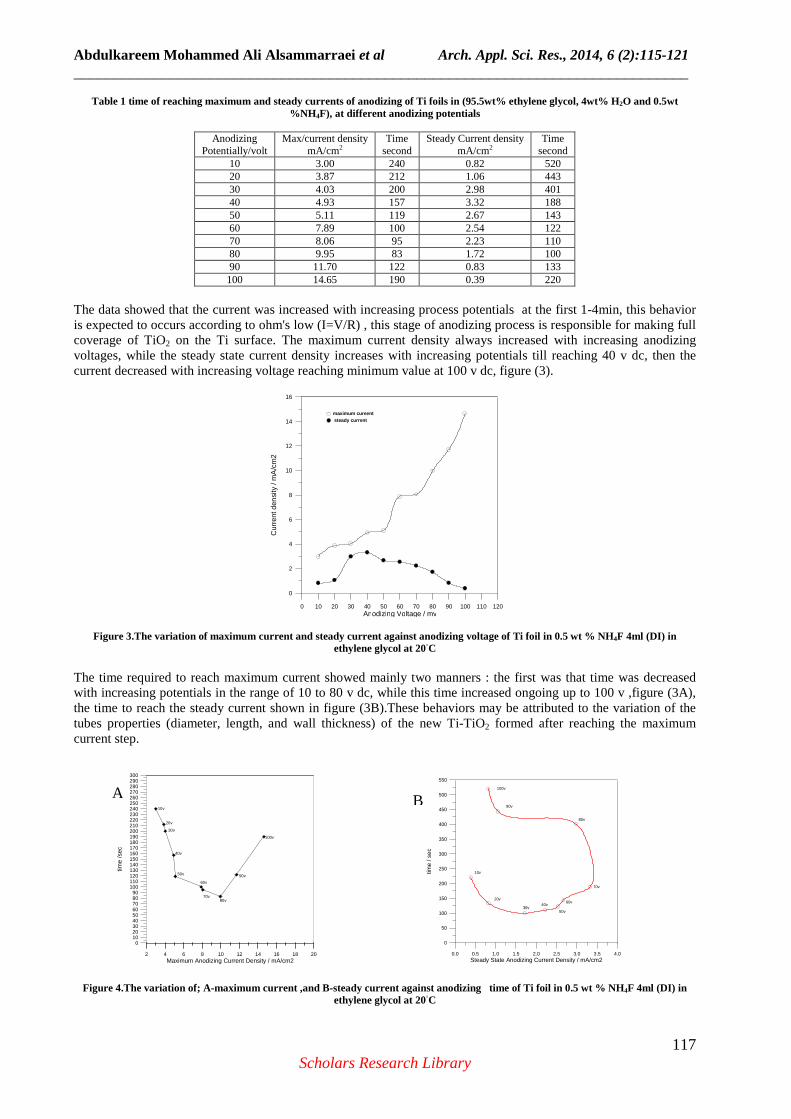
Table 1 time of reaching maximum and steady currents of anodizing of Ti foils in (95.5wt% ethylene glycol, 4wt% H2O and 0.5wt %NH 4F), at different anodizing potentials
The data showed that the current was increased with increasing process potentials at the first 1-4min, this behavior is expected to occurs according to ohm's low (I=V/R) , this stage of anodizing process is responsible for making full coverage of TiO2 on the Ti surface. The maximum current density always increased with increasing anodizing voltages, while the steady state current density increases with increasing potentials till reaching 40 v dc, then the current decreased with increasing voltage reaching minimum value at 100 v dc, figure (3).
Figure 3.The variation of maximum current and steady current against anodizing voltage of Ti foil in 0.5 wt % NH4F 4ml (DI) in ethylene glycol at 20C
The time required to reach maximum current showed mainly two manners : the first was that time was decreased with increasing potentials in the range of 10 to 80 v dc, while this time increased ongoing up to 100 v ,figure (3A), the time to reach the steady current shown in figure (3B).These behaviors may be attributed to the variation of the tubes properties (diameter, length, and wall thickness) of the new Ti-TiO2 formed after reaching the maximum current step.
Figure 4.The variation of; A-maximum current ,and B-steady current against anodizing time of Ti foil in 0.5 wt % NH4F 4ml (DI) in ethylene glycol at 20C
0.0 0.5 1.0 1.5 2.0 2.5 3.0 3.5 4.0Steady State Anodizing Current Density / mA/cm2
0
50
100
150
200
250
300
350
400
450
500
550
time
/ sec
10v
20v
30v40v
50v
60v
70v
80v
90v
100v
Abdulkareem Mohammed Ali Alsammarraei et al Arch. Appl. Sci. Res., 2014, 6 (2):115-121 _____________________________________________________________________________
118 Scholars Research Library
3.2. The morphologic Examination: The prepared TNT’s were subjected to extensive SEM and AFM examination ,an information about ;tube diameter ,tube length , tube wall thickness , and degree of the order of the TiO2 arrays were obtained , the measurements conducted on SEM images using (Imager J) software, are tabulated in table (2).
Table 2. Variation of TNT’s parameters (length, diameter, and wall thickness) against anodizing voltages of Ti foil in 0.5 wt % NH4F and 4ml (DI) in ethylene glycol at 20C
The variation of tube diameters with increasing the anodizing potentials showed three different manners ;the first was at the range 10 v to 50 v ,in which the diameter increases with increasing potentials and this agrees with the result in a similar work of others [11-13] ,so it was around 40 nm when the potential was 10 v , and increased up to higher potentials and became around 80 nm on reaching 50 v, the second behavior have seen at the range 60 to 80 v ,at which the diameter decreased with increasing potential , they were around 65 nm at 60 v,and became nearly 48 nm on reaching 80 v ,figure 6,the last variation way appeared at the potentials of 90 and 100 v , the diameter started to increases again with increasing voltage as shown in figure (5).
Figure 5. Tube diameters against anodizing potentials. of prepared ATO in 0.5 wt % NH4F 4ml (DI) in ethylene glycol at 20C
Images in figure (6) reflect the variation of tube diameters, and tubes wall thickness with anodizing potentials of 20, 60, and 100 v.
Figure 6. SEM images top views of ATO prepared in 0.5 wt % NH4F 4ml (DI) in ethylene glycol at 20C and anodizing potentials of 20,60,and 100 v.
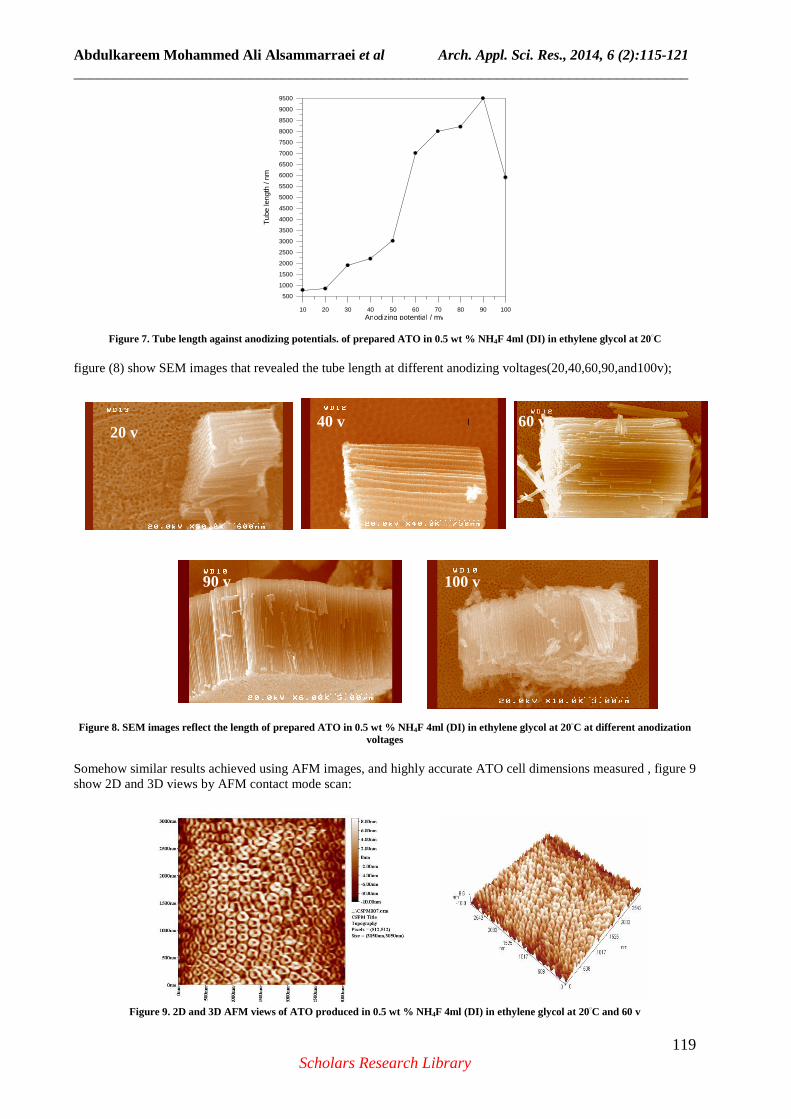
The length is almost increases with increasing potentials this fact agree with many works of others [14-18], except that of 100 v which was shorter than 90 v, figure (7), this may attributed to the dominate of the rate of oxide dissolving step over the rate of oxide formation one, the maximum length that achieved was at 90 v, it was around 10 microns.
Abdulkareem Mohammed Ali Alsammarraei et al Arch. Appl. Sci. Res., 2014, 6 (2):115-121 _____________________________________________________________________________
119 Scholars Research Library
Figure 7. Tube length against anodizing potentials. of prepared ATO in 0.5 wt % NH4F 4ml (DI) in ethylene glycol at 20C figure (8) show SEM images that revealed the tube length at different anodizing voltages(20,40,60,90,and100v);
Figure 8. SEM images reflect the length of prepared ATO in 0.5 wt % NH4F 4ml (DI) in ethylene glycol at 20C at different anodization voltages
Somehow similar results achieved using AFM images, and highly accurate ATO cell dimensions measured , figure 9 show 2D and 3D views by AFM contact mode scan:
Figure 9. 2D and 3D AFM views of ATO produced in 0.5 wt % NH4F 4ml (DI) in ethylene glycol at 20C and 60 v
Abdulkareem Mohammed Ali Alsammarraei et al Arch. Appl. Sci. Res., 2014, 6 (2):115-121 _____________________________________________________________________________
120 Scholars Research Library
The roughness report was deduced by Imger 4.2 software show that for the longest ATO arrays which formed using 90 v , the R average was equal to 1.54 nm and the RMS was 1.96 nm and the surface yield (peak-peak) was 14.2nm. A footprint were established by AFM scans with three types of contact mode images includes; topography, deflection, and lateral force for the back of free stand ATO template prepared at 50 v and removed by double sided adhesives and mounted on microscopic glass slide, a novel pictures for a TNT honey combs structures were recorded at several magnifications starting from several thousand of microns going to single unit cell with, as shown in figures 10 (a, b, and c)
Figure 10. Different magnification AFM images of TNT prepared at anodizing potential of 50 V for 1 hr; A-topography, B-deflection, and C-lateral force
The deflection and lateral force images revealed more detailed surface structure than the topography images.
CONCLUSION
Highly ordered titania nanotubes (TNTs) were prepared via anodizing in ethylene glycol containing (0.5%) NH4F and (4%) de-ionized water at 20C and different anodizing potential for one hour, the current / voltage profiles showed behaviors related to the microstructure of the produced template.
A B
C
Abdulkareem Mohammed Ali Alsammarraei et al Arch. Appl. Sci. Res., 2014, 6 (2):115-121 _____________________________________________________________________________
121 Scholars Research Library
The morphologic properties of the TNTs are strongly affected by anodizing potentials in the range 10 to 100 v, the diameters ranged between 40 and 70 nm, maximum length of about 10 microns achieved at 90 v. Lateral force and deflection AFM images showed more detailed surface structures than AFM topographic images.
REFERENCES
[1] Y. Li, X. Yu, Q.Yang, J. Sens. ,2009, 19,402174. [2] S. Albu,; A. Ghicov,; J. Macak,; R. Hahn,; P. Schmiki., Nano Lett. 2007, 7, 1286. [3] M. Paulose, G. Mor, O. Varghese, K. Shankar, C. Grimes, J. Photochem. Photobiol A., 2006, 178, 8. [4] A. Kontos, A. Katsanaki, T. Maggos, V. Likodimos, A. Ghicov, D. Kim, J.Kunze, C.Vasilakos, P. Schmuki, P.Falara,. Chem. Phys. Lett. ,2010, 490, 58. [5] A. Haring, A. Morris, M. Hu, Materials., 2012, 5, 1890. [6] X. Lu, G. Wang, T. Zhai, M. Yu, J. Gan, Y.Tong,; Y. Li, Nano Lett., 2012, 12, 1690. [7] P. Roy, S. Berger, P. Schmuki, Angew., Chem. Int.Ed. , 2011, 50, 2904. [8] Z. Lockman, S. Ismail,S. Sreekantan, L Schmidt-Mende, MacManus-Driscoll, J. Nanotechnology., 2010, 21, 055601. [10] M.Wang, Y. Liu, H.Yang, Electrochim. Acta., 2012, 62, 424 [11] M. Sturgeon, P. Lai, M. Hu, J. Mater. Res., 2011, 26, 2612 [12] A-K M.A. Alsamuraee, Q. M. D. Al-Ittabi, and Y.A. Mohammed, Am. J. Sci. Ind. Res., 2011, 2,6, 852. [13] G. Dale, W. Hamilton, P. Dunlop, P. Lemoine, J. Byrne, J. Nanosci. Nanotechnol.,2009, 9, 4215. [14] J. Macak, H.Tsuchiya, L.Taveira, S. Aldabergerova, P.Schmuki, Angew. Chem. Int. Ed. 2005, 44, 7463. [15] S. Sreekantan, K.A. Saharudin, Z. Lockman, T.W. Tzu, Nanotechnology., 2010, 2010, 21, 365603. [16] S.Yoriya, M. Paulose, O.Varghese, G. Mor, C. Grimes, J. Phys. Chem. C., 2007, 111, 13770–13776. [17] H. Prakasam, K.Shankar, M. Paulose, O. Varghese, C. Grimes, J. Phys. Chem. C., 2007, 111, 7235–7241.