DOI: 10.1111/j.1475-679X.2012.00455.x Journal of Accounting Research Vol. 00 No. 00 xxxx 2012 Printed in U.S.A. The Role of Bank Reputation in “Certifying” Future Performance Implications of Borrowers’ Accounting Numbers ROBERT M. BUSHMAN ∗ AND REGINA WITTENBERG-MOERMAN † Received 3 January 2011; accepted 14 February 2012 ABSTRACT We investigate the role played by the reputation of lead arrangers of syndi- cated loans in mitigating information asymmetries between borrowers and lenders. We hypothesize that syndications by more reputable arrangers are indicative of higher borrower quality at loan inception and more rigorous monitoring during the term of the loan. We investigate whether borrowers with more reputable lead arrangers realize superior performance subsequent to loan origination relative to borrowers with less reputable arrangers. We fur- ther examine whether certification by high-reputation lead banks extends to ∗ Kenan-Flagler Business School, The University of North Carolina at Chapel Hill; † The University of Chicago Booth School of Business Accepted by Phil Berger. We thank the editor, an anonymous reviewer, Dan Amiram, Ray Ball, Ryan Ball, Douglas Diamond, Merle Erickson, Rich Frankel, Christian Leuz, Michael Minnis, David Ross, Florin Vasvari, Jieying Zhang, and participants at the 2010 Dopuch Con- ference at Washington University, the 2010 Duke/UNC Fall Camp, 2010 Financial Economics and Accounting Conference at the University of Maryland, the 2010 Stanford Summer Camp and seminar participants at Indiana University, Tsinghua University, and the University of Texas at Dallas for helpful comments. We thank the Thomson Reuters Loan Pricing Corpora- tion for providing loan data. We gratefully acknowledge the financial support of the Kenan- Flagler Business School, The University of North Carolina at Chapel Hill, and the University of Chicago Booth School of Business. Regina Wittenberg-Moerman also gratefully acknowledges the financial support of the Neubauer Family Fellowship. 1 Copyright C , University of Chicago on behalf of the Accounting Research Center, 2012
Transcript
DOI: 10.1111/j.1475-679X.2012.00455.xJournal of Accounting Research
Vol. 00 No. 00 xxxx 2012Printed in U.S.A.
The Role of Bank Reputation in“Certifying” Future Performance
Implications of Borrowers’Accounting Numbers
R O B E R T M . B U S H M A N ∗ A N D R E G I N AW I T T E N B E R G - M O E R M A N †
Received 3 January 2011; accepted 14 February 2012
ABSTRACT
We investigate the role played by the reputation of lead arrangers of syndi-cated loans in mitigating information asymmetries between borrowers andlenders. We hypothesize that syndications by more reputable arrangers areindicative of higher borrower quality at loan inception and more rigorousmonitoring during the term of the loan. We investigate whether borrowerswith more reputable lead arrangers realize superior performance subsequentto loan origination relative to borrowers with less reputable arrangers. We fur-ther examine whether certification by high-reputation lead banks extends to
∗Kenan-Flagler Business School, The University of North Carolina at Chapel Hill; †TheUniversity of Chicago Booth School of Business
Accepted by Phil Berger. We thank the editor, an anonymous reviewer, Dan Amiram, RayBall, Ryan Ball, Douglas Diamond, Merle Erickson, Rich Frankel, Christian Leuz, MichaelMinnis, David Ross, Florin Vasvari, Jieying Zhang, and participants at the 2010 Dopuch Con-ference at Washington University, the 2010 Duke/UNC Fall Camp, 2010 Financial Economicsand Accounting Conference at the University of Maryland, the 2010 Stanford Summer Campand seminar participants at Indiana University, Tsinghua University, and the University ofTexas at Dallas for helpful comments. We thank the Thomson Reuters Loan Pricing Corpora-tion for providing loan data. We gratefully acknowledge the financial support of the Kenan-Flagler Business School, The University of North Carolina at Chapel Hill, and the University ofChicago Booth School of Business. Regina Wittenberg-Moerman also gratefully acknowledgesthe financial support of the Neubauer Family Fellowship.
the quality of borrowers’ reported accounting numbers. Controlling for en-dogenous matching of borrowers and lead banks, we find that higher bankreputation is associated with higher profitability and credit quality in thethree years subsequent to loan initiation. We also show that bank reputationis associated with long-run sustainability of earnings via higher earnings per-sistence, and debt contracting value of accounting via a stronger connectionbetween pre-loan profitability and future credit quality. We further documentthat the enhanced earnings sustainability associated with higher reputationlead banks reflects both superior fundamentals and accruals more closelylinked with future cash flows.
1. Introduction
Information asymmetries create frictions that can impact the costs ofraising external funds. In this paper, we investigate the role played by thereputation of the lead arrangers of syndicated loans in mitigating informa-tion asymmetries between borrowers and lenders. By investing in rigorouspre-loan evaluations of borrowers’ quality and post-loan monitoring of bor-rowers’ performance, a bank can establish a strong reputation as a leadarranger via a track record of successful loans. We hypothesize that syndi-cations by more reputable arrangers indicate higher borrower quality atloan inception and more rigorous monitoring during the term of the loan.To examine this hypothesis, we investigate whether borrowers with morereputable arrangers realize superior performance subsequent to loan orig-ination, relative to borrowers with less reputable arrangers. We further ex-amine whether the quality certification supplied by high-reputation leadbanks extends to the quality of a borrower’s reported accounting numbers.
Syndicated lending, in which multiple lenders lend to a firm under acommon contract, is an interesting setting for analyzing the role of reputa-tion in certifying firm quality. Agency problems arise because lead banks’privileged access to borrowers may reveal private information not availableto other syndicate members, and a bank’s due diligence and monitoringefforts are not observable (e.g., Lee and Mullineaux [2004], Sufi [2007],Ivashina [2009]). Further, the lead bank’s formal contractual incentives toscreen and monitor are limited, as the fraction of loans retained by leadbanks is relatively small. The confluence of unobservable effort and insuffi-cient contractual incentives with the repeated nature of the syndicated loanmarket creates a role for reputation. By observing outcomes of previouslyarranged loans, market participants can assess the extent to which a bankprovides superior screening and monitoring on behalf of other investors.
A recent literature supports the importance of lead arranger reputationin syndicated lending by examining the consequences for lead banks of aborrower’s failure. Lin and Paravisini [2011] exploit large corporate fraudsand find that, consistent with reputation loss, lead banks of loans to firmswhere fraud is discovered hold larger fractions of loans they syndicate fol-lowing fraud discovery. Gopalan, Nanda, and Yerramilli [2011] focus on
ROLE OF BANK REPUTATION 3
Chapter 11 bankruptcies, showing that, following defaults, lead arrangersretain larger fractions of subsequent loans they syndicate, and are less likelyto syndicate loans and attract participant lenders.1
There is also an extensive literature documenting that loan announce-ments generate positive abnormal stock returns for borrowers.2 It is alsodocumented that these stock price responses are relatively more favorablefor loans syndicated by higher reputation banks (Billett, Flannery, andGarfinkel [1995], Ross [2010]), suggesting that bank reputation certifiesborrower quality. Ross [2010] further shows that the impact of a lead bank’sreputation on abnormal returns is stronger for more opaque borrowerswhere certification is likely more important.
This evidence is consistent with existing theories of financial interme-diary’s reputation. For example, Chemmanur and Fulghieri [1994a] showthat higher reputation banks have incentives to perform more rigorous pre-loan evaluations of borrowers’ unobservable prospects than do lower rep-utation banks. Thus, in equilibrium, high-reputation banks are more likelyto lend to borrowers with superior future prospects, reflecting favorably onthese unobservable prospects.
We extend prior literature by examining the relation between lead ar-ranger reputation and two aspects of borrowers’ performance followingloan origination: future profitability and future credit quality. Further, weinvestigate whether reputation is associated with long-run sustainability ofearnings and enhanced debt contracting value of accounting information,as reflected in a stronger relation between borrowers’ accounting numbersreported just prior to loan origination and future performance outcomes.3
Consistent with prior research (e.g., Sufi [2007], Ross [2010]), we mea-sure bank reputation based on lead banks’ market share in the syndicatedloan market.4 To isolate the future performance implications of the certi-fication role of reputation, we control for what are likely to be strong se-lection effects underpinning the matching of borrowers and lead banks.For example, borrowers with better future prospects or higher quality ac-counting may choose more reputable arrangers. Alternatively, reputablearrangers may choose to contract with borrowers likely to be lucrative con-sumers of the bank’s services in the future. We employ a matching frame-work to explicitly control for observable and unobservable factors that
1 The results in Gopalan, Nanda, and Yerramilli [2011] and Lin and Paravisini [2011] sug-gest that lead bank reputation substitutes for contractual skin in the game. We discuss this inmore detail in section 2. In section 6.2, we examine the impact of fraud on the certificationrole of reputation.
2 See James and Smith [2000] for a review of the empirical literature. Maskara andMullineaux [2011] question these studies by examining the role of self-selection in deter-mining which banks announce their loans. See also Boot [2000] and Saunders and Cornett[2004] for reviews of the special role of banks.
3 Ball, Bushman, and Vasvari [2008] define the debt contracting value of accounting as theability of accounting numbers to capture deterioration in credit quality on a timely basis.
4 In section 2, we discuss in depth this measure of reputation and its potential limitations.
4 ROBERT M. BUSHMAN AND REGINA WITTENBERG-MOERMAN
impact both the likelihood of a borrower dealing with a high-reputationbank and the borrower’s future performance (Heckman and Navarro-Lozano [2004], Ross [2010]).5 We control for observable factors that in-fluence borrower-bank matching, including borrowers’ past performance,historical persistence of earnings, extreme accruals, earnings volatility, andthe potential for cross-selling services to the borrower. Further, we includevariables based on the location of borrowers relative to potential lendersthat determine borrower–arranger matching, but that are independentof borrowers’ future performance. To investigate whether certification byhigh-reputation lead banks extends to the quality of borrowers’ reportedaccounting numbers, we estimate endogenous switching regressions sepa-rately for high and low reputation partitions.
Turning to our results, we document that higher lead arranger reputa-tion is associated with higher profitability and credit quality in the threeyears subsequent to loan initiation.6 With respect to accounting quality, wefind that earnings persistence is higher for borrowers with high-reputationlead banks than for those with lower reputation lead banks, implying thatborrower profitability reported at loan origination is more sustainable forhigh reputation banks. We also show that borrowers with high-reputationlead arrangers exhibit enhanced debt contracting value of accounting, asindicated by a stronger connection between pre-loan profitability and fu-ture credit quality.
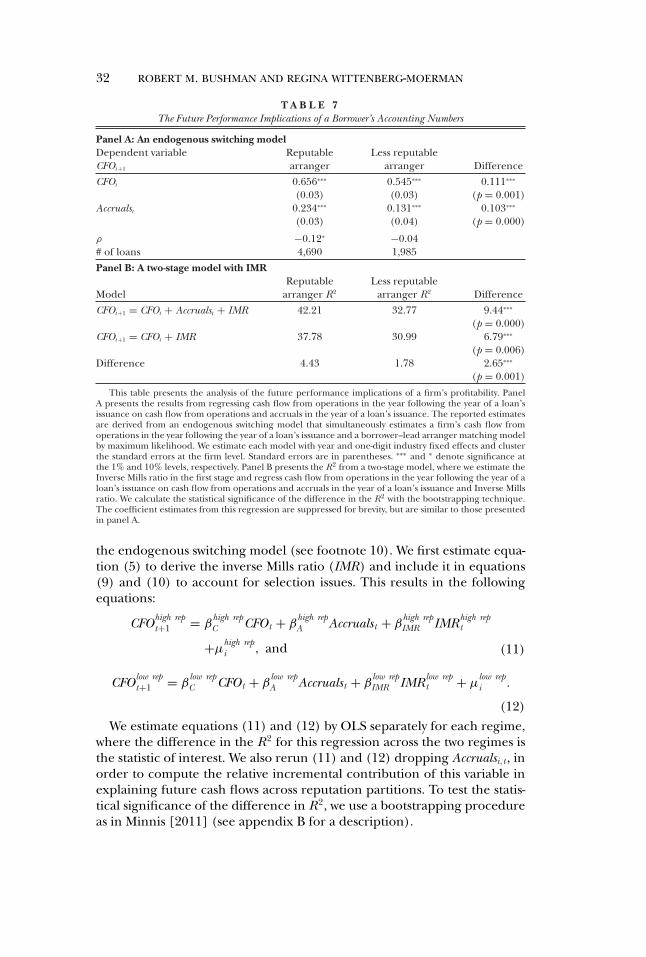
Finally, we examine whether the higher earnings sustainability associatedwith high-reputation lead banks is a consequence of better fundamentals,higher accrual quality, or both. We follow Minnis [2011] and regress one-year-ahead cash flows from operations on the contemporaneous cash flowand accrual components of earnings separately for the high and low rep-utation partitions. We find that borrowers with high-reputation banks ex-hibit higher cash flow persistence and significantly greater accruals quality.Accruals of borrowers with high-reputation lead banks are more stronglyrelated to future cash flows than are accruals of other borrowers.
While we acknowledge that we may not have controlled for all possi-ble alternative explanations, the totality of our results is consistent withthe proposition that lead bank reputation certifies the quality of borrow-ers and that this certification extends to the quality of borrowers’ account-ing numbers at loan inception. These results contribute to the literatureacross several dimensions. First, while a large literature examines relations
5 Private lending presents the possibility that private information, unobservable to the re-searcher, underpins both the decisions that determine bank-borrower matching and borrow-ers’ future performance. We also employ alternative specifications, finding that all results arerobust to using OLS, propensity matching, and firm fixed effect specifications.
6 For example, in the third year following loan origination, borrowers with reputable ar-rangers report profitability that is 2.0 percentage points higher and credit ratings that are 2.5notches lower (lower numerical ratings indicate higher credit quality) relative to borrowerswith less reputable arrangers.
ROLE OF BANK REPUTATION 5
between auditor characteristics and accounting quality, less is known aboutthe role of financial intermediaries in establishing the credibility of ac-counting numbers.7 Lee and Masulis [2011] examine the link between un-derwriter reputation and earnings management and Agrawal and Cooper[2010] examine the effect of venture capitalist reputation on restatements.We extend these studies by documenting that lead bank reputation is as-sociated with higher earnings and cash flow persistence, and with earn-ings that more strongly predict future credit quality. Our results suggestthat the process of establishing the credibility of accounting reports oper-ates through multiple channels, where intermediaries other than auditorsuse their reputation to certify firms’ accounting numbers.
Second, we add to the literature on the role of intermediary reputation inmitigating financial contracting frictions. We extend Ross [2010] by estab-lishing that the higher stock returns associated with announcements that ahigh-reputation bank syndicates a loan are consistent with reputation cer-tifying borrowers’ quality, as reflected by their future performance. Thisevidence of superior economic and accounting quality of borrowers withhigh reputation lead banks also complements Lin and Paravisini [2011]and Gopalan, Nanda, and Yerramilli [2011], who, by establishing that abank’s reputation and skin in the game are substitutes in syndicated lend-ing, show the importance of reputation for lead banks’ screening and mon-itoring incentives.
Third, our result that pre-loan profitability better predicts future creditquality for borrowers of higher reputation lead banks contributes directly tothe debt contracting literature, which posits that accounting quality is a de-terminant of a borrower’s credit risk (e.g., Francis et al. [2005], Ashbaugh-Skaife, Collins, and LaFond [2006], Zhang [2007], Bharath, Sunder, andSunder [2008]). Our analysis suggests that the debt contracting value of ac-counting also depends on the reputation of the lead bank arranging a loan.Our evidence also implies that borrowers endowed with favorable futureprospects, but facing significant investor uncertainty over their accountingquality, can mitigate this uncertainty by having a high-reputation lead bankcredibly certify its accounting quality.
The rest of the paper is organized as follows. Section 2 presents the con-ceptual basis of reputation certification. Section 3 discusses our empiricaldesign and econometric approach to self-selection issues. Section 4 de-scribes the sample and data and presents descriptive statistics, while sec-tion 5 presents our main results. Section 6 discusses robustness issues andsection 7 concludes.
7 Existing literature finds that auditor reputation is associated with fewer accounting errorsand irregularities (Defond and Jiambalvo [1991]), less IPO underpricing (Beatty [1993]),higher earnings response coefficients (Teoh and Wong [1993]), lower abnormal accruals(Becker et al. [1998]), more predictive post-IPO delistings (Weber and Willenborg [2003]),and lower cost of public debt (Lou and Vasvari [2011]). See Francis [2004] for a review of theliterature.
6 ROBERT M. BUSHMAN AND REGINA WITTENBERG-MOERMAN
2. Conceptual Basis of Reputation Certification
It has long been posited that financial intermediaries play a key role ascredible producers of information to market participants. One importantmechanism for projecting credibility is reputation (e.g., Leland and Pyle[1977], Campbell and Keracaw [1980], Diamond [1984]). Klein and Lef-fler [1981], DeAngelo [1981], and Shapiro [1983], among others, demon-strate that reputable firms have incentives to supply high-quality goods tothe market. In equilibrium, rents flow to firms as compensation for invest-ments in reputational capital, and such rents bond the firm to good behav-ior since it is vulnerable to a loss of rents if shirking is detected.
The literature applies this reputational capital paradigm to the certifica-tion role of financial intermediaries. Important theoretical contributionsinclude Baron [1982] and Booth and Smith [1986], who examine the roleof investment bankers in certifying the issuance of equity and risky debt se-curities. Numerous papers examine the role of financial intermediary rep-utation in equity underwriting (e.g., Beatty and Ritter [1986], Carter andManaster [1990], Nanda and Yun [1997], Fernando, Gatchev, and Spindt[2005]), supporting the importance of reputation in certifying initial andsecondary public offerings. Intermediary reputation has also been empha-sized in additional financial market settings, such as bond underwriting(Fang [2005]), venture capital (e.g., Hsu [2004], Nahata [2008], Krishnanet al. [2011]) and auditing (e.g., DeAngelo [1981], Titman and Trueman[1986], Bachar [1989], Datar, Feltham, and Hughes [1991], Ball, Jayara-man, and Shivakumar [2012]).
While reputation may be somewhat less important in the syndicated loanmarket relative to other settings, such as the equity market, where manyplayers are individual investors rather than sophisticated institutions, thenature of syndicated lending and the role played by lead banks create apotentially important role for reputation. Lead arrangers establish rela-tionships with borrowers, perform pre-loan due diligence, negotiate con-tract terms and monitor borrowers after loans are made. These actionsprovide them with access to borrowers’ private information not availableto other syndicate participants. This privileged access to information, to-gether with unobservability of due diligence and monitoring efforts, createagency problems (e.g., Lee and Mullineaux [2004], Sufi [2007], Ivashina[2009]). Further, while syndicate participants include large banks with in-dependent lending arrangements with borrowers, many syndicate partic-ipants are smaller banks and nonbank institutional investors (collateral-ized loan obligations, hedge funds, pension funds, and insurance compa-nies), who became major players in the syndicated loan market in the lastdecade (Bushman, Smith, and Wittenberg-Moerman [2010], Ivashina andSun [2011]). Small banks and institutional investors typically do not haveestablished relationships with borrowers and therefore rely heavily on leadbanks’ monitoring and due diligence.
In addition, the fraction of syndicated loans retained by the lead bank(i.e., the bank’s skin in the game) is relatively small. Sufi [2007] shows that
ROLE OF BANK REPUTATION 7
the mean (median) fraction of loans retained by the lead bank is 28.5%(23.5%). Therefore, the lead bank’s contractual incentives to screen andmonitor are limited. Further, the syndicated loan market is characterizedby repeated transactions between lead banks and participants. Unobserv-able screening and monitoring efforts, insufficient formal contractual in-centives, and the repeated nature of the syndicated lending suggest that abank’s reputation may be a vital mechanism in the syndicated loan market.
A key premise of certification is that an intermediary’s reputation is en-hanced by positive outcomes and damaged by negative outcomes. Lin andParavisini [2011] examine the effect of frauds by Enron, WorldCom, andothers on the lead arrangers of their loans outstanding during the fraudperiod, including some of the most reputable arrangers in the syndicatedloan market, such as J.P. Morgan Chase, Bank of America, and Citigroup.They find that, consistent with reputation loss, these lead banks hold alarger fraction of the loans they arrange following the frauds’ discovery.Further, Gopalan, Nanda, and Yerramilli [2011] find that when lead banks’borrowers are subject to Chapter 11 bankruptcy, the banks are less likelyto syndicate subsequent loans and attract participant lenders, and retainlarger fractions of loans they syndicate.
Pertinent to our analysis, Chemmanur and Fulghieri [1994a] modelthe ex ante evaluation of borrowers by banks. In their model, firms withunobservable future prospects seek to raise external financing, while banksevaluate a firm’s future prospects before agreeing to accept them as clients.More rigorous pre-deal screening increases the likelihood that borrowerswith poor prospects are discovered and denied loans, but more rigorousevaluation is more costly to the bank. Borrowers who pass more rigorousevaluation will perform better on average relative to firms granted financ-ing based on less rigorous evaluation. However, banks’ choice of rigor isnot observable to outsiders, and so investors assess a bank’s reputation forsupplying rigorous evaluations by conditioning on observable outcomes ofpast transactions sponsored by the bank. In equilibrium, higher reputationbanks adopt more rigorous evaluation standards than lower reputationbanks do, and so are more likely to transact with firms with superior futureprospects.
Also, Chemmanur and Fulghieri [1994b] develop a model where rep-utation provides banks with endogenous incentives to devote more re-sources to information production about firms that subsequently becomefinancially distressed. Investors believe that more reputable banks supply agreater ex post monitoring effort, and, in equilibrium, they do. Together,Chemmanur and Fulghieri [1994a,b] suggest that syndications by morereputable arrangers should indicate higher borrower quality at loan incep-tion and more rigorous monitoring during the term of the loan.
Consequently, if borrowers’ true quality is not publicly observable andhigh-reputation banks are more likely to transact with better borrowers,then the fact that a high-reputation bank contracts with a borrower revealsfavorable information about the borrower’s future prospects. However, it
8 ROBERT M. BUSHMAN AND REGINA WITTENBERG-MOERMAN
is also possible that borrowers with better future prospects or higher qual-ity accounting simply choose more reputable arrangers. Thus, empiricallyisolating the future performance implications of reputation is complicatedby potential selection effects underpinning the matching of borrowers andlead banks.
Ideally, we would like to examine a setting where borrowers are randomlyassigned to high- and low-reputation banks, and banks then choose withwhich borrowers to contract. This would allow us to cleanly isolate whetherthe act of a high-reputation bank accepting a borrower reflects favorablyon the borrower’s quality. In the absence of such a setting, our empiri-cal challenge is to control for the factors, observable and unobservable, thatsimultaneously impact the likelihood of a borrower dealing with a high-reputation bank and the borrower’s future performance. To address thischallenge, we employ an endogenous matching framework (Heckman andNavarro-Lozano [2004], Fang [2005], Ross [2010]). We control for observ-able factors that may simultaneously influence borrower-bank matchingand a borrower’s future performance, including its past performance, his-torical earnings persistence, extreme accruals, earnings volatility, and thecross-selling potential of banking services. We also include variables basedon the proximity of borrowers and potential lenders; these proximity mea-sures are expected to significantly affect borrower–arranger matching, butnot borrowers’ future performance (we extend this discussion in section 3).
Another empirical challenge is to proxy for lead bank reputation. Wedefine a lead bank as reputable if its average market share of the syndi-cated loan market over our sample period (1998–2006) is above 2% (seeappendix A for details). We classify J.P. Morgan Chase, Bank of America,Citigroup, Wachovia, Credit Suisse First Boston, and Deutsche Bank as rep-utable arrangers. We also classify J.P. Morgan, Bank One, and Fleet Bostonas reputable arrangers over the period prior to their merger/acquisition.Together, these banks syndicated over 65% of the loan issuances (by vol-ume) over the sample period. In contrast, the remaining syndicated loanswere arranged by more than 1,000 banks, the vast majority of which had amarket share of less than 0.02%.
The banks classified as reputable are among the largest and most sophis-ticated banks in the world, and are therefore likely to have a better feelfor pricing conditions, better information on potential borrowers, and su-perior competence at screening and monitoring borrowers. This suggeststhat reputation is a mechanism by which market participants come to be-lieve that a lead bank does indeed possess superior screening and monitor-ing technologies and, more importantly, that the bank consistently deploysthese technologies on behalf of other loan investors.8
8 Given that Bank of America and Citigroup had to be bailed out in the recent financialcrisis, one may question our conjecture that these banks are reputable. However, Bank ofAmerica and Citigroup remained dominant arrangers over the 2007–2009 period (with an
ROLE OF BANK REPUTATION 9
Our measure of bank reputation follows prior research (e.g., Sufi [2007],Ross [2010]). However, it is possible that dominant market share could bea consequence of factors other than reputation. First, dominant banks mayhave achieved their market share by offering more attractive terms thanother lenders or from passing on an advantage of raising money at favor-able rates. However, as argued by Ross [2010], these explanations are notplausible, given that lead banks with high market share syndicate most ofthe loan principal to other syndicate participants. Another alternative isthat these banks have achieved oligopolistic market power through struc-tural barriers that suppress competition. If so, they should be able to extractrents from borrowers, such as higher interest rates. However, Ross [2010]finds that lead banks with high market share charge lower interest rates, andare more likely to lend without the protection of a borrowing base that lim-its outstanding principal to a fraction of readily saleable assets. These resultsare consistent with such banks having a strong reputation for evaluatingborrowers’ underlying business and true default risk, allowing them to of-fer borrowers more attractive terms while still inducing syndicate membersto participate. Fang [2005] finds similar evidence in the public bond mar-ket: reputable underwriters charge higher fees, but a lower interest rate,with an overall favorable effect on issuers’ net proceeds.
Third, reputable banks may achieve high market share because the largescale and scope of their operations allows them to offer borrowers lowerinterest rates based on expectations that the bank can later cross-sell sig-nificant services to the borrower (investment banking, derivatives, struc-tured finance, etc.). Yasuda [2005] shows that serving as the loan’s leadarranger helps banks to gain future underwriting of a borrower’s publicbonds. Drucker and Puri [2005] find that private lending increases theprobability of receiving the current and future underwriting of a borrower’sequity securities. In the context of syndicated loans supporting leveragedbuyouts, Ivashina and Kovner [2011] find evidence that lead banks priceloans to cross-sell future fee services. In our empirical tests, we explicitlycontrol for the cross-selling potential of banking services to the borrower.9
3. Empirical Design
Section 3.1 describes the econometric framework. In section 3.2, we dis-cuss our empirical strategy for isolating the implications of reputation cer-tification for borrowers’ future performance and accounting quality.
average market share of 18.3 and 14.4 percent, respectively), suggesting that their reputationcontinues to be strong in the syndicated loan market. J.P. Morgan Chase, Credit Suisse FirstBoston, Deutsche Bank, and Wachovia (until its merger with Wells Fargo) also continued tolead syndicated loan issuances over the crisis period (Bank One and Fleet Boston merged withJ.P. Morgan Chase and Bank of America, respectively, in 2004).
9 We thank an anonymous reviewer for suggesting that we address the cross-selling potentialin our analyses.
10 ROBERT M. BUSHMAN AND REGINA WITTENBERG-MOERMAN
3.1 ECONOMETRIC FRAMEWORK
Consistent with recent research on intermediary reputation (Fang,[2005], Ross [2010]), we employ an endogenous matching framework de-signed to explicitly control for observable and unobservable factors asso-ciated both with the choice of lead arranger and the borrower’s futureperformance (e.g., Heckman and Navarro-Lozano [2004]). The appropri-ateness of this framework rests on the presumption that private lendingarrangements involve access to confidential information and that such pri-vate information may underpin the observed matching between banks andborrowers and also be associated with future performance.
The basic framework consists of a binary outcome equation that modelsmatching between borrowers and lead banks, and two regression equations,one for each reputation partition (see Maddala [1983], chapters 8 and 9).Formally, we have:
Reputation∗i = Ziγ + εi , (1)
FuturePerformancehigh repi = xiβ
high rep + μhigh repi , and (2)
FuturePerformancelow repi = xiβ
low rep + μlow repi . (3)
Equation (1) is the borrower–lead arranger matching equation. We im-plement equation (1) as a probit model where the dependent variable is anindicator variable set equal to one if a loan is arranged by a high-reputationbank, and zero otherwise. Equation (2) is the performance equation forreputable banks, and equation (3) is that for less reputable banks, wherefuture performance is either profitability or credit quality. The vector xi in-cludes observable borrower and loan characteristics posited to directly in-fluence borrowers’ future performance. Equations (2) and (3) effectivelyallow interactions between arranger reputation and the explanatory vari-ables xi in the borrower performance models. To control for unobservablefactors affecting both bank-borrower matching and future performance,we allow the residuals in equations (2) and (3) to be correlated with theresidual in equation (1). The three error terms (εi , μ
high repi , μ
low repi ) are as-
sumed to have a trivariate normal distribution. We simultaneously estimateequations (1), (2), and (3) by maximum likelihood.10
The vector Zi in (1) represents observable variables important to de-termining matching between borrowers and lead banks. This vector iscomprised of two distinct subsets. The first subset contains factors thatdetermine borrower–lead arranger matching and at the same time may beassociated with borrowers’ future performance and accounting quality. The
10 All results are robust to using a two-step procedure which: 1) estimates equation (1) asa probit model and derives the inverse Mills ratio from the fitted values of Reputationi , andthen 2) includes the inverse Mills ratios in equations (2) and (3) to account for unobservablefactors.
ROLE OF BANK REPUTATION 11
second subset includes two variables based on the location of borrowers rel-ative to potential lenders that determine borrower–arranger matching, butthat are independent of borrowers’ future performance and are properlyexcluded from the future performance regressions.
With respect to the first subset, recall that one of our main research ob-jectives is to examine whether reputation certifies borrowers’ accountingquality. It is thus important to control for the possibility that borrowerswith higher earnings quality simply select higher reputation lead banks. Inaddition to a borrower’s prior earnings, we include a range of variablesthat capture observable earnings quality at a loan’s issuance. In particular,we include two measures of historical earnings persistence (see appendixA for a detailed description of all variables). We estimate our first persis-tence measure—Earnings-persistence-1—by the coefficient from a time se-ries regression of earnings on prior year earnings (e.g., Ali and Zarowin[1992], Francis et al. [2004], Frankel and Litov [2009], Dechow, Ge, andSchrand [2010]). Alternatively, we follow Skinner and Soltes [2011], whofind that reported earnings are significantly more persistent for dividend-paying firms and firms that make stock repurchases. We define Earnings-persistence-2 as an indicator variable taking the value of one if a bor-rower paid cash dividends and performed stock repurchases in the ma-jority of years over the five-year period preceding a loan’s issuance, zerootherwise.
To further control for historical earnings persistence, we include a mea-sure of extreme positive accruals (Accruals-pos-extreme), as such accruals tendto quickly reverse and decrease future profitability (Sloan [1996]). We alsocontrol for whether a borrower reported losses in the year prior to the yearof a loan’s issuance (Loss), as losses are typically transitory and less persis-tent (Hyan [1995], Basu [1997], Frankel and Litov [2009]). In addition,we address the possibility that firms with a more stable performance selectmore reputable arrangers and include a measure of earnings volatility. Wemeasure Earnings-volatility by the standard deviation of the ratio of EBITDAto total assets over the 10-year period prior to a loan’s issuance (Dichev andTang [2009]). In untabulated analysis, we substitute earnings volatility bycash flow volatility and find that the results are unchanged.
The first subset of variables in the borrower-lead arranger matching equa-tion also includes controls for a variety of firm- and loan-specific character-istics, such as credit risk; leverage; and a loan’s size, maturity and purpose.In addition, we incorporate a measure of cross selling potential to controlfor the possibility that high-reputation lead banks cherry pick borrowers towhom they can cross-sell significant services in the future. We adopt theapproach of Ivashina and Kovner [2011] and proxy for a lead bank’s ex-pectations of future fee business with a borrower’s past business. We mea-sure a borrower’s past business by the amount of total equity and bond is-suances in the five-year period preceding the year of the loan. We focus onequity and bond issuances as Drucker and Puri [2005] and Yasuda [2005]show that serving as the loan’s lead arranger helps banks to gain future
12 ROBERT M. BUSHMAN AND REGINA WITTENBERG-MOERMAN
underwriting of a borrower’s equity and public bonds, respectively.11 Thevalue of equity and bond transactions should represent a good proxy forbank fee amounts because, in these transactions, fees are typically stronglyrelated to the transaction value (Chen and Ritter [2000], Ivashina andKovner [2011]).12 We define Cross-selling-potential as an indicator variabletaking the value of one if a borrower’s cross-selling potential, estimated bythe value of past equity and bond transactions, is above the sample median,zero otherwise.13
For the second subset in the vector Zi , we follow Ross [2010] and includetwo variables based on the proximity of borrowers and potential lendersthat impact borrower–arranger matching but not borrowers’ future per-formance. The first variable derives from the idea that a borrower is morelikely to borrow from a high-reputation bank if it is in close proximity to thebank. The importance of proximity is supported by evidence that a shorterdistance between the borrower and the lender enhances lenders’ informa-tion gathering and monitoring abilities (Peterson and Rajan [2002], Bergeret al. [2005], Sufi [2007], Dass and Massa [2011]). In particular, proxim-ity to the borrower facilitates lenders’ collection of soft information (Pe-terson and Rajan [2002], Berger et al. [2005]) and access to private in-formation (Dass and Massa [2011]). Further, the home bias literature alsosuggests that investors have better access to information about local firms(e.g., Coval and Moskowitz [1999] and [2001]). We define the variable Near-reputable-arranger as equal to one if the borrower’s headquarters is within60 km of any high reputation banks’ headquarters, zero otherwise.14 Weexpect Near-reputable-arranger to be positively associated with the choice ofa high-reputation lead bank.
The second variable captures the idea that a borrower will be less likelyto borrow from a high-reputation bank if there are credible local alter-native lenders nearby. We consider a local bank to be a credible alterna-tive if it arranges, on average, at least 30 syndicated loan deals per yearover the sample period, suggesting that it has a considerable expertise in
11 The total amount of a borrower’s equity and bond issuance over the five-year period pre-ceding the loan issuance is 54%, correlated with the total amount of a borrower’s equity andbond issuances over the five-year period following loan issuance, supporting the appropriate-ness of the cross-selling measure based on borrower past business. In unreported analysis, webase the cross-selling variable on the amount of future transactions. The results continue tohold.
12 The Thompson One Banker database, from which we obtain transactions values, reportsfee amounts very sparsely; fees are not available for the vast majority of the sample borrowers’past and future transactions.
13 In untabulated analyses, we find that our inferences are similar if we employ the contin-uous measure of cross- selling potential (the total value of a borrower’s past equity and bondtransactions) instead of the indicator variable. The economic and statistical significance of thecross-selling potential variables are somewhat smaller in this case.
14 Following Ross [2010], we conjecture that, while reputable banks have satellite offices,these offices rarely engage in the syndicated loan activities of the large, public borrowers thatare the focus of this study.
ROLE OF BANK REPUTATION 13
syndicated lending.15 This variable, Near-local-arranger , is set equal to oneif a borrower’s headquarters is within 60 km of a credible regional lead ar-ranger’s headquarters and zero otherwise. We expect Near-local-arranger tobe negatively associated with the choice of a high reputation lead bank.16
While location likely plays a large role in determining the propensity oflenders and borrowers to do business together, it is not plausible that alender or borrower would change the location of its headquarters solelyfor the purpose of consummating a loan (Ross [2010]). Moreover, twootherwise observationally equivalent borrowers should not differ in theirsusceptibility to the loan certification effect and in post-loan performancemerely because the borrowers’ headquarters are located in different re-gions of the United States. Therefore, we treat the Near-reputable-arrangerand Near-local-arranger variables as valid instruments that are independentof borrowers’ future performance and are properly excluded from the fu-ture performance regressions.
3.2 ESTIMATING THE FUTURE PERFORMANCE IMPLICATIONS OF BANKREPUTATION
We first investigate the basic question of whether firms with high repu-tation banks exhibit a superior future performance (section 5.2). Here, weutilize a treatment effects model that includes a reputation dummy vari-able.17 The specification simplifies equations (1), (2), and (3) to a two-equation framework that retains equation (1), and replaces equations (2)and (3) with a single equation (4) that restricts βhigh rep = β low rep . The singleequation takes the form:
Reputationi is set equal to one if a loan is arranged by a reputable bank,zero otherwise. The error terms (εi , μi ) are assumed to be jointly normallydistributed. The coefficient βR represents an unbiased estimate of the im-pact of reputation certification on future performance. FuturePerformanceiis either a borrower’s profitability or credit rating in each of the three yearssubsequent to loan initiation. The set of control variables includes the samevariables as in the borrower-matching equation, including borrowers’ pastprofitability, historical earnings quality and volatility measures, cross-sellingpotential, and various firm and loan characteristics. In addition, we control
15 The results are not sensitive to the threshold number of syndicated loan deals. When wechange the threshold to 40 or 60 deals per year, this instrument performs similarly in both thearranger–borrower matching equation and the future performance equation.
16 Our results are robust when we define Near-reputable-arranger and Near-local-arranger basedon the distance between the borrower’s and the lender’s headquarters within 150 km.
17 We use the treatment effects model primarily to facilitate simple comparisons of theresults using the matching model to alternatives such as OLS, propensity matching, and firmfixed effects. We also compute treatment effects using counterfactuals constructed from theendogenous switching model estimated in section 5.3.
14 ROBERT M. BUSHMAN AND REGINA WITTENBERG-MOERMAN
for loan interest rate and whether institutional investors participate in aloan syndicate.18 When FuturePerformance is credit ratings, we augment thecontrols with measures of whether the borrower is on the S&P watch list orhas an S&P outlook at the time of a loan’s issuance.
To investigate whether reputation operates through the quality of bor-rowers’ accounting numbers, we estimate the full switching regressionframework represented by equations (1), (2), and (3) above (see section5.3). We estimate separate performance mappings for high and low rep-utation partitions. The implication of reputation for accounting quality iscaptured by significant differences in the mapping between borrowers’ pre-loan profitability and future performance across high and low reputationpartitions. With respect to future profitability, significant differences in themapping between borrowers’ pre-loan profitability and future profitabil-ity capture differences in earnings persistence across reputation partitions.When future performance is credit quality, significant differences capturedifferences in the strength of the connection between pre-loan profitabilityand future credit ratings.
4. Sample, Data, and Descriptive Statistics
4.1 DATA SOURCES AND SAMPLE SELECTION
We employ the DealScan database provided by the Thomson ReutersLoan Pricing Corporation (TRLPC). We obtain firm characteristics fromCompustat. Firms’ senior debt ratings, watch list additions, and outlookchanges (at the firm level) are retrieved from the S&P historical database. Ifthe S&P historical database does not cover a particular firm, we retrieve theMoody’s, Fitch, or DPR senior debt rating from the Mergent Fixed IncomeSecurities Database (FISD). For borrowers missing ratings on S&P andFISD, we hand-collect ratings from the Internet-based version of TRLPC.CDS data is obtained from Markit. We employ Thompson One Banker tocompile information on sample borrowers’ equity and bond transaction;this database covers all bond and equity issuances in the United States.
Table 1 summarizes the sample selection process. For the period 1998to 2006, DealScan reports 68,368 facilities outstanding to U.S. firms and is-sued in U.S. dollars. Merging this data with Compustat allows us to identify25,518 facilities issued to public firms. Next, we exclude facilities with insuf-ficient loan data, leaving 19,141 facilities. We also require sample borrowers
18 We require all the variables in the borrower–lead arranger matching model to be ob-servable prior to the matching process. We exclude the interest rate spread and institutionalinvestor indicator variables from the model because these variables become known later inthe loan syndication process, when the lead arranger assesses the market demand for the loanand recruits syndicate participants. At the same time, the matching model does comprise anumber of loan characteristics, including size, maturity, and purpose. While the first two char-acteristics may be subject to some negotiation between the borrower and the syndicate, theborrower typically requires a particular loan size and duration when approaching the leadarranger. Loan purpose is also known prior to loan initiation.
ROLE OF BANK REPUTATION 15
T A B L E 1Sample Selection
Filters Number of facilities
Syndicated loans to U.S. borrowers, in U.S. dollars, issued over theperiod from 1998 to 2006
68,368
Intersection with Compustat 25,518After elimination of facilities with missing loan data 19,141After elimination of facilities with insufficient firm data, including
past and future profitability9,857
After elimination of unrated facilities 6,675
This table presents the sample selection process.
to have sufficient Compustat data for estimating a borrower’s performanceprior to and following a loan’s issuance; this restricts our sample to 9,857 fa-cilities.19 Finally, we exclude loans of non rated borrowers. The remainingsample contains 6,675 facilities related to 1,272 firms.
4.2 DESCRIPTIVE STATISTICS
Panel A of table 2 reports that 70% of sample loans are issued by rep-utable arranger. Sample loans have, on average, a size of $546M, a matu-rity of 43 months, and an interest spread of 156 basis points. Institutionalloans represent 12% of the sample loans, 14% of the loans are issued forrestructuring purposes, and 49% are syndicated by a relationship arranger.In terms of credit quality characteristics at loan origination, sample firmshave a mean and median S&P senior debt rating of BBB. The mean CDSspread for the firms with traded CDS is 1.62%, and 8% (18%) of the loansrelate to firms on the S&P negative watch list (Outlook). Sample firms arerelatively large, with a mean and median value of total assets of 9,439M and2,776M, respectively, and they have average profitability, as measured by theratio of EBITDA to total assets, of 13%.
In panels B and C of table 2, we report summary statistics for the rep-utable and less reputable arranger samples, respectively. The two samplesdiffer along a number of dimensions. Loans syndicated by reputable ar-rangers are larger, have a shorter maturity, and are also more likely to beissued by arrangers that have a previous relationship with the borrower;loans with a prior lending relationship represent 52% of the reputable ar-ranger sample, relative to 43% of the less reputable arranger sample. Assuggested by the Interest-spread, Credit-rating , CDS-spread, and Leverage vari-ables, reputable arrangers’ loans are issued to less risky firms relative to thefirms of less reputable arrangers. Reputable arrangers’ borrowers are sig-nificantly larger but do not differ in terms of profitability at the time of theloan’s origination.
19 We require at least nine years of profitability-related data to estimate a borrower’s pastearnings persistence and volatility, and profitability following the loan issuance.
16 ROBERT M. BUSHMAN AND REGINA WITTENBERG-MOERMANT
AB
LE
2D
escr
iptiv
eSt
atis
tics
Pan
elA
:Tot
alsa
mpl
e
Num
ber
ofD
istr
ibut
ion
Loa
nan
dFi
rmC
har
acte
rist
ics
obse
rvat
ion
sM
ean
SD25
%50
%75
%
Loa
nch
arac
teri
stic
s:R
eput
atio
n6,
675
0.70
Loa
n-si
ze(i
nm
illio
ns)
6,67
554
6.4
985.
312
5.0
296.
060
0.0
Mat
urity
(in
mon
th)
6,67
542
.67
25.7
312
.00
48.0
060
.00
Inte
rest
-spre
ad(i
nbp
s)6,
675
156.
413
0.59
50.0
130.
0025
0.00
Inst
itutio
nal
6,67
50.
12R
estr
uctu
ring
-pur
pose
6,67
50.
14Pr
ior-r
elat
ions
hip
6,67
50.
49C
redi
tris
kch
arac
teri
stic
s:C
redi
t-rat
ing
6,67
510
.44
3.98
8.00
10.0
013
.00
CD
S-sp
read
(in
%)
2,35
21.
621.
910.
390.
772.
03W
atch
-neg
ativ
e(W
atch
-pos
itive
)6,
675
0.08
(0.0
2)O
utlo
ok-n
egat
ive
(Out
look
-pos
itive
)6,
675
0.18
(0.0
7)A
ddit
ion
alfi
rmch
arac
teri
stic
s:Fi
rm-si
ze(i
nm
illio
ns)
6,67
59,
439
25,5
731,
056
2,77
69,
533
Lev
erag
e6,
675
0.33
0.22
0.19
0.29
0.42
RO
A6,
675
0.13
0.08
0.09
0.12
0.17
Inte
rest
-cov
erag
e6,
675
10.8
434
.99
2.88
4.91
9.43
Earn
ings
-per
sist
ence
-16,
675
0.48
0.40
0.25
0.51
0.72
Earn
ings
-vol
atili
ty6,
675
0.04
0.04
0.02
0.03
0.05
Earn
ings
-per
sist
ence
-26,
675
0.33
Acc
rual
s-pos
-extr
eme
6,67
50.
10L
oss
6,67
50.
02N
ear-r
eput
able
-arr
ange
r6,
675
0.21
Nea
r-loc
al-a
rran
ger
6,67
50.
17C
ross
-selli
ng-p
oten
tial
6,67
50.
50
(Con
tinue
d)
ROLE OF BANK REPUTATION 17
TA
BL
E2
—C
ontin
ued
Pan
elB
:Rep
utab
lear
rang
ersa
mpl
e
Num
ber
ofD
istr
ibut
ion
Loa
nan
dFi
rmC
har
acte
rist
ics
obse
rvat
ion
sM
ean
SD25
%50
%75
%
Loa
nch
arac
teri
stic
s:L
oan-
size
(in
mill
ion
s)4,
690
639.
9∗∗∗
1060
.017
0.0
350.
075
0.0
Mat
urity
(in
mon
th)
4,69
041
.73∗∗
∗25
.79
12.0
048
.00
60.0
0In
tere
st-sp
read
(in
bps)
4,69
014
0.2∗∗
∗12
1.02
4010
0.00
230.
00In
stitu
tiona
l4,
690
0.11
∗∗∗
Res
truc
turi
ng-p
urpo
se4,
690
0.11
∗∗∗
Prio
r-rel
atio
nshi
p4,
690
0.52
∗∗∗
Cre
ditr
isk
char
acte
rist
ics:
Cre
dit-r
atin
g4,
690
9.87
∗∗∗
3.82
7.00
10.0
013
.00
CD
S-sp
read
(in
%)
1,97
01.
55∗∗
∗1.
850.
370.
731.
95W
atch
-neg
ativ
e(W
atch
-pos
itiv
e)4,
690
0.08
(0.0
2)O
utlo
ok-n
egat
ive
(Out
look
-pos
itiv
e)4,
690
0.18
(0.0
7)A
ddit
ion
alfi
rmch
arac
teri
stic
s:Fi
rm-si
ze(i
nm
illio
ns)
4,69
010
,907
∗∗∗
24,2
461,
511
3,67
511
,499
Lev
erag
e4,
690
0.32
∗∗∗
0.21
0.19
0.29
0.40
RO
A4,
690
0.14
0.07
0.09
0.13
0.17
Inte
rest
-cov
erag
e4,
690
11.0
334
.99
3.04
5.22
9.86
Earn
ings
-per
sist
ence
-14,
690
0.49
∗∗0.
390.
270.
520.
73Ea
rnin
gs-v
olat
ility
4,69
00.
04∗∗
∗0.
030.
020.
030.
05Ea
rnin
gs-p
ersi
sten
ce-2
4,69
00.
36∗∗
∗
Acc
rual
s-pos
-extr
eme
4,69
00.
09∗∗
∗
Los
s4,
690
0.01
∗∗∗
Nea
r-rep
utab
le-a
rran
ger
4,69
00.
24∗∗
∗
Nea
r-loc
al-a
rran
ger
4,69
00.
15∗∗
∗
Cro
ss-se
lling
-pot
entia
l4,
690
0.55
∗∗∗
(Con
tinue
d)
18 ROBERT M. BUSHMAN AND REGINA WITTENBERG-MOERMANT
AB
LE
2—
Con
tinue
d
Pan
elC
:Les
sre
puta
ble
arra
nger
sam
ple
Num
ber
ofD
istr
ibut
ion
Loa
nan
dFi
rmC
har
acte
rist
ics
obse
rvat
ion
sM
ean
SD25
%50
%75
%
Loa
nch
arac
teri
stic
s:L
oan-
size
(in
mill
ion
s)1,
985
325.
573
5.5
75.0
015
5.0
350.
0M
atur
ity(i
nm
onth
)1,
985
44.9
025
.44
18.0
048
.00
60.0
0In
tere
st-sp
read
(in
bps)
1,98
519
4.5
143.
7975
180.
0028
0.00
Inst
itutio
nal
1,98
50.
14R
estr
uctu
ring
-pur
pose
1,98
50.
20Pr
ior-r
elat
ions
hip
1,98
50.
43C
redi
tris
kch
arac
teri
stic
s:C
redi
t-rat
ing
1,98
511
.73
4.03
9.00
12.0
014
.00
CD
S-sp
read
(in
%)
382
1.96
2.14
0.50
0.96
2.58
Wat
ch-n
egat
ive
(Wat
ch-p
ositi
ve)
1,98
50.
07(0
.02)
Out
look
-neg
ativ
e(O
utlo
ok-p
ositi
ve)
1,98
50.
18(0
.08)
Add
itio
nal
firm
char
acte
rist
ics:
Firm
-size
(in
mill
ion
s)1,
985
5,97
528
,165
604.
21,
358
3,80
6L
ever
age
1,98
50.
360.
240.
200.
320.
47R
OA
1,98
50.
130.
080.
090.
120.
17In
tere
st-c
over
age
1,98
510
.41
35.0
22.
354.
187.
89Ea
rnin
gs-p
ersi
sten
ce-1
1,98
50.
460.
410.
220.
480.
70Ea
rnin
gs-v
olat
ility
1,98
50.
050.
060.
020.
030.
06Ea
rnin
gs-p
ersi
sten
ce-2
1,98
50.
24A
ccru
als-p
os-ex
trem
e1,
985
0.12
Los
s1,
985
0.03
Nea
r-rep
utab
le-a
rran
ger
1,98
50.
14N
ear-l
ocal
-arr
ange
r1,
985
0.21
Cro
ss-se
lling
-pot
entia
l1,
985
0.38
Th
ista
ble
prov
ides
desc
ript
ive
stat
isti
cs(s
eeta
ble
1fo
rth
esa
mpl
ese
lect
ion
proc
edur
e).P
anel
Apr
ovid
esde
scri
ptiv
est
atis
tics
for
allf
acili
ties
.Pan
els
Ban
dC
prov
ide
desc
ript
ive
stat
isti
csfo
rth
ere
puta
ble
arra
nge
ran
dle
ssre
puta
ble
arra
nge
rsa
mpl
es,r
espe
ctiv
ely.
∗∗∗
and
∗∗in
dica
tew
het
her
ava
riab
le’s
mea
nva
lue
issi
gnifi
can
tly
diff
eren
tfo
rth
ere
puta
ble
arra
nge
rsa
mpl
eth
anit
isfo
rth
en
onre
puta
ble
arra
nge
rsa
mpl
esat
the
1%an
d5%
leve
ls,r
espe
ctiv
ely.
Vari
able
sar
ede
fin
edin
appe
ndi
xA
.
ROLE OF BANK REPUTATION 19
Highlighting the importance of historical earnings quality, we find thatreputable arrangers’ borrowers have higher earnings persistence, estimatedby both the Earnings-persistence-1 and Earnings-persistence-2 measures; havelower earnings volatility; and are less likely to have extreme accruals andto experience a loss in the period prior to the loan origination. It is alsothe case that high cross-selling potential is more prevalent for reputablearrangers’ borrowers than for borrowers from less reputable banks. Finally,we find that the borrowers of reputable arrangers are significantly morelikely to be in close geographical proximity to a reputable lead bank andare significantly less likely to be located close to a credible local lead bank.
5. Empirical Results
5.1 THE BORROWER–LEAD ARRANGER MATCHING MODEL
Table 3 presents the estimation of the following Probit model ofborrower–arranger matching, which includes loan- and firm-specific char-acteristics and year and industry fixed effects:
(5)Table 3 shows that prior profitability does not affect bank-borrower
matching. We find modest evidence that historical earnings quality impactsthe matching, where only Earnings-persisternce-2 is significant at the 10%level. Reputable arrangers syndicate the loans of larger firms and largerloans; larger loans generally require larger syndicates, which are likely moredifficult to arrange. Interestingly, borrowers with high cross-selling poten-tial are more likely to end up with high-reputation lead banks. Reputablearrangers are less likely to issue restructuring purpose loans. This may occurbecause restructuring purpose loans are often accompanied by significantchanges in a firm’s capital structure and thus are associated with high un-certainty, deterring reputable arrangers from syndicating such loans. Butthis relation could also be driven by the fact that smaller, less reputablebanks have superior local market knowledge, which may be especially im-portant for arranging restructuring purpose loans. Firms are more likelyto hire the same lead arranger used for previous loan transactions if thelead arranger is reputable. This evidence is consistent with Fang [2005],who finds that reputable underwriters in the public bond market are morelikely to have a prior relationship with the issuers, compared to less rep-utable underwriters.
Lastly, both of our geography variables are significant with the predictedsigns. First, Near-reputable-arranger is significantly positively associated with
20 ROBERT M. BUSHMAN AND REGINA WITTENBERG-MOERMAN
(0.12) (0.12)Pseudo R -Square 17.43% 18.02%AUC (area under ROC curve) 0.782 0.787# of loans 6,675 6,675
This table presents the borrower–lead arranger matching model. We regress an indicator variable thatreflects whether a loan is issued by a reputable arranger on a set of loan- and firm-specific characteristics.We estimate the model with year and one-digit industry fixed effects and cluster the standard errors at thefirm level. Standard errors are in parentheses. ∗∗∗, ∗∗, and ∗ denote significance at the 1%, 5%, and 10%levels, respectively. Variables are defined in appendix A.
the choice of a high reputation lead. Economically, being in proximity to areputable lead arranger increases the probability of a borrower–reputablearranger match by 7.8% (7.9%) in the first (second) model. The secondvariable, Near-local-arranger , has a significantly negative coefficient, consis-tent with borrowers being less likely to borrow from a high-reputation bankif there are credible local alternatives. Close proximity to a local credi-ble lead arranger decreases the probability that a loan is syndicated by a
ROLE OF BANK REPUTATION 21
reputable arranger by 6.1% (6.3%) in the first (second) model. A partial-F statistic of 13.84 and 13.96 (p-values of 0.00) in the first and secondmodels, respectively, indicates that the Near-reputable-arranger and Near-local-arranger variables are collectively strong instruments for the choice of bankreputation. Also, the partial R -square of 3.0% (3.1%) in the first (second)model reveals that these variables have significant explanatory power. TheAUC (area under ROC curve) of 0.782 and 0.787 for the first and sec-ond models, respectively, suggests that our model successfully explains theborrower–arranger matching.
5.2 BANK REPUTATION AND BORROWERS’ FUTURE PROFITABILITY ANDCREDIT RATINGS
Our first series of future performance analyses employs a treatment ef-fects model, which includes loan- and firm-specific characteristics and yearand industry fixed effects. For this analysis, we use our second earningspersistence measure, as there is a significant relation between Earnings-persistence-2 and Reputation in the borrower–arranger matching model,while Earnings-persistence-1 does not explain Reputation:20
Panel A of table 4 provides a univariate comparison of the future prof-itability and credit ratings of borrowers of reputable and less reputable ar-rangers. There is no significant difference in the mean profitability of theborrowers of reputable and less reputable arrangers prior to a loan’s is-suance, but borrowers with reputable arrangers exhibit a higher mean prof-itability over the three-year period following a loan’s issuance. This result isdriven by the drop in the mean profitability of borrowers of less reputablearrangers, from 0.13 prior to a loan issuance to 0.12 in the following years.Borrowers of reputable arrangers have a lower (i.e., better) credit rating,by approximately 2 notches, than borrowers of less reputable arrangers.
Table 4, panel B, reports the results of estimating equation (6) withFuturePerformance measured as profitability. The coefficient of 0.012 on Rep-utation in column (1) indicates that, in the year following a loan issuance,borrowers with reputable arrangers report an ROA that is 1.2 percentagepoints higher than it is for borrowers with less reputable arrangers. Thisdifference is economically significant, representing 9.6% of the mean prof-itability of borrowers of nonreputable arrangers in that year. The differencein profitability across borrowers of reputable and non-reputable arrangersincreases over time. In the second (third) year following the year of a loanissuance, borrowers with reputable arrangers report an ROA that is 1.8(2.0) percentage points higher than that of borrowers with nonreputable
20 For robustness, we replicated all our future performance analyses with Earnings-persistence-1 and find that our inferences are unchanged.
22 ROBERT M. BUSHMAN AND REGINA WITTENBERG-MOERMAN
TA
BL
E4
Bor
row
erPr
ofita
bilit
yan
dC
redi
tRat
ing
Follo
win
ga
Loa
nIs
suan
ce
Pan
elA
:Des
crip
tive
stat
isti
cs
Rep
utab
lear
ran
ger
Les
sre
puta
ble
arra
nge
rD
iffe
ren
ce
Mea
nR
OA
RO
A0.
135
0.13
20.
003
RO
At+
10.
130
0.12
40.
006∗∗
RO
At+
20.
131
0.12
30.
008∗∗
∗
RO
At+
30.
132
0.12
30.
009∗∗
∗
Mea
nC
redi
t-rat
ing
Cre
dit-r
atin
g9.
8711
.73
−1.8
5∗∗∗
Cre
dit-r
atin
g t+1
10.0
911
.83
−1.7
5∗∗∗
Cre
dit-r
atin
g t+2
10.2
911
.94
−1.6
6∗∗∗
Cre
dit-r
atin
g t+3
10.5
012
.32
−1.8
2∗∗∗
Pan
elB
:Atr
eatm
ente
ffec
tsm
odel
offu
ture
profi
tabi
lity
Trea
tmen
teff
ects
mod
elO
LS
Dep
ende
ntv
aria
ble
RO
At+
1R
OA
t+2
RO
At+
3R
OA
t+1
RO
At+
2R
OA
t+3
(1)
(2)
(3)
(4)
(5)
(6)
Rep
utat
ion
0.01
2∗∗0.
018∗∗
∗0.
020∗∗
∗0.
004∗
0.00
6∗∗0.
007∗∗
(0.0
0)(0
.00)
(0.0
0)(0
.00)
(0.0
0)(0
.00)
RO
A0.
604∗∗
∗0.
516∗∗
∗0.
475∗∗
∗0.
606∗∗
∗0.
506∗∗
∗0.
457∗∗
∗
(0.0
3)(0
.03)
(0.0
4)(0
.03)
(0.0
3)(0
.03)
Earn
ings
-per
sist
ence
-20.
003
0.00
30.
002
0.00
30.
003
0.00
2(0
.00)
(0.0
0)(0
.00)
(0.0
0)(0
.00)
(0.0
0)A
ccru
als-p
os-ex
trem
e−0
.013
∗∗∗
−0.0
21∗∗
∗−0
.021
∗∗∗
−0.0
14∗∗
∗−0
.018
∗∗∗
−0.0
22∗∗
∗
(0.0
0)(0
.01)
(0.0
1)(0
.00)
(0.0
1)(0
.01)
Los
s0.
019
0.02
00.
012
0.01
80.
019
0.00
9
(Con
tinue
d)
ROLE OF BANK REPUTATION 23
TA
BL
E4
—C
ontin
ued
Pan
elB
:Atr
eatm
ente
ffec
tsm
odel
offu
ture
profi
tabi
lity
Trea
tmen
teff
ects
mod
elO
LS
Dep
ende
ntv
aria
ble
RO
At+
1R
OA
t+2
RO
At+
3R
OA
t+1
RO
At+
2R
OA
t+3
(1)
(2)
(3)
(4)
(5)
(6)
(0.0
1)(0
.02)
(0.0
2)(0
.01)
(0.0
2)(0
.02)
Earn
ings
-vol
atili
ty0.
025
0.07
40.
077
0.01
80.
048
0.05
9(0
.05)
(0.0
5)(0
.07)
(0.0
5)(0
.04)
(0.0
6)C
redi
t-rat
ing
0.00
00.
000
−0.0
030.
000
0.00
0−0
.001
(0.0
0)(0
.00)
(0.0
0)(0
.00)
(0.0
0)(0
.00)
Lev
erag
e0.
035∗∗
∗0.
040∗∗
∗0.
049∗∗
∗0.
033∗∗
∗0.
037∗∗
∗0.
047∗∗
∗
(0.0
1)(0
.01)
(0.0
1)(0
.01)
(0.0
1)(0
.01)
Inte
rest
-cov
erag
e0.
000
0.00
00.
000
0.00
00.
000
0.00
0(0
.00)
(0.0
0)(0
.00)
(0.0
0)(0
.00)
(0.0
0)Fi
rm-si
ze−0
.004
∗∗∗
−0.0
04∗∗
∗−0
.005
∗−0
.004
∗∗∗
−0.0
04∗∗
∗−0
.004
∗∗∗
(0.0
0)(0
.00)
(0.0
0)(0
.00)
(0.0
0)(0
.00)
Cro
ss-se
lling
-pot
entia
l−0
.001
−0.0
02−0
.005
0.00
0−0
.001
0.00
0(0
.00)
(0.0
0)(0
.01)
(0.0
0)(0
.00)
(0.0
0)L
oan-
size
−0.0
01−0
.002
−0.0
060.
000
−0.0
01−0
.002
(0.0
0)(0
.00)
(0.0
0)(0
.00)
(0.0
0)(0
.00)
Mat
urity
0.00
3∗∗0.
002∗
0.00
2∗0.
003∗∗
0.00
3∗∗0.
003∗∗
(0.0
0)(0
.00)
(0.0
0)(0
.00)
(0.0
0)(0
.00)
Inte
rest
-spre
ad−0
.008
∗∗∗
−0.0
10∗∗
∗−0
.007
∗∗−0
.008
∗∗∗
−0.0
09∗∗
∗−0
.006
∗∗∗
(0.0
0)(0
.00)
(0.0
0)(0
.00)
(0.0
0)(0
.00)
Res
truc
turi
ng-p
urpo
se−0
.012
∗∗∗
−0.0
08∗
−0.0
02−0
.011
∗∗∗
−0.0
09∗∗
−0.0
08∗
(0.0
0)(0
.00)
(0.0
0)(0
.00)
(0.0
0)(0
.00)
Inst
itutio
nal
0.00
30.
009
0.00
40.
003
0.00
10.
005
(0.0
0)(0
.00)
(0.0
0)(0
.00)
(0.0
0)(0
.00)
Prio
r-rel
atio
nshi
p0.
000
0.00
0−0
.002
0.00
00.
000
−0.0
01(0
.02)
(0.0
0)(0
.00)
(0.0
2)(0
.00)
(0.0
0)
ρ−0
.08∗
−0.1
1∗∗−0
.13∗∗
––
–Pr
(F-s
tati
stic
/Wal
dX
2)
0.00
0.00
0.00
0.00
0.00
0.00
#of
loan
s6,
675
6,67
56,
675
6,67
56,
675
6,67
5
(Con
tinue
d)
24 ROBERT M. BUSHMAN AND REGINA WITTENBERG-MOERMAN
TA
BL
E4
—C
ontin
ued
Pan
elC
:Atr
eatm
ente
ffec
tsm
odel
offu
ture
cred
itra
ting
Trea
tmen
teff
ects
mod
elO
LS
Dep
ende
ntv
aria
ble
Cre
dit-r
atin
g t+1
Cre
dit-r
atin
g t+2
Cre
dit-r
atin
g t+3
Cre
dit-r
atin
g t+1
Cre
dit-r
atin
g t+2
Cre
dit-r
atin
g t+3
(1)
(2)
(3)
(4)
(5)
(6)
Rep
utat
ion
−1.3
44∗∗
∗−2
.059
∗∗∗
−2.4
65∗∗
∗−0
.472
∗∗−0
.643
∗∗∗
−0.8
29∗∗
∗
(0.2
7)(0
.28)
(0.6
6)(0
.20)
(0.2
2)(0
.26)
RO
A−1
.351
∗∗∗
−2.1
23∗∗
∗−2
.569
∗∗−1
.577
∗∗∗
−2.2
38∗∗
∗−2
.432
∗∗
(0.4
2)(0
.72)
(0.9
6)(0
.36)
(0.6
3)(0
.89)
Earn
ings
-per
sist
ence
-2−0
.096
∗−0
.138
−0.1
58−0
.097
∗−0
.141
∗−0
.160
(0.0
6)(0
.09)
(0.1
3)(0
.05)
(0.0
8)(0
.12)
Acc
rual
s-pos
-extr
eme
−0.0
68−0
.103
−0.0
95−0
.042
−0.0
65−0
.054
(0.0
9)(0
.11)
(0.1
4)(0
.08)
(0.1
0)(0
.13)
Los
s0.
062
−0.2
99−0
.538
0.13
6−0
.183
−0.4
18(0
.29)
(0.5
3)(0
.64)
(0.2
7)(0
.52)
(0.6
3)Ea
rnin
gs-v
olat
ility
1.48
3∗∗0.
782
0.83
01.
765∗∗
∗1.
534
1.58
6(0
.68)
(1.2
2)(1
.49)
(0.6
1)(0
.97)
(1.2
5)C
redi
t-rat
ing
0.77
8∗∗∗
0.69
4∗∗∗
0.64
9∗∗∗
0.79
4∗∗∗
0.70
4∗∗∗
0.65
9∗∗∗
(0.0
3)(0
.03)
(0.0
4)(0
.03)
(0.0
3)(0
.03)
Wat
ch-n
egat
ive
0.74
6∗∗∗
0.78
3∗∗∗
0.73
0∗∗∗
0.76
4∗∗∗
0.77
7∗∗∗
0.71
4∗∗∗
(0.1
0)(0
.11)
(0.1
5)(0
.10)
(0.1
2)(0
.15)
Wat
ch-p
ositi
ve−0
.736
∗∗∗
−0.8
67∗∗
∗−0
.712
∗−0
.749
∗∗∗
−0.8
57∗∗
∗−0
.707
∗
(0.1
3)(0
.22)
(0.4
0)(0
.13)
(0.2
2)(0
.40)
Out
look
-neg
ativ
e0.
329∗∗
∗0.
644∗∗
∗0.
767∗∗
∗0.
324∗∗
∗0.
640∗∗
∗0.
766∗∗
∗
(0.0
6)(0
.09)
(0.1
3)(0
.06)
(0.0
9)(0
.13)
Out
look
-pos
itive
−0.2
47∗∗
∗−0
.325
∗∗∗
−0.5
33∗∗
∗−0
.267
∗∗∗
−0.3
58∗∗
∗−0
.554
∗∗∗
(0.0
6)(0
.12)
(0.1
5)(0
.06)
(0.1
2)(0
.15)
Lev
erag
e0.
359∗∗
0.30
40.
522
0.39
3∗∗∗
0.35
10.
583∗
(0.1
7)(0
.26)
(0.3
4)(0
.16)
(0.2
4)(0
.30)
(Con
tinue
d)
ROLE OF BANK REPUTATION 25
TA
BL
E4
—C
ontin
ued
Pan
elC
:Atr
eatm
ente
ffec
tsm
odel
offu
ture
cred
itra
ting
Trea
tmen
teff
ects
mod
elO
LS
Dep
ende
ntv
aria
ble
Cre
dit-r
atin
g t+1
Cre
dit-r
atin
g t+2
Cre
dit-r
atin
g t+3
Cre
dit-r
atin
g t+1
Cre
dit-r
atin
g t+2
Cre
dit-r
atin
g t+3
(1)
(2)
(3)
(4)
(5)
(6)
Inte
rest
-cov
erag
e0.
001
0.00
10.
000
0.00
10.
000
0.00
0(0
.00)
(0.0
0)(0
.00)
(0.0
0)(0
.00)
(0.0
0)Fi
rm-si
ze0.
011
−0.0
14−0
.037
−0.0
47−0
.104
∗∗−0
.129
∗
(0.0
4)(0
.05)
(0.0
7)(0
.03)
(0.0
5)(0
.06)
Cro
ss-se
lling
-pot
entia
l−0
.013
−0.0
73−0
.106
−0.0
65−0
.143
−0.1
89(0
.06)
(0.1
0)(0
.14)
(0.0
5)(0
.09)
(0.1
3)L
oan-
size
−0.0
670.
089∗∗
0.09
9−0
.022
−0.0
49−0
.042
(0.0
4)(0
.04)
(0.0
7)(0
.02)
(0.0
4)(0
.05)
Mat
urity
0.02
80.
046
0.13
3∗∗0.
004
0.00
80.
093
(0.0
3)(0
.05)
(0.0
6)(0
.03)
(0.0
4)(0
.06)
Inte
rest
-spre
ad0.
512∗∗
∗0.
654∗∗
∗0.
715∗∗
∗0.
513∗∗
∗0.
656∗∗
∗0.
705∗∗
∗
(0.0
7)(0
.08)
(0.0
6)(0
.07)
(0.0
8)(0
.11)
Res
truc
turi
ng-p
urpo
se−0
.088
−0.1
60−0
.301
0.04
30.
041
−0.0
92(0
.08)
(0.1
3)(0
.17)
(0.0
7)(0
.11)
(0.1
5)In
stitu
tiona
l−0
.104
−0.1
35−0
.167
−0.1
06−0
.127
−0.2
03(0
.07)
(0.0
8)(0
.10)
(0.0
6)(0
.08)
(0.0
9)Pr
ior-r
elat
ions
hip
0.01
20.
030
0.03
40.
023
−0.0
32−0
.032
(0.0
4)(0
.07)
(0.1
0)(0
.04)
(0.0
6)(0
.09)
ρ0.
62∗∗
∗0.
65∗∗
∗0.
55∗∗
∗–
––
Pr(F
-sta
tist
ic/W
ald
X2)
0.00
0.00
0.00
0.00
0.00
0.00
#of
loan
s6,
675
6,67
56,
675
6,67
56,
675
6,67
5
Th
ista
ble
pres
ents
the
anal
ysis
ofa
firm
’spe
rfor
man
cefo
llow
ing
alo
an’s
issu
ance
.Pan
elA
pres
ents
the
desc
ript
ive
stat
isti
csof
afi
rm’s
profi
tabi
lity
and
cred
itra
tin
gs.C
olum
ns
(1)–
(3)
ofpa
nel
B(C
)pr
esen
tan
anal
ysis
ofa
firm
’spr
ofita
bilit
y(c
redi
trat
ing)
follo
win
ga
loan
’sis
suan
ce,w
her
eth
ere
port
edes
tim
ates
are
deri
ved
from
atr
eatm
ente
ffec
tmod
elth
atsi
mul
tan
eous
lyes
tim
ates
afi
rm’s
profi
tabi
lity
(cre
dit
rati
ng)
and
abo
rrow
er–l
ead
arra
nge
rm
atch
ing
mod
elby
max
imum
likel
ihoo
d.C
olum
ns
(4)–
(6)
ofpa
nel
B(C
)pr
esen
tan
OL
Ses
tim
atio
nof
afi
rm’s
profi
tabi
lity
(cre
dit
rati
ng)
.We
esti
mat
eea
chm
odel
wit
hye
aran
don
edi
git
indu
stry
fixe
def
fect
san
dcl
uste
rth
est
anda
rder
rors
atth
efi
rmle
vel.
Stan
dard
erro
rsar
ein
pare
nth
eses
.∗∗∗ ,
∗∗,a
nd
∗de
not
esi
gnifi
can
ceat
the
1%,5
%,a
nd
10%
leve
ls,r
espe
ctiv
ely.
Vari
able
sar
ede
fin
edin
appe
ndi
xA
.
26 ROBERT M. BUSHMAN AND REGINA WITTENBERG-MOERMAN
arrangers, representing 14.6 (16.3)% of the mean profitability of borrowerswith less reputable arrangers in the second (third) year following the yearof a loan’s issuance. 21
We find that past profitability is an important determinant of future per-formance.22 Consistent with the low persistence of extreme accruals, wefind negative and significant coefficient on Accruals-pos-extreme.23 We alsofind that smaller and more leveraged firms have higher future profitabilityand that longer maturity loans are associated with higher future profitabil-ity. The interest spread, which captures loan risk not captured by other con-trols, is negatively related to future profitability. There is also some evidencethat firms with restructuring purpose loans have lower future performance.Note also that ρ, the correlation between error terms in equations (5) and(6), is negative and significant in columns (1), (2), and (3), suggesting thatunobservable factors affect both borrower–lead arranger matching and aborrower’s future performance.
Columns (4), (5), and (6) reflect results from running the OLS speci-fications for comparison. The OLS results are qualitatively similar to theresults that control for arranger–borrower matching, with a positive, sig-nificant coefficient on the reputation dummy for a borrower’s profitabilityin the first, second, and third year following the year of a loan’s issuance.However, the economic significance is reduced relative to the matchingspecification, illustrating the importance of controlling for endogeneity ofarranger-borrower matching.
Finally, table 4, panel C, reports the estimation of equation (6) with Fu-turePerformance measured as a borrower’s credit ratings.24 We find that bor-rowers with reputable arrangers have significantly better (i.e., lower) creditratings following a loan’s issuance. The difference in credit ratings acrossborrowers of reputable and less reputable arrangers is 1.3, 2.1, and 2.5notches in the first, second and third year following the year of a loan’sissuance, respectively (columns 1–3). Past profitability is negatively and
21 We also estimate the treatment effect models where the dependent variable is defined asan indicator variable that reflects whether a borrower experiences a decrease in profitabilityfollowing a loan’s issuance. We find that, relative to lower reputation leads, reputable arrangersare associated with lower probabilities of a decrease in future profitability of 9%, 21%, and23% in the first, second, and third year following the year of the loan’s issuance, respectively.
22 In an untabulated analysis, we augment the future performance regressions with theinteraction terms between ROA and earnings persistence measures and find that our mainfindings are unchanged.
23 In an untabulated robustness test, we include in the borrower–arranger matching andfuture performance regressions an alternative extreme accruals measure that reflects both ex-treme positive and extreme negative accruals. We find that the effect of this measure on futureprofitability is less statistically and economically significant relative to the effect of Accruals-pos-extreme. Other results and inferences remain unchanged.
24 Because credit rating is a categorical variable, we also estimate the credit rating modelby the ordered logit regression. The results are similar to the OLS estimation. The results arealso robust when we incorporate rating fixed effects instead of the Credit-rating variable as thecontrol.
ROLE OF BANK REPUTATION 27
significantly related to future credit ratings, confirming our prediction thata borrower’s profitability prior to a loan issuance predicts its future creditquality. There is some evidence that firms with more persistent histori-cal earnings experience stronger future performance one year followinga loan’s issuance. Past earnings volatility also affects borrower credit qual-ity over this period: higher volatility is associated with lower credit quality.Credit-rating at the time of a loan’s issuance is a strong determinant of fu-ture credit ratings, and Watch-negative and Outlook-negative (Watch-positiveand Outlook-positive) are positively (negatively) related to future credit rat-ings. There is also evidence that more leveraged firms experience higher fu-ture ratings following a loan’s issuance. Interest-spread is positively and signif-icantly associated with future credit ratings, likely capturing credit risk notreflected in other control variables. ρ is highly significant in all three mod-els. We rerun the analysis with an OLS specification (columns 4–6) and thecoefficients on Reputation remain significant but are smaller in magnitude.
Overall, our findings suggest that reputable arrangers certify borrowers’future profitability and credit ratings at the time of loan initiation.
5.3 REPUTATION AND FUTURE PERFORMANCE IMPLICATIONS OFBORROWERS’ ACCOUNTING EARNINGS
To investigate whether quality certification extends to a borrower’s re-ported accounting numbers, we estimate endogenous switching regres-sions. We estimate a separate performance mapping for each reputationpartition. In tables 5 and 6, we report results from estimating two equa-tions:
FuturePerformancehigh repi = β
high rep1 Firm Controls + β
high rep2 Loan Controls
+μhigh repi (7)
FuturePerformancelow repi = β
lowrep1 Firm Controls + β
low rep2 Loan Controls + μ
low repi .
(8)
Again, FuturePerformance is measured as either a borrower’s profitabilityor credit rating, and the controls are identical to those in equation (6).
Table 5, panel A, represents FuturePerformance as future profitability. Wefind that the coefficients on Profitability of 0.691 for reputable banks in col-umn (1) and 0.402 for less reputable banks in column (2) are significantlydifferent at the 1% level (p-value < 0.000). That is, the profitability of bor-rowers with reputable banks is relatively more persistent. The difference incoefficients implies that a one standard deviation increase in a borrower’spast profitability increases ROAt+1 by 2.6 percentage points higher for bor-rowers of reputable arrangers than for those of less reputable arrangers.This difference represents 21% of the profitability of borrowers of less rep-utable arrangers in the year following a loan issuance. The difference in thecoefficients on Profitability in the second and third year following a loan is-suance is also statistically (p-value < 0.000 in both years) and economically
28 ROBERT M. BUSHMAN AND REGINA WITTENBERG-MOERMAN
T A B L E 5Borrower Future Profitability Across Reputable and Less Reputable Arrangers
Panel A: An endogenous switching model of future profitabilityDependent variable ROAt +1 ROAt +2 ROAt +3
Less Less LessReputable reputable Reputable reputable Reputable reputablearranger arranger arranger arranger arranger arranger
Panel B: Predicted profitabilityReputable Less reputablearranger arranger Difference
ROAt +1 0.129 0.120 0.009∗∗∗
ROAt +2 0.130 0.117 0.013∗∗∗
ROAt +3 0.131 0.116 0.016∗∗∗
This table presents the analysis of a firm’s profitability following a loan’s issuance across reputable and less reputablearrangers. Panel A presents an analysis of a firm’s profitability following a loan’s issuance, where the reported estimatesare derived from an endogenous switching model that simultaneously estimates a firm’s profitability and a borrower–leadarranger matching model by maximum likelihood. We estimate each model with year and one-digit industry fixed effects andcluster the standard errors at the firm level. Standard errors are in parentheses. Panel B presents predicted profitability basedon an endogenous switching model. To calculate the predicted profitability, we use the firm’s actual profitability under theregime that the firm actually belongs to (reputable arranger or less reputable arranger) and use the estimated coefficientsfrom panel A to calculate the fitted profitability in the counterfactual regime. ∗∗∗ , ∗∗ , and ∗ denote significance at the 1%,5%, and 10% levels, respectively. Variables are defined in appendix A.
ROLE OF BANK REPUTATION 29
T A B L E 6Borrower Future Credit Rating Across Reputable and Less Reputable Arrangers
Panel A: An endogenous switching model of future credit ratingDependent variable Credit-ratingt +1 Credit-ratingt +2 Credit-ratingt +3
Less Less LessReputable reputable Reputable reputable Reputable reputablearranger arranger arranger arranger arranger arranger
This table presents the analysis of a firm’s credit rating following a loan’s issuance across reputable and less reputablearrangers. Panel A presents an analysis of a firm’s credit rating following a loan’s issuance, where the reported estimatesare derived from an endogenous switching model that simultaneously estimates a firm’s credit rating and a borrower–leadarranger matching model by maximum likelihood. We estimate each model with year and one-digit industry fixed effects andcluster the standard errors at the firm level. Standard errors are in parentheses. Panel B presents the predicted credit ratingbased on an endogenous switching model. To calculate the predicted credit rating, we use the firm’s actual credit ratingunder the regime that the firm actually belongs to (reputable arranger or less reputable arranger) and use the estimatedcoefficients from panel A to calculate the fitted credit rating in the counterfactual regime. ∗∗∗ , ∗∗ , and ∗ denote significanceat the 1%, 5%, and 10% levels, respectively. Variables are defined in appendix A.
30 ROBERT M. BUSHMAN AND REGINA WITTENBERG-MOERMAN
significant. A one standard deviation increase in past profitability increasesROAt+2 (ROAt+3) by 2.6 (2.5) percentage points higher for the borrowersof reputable arrangers than for borrowers of less reputable arrangers, rep-resenting 20.9 (20.6)% of the profitability of borrowers of less reputablearrangers in the second and third year following a loan issuance, respec-tively.
Panel B of table 5 estimates the treatment effect of arranger reputationon borrower profitability. For the reputable arranger regime, we estimatethe predicted profitability by using the actual profitability of the borrow-ers of reputable arrangers and the fitted profitability of the borrowers ofless reputable arrangers, estimated based on the coefficient estimated forhigh-reputation borrowers in the switching model. For the less reputablearranger regime, the predicted profitability is estimated analogously. Con-sistent with table 4, panel B, we find that borrowers of reputable arrangersexhibit a significantly higher profitability following a loan’s issuance, rela-tive to borrowers of less reputable arrangers, with the difference in prof-itability ranging from 0.009 in the first year following a loan’s issuance to0.016 in the third year following the year of a loan’s issuance.25
Turning to credit ratings, table 6, panel A, shows that profitability is amuch stronger predictor of a borrower’s credit ratings following a loan’s is-suance for reputable, relative to less reputable, arrangers. The difference inthe coefficients on Profitability, −2.022 for reputable banks in column (1)and −0.776 for less reputable banks in column (2), is significantly differ-ent from zero (p-value < 0.000) and implies that a one standard deviationincrease in profitability improves Credit-ratingt+1 by 0.1 of a notch higherfor borrowers of reputable arrangers than for borrowers of less reputablearrangers. The differences in the coefficients on Profitability in the secondand third year following a loan issuance are also statistically (p-value < 0.000in both years) and economically significant. For these years, a one standarddeviation increase in profitability improves the future credit rating by 0.2of a notch higher for reputable arrangers’ borrowers. These results suggestthat the “harder” profitability of borrowers of reputable arrangers translatesinto higher credit quality following a loan’s issuance.
Finally, in table 6, panel B, we estimate a treatment effect of arranger rep-utation on a borrower’s credit quality. For the reputable arranger regime,we estimate the predicted credit rating by using the actual credit ratingsof the borrowers of reputable arrangers and the fitted credit ratings of theborrowers of less reputable arrangers; the predicted credit ratings are es-timated analogously for the less reputable arranger regime. The averagetreatment effect is statistically and economically significant; it represents
25 The endogenous switching model also allows us to separately estimate the average treat-ment effect on the treated (borrowers of reputable arrangers) and the average treatment ef-fect on the untreated (borrowers of less reputable arrangers). The average treatment effect onthe treated (untreated) is 0.012 (0.002), 0.016 (0.005), and 0.019 (0.06) in the first, second,and third year following the year of a loan’s issuance, respectively.
ROLE OF BANK REPUTATION 31
1.61 notches in the year following the year of a loan’s issuance and then in-creases to 1.89 and 2.14 notches in the second and third year, respectively.26
Overall, the results in this section are consistent with reputation certifi-cation being associated with enhanced long-run sustainability of earningsvia higher earnings persistence, and an enhanced debt contracting valueof accounting via a stronger connection between pre-loan profitability andfuture credit ratings.
5.4 CERTIFICATION OF EARNINGS: BETTER FUNDAMENTALS OR HIGHERACCRUALS QUALITY?
In this section, we examine whether the higher earnings quality docu-mented for borrowers with high-reputation lead banks is a consequenceof better fundamentals, higher accrual quality, or both. We follow Minnis[2011] and examine the relative ability of earnings components, cash flowfrom operations (CFO) and Accruals, to predict future cash flows across bor-rowers with high- and lower reputation lead banks. We focus on the mag-nitudes of the estimated coefficients (table 7, panel A) and the R2 (table7, panel B) from the regression of one-year-ahead cash flow from opera-tions (CFOi,t+1) on combinations of cash flow from operations (CFOi,t) andAccrualsi,t (see appendix A for detailed definitions of these variables).
In table 7, panel A, we use an endogenous switching regression frame-work to estimate a separate future cash mapping for each reputation parti-tion. We estimate the following equations simultaneously with the matchingmodel between borrowers and banks (equation 5):
CFOhigh rept+1 = β
high repC CFOt + β
high repA Accrualst + μ
high repi , and (9)
CFOlow rept+1 = β
low repC CFOt + β
low repA Accrualst + μ
low repi . (10)
Table 7, panel A, reports that the magnitudes of the coefficients onCFOi,t and Accrualsi,t are significantly higher for borrowers of reputablebanks. That is, borrowers using high-reputation banks exhibit both rela-tively stronger fundamentals as captured by higher cash flow persistenceand significantly greater accrual quality, with the accruals of borrowers inthe high reputation group more strongly related to future cash flows thanthe accruals of borrowers in the low reputation group. Note that the coef-ficients on CFOi,t and Accrualsi,t across reputation groups are significantlydifferent, with p-values of 0.001 and 0.000, respectively.
In table 7, panel B, we use R2 to examine the relative ability of earningscomponents to predict future cash flows across borrowers of reputable andless reputable arrangers. The calculation of R2 uses the two-step version of
26 The average treatment effect on the treated (borrowers of reputable arrangers) is 1.91,2.19, and 2.45 notches in the first, second, and third year following the year of a loans is-suance, while the average treatment effect on the untreated is 0.90, 1.20, and 1.39 notches,respectively.
32 ROBERT M. BUSHMAN AND REGINA WITTENBERG-MOERMAN
T A B L E 7The Future Performance Implications of a Borrower’s Accounting Numbers
Panel A: An endogenous switching modelDependent variable Reputable Less reputableCFOt +1 arranger arranger Difference
This table presents the analysis of the future performance implications of a firm’s profitability. PanelA presents the results from regressing cash flow from operations in the year following the year of a loan’sissuance on cash flow from operations and accruals in the year of a loan’s issuance. The reported estimatesare derived from an endogenous switching model that simultaneously estimates a firm’s cash flow fromoperations in the year following the year of a loan’s issuance and a borrower–lead arranger matching modelby maximum likelihood. We estimate each model with year and one-digit industry fixed effects and clusterthe standard errors at the firm level. Standard errors are in parentheses. ∗∗∗ and ∗ denote significance atthe 1% and 10% levels, respectively. Panel B presents the R2 from a two-stage model, where we estimate theInverse Mills ratio in the first stage and regress cash flow from operations in the year following the year of aloan’s issuance on cash flow from operations and accruals in the year of a loan’s issuance and Inverse Millsratio. We calculate the statistical significance of the difference in the R2 with the bootstrapping technique.The coefficient estimates from this regression are suppressed for brevity, but are similar to those presentedin panel A.
the endogenous switching model (see footnote 10). We first estimate equa-tion (5) to derive the inverse Mills ratio (IMR) and include it in equations(9) and (10) to account for selection issues. This results in the followingequations:
CFOhigh rept+1 = β
high repC CFOt + β
high repA Accrualst + β
high repIMR IMRhigh rep
t
+μhigh repi , and (11)
CFOlow rept+1 = β
low repC CFOt + β
low repA Accrualst + β
low repIMR IMRlow rep
t + μlow repi .
(12)
We estimate equations (11) and (12) by OLS separately for each regime,where the difference in the R2 for this regression across the two regimes isthe statistic of interest. We also rerun (11) and (12) dropping Accrualsi,t , inorder to compute the relative incremental contribution of this variable inexplaining future cash flows across reputation partitions. To test the statis-tical significance of the difference in R2, we use a bootstrapping procedureas in Minnis [2011] (see appendix B for a description).
ROLE OF BANK REPUTATION 33
In table 7, panel B, we see in row 1 that contemporaneous CFOi,t andAccrualsi,t have significantly more explanatory power for the future cashflows of borrowers of high-reputation banks relative to those of lower repu-tation banks. The difference in R2 between partitions is 9.4% and is statisti-cally significant (p-value = 0.000). Finally, we find that accruals significantlyimprove the predictive ability for both high and low reputation partitions,but that the incremental improvement for firms with high-reputation banksis significantly higher by 2.65% (p-value = 0.001). The evidence in panelsA and B of table 7 indicates that borrowers using high-reputation banksexhibit relatively stronger fundamentals, as captured by higher cash flowpersistence, and also exhibit significantly greater accruals quality. The ac-cruals of borrowers in the high reputation group are more strongly relatedto future cash flows than they are in the low reputation group.
We verify that the more persistent earnings of reputable arrangers donot contradict lenders’ preference for conservative reporting. Prior litera-ture provides evidence that lenders demand borrowers to report conserva-tively (e.g., Watts and Zimmerman [1986], Ball [2001], Watts [2003], Zhang[2008], Ball, Bushman, and Vasvari [2008], Wittenberg-Moerman [2008]).However, with respect to earnings persistence, if accruals reflect economiclosses in financial statements in a timelier manner, their predictive powerfor future cash flow may be diminished. On the other hand, it is intuitivethat lenders value the persistence of a borrower’s performance and stronglyprefer that its profitability not weaken following loan origination. We verifythat there is no conflict between the demand for conservatism and the de-mand for persistence by estimating a piecewise-linear model of accruals oncash flows (Ball and Shivakumar [2005]) for both the reputable arrangerand less reputable arranger partitions. We find that borrowers of reputablearrangers report marginally more conservatively, compared to borrowers ofless reputable arrangers (untabulated).
6. Robustness Tests
6.1 ALTERNATIVE MEASURES OF CREDIT QUALITY
We employ two alternative measures of the change in a borrower’s creditrating. First, in untabulated analysis, we estimate the treatment effect mod-els in table 4 where the dependent variable is defined as an indicator vari-able that reflects whether a borrower experiences deterioration in creditrating following a loan’s issuance. We find that having a reputable arrangerdecreases the probability of a deterioration in credit quality by, respectively,12%, 18%, and 25% in the first, second, and third year following the year ofthe loan’s issuance. Second, we estimate the treatment effect models wherethe dependent variable is measured by the change in a borrower’s creditrating in the first, second, and third year following the year of the loan’sissuance relative to the credit rating at a loan’s origination. Our results andinferences with respect to the effect of the lead’s bank reputation on a bor-rower’s future credit quality remain unchanged (untabulated).
34 ROBERT M. BUSHMAN AND REGINA WITTENBERG-MOERMAN
In addition, credit ratings may reflect changes in a borrower’s credit-worthiness with some delay, because credit rating agencies care about rat-ings stability (Beaver, Shakespeare, and Soliman [2006], De Franco, Vas-vari, and Wittenberg-Moerman [2009]). Therefore, as a robustness analysis,we measure credit quality with credit default swap (CDS) spreads, knownto efficiently reflect new information (Hull, Predescu, and White [2004],Longstaff, Mithal, and Neis [2004], Blanco, Brennan, and Marsh [2005]).The sample size for the CDS analysis is small relative to the credit ratingsanalysis in tables 4 and 6, as not all firms have traded CDS contracts. FutureCDS spreads are measured as the average spread on the firm’s five-year ma-turity CDS contract (MR clause) during the first, second, and third yearfollowing the year of a loan’s issuance. We control for the CDS spread atthe time of a loan’s initiation using the average spread over the 30 daysprior to the loan issuance on a firm’s five-year maturity CDS contract. Allspreads are measured in percentage terms.
In table 8, we show that CDS spreads tell the same story as the creditrating analysis. Panel A of this table reveals that borrowers of reputablearrangers are traded at significantly lower credit spreads following a loanissuance (lower spreads indicate lower credit risk). This result holds aftercontrolling for observable and unobservable determinants (via the match-ing estimation) of future credit quality (table 8, panel B). The CDS spreadsfor borrowers with reputable arrangers are lower than those for less rep-utable arrangers by 32, 34, and 38 basis points for one, two, and three yearsfollowing the year of a loan’s issuance, respectively. This difference rep-resents 18.5%, 19.5%, and 21.1% of the CDS spread of the borrowers ofnonreputable arrangers in the respective years.
Table 8, panel C, finds that the mapping between pre-loan profitabil-ity and future CDS spreads is significantly higher for the high reputationgroup relative to the less reputable group (the difference in coefficientsis statistically significant at the 1% level). Economically, the difference incoefficients implies that a one standard deviation increase in a borrower’spast profitability decreases CDSt+1, CDSt+2 and CDSt+3 by 14 basis pointsmore for borrowers of reputable arrangers than for borrowers of less rep-utable arrangers. This difference represents 7.9%, 8.0%, and 7.9% of theCDS spread of borrowers of less reputable arrangers in the first, second,and third year following the year of a loan’s issuance, respectively. The re-sults reported in panel D confirm that borrowers of reputable arrangers aretraded at significantly lower credit spreads following a loan issuance.
6.2 LEAD BANK’S SKIN IN THE GAME
The fraction of syndicated loans retained by the lead bank is the primarysource of formal contractual incentives to screen and monitor. It is possi-ble that omitting the fraction retained from the performance regressionsmay bias the coefficient on Reputation. In particular, if more reputable ar-rangers retain a higher fraction, the effect of reputation on the borrowerperformance that we document may be driven by the lead bank’s skin inthe game. However, existing evidence suggests that the fraction retained
ROLE OF BANK REPUTATION 35
T A B L E 8Borrower Credit Quality, as Estimated by CDS Spread, Following a Loan Issuance
Panel A: Descriptive statisticsReputable Less reputable
and reputation are substitute mechanisms, where higher reputation leadbanks hold significantly less skin in the game (Sufi [2007], Lin and Par-avisini [2011], and Gopalan, Nanda, and Yerramilli [2011]). In our sample,reputable arrangers hold on average 16.38% of a loan, while less reputablearrangers hold on average 26.17% (the difference is significant at the 1%
ROLE OF BANK REPUTATION 37
T A B L E 8 — Continued
Panel D: Predicted CDS spreadReputable arranger Less reputable arranger Difference
CDS-spreadt +1 1.45 1.79 −0.34∗∗∗
CDS-spreadt +2 1.46 1.82 −0.35∗∗∗
CDS-spreadt +3 1.48 1.88 −0.40∗∗∗
This table presents the analysis of a firm’s CDS spread following a loan’s issuance. Panel A presentsdescriptive statistics for a firm’s CDS spread. Panel B presents an analysis of a firm’s CDS spread following aloan’s issuance, where the reported estimates are derived from a treatment effect model that simultaneouslyestimates a firm’s CDS spread and the borrower–lead arranger matching model by maximum likelihood.Panel C presents an analysis of a firm’s CDS spread following a loan’s issuance, where the reported estimatesare derived from an endogenous switching model that simultaneously estimates a firm’s CDS spread anda borrower–lead arranger matching model by maximum likelihood. We estimate each model with yearand one-digit industry fixed effects and cluster the standard errors at the firm level. Standard errors arein parentheses. Panel D presents predicted CDS spread based on an endogenous switching model. Tocalculate the predicted CDS spread, we use the firm’s actual CDS spread under the regime that the firmactually belongs to (reputable arranger or less reputable arranger) and use the estimated coefficients frompanel C to calculate the fitted CDS spread in the counterfactual regime. ∗∗∗, ∗∗, and ∗ denote significanceat the 1%, 5%, and 10% levels, respectively. Variables are defined in appendix A.
level). Further, it is crucial to take into account that a lead bank’s reputa-tion is already determined at the time of a loan’s origination, and so thesubstitutability between reputation and skin in the game implies that thechoice of skin in the game is actually a function of reputation (Sufi [2007],Lin and Paravisini [2011], Gopalan, Nanda, and Yerramilli [2011]).This ev-idence significantly mitigates the concern that the effect of reputation isattributed to the fraction retained by the lead bank.
There are also significant data issues that deter the incorporation of skinin the game into the empirical tests. First, the Dealscan coverage of thefraction retained by the lead bank is very sparse; we have this informationavailable only for 30.2% of our observations (2,018 loans).27 Second, asargued by Ivashina [2009], the observed fraction of the loan retained cap-tures the equilibrium trade-off between mitigating agency problems andincreasing the credit risk exposure of the lead bank, thus confounding thestatistical relationship between the fraction retained by the lead and futureperformance (Mora [2010]). While it is possible to instrument for skin inthe game following Ivashina [2009], we immediately lose 69.8% of our ob-servations.
While directly examining skin in the game is not a viable empirical op-tion, we attempt to approach this issue by building on Lin and Paravisini[2011], who show that the lead banks of loans to firms where fraud is dis-covered increase the fraction they retain when they arrange loans followingthe fraud discovery. Therefore, controlling for whether the lead arrangeris identified with recent frauds of its borrowers potentially captures the in-cremental skin in the game that the lead arranger is forced to retain. Thisincremental skin in the game reflects the incremental demand for a lead
27 We also examined a large number of loan contracts and verified that, in the vast majorityof cases when the fraction retained by the lead is missing on Dealscan, it is also not reportedin the contract.
38 ROBERT M. BUSHMAN AND REGINA WITTENBERG-MOERMAN
bank’s incentives to screen and monitor after considering incentives cre-ated by its reputation.
We identify firms involved in corporate fraud based on Dyck, Morse, andZingales [2010] and construct an indicator variable, Fraud, taking the valueof one if, over the two-year period preceding a loan issuance, the loan’s leadarranger served as a lead arranger to a firm involved in a corporate fraud.28
In untabulated analysis, we re-estimate the treatment effect models of fu-ture performance when adding Fraud to the set of explanatory variables.We find that the coefficient on Fraud, which captures the incremental skinin the game, is negative and significant at the 10% level one year followingthe year of loan origination, providing weak evidence that the profitabilityof borrowers whose lead arrangers are associated with borrowers involved infraud is marginally weaker shortly after loan origination. However, for bothfuture profitability and credit ratings regressions, the coefficients on Repu-tation remain similar to those reported in table 4. We also re-estimated theendogenous switching model and find that controlling for Fraud does notaffect our inferences. These findings support our proposition that the ef-fect of a lead bank’s reputation on a borrower’s future performance shouldnot be subsumed by the effect of the skin in the game.
6.3 ALTERNATIVE APPROACHES TO ENDOGENEITY
While our main analysis employs a self-selection framework embeddinginstruments based on geography, the literature cautions that limitations inavailable instruments necessitate a careful robustness analysis (e.g., Francisand Lennox [2008], Larcker and Rusticus [2009]). In this spirit, we alter-natively employ a propensity score matching framework. A propensity scoreanalysis explicitly assumes away any role for unobservable factors in creat-ing selection bias (Rosenbaum and Rubin [1983]). Computing propensityscores as the predicted probability of choosing a high-reputation lead fromequation (5), we match each loan with a high-reputation lead to a controlloan with the closest propensity score match and a low-reputation lead. Weselect matching firms with replacement as we have more borrowers withreputable arrangers than with less reputable arrangers (control firms).
In an untabulated propensity matching analysis, we find that, in the first,second, and third year following the year of a loan issuance, borrowers ofreputable arrangers have, respectively, an ROA that is 0.5, 0.6, and 0.6 per-centage points higher than that of borrowers with nonreputable arrangers.With respect to credit ratings, we find that the differences in credit ratingsacross borrowers of reputable and less reputable arrangers are 0.34, 0.67,and 0.72 notches in the first, second, and third year following the year ofa loan’s issuance, respectively. The differences in profitability and creditratings are statistically significant at the 5% level.
28 Lin and Paravisini [2011] suggest that the effect of fraud on the lead arranger’s share insubsequent loans lasts for two years following the fraud discovery.
ROLE OF BANK REPUTATION 39
We also estimate future performance regressions including firm fixed ef-fects to control for unobservable firm characteristics that are constant overtime and correlated with the high reputation indicator variable. In untab-ulated analyses, we repeat the tests presented in columns (4)–(6) of panelsB and C of table 4 for 974 borrowers that have at least two syndicated loandeals over the sample period and include firm fixed effects in the prof-itability and credit quality models. We find that the borrowers of reputablearrangers experience an ROA that is 0.5, 0.7, and 0.9 percentage pointshigher than the ROA of borrowers with nonreputable arrangers. Borrowersof reputable arrangers also have credit ratings that are, respectively, 0.45,0.69, and 0.97 notches lower in the first, second, and third year followingthe year of a loan’s issuance. These differences in profitability and creditratings between borrowers of reputable and less reputable arrangers arestatistically significant at the 5% level.
While the results using the propensity score matching and firmfixed effects are less economically significant than results from thearranger–borrower matching approach, they suggest that our matching ap-proach findings are unlikely to be driven by weak instruments.
6.4 ADDITIONAL ROBUSTNESS TESTS
We made a number of modifications to the main specification used intables 4–7 (untabulated). First, we examine whether controlling for theauditor’s reputation affects our results. We find that 98% of the observa-tions in our sample are related to firms audited by the Big 5/4 auditorsand therefore our findings cannot be attributed to the auditor’s reputa-tion. Our results are also robust to controlling for auditor changes in theyear of a loan’s origination. Second, our findings are robust to controllingfor the number of financial covenants in the loan contract. The results alsodo not change when we use an alternative measure of loan size, estimatedas a loan’s amount relative to the borrower’s total assets. Third, becauseof the considerable difference in firm size between borrowers of reputableand less reputable arrangers, we exclude borrowers of reputable arrangerswith a firm size in the upper quartile. Results are robust to this restriction.Last, we verify that all findings are robust to additional industry controls.Because the maximum likelihood estimation of the switching model doesnot converge when we include a high number of industry fixed effects, ourmain specifications includes one-digit industry fixed effects. We repeat allthe tests within a two-stage model specification (see footnote 10) incorpo-rating Fama-French industry dummies and the results are unchanged. Wealso re-estimate all specifications dropping one Fama-French industry at atime. No industry has undue influence on our findings.29
29 Utilities, Retail, and Telecommunication represent the three most common industries,and contain 14.35%, 6.5%, and 6.45% of sample loans, respectively. Business services, Energy,and Chemical are industries that have the next highest concentration of sample loans. Theindustry composition is similar for borrowers of reputable and of less reputable arrangers.
40 ROBERT M. BUSHMAN AND REGINA WITTENBERG-MOERMAN
We next relax the restriction that a borrower must have a credit rating,increasing our sample size to 9,857 observations (see table 1). In untabu-lated tests, we find that all results and inferences with respect to the effectof reputation on borrower future profitability hold in this enlarged sample.Further, we alter the definition of reputation. First, in untabulated analy-sis we redefine a bank as reputable if its market share in the year prior tothe year of a loan issuance is above 2% (our primary definition is basedon a bank’s average market share over the sample period). The results aresimilar to those presented in tables 4–7. Second, we also use the dominantbank measure employed by Ross [2010], which classifies J.P. Morgan Chase,Bank of America, and Citigroup as reputable arrangers. All results replicateusing the dominant bank classification (untabulated).
Finally, we consider whether syndicated loans are traded following theirorigination. The extent to which loan sales impact lenders’ incentivesto screen and monitor borrowers remains an open question. Pennacchi[1988] and Gorton and Pennacchi [1995] suggest that, after a loan or someportion of a loan is sold on the secondary market, the lender is less moti-vated to continue the loan’s monitoring. Berndt and Gupta [2009] docu-ment that the stock returns of borrowers whose syndicated loans are soldin the secondary market significantly underperform those of other borrow-ers, implying poor screening and monitoring by the lead bank. However,Drucker and Puri [2009] document that, at loan origination, lenders an-ticipate that a given loan will ultimately be sold in the secondary marketand include more restrictive covenants in the traded loans’ contract, rela-tive to the contracts of loans not anticipated to be sold, facilitating ex postmonitoring. And 1,217 of our sample loans are traded on the secondaryloan market after origination, while others are nontraded. In untabulatedrobustness tests, we re-estimate all models for traded and nontraded loansand find that our results are robust for both partitions.
7. Conclusion
Financial accounting information represents a fundamental firm-specificinformation set that supports public securities markets and debt contract-ing arrangements. However, the value of accounting information dependscrucially on its perceived credibility by market participants. A vast literaturein accounting, economics, and law focuses on mechanisms that ensure thetruthful reporting of information. Mechanisms posited to support truthfulreporting include penalties for misreporting dictated by securities law andrequirements that firms engage outside auditors to certify that accountingreports are in compliance with existing standards. In this paper, we take anovel approach to the issue of accounting credibility by examining the roleplayed by the reputation of lead arrangers of syndicated loans in certifyingthe quality of borrowers’ reported accounting numbers.
We find that higher lead arranger reputation is associated with higherprofitability and credit quality in the three years subsequent to loan
ROLE OF BANK REPUTATION 41
initiation. We also find that the quality certification supplied by reputationextends to the quality of a borrower’s accounting numbers. We show thatearnings persistence is significantly higher for borrowers of high-reputationbanks relative to borrowers of lower reputation banks, suggesting that bor-rower profitability reported at the time of loan origination is more sustain-able for high-reputation banks. We also show that borrowers with high-reputation lead arrangers exhibit an enhanced debt contracting value ofaccounting, as indicated by a stronger connection between pre-loan prof-itability and future credit quality. Further, we document that the higherearnings sustainability associated with higher reputation lead banks reflectsboth a borrower’s superior fundamentals, as captured by higher cash flowpersistence, and accruals more closely linked to future cash flows.
A potential limitation of our analyses is the possibility that we have notfully controlled for all alternative explanations. However, our results arerobust to controlling for borrowers’ past performance and an extensiverange of borrower characteristics, such as historical earnings persistenceand volatility. While we cannot perfectly control for expectations of futurefee business, by controlling for a borrower’s past equity and bond issuanceactivity, we address the possibility that high-reputation lead banks chooseborrowers to whom they can cross-sell services in the future. In addition, weaddress concerns that the effect of reputation on borrower performance isdriven by the lead’s skin in the game, noting that the predetermined na-ture of reputation together with the documented inverse relation betweenreputation and skin in the game imply that reputation determines skin inthe game. We also control for whether the lead arranger is identified withthe recent frauds of its borrowers to capture the incremental skin in thegame that a lead arranger retains post fraud. Further, our results are robustto alternative approaches for controlling for endogeneity between the like-lihood of a borrower dealing with a high-reputation bank and a borrower’sfuture performance.
Our study contributes to the vast literature on the credibility of account-ing reporting by documenting that a lead bank’s reputation plays a distinctrole in certifying the quality of a borrower’s accounting numbers. Our ev-idence that higher reputation is associated with a borrower’s superior eco-nomic performance and accounting quality following a loan issuance alsoextends recent papers on the role of bank reputation in the loan market(Ross [2010], Lin and Paravisini [2011], Gopalan, Nanda, and Yerramilli[2011]). Finally, we add to the debt contracting literature by showing thatbank reputation enhanced the debt contracting value of accounting num-bers, via a stronger connection between pre-loan profitability and futurecredit quality. These findings directly respond to the call in Armstrong,Guay, and Weber [2010] to investigate whether accounting quality can rea-sonably predict future credit quality and its changes.
42 ROBERT M. BUSHMAN AND REGINA WITTENBERG-MOERMAN
A P P E N D I X AVariable Definitions
Variables Description
Accruals Accruals are estimated as the difference between the incomebefore extraordinary items and discontinued operations andnet cash flow from operating activities (both from thestatement of cash flow), deflated by total assets. For table 7,accruals are estimated in the year of a loan’s issuance.
Accruals-pos-extreme An indicator variable taking the value of one if a borrower’saccruals in the year prior to the year of a loan’s issuance are inthe top decile of the sample’s accruals distribution, zerootherwise.
CDS-depth The number of dealers providing the CDS spread quotes toMarkit. For the estimation of CDS-spreadt +1, we estimate theaverage CDS depth during the year following the year of aloan’s issuance. For the estimation of CDS-spreadt +2, we estimatethe average CDS depth during the second year following theyear of a loan’s issuance. For the estimation of CDS-spreadt +3, weestimate the average CDS depth during the third yearfollowing the year of a loan’s issuance.
CDS-spread The spread on a firm’s five-year maturity CDS contract (MRclause) at the time of a loan’s issuance. The spread is estimatedas the average spread over the 30 days prior to the loanissuance and is measured in percent.
CDS-spreadt +1 The average spread on a firm’s five-year maturity CDS contract(MR clause) during the year following the year of a loan’sissuance. The spread is measured in percent.
CDS-spreadt +2 The average spread on a firm’s five-year maturity CDS contract(MR clause) during the second year following the year of aloan’s issuance. The spread is measured in percent.
CDS-spreadt +3 The average spread on a firm’s five-year maturity CDS contract(MR clause) during the third year following the year of a loan’sissuance. The spread is measured in percent.
CFOt Net cash flow from operating activities in the year of a loan’sissuance, deflated by total assets.
CFOt +1 Net cash flow from operating activities in the year following theyear of a loan’s issuance, deflated by total assets.
Credit-rating The numerical equivalent of the senior debt rating at the time ofa loan’s issuance. It is set as equal to one if the S&P senior debtrating is AAA, through 25 when the S&P senior debt rating isD. For firms not rated by S&P, we assign the Moody’s seniordebt rating, converted to an equivalent S&P rating. For firmsnot rated by S&P or Moody’s, we assign the Fitch or DPR seniordebt rating, converted to an equivalent S&P rating.
Credit-ratingt +1 The numerical equivalent of the average senior debt ratingduring the year following the year of a loan’s issuance.
Credit-ratingt +2 The numerical equivalent of the average senior debt ratingduring the second year following the year of a loan’s issuance.
Credit-ratingt +3 The numerical equivalent of the average senior debt ratingduring the third year following the year of a loan’s issuance.
(Continued)
ROLE OF BANK REPUTATION 43
Variables Description
Cross-selling-potential An indicator variable taking the value of one if a borrower’scross-selling potential is above the sample median, zero otherwise.We estimate cross-selling potential by the borrower’s total equityand bond issuances over the five-year period preceding the loan’sissuance date.
Earnings-persistence-1 A measure of earnings persistence, estimated by the coefficient in theregression of earnings on prior year earnings: Et = α + βEt−1 + εt ,where E is measured by the ratio of EBITDA to total assets. Theregression is estimated over the 10-year period preceding the yearof a loan’s issuance. The estimation requires at least five years ofavailable data.
Earnings-persistence-2 A measure of earnings persistence based on Skinner and Soltes[2011]. This is an indicator variable taking the value of one if aborrower paid cash dividends and performed stock repurchases inthe majority of years over the five-year period preceding the year ofa loan’s issuance, zero otherwise.
Earnings-volatility A standard deviation of the ratio of EBITDA to total assets over the10-year period preceding the year of a loan’s issuance. Theestimation requires at least five years of available data.
Firm-size A logarithm of the borrower’s total assets in the year prior to the yearof a loan’s issuance.
Fraud An indicator variable taking the value of one if over the two-yearperiod preceding the loan’s issuance date the loan’s lead arrangerserved as a lead arranger to a firm that was involved in corporatefraud, zero otherwise. We identify firms involved in corporate fraudbased on Dyck, Morse, and Zingales [2010].
Interest-coverage The ratio of EBITDA to interest expense in the year prior to the yearof a loan’s issuance.
Interest-spread A logarithm of the interest rate spread. Interest spread is based onthe All-In-Drawn-Spread measure reported by DealScan. Thismeasure is equal to the amount the borrower pays in basis pointsover LIBOR for each dollar drawn down, so it accounts for boththe spread of the loan and the annual fee paid to the bank group.TRLPC always uses the LIBOR spread or the LIBOR-equivalentspread option to calculate the All-In-Drawn spread.
Institutional An indicator variable taking the value of one if the loan’s type is termloan B, C, or D (institutional term loans), zero otherwise.
Leverage The ratio of the long-term debt to total assets in the year prior to theyear of a loan’s issuance.
Loan-size A logarithm of a loan’s amount.Loss An indicator variable taking the value of one if ROA (the ratio of
EBITDA to total assets in the year prior to the year of a loan’sissuance) is negative, zero otherwise.
Maturity A logarithm of the number of months between the loan’s issue dateand its maturity date.
Near-local-arranger An indicator variable that takes the value of one if a borrower’sheadquarters is located within 60 km of the headquarters of a localcredible lead arranger. The distance is estimated using the zip codelatitudes and longitudes of the borrower’s and lead arranger’sheadquarters and the great circle formula. We define a localcredible lead arranger as a bank that arranged, on average, at least30 syndicated loan deals per year over the sample period,suggesting that it has considerable expertise in syndicated lending.
(Continued)
44 ROBERT M. BUSHMAN AND REGINA WITTENBERG-MOERMAN
Variables Description
Near-reputable-arranger
An indicator variable that takes the value of one if a borrowerheadquarters is located within 60 km of the headquarters of areputable lead arranger. The distance is estimated using zip codelatitudes and longitudes of the borrower’s and lead arranger’sheadquarters and the great circle formula.
Outlook-negative An indicator variable that takes the value of one if a borrower has anegative S&P outlook at the time of a loan’s issuance, zerootherwise.
Outlook-positive An indicator variable that takes the value of one if a borrower has apositive S&P outlook at the time of a loan’s issuance, zerootherwise.
Prior-relationship An indicator variable taking the value of one if at least one of theloan’s lead arrangers had been a lead arranger of the borrower’sprevious loans over the five-year period preceding the loan’sissuance date, zero otherwise.
Reputation An indicator variable taking the value of one if the loan is syndicatedby one of the reputable lead arrangers in the syndicated loanmarket. We define the lead arranger as reputable if its averagemarket share in the syndicated loan market is above 2%. Themarket share is measured by the ratio of the amount of loans thatthe financial intermediary syndicated as a lead arranger to the totalamount of loans syndicated in the loan market over our sampleperiod from 1998 to 2006. In the case of multiple arrangers, weconsider the highest market share across the arrangers involved inthe loan transaction. In case a bank merges with or is acquired byanother bank and therefore ceases to exist, we estimate its marketshare over the fraction of our sample period that precedes themerger/acquisition. For example, Chase Manhattan acquired J.P.Morgan in December 2000. We estimate J.P. Morgan’s averagemarket share over the 1998–2000 period. In addition, acrossreputable arrangers, over our sample period, Bank One mergedwith J.P. Morgan Chase and Fleet Boston with Bank of America.
Restructuring-purpose An indicator variable taking the value of one if the loan’s primarypurpose is takeover, LBO, MBO or recapitalization, zero otherwise.A loan with a primary purpose of recapitalization is a loan tosupport a material change in a firm’s capital structure, often madein conjunction with other debt or equity offerings.
ρ The correlation between the error terms in the reputation and futureperformance regressions.
ROA The ratio of EBITDA to total assets in the year prior to the year of aloan’s issuance.
ROAt +1 The ratio of EBITDA to total assets in the year following the year of aloan’s issuance.
ROAt +2 The ratio of EBITDA to total assets in the second year following theyear of a loan’s issuance.
ROAt +3 The ratio of EBITDA to total assets in the third year following theyear of a loan’s issuance.
Watch-negative An indicator variable that takes the value of one if a borrower is onthe S&P negative watch list at the time of a loan’s issuance, zerootherwise.
Watch-positive An indicator variable that takes the value of one if a borrower is onthe S&P positive watch list at the time of a loan’s issuance, zerootherwise.
ROLE OF BANK REPUTATION 45
APPENDIX BBootstrap Test
To test the statistical significance of the difference in the R2 values in ta-ble 7, panel B, we employ a bootstrap procedure that uses the sample datato generate a distribution for the test statistic (see Noreen [1989]). To com-pare the R2 from borrowers of both high- and lower reputation banks, thetest statistic is the difference between the R2 of the two cash flow predic-tion regressions. Our hypothesis is that the difference in R2s is driven byhigh reputation banks more rigorously screening and monitoring borrow-ers, causing these borrowers to have higher accounting quality and thusa higher R2 relative to borrowers using lower reputation banks. The nullhypothesis is that there is no difference in the R2 across high- and low-reputation groups. The bootstrapping technique tests this by examininghow frequently the actual observed difference in the R2 would occur ran-domly. The approach randomly assigns firms to high- and low-reputationgroups, and then re-estimates equations (11) and (12) for these randomgroupings. This process is repeated 1,000 times and the resulting p-value isthe number of times that the randomly generated difference in the R2 islarger than the actual difference in the R2 divided by the number of itera-tions plus one.
REFERENCES
AGRAWAL, A., AND T. COOPER. “Accounting Scandals in IPO Firms: Do Underwriters and VCsHelp?” Journal of Economics and Management Strategy 19 (2010): 1117–81.
ALI, A., AND P. ZAROWIN. “The Role of Earnings Levels in Annual Earnings-Returns Studies.”Journal of Accounting Research 30 (1992): 286–96.
ARMSTRONG, C.; W. GUAY; AND J. WEBER. “The Role of Information and Financial Reportingin Corporate Governance and Debt Contracting.” Journal of Accounting and Economics 50(2010): 179–234.
ASHBAUGH-SKAIFE, H.; D. COLLINS; AND R. LAFOND. “The Effects of Corporate Governance onFirms’ Credit Ratings.” Journal of Accounting and Economics 42 (2006): 203–243.
BACHAR, J. “Auditing Quality, Signaling, and Underwriting Contracts.” Contemporary AccountingResearch 6 (1989): 216–41.
BALL, R. “Infrastructure Requirements for an Economically Efficient System of Public Finan-cial Reporting and Disclosure.” Brookings-Wharton Papers on Financial Services (2001): 69–127.
BALL, R.; R. BUSHMAN; AND F. VASVARI. “The Debt-Contracting Value of Accounting Informa-tion and Loan Syndicate Structure.” Journal of Accounting Research 46 (2008): 247–87.
BALL, R.; S. JAYARAMAN; AND L. SHIVAKUMAR. “The Complementary Roles of Audited Finan-cial Reporting and Voluntary Disclosure: A Test of the Confirmation Hypothesis.” Journal ofAccounting and Economics (2012): Forthcoming.
BALL, R., AND L. SHIVAKUMAR. “Earnings Quality in U.K. Private Firms: Comparative LossRecognition Timeliness.” Journal of Accounting and Economics 39 (2005): 83–128.
BARON, D. “A Model of the Demand for Investment Banking Advising and Distribution Ser-vices for New Issues.” Journal of Finance 37 (1982): 955–76.
BASU, S. “The Conservatism Principle and the Asymmetric Timeliness of Earnings.” Journal ofAccounting and Economics 24 (1997): 3–37.
BEATTY, R. “The Economic Determinants of Auditor Compensation in the Initial Public Offer-ings Market.” Journal of Accounting Research 31 (1993): 294–302.
BEATTY, R., AND J. RITTER. “Investment Banking, Reputation, and the Underpricing of InitialPublic Offerings.” Journal of Financial Economics 15 (1986): 213–32.
46 ROBERT M. BUSHMAN AND REGINA WITTENBERG-MOERMAN
BEAVER, W.; C. SHAKESPEARE; AND M. SOLIMAN. “Differential Properties in the Ratings of Cer-tified Versus Non-certified Bond-Rating Agencies.” Journal of Accounting and Economics 42(2006): 303–34.
BECKER, C.; M. DEFOND; J. JIAMBALVO; AND K. SUBRAMANYAM. “The Effect of Audit Quality onEarnings Management.” Contemporary Accounting Research 15 (1998): 1–24.
BERGER, A.; N. MILLER; M. PETERSEN; R. RAJAN; AND J. STEIN. “Does Function Follow Organi-zational Form? Evidence from the Lending Practices of Large and Small Banks.” Journal ofFinancial Economics 76 (2005): 237–69.
BERNDT, A., AND A. GUPTA. “Moral Hazard and Adverse Selection in the Originate-to-DistributeModel of Bank Credit.” Journal of Monetary Economics 56 (2009): 725–43.
BHARATH, S.; J. SUNDER; AND S. SUNDER. “Accounting Quality and Debt Contracting.” The Ac-counting Review 83 (2008): 1–28.
BILLETT, M.; M. FLANNERY; AND J. GARFINKEL. “The Effect of Lender Identity on a BorrowingFirm’s Equity Return.” Journal of Finance 50 (1995): 699–718.
BLANCO, R.; S. BRENNAN; AND I. MARSH. “An Empirical Analysis of the Dynamic RelationshipBetween Investment Grade Bonds and Credit Default Swaps.” Journal of Finance 60 (2005):2255–81.
BOOT, A. “Relationship Banking: What Do We Know?” Journal of Financial Intermediation 9(2000): 7–25.
BOOTH, J., AND R. SMITH. “Capital Raising, Underwriting and the Certification Hypothesis.”Journal of Financial Economics 15 (1986): 261–81.
BUSHMAN, R.; A. SMITH; AND R. WITTENBERG-MOERMAN. “Price Discovery and Dissemination ofPrivate Information by Loan Syndicate Participants.” Journal of Accounting Research 48 (2010):921–72.
CAMPBELL, T., AND W. KRACAW. “Information Production, Market Signaling, and the Theoryof Financial Intermediation.” Journal of Finance 35 (1980): 863–82.
CARTER, R., AND S. MANASTER. “Initial Public Offerings and Underwriter Reputation.” Journalof Finance 45 (1990): 1045–67.
CHEMMANUR, T., AND P. FULGHIERI. “Investment Bank Reputation, Information Production,and Financial Intermediation.” Journal of Finance 49 (1994a): 57–79.
CHEMMANUR, T., AND P. FULGHIERI. “Reputation, Renegotiation, and the Choice Between BankLoans and Publicly Traded Debt.” Review of Financial Studies 7 (1994b): 475–506.
CHEN, H., AND J. RITTER. “The Seven Percent Solution.” Journal of Finance 55 (2000): 1105–31.COVAL, J., AND T. MOSKOWITZ. “Home Bias at Home: Local Equity Preference in Domestic
Portfolios.” Journal of Finance 54 (1999): 2045–73.COVAL, J., AND T. MOSKOWITZ. “The Geography of Investment: Informed Trading and Asset
Prices.” Journal of Political Economy 109 (2001): 811–41.DASS, N., AND M. MASSA. “The Bank-Firm Relationship: A Trade-Off Between Governance and
Greater Information Asymmetry.” Review of Financial Studies 24 (2011): 1204–60.DATAR, S.; G. FELTHAM; AND J. HUGHES. “The Role of Audits and Audit Quality in Valuing New
Issues.” Journal of Accounting and Economics 14 (1991): 3–49.DE FRANCO, G.; F. VASVARI; AND R. WITTENBERG-MOERMAN. “The Informational Role of Bond
Analysts.” Journal of Accounting Research 47 (2009): 1201–48.DEANGELO, L. “Auditor Size and Audit Quality.” Journal of Accounting and Economics 3 (1981):
183–99.DECHOW, P.; W. GE; AND C. SCHRAND. “Understanding Earnings Quality: A Review of the Prox-
ies, Their Determinants and Their Consequences.” Journal of Accounting and Economics 50(2010): 344–401.
DEFOND, M., AND J. JIAMBALVO. “Incidence and Circumstances of Accounting Errors.” The Ac-counting Review 66 (1991): 643–55.
DIAMOND, D. “Financial Intermediation and Delegated Monitoring.” Review of Economic Studies51 (1984): 393–414.
DICHEV, I., AND V. TANG. “Earnings Volatility and Earnings Predictability.” Journal of Accountingand Economics 47 (2009): 160–81.
ROLE OF BANK REPUTATION 47
DRUCKER, S., AND M. PURI. “On Loan Sales, Loan Contracting, and Lending Relationships.”Review of Financial Studies 22 (2009): 2635–72.
DYCK, A.; A. MORSE; AND L. ZINGALES. “Who Blows the Whistle on Corporate Fraud?” Journalof Finance 65 (2010): 2213–53.
FANG, L. “Investment Bank Reputation and the Price and Quality of Underwriting Services.”Journal of Finance 60 (2005): 2729–61.
FERNANDO, C.; V. GATCHEV; AND P. SPINDT. “Wanna Dance? How Firms and UnderwritersChoose Each Other.” Journal of Finance 60 (2005): 2437–69.
FRANCIS, J. “What Do We Know About Audit Quality?” The British Accounting Review 34 (2004):345–68.
FRANCIS, J.; R. LAFOND; P. OLSSON; AND K. SCHIPPER. “Costs of Capital and Earnings Attributes.”The Accounting Review 79 (2004): 967–1010.
FRANCIS, J.; R. LAFOND; P. OLSSON; AND K. SCHIPPER. “The Market Pricing of Accruals Quality.”Journal of Accounting and Economics 39 (2005): 295–327.
FRANCIS, J., AND C. LENNOX. “Selection Models in Accounting Research.” The Accounting Review(2008): Forthcoming.
FRANKEL, R., AND L. LITOV. “Earnings Persistence.” Journal of Accounting and Economics, 47(2009): 182–90.
GOPALAN, R.; V. NANDA; AND V. YERRAMILLI. “Does Poor Performance Affect the Reputation ofFinancial Intermediaries? Evidence from the Loan Syndication Market.” Journal of Finance,66 (2011): 2083–120.
GORTON, G., AND G. PENNACCHI. “Financial Intermediaries and Liquidity Creation.” The Jour-nal of Finance 45 (1990): 49–71.
HECKMAN, J., AND S. NAVARRO-LOZANO. “Using Matching, Instrumental Variables, and ControlFunctions to Estimate Economic Choice Models.” Review of Economics and Statistics 86 (2004):30–57.
HSU, D. “What Do Entrepreneurs Pay for Venture Capital Affiliation?” Journal of Finance 59(2004): 1805–44.
HULL, J.; M. PREDESCU; AND A. WHITE. “The Relationship Between Credit Default SwapSpreads, Bond Yields, and Credit Rating Announcements.” Journal of Banking and Finance28 (2004): 2789–811.
HYAN, C. “The Information Content of Losses.” Journal of Accounting and Economics 20 (1995):125–53.
IVASHINA, V. “The Effects of Syndicate Structure on Loan Spreads.” Journal of Financial Eco-nomics 92 (2009): 300–19.
IVASHINA, V., AND A. KOVNER. “The Private Equity Advantage: Leveraged Buyout Firms andRelationship Banking.” Review of Financial Studies 24 (2011): 2462–98.
IVASHINA, V., AND Z. SUN. “Institutional Demand Pressure and the Cost of Leveraged Loans.”Journal of Financial Economics 99 (2011): 500–22.
JAMES, C., AND D. SMITH. “Are Banks Still Special? New Evidence on Their Role in theCorporate Capital-Raising Process.” Journal of Applied Corporate Finance 13 (2000): 52–63.
KLEIN, B., AND K. LEFFLER. “The Role of Market Forces in Assuring Contractual Performance.”Journal of Political Economy 89 (1981): 615–38.
KRISHNAN, C.; V. IVANOV; R. MASULIS; AND A. SINGH. “Venture Capital Reputation, Post-IPOPerformance, and Corporate Governance.” Journal of Financial and Quantitative Analysis 46(2011): 1295–1333.
LARCKER, D., AND T. RUSTICUS. “On the Use of Instrumental Variables in Accounting Re-search.” Journal of Accounting and Economics 49 (2010): 186–205.
LEE, G., AND R. MASULIS. “Do Underwriters or Venture Capitalists Restrain Earnings Manage-ment by IPO Issuers?” Journal of Corporate Finance (2011): Forthcoming.
LEE, S., AND D. MULLINEAUX. “Monitoring, Financial Distress, and the Structure of Commer-cial Lending Syndicates.” Financial Management 33 (2004): 107–30.
LELAND, H., AND D. PYLE. “Informational Asymmetries, Financial Structure, and Financial In-termediation.” Journal of Finance 32 (1977): 371–415.
48 ROBERT M. BUSHMAN AND REGINA WITTENBERG-MOERMAN
LIN, H., AND D. PARAVISINI. “What’s Bank Reputation Worth? The Effect of Fraud on Finan-cial Contracts and Investment.” Working paper, Columbia University, 2011. Available athttp://papers.ssrn.com/sol3/papers.cfm?abstract˙id=1427330.
LONGSTAFF, F.; S. MITHAL; AND E. NEIS. “Corporate Yield Spreads: Default Risk or Liquidity?New Evidence from the Credit-Default Swap Market.” Journal of Finance 60 (2005): 2213–53.
LOU, Y., AND F. VASVARI. “The Role of Reputable Auditors and Underwriters in the Design ofBond Contracts.” Journal of Accounting, Auditing and Finance (2011): Forthcoming.
MADDALA, G. Limited-Dependent and Qualitative Variables in Econometrics, Melbourne, Australia:Cambridge University Press, 1983.
MASKARA, P., AND D. MULLINEAUX. “Information Asymmetry and Self-Selection Bias in BankLoan Announcement Studies.” Journal of Financial Economics 101 (2011): 684–94.
MINNIS, M. “The Value of Financial Statement Verification in Debt Financing: Evidence fromPrivate U.S. Firms.” Journal of Accounting Research 49 (2011): 457–506.
MORA, N. “Lender Exposure and Effort in the Syndicated Loan Market.” Working paper,Federal Reserve Bank of Kansas City, 2010. Available at http://papers.ssrn.com/sol3/papers.cfm?abstract˙id = 1703661.
NAHATA, R. “Venture Capital Reputation and Investment Performance.” Journal of FinancialEconomics 90 (2008): 127–51.
NANDA, V., AND Y. YUN. “Reputation and Financial Intermediation: An Empirical Investigationof the Impact of IPO Mispricing on Underwriter Market Value.” Journal of Financial Interme-diation 6 (1997): 39–63.
NOREEN, E. Computer-Intensive Methods for Testing Hypothesis: An Introduction. New York, NY: Wi-ley, 1989.
PENNACCHI, G. “Loan Sales and the Cost of Bank Capital.” The Journal of Finance 43 (1988):375–96.
PETERSEN, M., AND R. RAJAN. “Does Distance Still Matter? The Information Revolution in SmallBusiness Lending.” Journal of Finance 57 (2002): 2533–570.
ROSENBAUM, P., AND D. RUBIN. “The Central Role of the Propensity Score in ObservationalStudies for Causal Effects.” Biometrika 70 (1983): 41–55.
ROSS, D. “The “Dominant Bank Effect:” How High Lender Reputation Affects the InformationContent and Terms of Bank Loans.” The Review of Financial Studies 23 (2010): 2730–56.
SAUNDERS, A., AND M. CORNETT. Financial Institutions Management: A Modern Perspective. NewYork: McGraw-Hill/Irwin, 2004.
SHAPIRO, C. “Premiums for High Quality Products as Returns to Reputations.” Quarterly Journalof Economics 98 (1983): 659–79.
SKINNER, D., AND E. SOLTES. “What Do Dividends Tell Us About Earnings Quality?” Review ofAccounting Studies 16 (2011): 1–28.
SUFI, A. “Information Asymmetry and Financing Arrangements: Evidence from SyndicatedLoans.” Journal of Finance 62 (2007): 629–68.
TEOH, S., AND T. WONG. “Perceived Auditor Quality and the Earnings Response Coefficient.”The Accounting Review 68 (1993): 346–67.
TITMAN, S., AND B. TRUEMAN. “Information Quality and the Valuation of New Issues.” Journalof Accounting and Economics 8 (1986): 159–72.
WATTS, R. “Conservatism in Accounting Part I: Explanations and Implications.” AccountingHorizons 3 (2003): 207–21.
WATTS, R., AND J. ZIMMERMAN. Positive Accounting Theory. Englewood Cliffs, NJ: Prentice-Hall,1986.
WEBER, J., AND M. WILLENBORG. “Do Expert Informational Intermediaries Add Value? Evi-dence from Auditors in Microcap IPOs.” Journal of Accounting Research 41 (2003): 681–720.
WITTENBERG-MOERMAN, R. “The Role of Information Asymmetry and Financial ReportingQuality in Debt Trading: Evidence from the Secondary Loan Market.” Journal of Account-ing and Economics 46 (2008): 240–60.
YASUDA, A. “Do Bank Relationships Affect the Firm’s Underwriter Choice in the Corporate-Bond Underwriting Market?” Journal of Finance 60 (2005): 1259–92.
ZHANG, J. “The Contracting Benefits of Accounting Conservatism to Lenders and Borrowers.”Journal of Accounting and Economics 45 (2008): 27–54.