33
The role of chromatography in physico-chemical characterisation Shenaz Nunhuck CASS, GSK
| Date post: | 14-Dec-2015 |
| Category: |
Documents |
| Upload: | tucker-goates |
| View: | 220 times |
| Download: | 0 times |

The role of chromatography in physico-chemical characterisation
Shenaz NunhuckCASS, GSK

Why do we need physchem measurements?
Physicochemical properties of drugs influence their absorption and distribution in vivo
Systemic absorption of drug involves a number of rate processes:
Distribution of the drug in the body Dissolution of the drug in the body fluids Permeation across the cell membranes to reach the site of
action.
Key physicochemical parameters influencing these processes are lipophilicity, solubility, pKa, permeability

PHYSCHEMASSAYS
LIPOPHILICITYLogD (oct), CHI
AQUEOUS SOLUBILITY
PLASMA PROTEIN BINDING
IONISATION CONSTANT
MEMBRANE PERMEABILITY

Sample flow process
Samples (DMSO plates, solids in vials) booked in
Chemists request assays
through PhysWeb website.
Samples are obtained from
compound stores
Barcode read and sample information and required tests recorded in Excel
report file
Samples are analysed (Solubility, CHI, protein binding, LogD(oct), pKa)
Data processe
d and results
calculated
Chemists notified of
completion of assays via PhysWeb
Results posted to the global company database

Lipophilicity measurements
Chromatographic Hydrophobicity Index (CHI)
Immobilised artificial membrane (IAM) partition
Protein binding (human serum albumin, alpha-1-acid-glycoprotein)
Octanol/water partition coefficient (LogP/D(oct)

Theoretical basis of using chromatography for measuring lipophilicity
k= number of mol in the stationary phase/number of mol in the mobile phasek = (tR - t0 )/ t0
log k = log K + log (Vs/Vm)k is retention factorlog K is the log of the chromatographic partition coefficientVs/Vm is constant column parameter (the ratio of the mobile and stationary phase volumes)
•Different compounds travel at different speeds in the chromatographic system.•The differential migration depends on the interaction of compounds between the mobile and stationary phase.•Retention factor is directly related to the chromatographic partition coefficient.

Chromatographic Hydrophobicity Index, CHI Fast gradient methods: the gradient retention time is proportional
to the compound lipophilicity.
Fast gradient retention time obtained on commercially available C-18 stationary phase converted to Chromatographic Hydrophobicity Index (CHI); this is the chromatographic lipophilicity.
The CHI Indices at three different pHs are determined from the gradient retention times obtained by injecting the compound into a HPLC system.
Dynamic range extended by the gradient method.
Can be expressed on a logP/D scale.(CHIlogD = 0.054*CHI -1.467)

Generic Gradient HPLC ( ‘Four minute CHI method’)
CHI is derived directly from a reversed phase chromatographic gradient retention time.
Luna C-18 column, buffer:acetonitrile gradient, pH2 Luna C-18 column, buffer:acetonitrile gradient, pH7.4 Luna C-18 column, buffer:acetonitrile gradient, pH 10.5
Each run time is 4 minutes. Retention times are converted to CHI lipophilicity values after calibration.
Column: Luna C18(2), 50 x 3.0 mm id, 5 m Flow: 1.00 ml/min Mobile phase A: 50 mM ammonium acetate pH 7.4/10.5,
0.1M H3PO4 B: AcetonitrileGradient: 0-100% B in 2.5 minutes, hold at 100% B for 0.5 minute, return to 0% B in 0.2 minute, equilibrate at 0 % B for 1.8 minutesAnalysis time:4 mins
Gradient for CHI determination
-10
10
30
50
70
90
110
0 1 2 3 4 5
Time (mins)
%B

Derivation of CHI A set of calibration compounds of known CHI
values (determined isocratically) is run. A plot of Rt v/s CHI gives the calibration curve. Research compounds are run. The Rt is
converted to CHI from the coefficients of the calibration curve.
CHI = (slope x Rt) + intercept
Compound CHI7.4
at pH 7.4 CHI2
at pH 2 CHI10.5
at pH 10.5 Theophylline 18.4 17.9 5.0 Phenyltetrazole 23.6 42.2 16.0 Benzimidazole 34.3 6.3 30.6 Colchicine 43.9 43.9 43.9 Phenyltheophylline 51.7 51.7 51.7 Acetophenone 64.1 64.1 64.1 Indole 72.1 72.1 72.1 Propiophenone 77.4 77.4 77.4 Butyrophenone 87.3 87.3 87.3 Valerophenone 96.4 96.4 96.4
0.00
100.00
200.00
300.00
400.00
500.00
600.00
700.00
0.00 0.20 0.40 0.60 0.80 1.00 1.20 1.40 1.60 1.80 2.00 2.20 2.40 2.60 2.80 3.00 3.20 3.40 3.60 3.80
Calibration chromatogram at pH 7.4Calibration chromatogram at pH 7.4
CHI calibration at pH 7.4 y = 53.907x - 43.978R2 = 0.9949
0.00
20.00
40.00
60.00
80.00
100.00
120.00
1 1.2 1.4 1.6 1.8 2 2.2 2.4 2.6 2.8
tR pH7.4
CH
I 7.4

Immobilised Artificial Membrane (IAM) Immobilised Artificial Membrane-
phosphatidylcholine (PC) head group with an ester linkage between two acyl chains and the glycerol backbone of the PC molecule.
Phosphatidylcholine (PC) is the major phospholipid found in cell membranes.
IAM stationary phases prepared from PC analogs closely mimic the surface of a biological cell membrane.
CHI IAM are extensively used in GSK for various purposes– Brain penetration models– Hepatoxicity models
Schematic diagram of the IAM.PC (CH2)12 stationary phase surface

Fast HPLC method to measure interaction with Immobilised Artificial Membrane (IAM), CHI IAM
Column: IAM PC2 (CH2)12 150 x 4.6
Flow rate: 2 ml/min
Gradient: 0 to 2.5 min 0 to 70% acetonitrile
2.5 to 3.3 min 70% acetonitrile
3.3 to 3.5 min 0% acetonitrile
Buffer: 50mM NH4AC, pH 7.4
Cycle time: 4 min
CHI IAM Calibration y = 29.144x - 44.502R2 = 0.999
0
10
20
30
40
50
60
1.2 1.7 2.2 2.7 3.2 3.7
tR pH 7.4
CH
I IA
M
tR 7.4 CHI IAM Compound
3.284 49.4 Octanophenone
3.167 45.7 Heptanophenone
3.033 41.8 Hexanophenone
2.866 37.3 Valerophenone
2.658 32 Butirophenone
2.415 25.9 Propiophenone
2.093 17.2 Acetophenone
1.893 11.5 Acetanilide
1.648 2.9 Paracetamol
A set of calibration compounds of known CHI IAM values (previously determined isocratically) is run.
A plot of Rt v/s CHI gives the calibration curve. Research compounds are run. The Rt is converted
to CHI from the coefficients of the calibration curve.
CHI = (slope x Rt) + intercept
Ref: Valko et al, Rapid gradient HPLC method for measuring drug interactions with immobilised artificial membrane : Comparison with other lipophilicity measures. J Pharm Sci 89:1085-1096

4-way parallel HPLC system
IAMC-18 pH 2
C-18 pH 7.4
C-18 pH 10.5

4 chromatograms of one compound by the 4-way HPLC Typical 4-way chromatograms of a base

CHI values and the acid/base character
0
10
20
30
40
50
60
70
80
90
100
Neutral(Zwitterionic)
Strong acid Weak acid Strong base Weak base Amphoteric
pH2
pH7.4
pH10.5
The change of CHI values by changing the pHCHI
CHIs measured at 3 pHs provide an automatic way of grouping molecules according to acid/base character without a need for structural information.
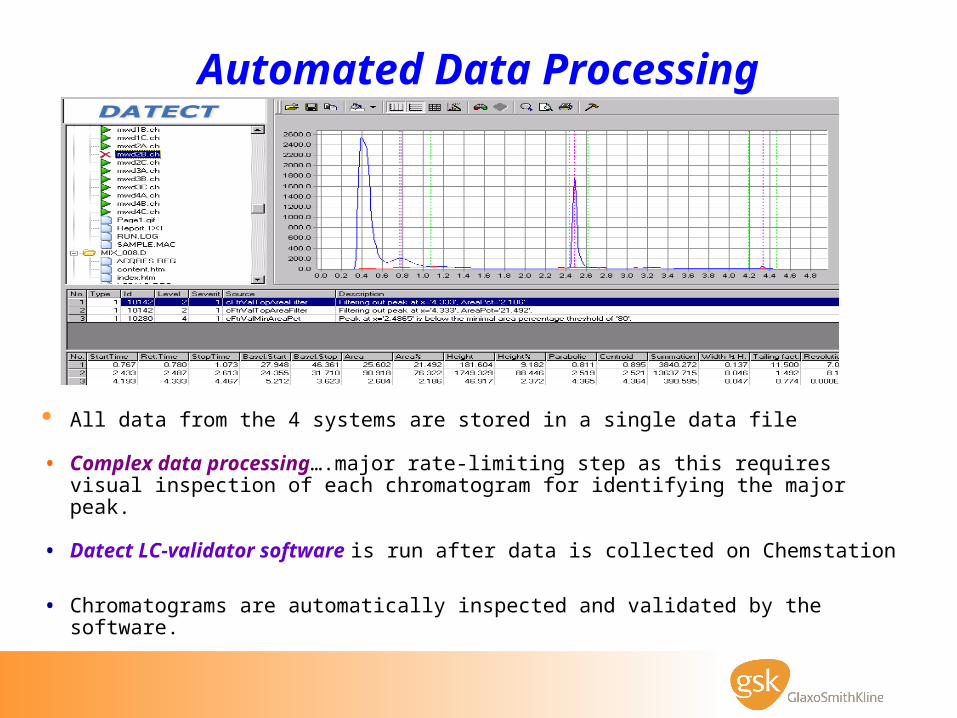
Automated Data Processing
All data from the 4 systems are stored in a single data file
• Complex data processing….major rate-limiting step as this requires visual inspection of each chromatogram for identifying the major peak.
• Datect LC-validator software is run after data is collected on Chemstation
• Chromatograms are automatically inspected and validated by the software.

Automated review of Chromatograms Peaks of interest are identified, their shape examined and retention time automatically transferred
into excel spreadsheets for further data processing.
Software highlights any anomalies and generates explanatory error messages prompting expert visual inspection.
Customised alerts are set up by the user. Most of our validation failures occur when the: Major component’s peak area is less than 80% of total, indicating that the compound is probably
impure.• Major peak retention times are not identical at various wavelengths.• Major peak absorbance is weak indicating lack of chromophore or absence of compound.
Datect LC-validator (www.datect.com).

Commercially available 4-way HPLC-MS instrument from Waters
Wa te rsZQ
4 WATERS 1525HPLC PUMPS
MULTIPLE INJECTORSYSTEM
Waters 2777
LC COLUMNS(0.500 mL/min)
4 PDADetec to rs
2996
SPLITTERS(0.05 mL/min) Mas s Lynx
DATA SYS TEM
MULTIPLEXEDELECTROSPRAYINLET
IAM
pH 2.0
pH 7.4
pH 10.5

Biomimetic hplc stationary phases (HSA, RSA, AGP)
Used to measure the binding affinity of compounds to proteins.
Plasma protein binding affects the unbound (free) drug concentration available to diffuse from the blood and reach the target tissue.
Commercially available human and rat serum albumin and α-acid glycoprotein hplc stationary phases (available from ChromTech Ltd)

Plasma Protein Binding
Column: Chromtech HSA 50 x 3 mm
Flow rate: 1.8 ml/min at 300C
Mobile phase: 50 mM ammonium acetate pH7.4/Propan-2-ol
Gradient:
0 - 3 min 0 to 30% propan-2-ol; 3 to 5 min 30% propan-2-ol; 5 to 5.1 min 0% propan-2-ol
Cycle time: 6 min
•Fast generic gradient hplc method based on propan-2-ol gradient and chemically bonded HSA or RSA column.
•Warfarin site is the major binding site on HSA. •By injecting a racemic mixture of warfarin on the column, the R and S enantiomer are separated indicating the warfarin site is intact and the column is suitable for use.
•Only 6 minutes analysis time
Ref: Valko et al, 2003.Fast gradient HPLC method to determine compounds binding to human serum albumin. Relationships with octanol/water and immobilised artificial membrane lipophilicity. J Pharm Sci 92:2236-2248

Calibration and Results
Calculate %Binding logK = slope * log(tR) + intercept
K = %B / (101-%B)
Calibration compounds
Literature %binding
Nizatidine 35
Bromazepam 60
Carbamazepine 75
Piroxicam 94.5
Nicardipine 95
Warfarin 98
Ketoprofen 98.7
Indomethacin 99
Diclofenac 99.8
HSA calibration y = 2.2331x + 0.2283
-1.00
-0.50
0.00
0.50
1.00
1.50
2.00
2.50
-0.40 -0.20 0.00 0.20 0.40 0.60 0.80
LogtRL
og
K
System is calibrated using literature plasma protein binding % data.
•Results are reported as % bound or logK

Plasma Protein Binding
•Reproducibility on the column is very good; the gradient retention time is within 0.1 min from day to day
•The hplc method is fast, simple and is easily automated.
•The use of calibration compensates for any changes in the column properties and hence increases the accuracy of the determination.
•The hplc procedure can discriminate easily in the high binding region (better than the traditional ultrafiltration or equilibrium dialysis methods) as the percentage of drug bound to the protein is measured and not the free drug.
•Approximately 400 injections per column

Chromatographic methods for quantitative assays
HPLC is a powerful technique for separation and quantification
Suitable approach for determination of compound concentration
Applied as end-point for logP(octanol) and solubility determination

LogP(octanol) “shake-flask” determination
Equilibration of the compound between n-octanol and water in 96-well plate
Determination of concentration of the compound in each phase by fast gradient hplc method.
The syringe in the autosampler is set to sample first at the depth of the octanol phase in the well and then at the depth of the aqueous phase without any cross contamination
Ratio of the peak areas obtained from the aqueous and octanol phases directly provides partition coefficients
LogD(oct) = Log[( Peak area of sample in octanol phase x Injn vol. (aqu) ]
Peak area of sample in aqueous phase) Injn vol. (oct)

Why is aqueous solubility important in early drug discovery?
Solubility is a key property for gastrointestinal absorption of orally administered drugs.
Affects bioavailability Helpful in drug formulation stages for optimal drug
delivery route and optimization Insoluble compounds may compromise screening
results. Various solubilities
• DMSO precipitative solubility• Solubility from solids• Solubility in simulated intestinal fluid (SIF)

HPLC-based Precipitative Aqueous Solubility
compounds dissolved in DMSO at 10 mM
Sample 500 uMin pH 7.4 aqueous buffer
50 uM standard in DMSO
Tecan
data in GSK database
incubation& filtration
fast gradient generic HPLC method

Quantification by HPLC Fast automated sample preparation Gradient HPLC method same as the CHI
method• Sample and standard solutions injected
next to each other (single point calibration)
• Data collected at two wavelengths Impurities separated Automated data processing using in-house
macro• Macro identifies the peak of interest in
the standard solution and matches it with that in the sample solution
• Peak area and retention time data exported to excel
Solubility of sample = Peak area of sample X Conc. of standard
Peak area of standard

Artificial Membrane Permeability
. ... . ...
acceptor
donor
phospholipid membranes
access to bottomwell (donor solution)
Transwell PlateTop well (acceptorsolution)
•Lipid is egg phosphatidyl choline and cholesterol dissolved in n-decane.
•Permeation experiment is initiated by adding the compound to the bottom well and stopped at a pre-determined elapsed time.
•Samples are analysed by HPLC/UV or/MS
•High throughput assessment of compound intestinal permeability•Cultured cell monolayer with reconstituted lipid membrane
P = (Vd/a* t) * ln [(R+X)/R(1-X)] * [1/(1+R)]
t is the equilibration time in sVd is the volume of donor solution in cm3Vr is the volume of acceptor solution in cm3a is the membarne surface area in cm2R is the Vd/Vr ratioA is the acceptor side peak areaD is the donor side peak areaX is the A/D peak area ratio

Advantages of using HPLC technique
The compounds retention time can be directly related to the distribution between the stationary and the mobile phase, there is no need for concentration determination.
By changing the stationary phases and the mobile phase composition various types of lipophilic interactions can be investigated.
Impurities do not affect results as they are separated from the main peak and the compound of interest can be identified.

Advantages of using HPLC technique
Only small amount of material is needed.
Parallel systems can be used to lower cost and increase throughput.
With generic gradient hplc method, one method can be used with a variety of compounds; there is no need for individual customised method development.
Provides an excellent platform for computer controlled automated measurements with computerised data acquisition.

CONCLUSIONS
HPLC provides an excellent generic platform for measuring lipophilicity, acid/base character and bio-mimetic partition properties.
With the application of gradient methods and system calibration with known compounds, large amounts of reproducible data are obtained covering a wide dynamic range of the property.
The extensive application of automated platforms and parallelised chromatography has enabled hundreds of thousands of determinations to be made per annum with a minimum of labour.
The data are suitable to build local and general models to predict developability properties in early stages of drug discovery.

Acknowledgements Klara Valko Chris Bevan Alan Hill Pat McDonough

Physicochemical Scientist - GSK
103002-82072Reference:
PermanentDuration:
07/12/2005Start Date:
Attractive Pay & BenefitsSalary:
Harlow, Essex, Southeast EnglandLocation:
GlaxoSmithKline is currently recruiting for a Physicochemical Scientist in Harlow - Essex, Southeast England.
At GlaxoSmithKline (GSK), one of the world's leading healthcare businesses, we discover, develop and produce products that help people live longer, do more and feel better.
Minimum Requirements: You will have a BSc or equivalent experience in Chemistry, Analytical Chemistry or related discipline and have experience within an analytical laboratory environment.

Difference between CHIlogP and octanol/water logP
Chromatographic lipophilicity is not the same as the octanol/water lipophilicity
H-bond donor compounds (Series 1) partition more into octanol because the octanol OH groups can interact with the solute H-bond donor group resulting in higher logP values (i.e they look more lipophilic).
The two scales of lipophilicity can be aligned by introducing a H-bond acidity (A) term or a count of H-bond acid groups on the molecules (HBDC)
LogPoct = 0.05CHIlogP + 0.41HBDC – 1.41N=86 r=0.94 s=0.40
where HBC = Hydrogen bond donor count
LogPoct = 0.054CHIlogP + 1.319A – 1.877 N=86 r=0.97 s=0.29
where A = Calculated Hydrogen Bond Acidity


