68
www.technopolis-group.com 10 th May The role of EU funding in UK research and innovation

www.technopolis-group.com
10th May
The role of EU funding in UK research and innovation

The role of EU funding in UK research and innovation
This report was commissioned by the Academy of Medical Sciences, British Academy,
Royal Academy of Engineering and the Royal Society. It was wholly conducted and
authored by Technopolis and any views expressed do not necessarily reflect the views
of the UK National Academies.
technopolis |group| May, 2017
Kalle Nielsen
Kristine Farla
Cristina Rosemberg Montes
Paul Simmonds
Martin Wain

iii
Table of Contents
Executive summary ........................................................................................................................................ 1
This report ..................................................................................................................................................................... 1
EU research and innovation funds ................................................................................................................................... 1
EU funding of UK academia ........................................................................................................................................ 1
Funding by academic disciplines ................................................................................................................................ 2
Funding to HEIs .......................................................................................................................................................... 2
EU funding and industry ............................................................................................................................................. 3
EU funding across the UK regions .............................................................................................................................. 3
Research activities uniquely supported by the EU ..................................................................................................... 5
EU funding and leverage ............................................................................................................................................. 5
1 Introduction ............................................................................................................................................ 7
1.1. This report ....................................................................................................................................................... 7
1.2. Aim of the report ............................................................................................................................................. 7
1.3. Methodology.................................................................................................................................................... 7
1.3.1. Desk research .............................................................................................................................................. 8
1.3.2. Interviews and stakeholder consultation .................................................................................................. 8
1.3.3. Quantitative and qualitative data analysis ................................................................................................ 8
1.3.4. Case studies ................................................................................................................................................ 9
2 Sources of EU funding for UK research and innovation .................................................................... 10
Introduction .................................................................................................................................................. 10
The EU Framework Programmes for research and innovation .................................................................. 10
European Structural and Investment Funds ................................................................................................ 11
European Investment Bank .......................................................................................................................... 12
Other funds ................................................................................................................................................... 13
3 The role of EU funding across disciplines and institutions in UK academia .................................... 14
Introduction .................................................................................................................................................. 14
Overview of total funding ............................................................................................................................. 15
Disciplines ..................................................................................................................................................... 15
Higher Education Institution types .............................................................................................................. 18
4 The role of EU funding in industry...................................................................................................... 21
Industry participation in Horizon 2020 ...................................................................................................... 21
SME participation ......................................................................................................................................... 22
Sectors of economic activity ......................................................................................................................... 22
Thematic priorities ........................................................................................................................................ 24
Access to new markets .................................................................................................................................. 26
iv
5 The role of EU funding across regions in the UK ............................................................................... 28
Introduction ................................................................................................................................................. 28
European Structural and Investment funds (ESIF) .................................................................................... 29
Horizon 2020 ............................................................................................................................................... 30
6 Research activities uniquely supported by the EU ............................................................................. 33
Introduction .................................................................................................................................................. 33
Large collaborations ..................................................................................................................................... 33
6.2.1 Collaborative projects ............................................................................................................................... 33
6.2.2 Large partnerships ................................................................................................................................... 34
6.2.3 Research Infrastructures .......................................................................................................................... 37
Individual fellowships and investigator awards .......................................................................................... 37
7 Leverage effect of EU funding .............................................................................................................40
Introduction ................................................................................................................................................. 40
Contribution required by project participants............................................................................................ 40
‘Crowding-in’ of R&D investment ................................................................................................................ 41
8 Conclusion ............................................................................................................................................ 43
Stakeholders consulted ........................................................................................................... 46
REF2014 Units of Assessment and HESA cost centres ......................................................... 47
Overview EU Framework Programmes .................................................................................. 49
Overview of support from the European Structural and Investment Funds to research and
innovation projects in the UK ..................................................................................................................... 55
European Investment Bank (EIB) support for research and innovation in the UK ............ 57
Tables Table 1 Overview of EU funding for UK research and innovation .............................................................................. 10
Table 2 UK Higher Education Institutions total research grants and contracts 2014/15, £ thousands ................... 15
Table 3 The 15 HESA cost centres that received most income from EU government bodies as a proportion of total
funding in 2014/15 ........................................................................................................................................................ 16
Table 4 The 15 HESA cost centres that received most income from EU government bodies in 2014/15, in £
thousands ....................................................................................................................................................................... 17
Table 5 The 10 HEIs that received most income from EU government bodies in 2014/15, in £ thousands ............ 19
Table 6 The 10 HEIs that received most income from UK government bodies in 2014/15, in £ thousands ............ 19
Table 7 The 10 HEIs that received most income from EU government bodies as a proportion of total income and
received more than £1m EU government bodies income, in £ thousands ................................................................. 20
Table 8 FP7 funding as proportion of total R&D expenditure by UK SMEs and large businesses ........................... 22
Table 9 Distribution of EU framework programme funding and UK Business Enterprise R&D (BERD) by sector 23
Table 10 Participation of UK for-profit companies (PRC) in FP7 by company size and programme ....................... 24
Table 11 Distribution of the EU’s contribution to ERDF research and innovation projects in the UK (2014-2020)
by Region and organisation type ................................................................................................................................... 29

v
Table 12 Distribution of Horizon 2020 funding, by UK nation ................................................................................. 30
Table 13 Distribution of Horizon 2020 funding by UK region and type of organisation, in € million ..................... 32
Table 14 Size of project consortia and awards from Horizon 2020 and UK funders. ................................................ 34
Table 15 Joint Technology Initiatives in Horizon 2020 ............................................................................................. 35
Table 16 Joint Programmes (Article 185 Actions) in Horizon 2020 .......................................................................... 36
Table 17 Size of personal grants from EU and UK funding bodies to UK researchers ............................................. 39
Table 18 EU contribution and other contributions to total project costs from UK participants in FP7 and Horizon 2020 ............................................................................................................................................................................... 41
Table 19 REF2014 Units of Assessment (UOAs) and corresponding HESA cost centres ......................................... 47
Table 20 Horizon 2020 – Types of Action .................................................................................................................. 52
Table 21 Horizon 2020 MSCA grants with UK-based Principal Investigator .......................................................... 54
Table 22 Planned EU funding for research and innovation projects in the UK under ERDF (2014-2020) ............. 56
Table 23 Loans from the European Investment Bank (EIB) to research and innovation-related projects in the UK,
contracts signed between 2007 and 2016. .................................................................................................................... 58
Table 24 EIB loans to UK universities and knowledge transfer organisations, signed between 2007 and 2016 .... 59
Figures Figure 1 Value of EC Contribution in Horizon 2020 to the UK, by type of organisation ........................................... 11
Figure 2 UK beneficiaries of EU ERDF funding for research and innovation (2014-2020) ...................................... 12
Figure 3 Distribution of EU government and UK government income as a proportion of total funding in 2014/15,
by HESA cost centre ...................................................................................................................................................... 18
Figure 4 EU Framework Programme funding granted to UK for-profit companies under Horizon 2020, by
programme pillar ........................................................................................................................................................... 21
Figure 5 Distribution of EU Framework Programme funding and UK Business Enterprise R&D (BERD) by
industrial sector in the UK ............................................................................................................................................ 23
Figure 6 EU Funding for UK for-profit companies (PRC) in thematic areas under the FP7 ‘Cooperation’ specific
programme, by company size........................................................................................................................................ 25
Figure 7 Achievement of stated objectives of Space Research under FP7 for beneficiary SMEs .............................. 27
Figure 8 Distribution of EU funding across the four nations .................................................................................... 28
Figure 9 Value of individual grants awarded to UK-based researchers, by project start year ..................................38
Figure 10 Estimated leverage effect of UK funding from FP7 and H2020 ................................................................ 42
Figure 11 Pillars and programmes in FP7 ....................................................................................................................50
Figure 12 Pillars and programmes in H2020 .............................................................................................................. 51
Figure 13 ERC grants with UK-based Principal Investigators .................................................................................... 54
Figure 14 Planned EU funding for the UK under the European Structural and Investment Funds (2014-2020) ... 55
Figure 15 EIB loans to the UK (signed 2007-2016), by sector. ................................................................................... 57
Figure 16 EIB university investments 2011-2016, by year of loan agreement ........................................................... 58

vi
List of Abbreviations
AAL
ABPI
ADS
AHSS
AIG
ALL
AMRC
ATI
BBI
BEIS
BERD
CEMAS
CERN
CS
COG
CORDA
DG CONNECT
DG DEVCO
DG EAC
DG HOME
DG GROW
DG SANTE
EC
ECSEL
ECU
EDCTP
EIB
EFPIA
Enpr-EMA
EMA
EMPIR
EMRP
EPSRC
ESRC
ERA-NET
ERIC
ERDF
ERC
ESA
ESF
ESFRI
ESIF
ESS
ESS HQ
ESPRIT
EU
EURAMET
FCH
FP7
GERD
GtR
Active and Assisted Living Research and Development Programme
Association of the British Pharmaceutical Industry
Archaeology Data Service
Arts, humanities and social sciences
European Research Council advanced grants
Acute lymphoblastic leukaemia
Association of Medical Research Charities
Aerospace Technology Institute
Bio-Based Industries
Department for Business, Energy and Industrial Strategy
Business Enterprise Research and Development
Centre of Excellence for Mobile Applications and Services
European organisation for Nuclear Research
Clean Sky
European Research Council consolidator grants
COmmon Research DAta Warehouse
Directorate-General for Communications Networks, Content & Technology
Directorate-General for International cooperation and Development
Directorate General for Education and Culture
Directorate-General for Migration and Home Affairs
Directorate-General for Internal Market, Industry, Entrepreneurship and SMEs
Directorate-General for Health and Food Safety
European Commission
Electronic Components and Systems for European Leadership
European Currency Unit
European and Developing Countries Clinical Trials Partnership
European Investment Bank
European Federation of Pharmaceutical Industries and Associations
European Network of Paediatric Research at the European Medicines Agency
European Medicine Agency
European Metrology Programme for Innovation and Research
European Metrology Research Programme
Engineering and Physical Sciences Research Council
Economic and Social Research Council
European Research Area Network
European Research Infrastructure Consortium
European Regional Development Fund
European Research Council
European Space Agency
European Social Fund
European Strategy Forum on Research Infrastructures
European Structural and Investment Fund
European Social Survey
European Social Survey headquarter
European Strategic Program on Research in Information Technology
European Union
European Association of National Metrology Institutes
Fuel Cells and Hydrogen
Seventh Framework Programme for Research and Technological Development
Gross domestic expenditure on research and development
Gateway to research
vii
GVA
H2020
HE
HEFCE
HEI
HES
HESA
ICT
IMI
IT
ITD
ITN
JPI
JTI
MSCA
MRC
MS
NACE
NC3Rs
NDPB
NIBEC
NPL
ONS
OTH
P2P
PUB
PRC
QALY
R&D
REC
REF
RISE
RIA
S2R
SAFE
SI
SIG
SME
TRL
UK
UOA
US
WEFO
Gross Value Added
Horizon 2020
Higher Education
Higher Education Funding Council for England
Higher Education Institutions
Higher or Secondary Education Establishments
Higher Education Statistics Agency
Information and Communication Technology
Innovative Medicine Initiative
Information technology
Integrated Technology Demonstrator
Innovative Training Network
Joint Program Initiative
Joint Technology Initiative
Marie Sklodowska-Curie Actions
Medical Research Council
Member State
Statistical classification of economic activities in the European Community
National Centre for the Replacement, Refinement and Reduction of Animals in Research
Non-Departmental Public Body
Nanotechnology and Integrated BioEngineering Centre
National Physical Laboratory
Office for National Statistics
Other
Public to public partnerships
Public bodies (excluding Research Organisations and Secondary or Higher Education Establishments)
Private for-profit entities (excluding Higher or Secondary Education Establishments)
Quality-Adjusted Life Year
Research and Development
Research organisations
Research Excellence Framework
Research and Innovation Staff Exchanges
Research and Innovation Actions
Shift2Rail
Stroke Alliance for Europe
International System of Units
European Research Council starter grants
Small and medium-sized enterprise
Technology Readiness Level
United Kingdom
Unit of Assessment
United States
Welsh European Funding Office

viii
Glossary of data sources
Short name Full name Description
CORDA [1] COmmon Research DAta Warehouse
Repository of the European Commission and portal for EU-funded research projects. The database contains data on applicants/proposals and signed grants/beneficiaries with regards to a specific EU Framework Programme for research and innovation.
In this study, we use it to analyse data from the 7th EU Framework Programme (FP7) (2007-2013) and the 8th EU Framework Programme (Horizon 2020) (2014-2020).
HES Higher or Secondary Education Establishments
A legal entity that is recognised by its national education system as a University or Higher or Secondary Education Establishment. It can be a public or a private body
PUB
Public bodies (excluding Research Organisations and Secondary or Higher Education Establishments)
Any legal entity established as a public body by national law or an international organisation. Excludes Research Organisations and Higher or Secondary Education Establishments*
PRC
Private for-profit entities (excluding Higher or Secondary Education Establishments)
Private, for-profit entities, including large, small or medium-sized enterprises and excluding Universities and Higher or Secondary Education Establishments
REC Research organisations A legal entity that is established as a non-profit organization and whose main objective is carrying out research or technological development
OTH Other organisations Any entity not falling into one of the other four categories
SME Small or medium-Sized Enterprise
A micro, small or medium-sized enterprise within the meaning of Recommendation 2003/361/EC. Necessary (but not sufficient) conditions for being an SME are a number of employees smaller than 250 and an annual turnover not exceeding €50 million, and/or an annual balance sheet total not exceeding €43 million.
GtR Gateway to Research
GTR is an open source database provided by Research Councils UK (RCUK) to enable users to search and analyse information about publicly funded research. It provides information about data from the main providers of publicly funded competitive grants, including each of the UK’s seven grant-awarding research councils, Innovate UK and the National Centre for the Replacement, Refinement and Reduction of Animals in Research (NC3Rs). It provides information from 2006 onwards about publications, people, organisations and outcomes related to the funded research
HESA [2] Higher Education Statistics Agency
HESA collects quantitative information from all public (and some private) higher education institutions in the UK. It publishes data about the institutions’ finances, including a breakdown of the income of each higher education provider by source (e.g. from ‘EU government bodies’) and by ‘cost centre’ (i.e. academic departments/disciplines)
Income from EU government bodies
Includes all research grants and contracts income from all government bodies operating in the EU, which includes the European Commission, but excludes bodies in the UK, see HESA definitions of research grants and contracts
Income from UK government bodies
Includes income from (1) the UK Research Councils, the Royal Society, British Academy and (2) UK central government bodies, local authorities, health and hospital authorities, see HESA definitions of research grants and contracts
Sources: [1] European Commission definitions of types of organisations, https://ec.europa.eu/programmes/horizon2020/sites/horizon2020/files/horizon_2020_first_results.pdf, [2] HESA definitions of research grants and contracts (https://www.hesa.ac.uk/support/definitions/finances

1
Executive summary
This report
The United Kingdom's (UK) National Academies — the Academy of Medical Sciences, the British
Academy, the Royal Academy of Engineering and the Royal Society — commissioned Technopolis to
provide an in-depth understanding of the role of EU funding within the UK research and innovation
landscape.
The UK’s withdrawal from the European Union (EU) will have significant implications for UK research
and innovation. The overall magnitude of funding flowing from EU programmes to UK research and
innovation within universities and companies is well documented, but there is less understanding about
the role of EU funding across different parts of the UK research and innovation landscape at a more
granular level.
The evidence and analysis undertaken reflect the importance of EU funding across all academic
disciplines, industrial sectors, organisation types, and across the whole innovation pipeline.
The report brings together available evidence from a combination of secondary data sources and primary
research conducted through a programme of targeted interviews.
EU research and innovation funds
The EU provides funding for research and innovation through three main sources: (i) the EU Framework
Programmes for research and innovation, (ii) the European Structural and Investment Funds (ESIF),
specifically funding for research and innovation under the European Regional Development Fund
(ERDF) and (iii) loans from the European Investment Bank (EIB).
Together, the EU Framework Programmes for research and innovation and ERDF have provided UK
organisations with around €9bn in grants across the seven-year term of the previous programming
period (2007-2013) (€7bn and €1.9bn respectively).
In the current programming period, these two sources of EU funds have provided UK organisations with
income of circa €1.1bn a year, which is a substantial figure in absolute terms and a meaningful
contribution to the total national research effort: it amounts to more than 10% of total government
support for UK research and innovation and is around 5% of UK gross domestic expenditure on R&D
(GERD) (which includes public and private funding).
Additionally, we estimate that the European Investment Bank (EIB) has provided loans for research and
innovation-related activities to UK organisations for a value of €5.9bn in the period 2007-2016,
including €2.8bn for UK universities and knowledge transfer services.
EU funding of UK academia
UK higher education institutions (HEIs), collectively report around £725m in research grant income
from EU government bodies in 2014/15, according to data provided by the Higher Education Statistics
Agency (HESA). HESA data ‘Income from EU government bodies’ incorporates all research grants and
contracts income from all government bodies operating in the EU, including the European Commission
as well as bodies outside EU Institutions. It is not possible to fully disentangle funding from the EU from
other sources of funding within the geographic area that the EU covers (e.g. individual Member States).
However, this data remains as the best proxy available to investigate the importance of EU funds to UK
HEIs.
This is 12% of UK HEIs’ £5.9bn total income from research grants and contracts, or around 25% of the
£2.75bn in research grants provided by the UK government bodies (including Innovate UK and the

2
seven grant awarding research councils)1. These figures relate to research grants and contracts only and
exclude the £1.8bn in quality-related research (QR) income from the UK Funding Councils. Research
grant income from EU government bodies still constitute more than 9% of total HEI income, even when
QR funding is included.
Funding by academic disciplines
The HESA data shows that in 2014/15 UK HEIs reported research grant income from EU government
bodies, in every one of the agency’s 40 disciplinary categories or cost centres, from Clinical Medicine
(£119m) to Sports Science (£0.4m). This shows the breadth of academic engagement in EU
programmes.
When analysing HESA data we explore two different perspectives: first, we look at the absolute value of
the research grant income from EU government bodies, and second, we look at relative value of research
grant income from EU government bodies with respect to research grant income from all sources. This
provides a different list of universities and disciplines that are important to consider: those who may
find it more difficult to fully replace a potential reduction in EU funds (as defined above) given its sheer
volume, and those for whom this volume (even if relative small) represents a high share of the total value
of research grant income and consequently have a higher level of dependency.
The analysis of absolute values show that, across disciplines, research grant income from EU
government bodies is concentrated, with the top 10 disciplines accounting for more than 70% of the
£725m total, while the bottom 10 disciplines account for around £20m or 2%.
The natural and physical sciences dominate the figures, with HEIs reporting around £366m in EU
research income (50%) for the top five subjects (by income) combined. These comprise Clinical
medicine (£119m), Biosciences (£90m), Physics (£55m), Chemistry (£54m) and IT (£46m).
In terms of relative importance (i.e. research grant income from EU government bodies as a share of
total research grant income from all sources) we find that there is a high degree of variability across
disciplines, ranging from Archaeology, which received 38% of its research income from the EU, to sports
science, which received only 4% from the EU.
The arts, humanities and social sciences (AHSS) feature prominently in the list of 10 most dependent
subjects, even though they typically account for smaller volumes of EU research income in absolute
terms. However, it is not exclusively so, with IT systems (30%) and Chemistry (23%) also featuring in
the top 10. The analysis shows 15 of 40 subjects have dependency ratios of 20% or higher, of which 11
are AHSS subjects. The predominance of AHSS subjects partly reflects their greater reliance on
institutional funding, as compared with the natural and physical sciences, and QR funding is outside the
scope of these HESA statistics on research grant income. Nevertheless, the analysis suggests these
subject areas may be amongst the most at risk from any change in the terms of access to EU funds going
forward.
Funding to HEIs
In terms of absolute values, the distribution of research income from EU government bodies is heavily
skewed across institutions, with the top 10 HEIs accounting for around £340m (47%) of the total £725m
in research income from EU government bodies in 2014/15 and the top 20 accounting for around £476m
or 66% of the total (according to HESA data). The top 10 HEIs each secured income of between £60m
and £18M, and are dominated by the UK’s larger, research-intensive universities. These funds are widely
distributed across institutions, however, with more than 100 HEIs securing £0.5m or more in research
income from EU government bodies in 2014/15.
1 In our analysis, we have joined together two categories of research grant income provided by HESA data: 'Research Councils, Innovate UK and the national academies' and 'UK central government bodies, local authorities, health and hospital authorities'. We called those two categories research grant and contract income from 'UK government bodies'.

3
Looking at the top 10 HEIs based on the relative importance of research grants income, we find that the
top 10 HEIs comprise universities from across England, Northern Ireland and Wales. All of which have
dependency ratios that are 20% or higher.
From this perspective, the country’s larger, research intensive universities enjoy high levels of research
income from EU government bodies that would be difficult to replace given the sheer volume of those
funds, however, they are less dependent on this flow of funds as compared with many of the country’s
mid-sized institutions, with more than 40 having dependency ratios above 20%.
EU funding and industry
EU Framework Programmes for research and innovation (‘Framework Programmes’) and ERDF both
provide substantial volumes of direct funding to UK businesses, to support their in-house research and
innovation activities. The levels of EU funding are broadly similar for both programmes, albeit the
ERDF programmes are focusing on capital investments in support of SMEs and innovation, while
Horizon 2020 places greater emphasis on pre-competitive research and a greater proportion of its
support flows to larger firms (approximately 34%).
The current UK budget for ERDF 2014-2020 indicates that around €1bn will be invested with the private
sector over the life of the programme, which is around two thirds of the total €1.5bn allocated to Priority
Axis 1, on research and innovation. The planned budget anticipates that around €860m (60%) will be
spent with SMEs. That will produce an average annual income of around €140m for firms of all sizes
and around €120m for SMEs (85%).
Additionally, UK industry has secured around €500m in EU funding from Horizon 2020 (the 8th EU
Framework Programmes), up to 2015, or around £190m a year, based on CORDA data. The equivalent
industry figure for the whole of the 7th EU Framework Programmes (FP7) was around £1bn or around
£140m a year (also based on CORDA data). As with the ERDF programme, the majority of funding from
the Framework Programmes to UK industry flows to SMEs, which secured around £660m (€805m) in
FP7, as compared with large firms, which secured around £350m (€435m).
Total income from the Framework Programmes for UK industry is a small fraction of UK Business
Expenditure on R&D (BERD), equivalent to approximately 0.9% of total expenditure during the FP7
programming period (2007-2013). However, UK BERD – as in most countries – is overwhelmingly
dominated by large enterprises, which account for almost 97% of the total Business expenditure on R&D.
This figure masks the importance of the Framework Programmes to smaller firms. Indeed, EU industry
research income is a significant contributor to UK SMEs’ research capacity, equivalent to around 17% of
UK BERD carried out by SMEs.
Moreover, the combined EU funding for industry compares favourably with the scale of investment of
Innovate UK, the country’s national innovation agency, which invested around £516m in 2015/16.
There are several hundred companies (including SMEs and large companies) that have participated in
multiple projects and multiple EU Framework Programmes, and derive many non-monetary benefits
from their involvement, through strategic collaboration, competitor monitoring, agenda setting and
market appraisal.
More specifically, we considered the extent to which EU funding has enabled UK enterprises to access
new markets in Europe and internationally. Various evaluations of the EU Framework Programmes for
research and innovation have looked at this question and reached a strongly positive conclusion. Several
of the Commission’s external evaluations of FP7 conclude that a small majority of all business
participants (50-60%), not just UK firms, report improved access to other European markets as a result
of their participation in the programme.
EU funding across the UK regions
EU funds are supporting research and innovation activity across the UK. The EIB is providing long-
term, low-interest loans to universities and research institutes across the country, in England, Northern

4
Ireland, Scotland and Wales, supporting capital projects ranging from the relocation of the University
of Ulster to Belfast City Centre and the expansion of the new research facilities at Swansea University’s
new Bay Campus through to the development of UCL’s Bloomsbury Campus in London.
European Structural Funds are only invested in eligible regions, so are spent in weaker regional
economies to a greater extent than Horizon 2020 funds. The current ERDF 2014-2020 programme is
expected to provide research and innovation income to regions in each of the UK’s four nations. England
accounts for the largest share of the €1.5bn pot, with around €816 million of the total (about 55%), with
Wales expected to be awarded around €388m (26%), Scotland €158m (11%) and Northern Ireland
accounting for around €113 million (8%).
The picture changes dramatically when one adjusts these figures in line with the countries’ populations,
with Wales expected to achieve €125 per capita. That is more than five times the UK average (€23 per
capita), and almost 10 times the figure for England (€15 per capita). The figure for Northern Ireland
(€60 per capita) is also markedly higher than the UK average. These data underline the importance of
European Structural Funds for Wales in particular.
In the case of Horizon 2020, the geographical distribution shows England dominates the flow of funds
in absolute terms, with more than €2.2 billion in income, or 85% of the UK total until 2016, based on
CORDA data. Wales (€55m) and Northern Ireland (€43m) have achieved EU income levels two orders
of magnitude lower than England and an order of magnitude lower than Scotland (€296m).
In proportionate terms, however, Scotland is achieving a higher level of income per capita (€55 per
capita compared with a UK average of €40) than all of the other nations.
Dropping down a level, to the three nations and nine English regions, we find a further concentration of
Horizon 2020 income around the south and east of England. Greater London dominates the flow of
funds (€633m until 2016). Other UK regions that receive a large proportion of total funding are the
South East England, the East of England, Scotland and the South West of England. In all regions,
universities are the primary recipients of the total flow of Horizon 2020 income. Private companies are
major beneficiaries too, especially in Greater London, the South East of England and the East of
England.
Wales and Northern Ireland depend to a much greater extent on ERDF as compared with Horizon 2020,
for the supply of funds for regional research and innovation activities, which reflects the logic of the
Structural Funds to a large extent and underlines its complementarity with Horizon 2020, which follows
established capacity to a greater extent.
We further explore the issue of EU funding across the UK regions and UK HEIs using HESA statistics.
As discussed above, HESA data combine income from several sources within the EU, and cannot be split
out to reveal the particular level of income attributable to Horizon 2020 or the European Structural
Funds or any other source. From these aggregate figures, however, we can see that all regions are
benefiting from substantial flows of research income from EU government bodies.
For 2014/15, we find that HEIs in Greater London secured the greatest volume of research income from
EU government bodies (£168m) of any of the 12 UK regions, followed by the South East, Scotland, and
the East of England.
When we consider research income from EU government bodies as a share of all HEI research income,
we find a narrow spread across the regions, suggesting that much of the difference in absolute income
is explained by differences in the number and scale of the HEIs located in each region: the individual
regional dependency ratios range from 11% to 17%, and average around 13%. The regions with clusters
of HEIs that are relatively more dependent on EU funding are Wales (17%), the West Midlands (16%),
the South West (15%) and Yorkshire and the Humber (15%).

5
Research activities uniquely supported by the EU
The EU programmes described above support several important types of research activity in the UK that
are not well-funded through national research and innovation programmes.
EIB and ERDF funding supports investments in research and innovation facilities and capacities, and
offers opportunities that are not currently available through other channels. The majority of funded
activities - with the exception of ERDF INTERREG - are implemented nationally and could, in principle,
be funded through national programmes.
Horizon 2020 in turn is unique, and is the only international research and innovation programme of
scale anywhere in the world. Other international research programmes are orders of magnitude smaller
and often more narrowly based geographically and/or thematically. Major intergovernmental science
programmes, like CERN or ESA, do have annual budgets running in to the billions, however, the very
great majority of this expenditure is committed to the operation and maintenance of the facilities and
programmes, and their calls for proposals are very much fewer and very much smaller than those run
by Horizon 2020.
International cooperation is part of the programme’s DNA, which is absolutely not the case for the very
great majority of national research and innovation programmes.
In addition, the EU Framework Programmes for research and innovation – provides UK-based
organisations with access to several types of research instrument that is not available nationally,
including: (i) large collaborations and (ii) large-scale investigator awards.
EU Framework Programmes for research and innovation have provided substantial funding for a limited
number of large-scale partnerships. The largest of these types of initiatives – Joint Technology
Initiatives (JTIs) and so-called Article 185 actions – involve very large budget commitments from the
EU, as well as other partners, which run into the billions collectively, and dwarf the very great majority
of national collaborations here in the UK or elsewhere. As a case in point, the Innovative Medicines
Initiative (IMI) is expected to invest more than €3.3 billion in the 10-years from 2014-2024. The Clean
Sky public-private partnership is focusing on improving the environmental performance of aircraft, and
is expected to mobilise a budget of around €5.6 billion in the 12-year period 2008-2020. The UK
government has launched several large-scale collaborations in sectors such as Energy and Aerospace
but these are predominantly national initiatives and do not have the international reach of Horizon
2020.
The Framework Programmes are also a unique source of personal grants and fellowships supporting
mobility, career development and frontier research. The European Research Council (ERC), conceived
during the course of FP6 and launched in FP7, has established itself as a pre-eminent funder of
investigator-driven research and the UK has been singularly successful in attracting ERC grants, as well
as awardees from throughout Europe and elsewhere in the world. During FP7, the UK won 22.4% of all
grant funding from the ERC. Marie Skłodowska-Curie Actions (MSCA) similarly provides unique
support for mobility between countries, sectors or disciplines. ERC grants and MSCAs account for about
half of the combined value of fellowships and investigator awards given to UK researchers and–outside
of the medical sciences–ERC investigator awards are unique in the scale and scope of support they
provide.
There are various other instruments that are unusual and have proved particularly valuable to UK
research interests, including the Commission’s support for research infrastructure, which has
systematised the process by which roadmaps are developed and facilities are prioritised and ranked. It
has also provided additional funds for the development and modernisation of facilities in return for
enhanced access rights for all EU researchers or the creation of more independent, sustainable
institutions through the European Research Infrastructure Consortium (ERIC).
EU funding and leverage
Each of the three EU funding programmes provides a degree of financial leverage, by design.

6
Where the EIB provides loans to finance research and innovation schemes, its agreement is often an
endorsement of the proposals and can be the key to attracting other investors. These loans can cover up
to 50% of the total cost, however, on average the EIB share is about one-third of the total funding
required. From this simple financial perspective, the EIB’s provision of around €5bn in loans to various
UK universities and companies over the past 10 years would have been matched by additional
investments of around €10bn.
The ERDF rules require national co-financing of all supported projects, from either public or private
sources. The EC co-financing rates are typically 75% or 85% of the total budget, depending upon the
location of the project or the partners involved, with the higher level of support available to research and
innovation actions based in the ‘weakest’ regions economically. Importantly, those funds must be
additional to, and not replace, existing national funding.
In terms of the EU Framework Programmes for research and innovation, specifically FP7 and Horizon
2020, the UK has secured around €9.6bn in EC contributions and €2.3bn in contributions from the
project partners themselves. In addition to the formal requirements for co-financing by project
participants, the literature suggests that public R&D expenditure, such as the EU Framework
Programmes, has a significant ‘crowding-in’ effect, encouraging further private investment in R&D
outside the programme.
The European Commission has funded several large scale econometric studies working with FP7
projects, which have estimated this rate of additionality at 0.74, that is for every €1 spent on R&D by the
European Commission, a further €0.74 will be invested by companies or other organisations in the wider
EU economy. The rate was determined at the EU level; however, it is not unreasonable to assume that
the effect would be as strong or possibly stronger, in an open and highly competitive economy like the
UK. Applying this rate to the UK participation in FP7 and Horizon 2020 (to date), we arrive at an
estimate of the total research and innovation expenditure of €16.6bn (174% of €9.6bn).

7
1 Introduction
1.1. This report
The United Kingdom’s (UK) National Academies — the Academy of Medical Sciences, the British
Academy, the Royal Academy of Engineering and the Royal Society — commissioned Technopolis to
provide an in-depth understanding of the role of EU funding within the UK research and innovation
landscape.
The UK’s withdrawal from the European Union (EU) will have significant implications for UK research
and innovation. The overall magnitude of funding flowing from EU programmes to UK research and
innovation within universities and companies is well documented, but there is less understanding about
the role of EU funding across different parts of the UK research and innovation landscape at a more
granular level.
The evidence and analysis undertaken reflect the importance of EU funding across all academic
disciplines, industrial sectors, organisation types, and across the whole innovation pipeline.
1.2. Aim of the report
This report brings together available evidence from literature and data sources at UK and EU levels to
i) provide a better understanding of the role of EU funding in the UK research and innovation landscape,
and ii) identify potential dependencies and risks for UK research and innovation related to the UK’s
departure from the EU. The study attempts to make the best possible use of available secondary data
and any limitations, intrinsic to those sources of information, are documented in the report.
The report is structured as follows:
• Section 2 introduces the main EU sources of funding for UK research and innovation, including the
EU Framework Programmes for research and innovation, relevant parts of the European Structural
and Investment Funds (ESIF), and the European Investment Bank.
The following three sections detail where and to whom EU research and innovation funding is awarded
in the UK:
• Section 3 addresses the role of EU funding for UK Higher Education Institutions, analysing the
proportion of EU funding by academic disciplines and institutions and looks at evidence of impact
of university research from EU-funded research.
• Section 4 analyses the role of EU funding for UK companies, looking at the distribution of funding
according to sector, company size, Technology Readiness Level and thematic priorities, and explores
the connection between EU funding and access to new markets.
• Section 5 analyses the geographical distribution of EU funding across nations and regions in the UK.
The concluding two sections look closer at how EU research and innovation funding is used:
• Section 6 identifies specific types of research and innovation activities in the UK that are uniquely
or predominantly funded by the EU. These include large collaborations and partnerships, funding
for specific career stages and personal awards.
• Section 7 looks beyond the individual grants and analyses how EU funding leverages funding from
other sources.
1.3. Methodology
The study was carried out using a mixed methods approach employing both quantitative data analysis
and qualitative methods and included consultation with key stakeholders. The study’s main elements
are described below.

8
1.3.1. Desk research
A review of relevant documents, evaluations and literature that contain evidence on the relevance and
importance of EU R&D funding for the UK research and innovation system.
1.3.2. Interviews and stakeholder consultation
Key stakeholders from research organisations, funding bodies, charities and industry associations have
been consulted for the study. They were invited to give their view on the main study questions and to
provide advice on relevant sources of data and other evidence. A list of contributors is given in Appendix
A. A stakeholder meeting took place on the 25th January 2017 and interviews were conducted by
telephone during February and March 2017.
1.3.3. Quantitative and qualitative data analysis
A number of databases were analysed and secondary sources used as part of this study are listed below.
With reference to EU databases, the analysis focuses on describing EU funding for research and
innovation in the UK and covers the period of the EU’s two latest Framework Programmes for research
and innovation, FP7 and Horizon 2020, i.e. from 2007 until the present.
• CORDA (COmmon Research DAta Warehouse): CORDA is a repository of the European
Commission and portal for EU-funded research projects. The database contains data on
applicants/proposals and signed grants/beneficiaries with regards to a specific EU Framework
Programme for research and innovation. This data is provided in Euros and have not been converted
to pounds–except in cases where direct comparisons are made to UK sources–to avoid generating
discrepancies with publicly available information (such as the estimates of participation in the EU
Framework Programme provided by the Department for Business, Energy and Industrial Strategy
(BEIS)).
• European Structural and Investment Funds data: Data on European Structural and
Investment Funds, including the European Regional Development Fund (ERDF), is published by
the European Commission. UK regions publish operational programmes that provide more insight
into each region’s strategy and research and innovation budget.
• European Investment Bank (EIB): The European Commission publishes information on
agreements signed by the EIB, including information on the project name and dates, sector and loan
amount.2
• Gateway to Research (GtR): GtR is an open source database provided by Research Councils UK
(RCUK) to enable users to search and analyse information about publicly funded research. It
provides information about data from the main providers of publicly funded competitive grants,
including each of the UK’s seven grant-awarding research councils, Innovate UK and the National
Centre for the Replacement, Refinement and Reduction of Animals in Research (NC3Rs). It
provides information from 2006 onwards about publications, people, organisations and outcomes
related to the funded research.
• Research Excellence Framework (REF) impact case studies: The REF impact case studies
were submitted by UK Higher Education Institutions to the UK’s last national research evaluation
exercise, carried out in 2013 and 2014. About 7,000 impact case studies were submitted to the REF.
The information provided in the case studies is used to identify examples of how EU funding has
underpinned UK research and has led to economic and societal benefits.
• Higher Education Statistics Agency (HESA) data: HESA collects quantitative information
from all public (and some private) higher education institutions in the UK. It publishes data about
the institutions’ finances, including a breakdown of the income of each higher education provider
by source (e.g. from ‘EU government bodies’) and by ‘cost centre’ (i.e. academic
departments/disciplines). Section 3 provides a description of the different categories of income
included in the HESA data, including ‘Income from EU government bodies’. This category
2 http://www.eib.org/projects/loan/list/index.htm

9
incorporates all research grants and contracts income from all government bodies operating in the
EU, including the European Commission as well as bodies outside EU Institutions.
As such, the category provides an approximation to the value of ‘EU funding’ for UK HEIs. However,
it is not possible to fully disentangle funding from the EU from other sources of funding within the
geographic area that the EU covers (e. g. individual Member States). In the absence of more accurate
data, this study utilises the HESA classification of ‘income from EU government bodies’ to reflect as
closely as is possible with the data available what funding flows from the EU could look like to UK
HEIs where no other data is available to do so.
Other data sources used include data from the Wellcome Trust, which contains all projects funded in
the UK since 2000, and publicly available data from the ONS on research and development
expenditures.
1.3.4. Case studies
A series of short case studies were prepared to complement the statistics and better illustrate the role of
EU funding in particular aspects of the UK research and innovation landscape. The case studies were
based on interviews and desk research. The case studies provide a more in-depth consideration of
dependencies in selected subjects, infrastructures, types of actor and nation.
Extracts of those case studies have been brought forward to the main body of this report to complement
the overall, high-level exposition of arguments with some illustrative and concrete examples.

10
2 Sources of EU funding for UK research and innovation
Introduction
The EU provides funding for research and innovation through three main sources: (i) the EU Framework
Programmes for research and innovation, (ii) the European Structural and Investment Funds (ESIF),
and (iii) loans from the European Investment Bank (EIB).
Together, the EU Framework Programmes and ESIF have provided UK organisations with around €9bn
in grants across the seven-year term of the previous programming period (2007-2013).
In the current programming period, these two sources of EU funds have provided UK organisations with
income of circa €1.1bn a year, which is a substantial figure in absolute terms and a meaningful
contribution to the total national research effort: it amounts to more than 10% of total government
support for UK research and innovation and is around 5% of UK Gross Expenditure on R&D (GERD)
(which includes public and private funding).
Additionally, we estimate that the European Investment Bank (EIB) has provided loans for research and
innovation-related activities to UK organisations for a value of €5.9bn in the period 2007-2016.
Table 1 Overview of EU funding for UK research and innovation
Total value (in
EUR million)
Programming period
Annual (estimate)
Total value (in EUR million)
Programming period
Annual (estimate)
EU Framework Programme
€7.0bn 2007-2013
(FP7) €1.0bn €2.6bn
2014-2016* (Horizon 2020)
€0.9bn
European Structural and Investment Funds (ESIF) (Priority Area 1)
€ 1.9bn 2007-2013 €0.3bn €1.5bn 2014-2020
(Commitments) €0.2bn
European Investment Bank (EIB)
€5.9bn 2007-2016 €0.6 -- -- --
Source: *Horizon 2020 full programming period is 2014-2020, but this report presents data up until 2016.
The EU Framework Programmes for research and innovation
The EU Framework Programmes are the European Commission’s primary vehicle for supporting
research and innovation. They provide funding support to promote the achievement of the following
objectives:
• Strengthening Europe’s position in global science, through support for high quality research
• Reinforcing industrial leadership in innovation, including major investment in key technologies,
greater access to capital and support for SMEs
• Helping to address major societal challenges such as climate change, developing sustainable
transport and mobility, making renewable energy more affordable, ensuring food safety and
security, or coping with the challenge of an ageing population
The Framework Programmes are composed of a number of pillars and specific programmes with more
specific purposes. The two most recent EU Framework Programmes, FP7 and Horizon 2020 are
described in more detail in Appendix C.

11
The amount of funding allocated annually through each successive EU Framework Programme has
increased steadily over the years, from ECU3 593m in 1984 to €11.1bn in 2013 (current prices),4 and is
set to continue to increase every year until 2020. The Seventh Framework Programme, FP7 (2007-2013)
had a budget of €50.5 billion, which represented a significant increase compared with the Sixth
Framework Programme, FP6. With the Eighth and current Framework Programme, Horizon 2020
(2014-2020), the budget has further increased nearly 50% compared to FP7 at €74.8bn over the
programming period.5
In the first three years of Horizon 2020, which will run from 2014-2020, UK organisations secured funds
for a value of €2.6bn. There is a natural time lag in the bidding a contracting process, which may see
that three-year figure rise substantially in the final accounts.
As shown in Figure 1 below, higher or secondary education establishments receive by far the largest
share of EU funding in the UK whereas, in other countries, other types of research organisations
normally receive a much higher share. This is an important starting point to note in the analysis of
dependencies on EU funding within the UK research and innovation system.
Figure 1 Value of EC Contribution in Horizon 2020 to the UK, by type of organisation
Source: CORDA
European Structural and Investment Funds
The European Structural and Investment Funds (ESIF) support economic development in regions
across the EU with the aims of reducing inequalities and increasing cohesion. The UK receives funding
from two of the three main funds under ESIF: the European Social Fund (ESF) and the European
Regional Development Fund (ERDF).6 In addition, the UK receives funding from several ‘territorial
collaboration’ projects under ERDF, a.k.a. INTERREG, which includes some research and innovation
activities.
The current UK budget for the research and innovation priority (priority axis 1) of the European
Regional Development Fund (ERDF) is around €2.5bn. This budget anticipates €300m to €400m a year
3 The European Currency Unit (ECU) was replaced by the Euro in 1999.
4 European Commission (2013), Development of Community research – commitments 1984-2013 (available at: https://ec.europa.eu/research/fp7/pdf/fp-1984-2013_en.pdf#view=fit&pagemode=none)
5 The budget for Horizon 2020 was cut from € 77bn to € 74.8bn in 2015 in order to establish the European Fund for Strategic Investment (ESFI) (see https://era.gv.at/object/news/1876)
6 SPERI (2016), UK regions and European structural and investment funds, Sheffield Political Economy Research Institute British Political Economy Brief No. 24.
12
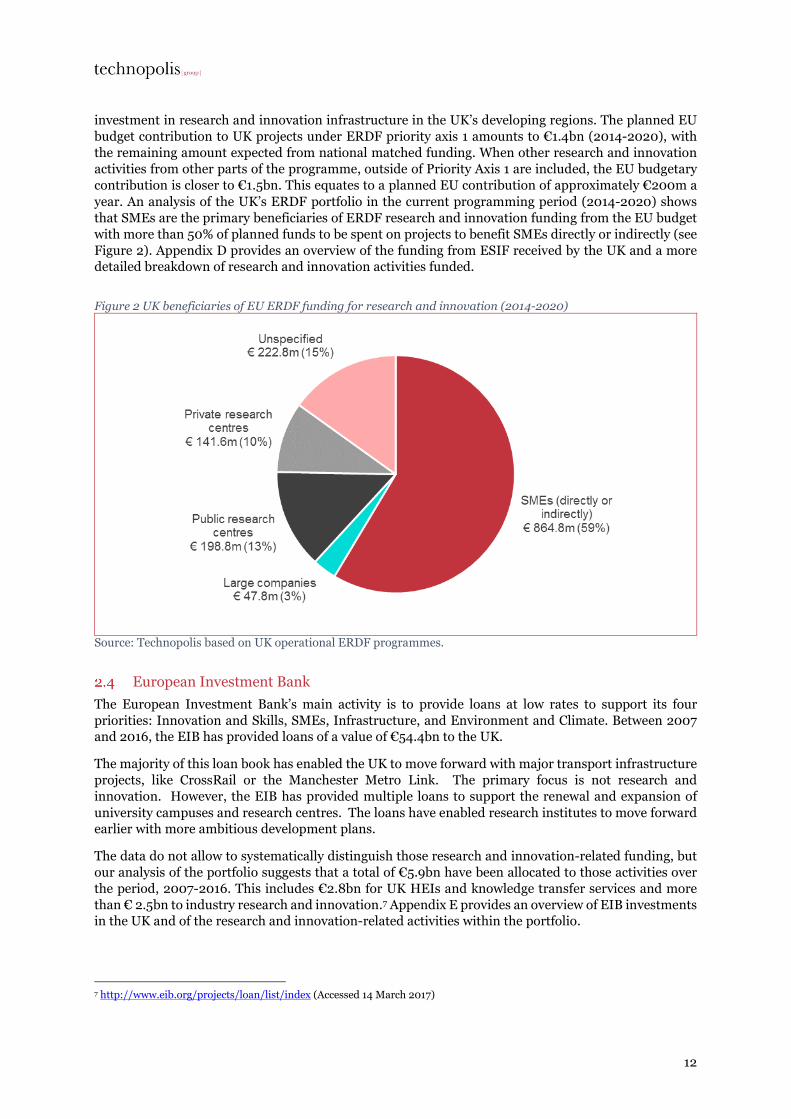
investment in research and innovation infrastructure in the UK’s developing regions. The planned EU
budget contribution to UK projects under ERDF priority axis 1 amounts to €1.4bn (2014-2020), with
the remaining amount expected from national matched funding. When other research and innovation
activities from other parts of the programme, outside of Priority Axis 1 are included, the EU budgetary
contribution is closer to €1.5bn. This equates to a planned EU contribution of approximately €200m a
year. An analysis of the UK’s ERDF portfolio in the current programming period (2014-2020) shows
that SMEs are the primary beneficiaries of ERDF research and innovation funding from the EU budget
with more than 50% of planned funds to be spent on projects to benefit SMEs directly or indirectly (see
Figure 2). Appendix D provides an overview of the funding from ESIF received by the UK and a more
detailed breakdown of research and innovation activities funded.
Figure 2 UK beneficiaries of EU ERDF funding for research and innovation (2014-2020)
Source: Technopolis based on UK operational ERDF programmes.
European Investment Bank
The European Investment Bank’s main activity is to provide loans at low rates to support its four
priorities: Innovation and Skills, SMEs, Infrastructure, and Environment and Climate. Between 2007
and 2016, the EIB has provided loans of a value of €54.4bn to the UK.
The majority of this loan book has enabled the UK to move forward with major transport infrastructure
projects, like CrossRail or the Manchester Metro Link. The primary focus is not research and
innovation. However, the EIB has provided multiple loans to support the renewal and expansion of
university campuses and research centres. The loans have enabled research institutes to move forward
earlier with more ambitious development plans.
The data do not allow to systematically distinguish those research and innovation-related funding, but
our analysis of the portfolio suggests that a total of €5.9bn have been allocated to those activities over
the period, 2007-2016. This includes €2.8bn for UK HEIs and knowledge transfer services and more
than € 2.5bn to industry research and innovation.7 Appendix E provides an overview of EIB investments
in the UK and of the research and innovation-related activities within the portfolio.
7 http://www.eib.org/projects/loan/list/index (Accessed 14 March 2017)

13
Other funds
EU funding for research and innovation-related activities are available through various other routes,
such as:
• The ERASMUS Plus programme: the Directorate-General for Education and Culture (DG EAC)
provides substantial funding for Europe’s universities to support high levels of student cross-border
mobility, with some small spill-overs into research and innovation activities.
• The COSME programme: implemented by the EC Directorate-General for Internal Market,
Industry, Entrepreneurship and SMEs (DG GROW) and the European Agency for SMEs (EASME),
this programme provides Europe’s small businesses with access to a wide range of business support
measures, encompassing a number of business development functions, from access to finance, to
support for internationalisation (exporting) and various aspects of entrepreneurship. The
programme has a number of overlaps (complementarities) with the innovation components of both
Horizon 2020 and the ESIF.
• Funding from other sectoral Directorate-Generals outside of the EU Framework Programme: For
example, the Directorate-General for Health and Food Safety (DG SANTE) funds a health research
programme, which does produce some research income for UK organisations involved with issues
like Food Safety or public health. There are similar policy-related research funds in several other
DGs, such as the Directorate-General for Migration and Home Affairs (DG HOME), e.g. security
research, or the Directorate-General for International Cooperation and Development (DG DEVCO),
e.g. research relating to international development issues. The UK is an active contributor within
all of these programmes
• Funding from the European Investment Fund (EIF), for example venture capital for SMEs.
These programmes, although relevant, have not been considered for the purpose of this study as they
are smaller in scale.

14
3 The role of EU funding across disciplines and institutions in UK
academia
Introduction
This chapter presents evidence of funding from EU government bodies allocated to different disciplines
and UK Higher Education Institutions (HEIs). The volume of funding from EU government bodies and
the proportion of funding from EU government bodies over total funding allocated to academia is
compared to that allocated by funding from UK government bodies.
The analysis is based on data from the Higher Education Statistics Agency (HESA), the UK agency
responsible for the collection, analysis and dissemination of quantitative information about higher
education in the UK, to which all UK HEIs report on their income in relation to academic cost centres.
Academic cost centres correspond to different disciplines (see Appendix B for an overview of all
academic cost centres)8. The HESA data uses the following classification of income for research grants
and contracts9:
• ‘Income from EU government bodies’, which includes all research grants and contracts income from
all government bodies operating in the EU, which includes the European Commission, but excludes
bodies in the UK’. As mentioned above, this category incorporates all income from research grants and contracts from
all government bodies operating in the EU, including the European Commission as well as bodies
outside EU Institutions. As such, the category provides an approximation of the value of ‘EU
funding’ for UK HEIs. This is, to our knowledge, the best proxy available to analyse the dependency
of UK HEIs (and individual disciplines to EU funding).
• ‘BEIS Research Councils, the Royal Society, British Academy and the Royal Society of Edinburgh’,
which includes all research grants and contracts income from Research Councils sponsored by the
Department for Business, Energy and Industrial Strategy (BEIS), the Royal Society, British
Academy and the Royal Society of Edinburgh, returned to HESA under the following categories:
- Biotechnology and Biological Sciences Research Council (BBSRC)
- Medical Research Council (MRC)
- Natural Environment Research Council (NERC)
- Engineering and Physical Sciences Research Council (EPSRC)
- Economic and Social Research Council (ESRC)
- Arts and Humanities Research Council (AHRC)
- Science and Technology Facilities Council (STFC)
- Other (i.e. sponsored research grants and contracts income not included above).
Income from the other National Academies are likely reported under this heading, whether
specifically mentioned or included under ‘other’
• ‘UK central government bodies, local authorities, health and hospital authorities’, which includes all
research grants and contract income from UK central government bodies, UK local authorities and
UK health and hospital authorities, except Research Councils and UK public corporations. This
includes government departments and other organisations (including registered charities) financed
from central government funds. Research grants and contracts from non-departmental public
bodies (NDPBs) such as the British Council are also included in this source of income.
8 https://www.hesa.ac.uk/support/documentation/cost-centres/2012-13-onwards
9 https://www.hesa.ac.uk/support/definitions/finances
15
These data relate to research grants only and exclude the £1.8bn in quality-related research (QR) income
from the UK Funding Councils.
Additionally, income is classified under UK-based charities, UK central government tax credits for
research and development expenditure, UK industry, commerce and public corporations, other EU and
international sources, and other sources.
In this study, we compare the category ‘income from EU government bodies’ with income from ‘UK
government bodies’ (which is a combination of income from ‘the Research Councils, the Royal Society,
British Academy’ and ‘UK central government bodies, local authorities, health and hospital authorities’,
as described above).
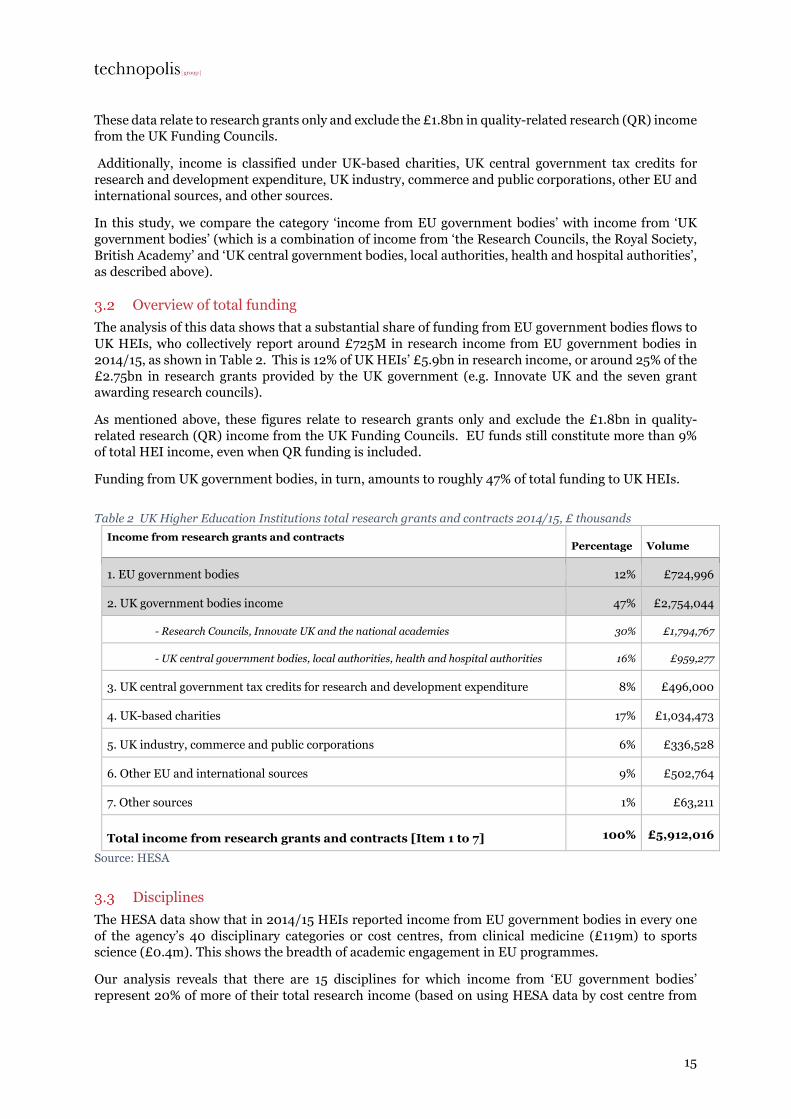
Overview of total funding
The analysis of this data shows that a substantial share of funding from EU government bodies flows to
UK HEIs, who collectively report around £725M in research income from EU government bodies in
2014/15, as shown in Table 2. This is 12% of UK HEIs’ £5.9bn in research income, or around 25% of the
£2.75bn in research grants provided by the UK government (e.g. Innovate UK and the seven grant
awarding research councils).
As mentioned above, these figures relate to research grants only and exclude the £1.8bn in quality-
related research (QR) income from the UK Funding Councils. EU funds still constitute more than 9%
of total HEI income, even when QR funding is included.
Funding from UK government bodies, in turn, amounts to roughly 47% of total funding to UK HEIs.
Table 2 UK Higher Education Institutions total research grants and contracts 2014/15, £ thousands
Income from research grants and contracts Percentage Volume
1. EU government bodies 12% £724,996
2. UK government bodies income 47% £2,754,044
- Research Councils, Innovate UK and the national academies 30% £1,794,767
- UK central government bodies, local authorities, health and hospital authorities 16% £959,277
3. UK central government tax credits for research and development expenditure 8% £496,000
4. UK-based charities 17% £1,034,473
5. UK industry, commerce and public corporations 6% £336,528
6. Other EU and international sources 9% £502,764
7. Other sources 1% £63,211
Total income from research grants and contracts [Item 1 to 7] 100% £5,912,016
Source: HESA
Disciplines
The HESA data show that in 2014/15 HEIs reported income from EU government bodies in every one
of the agency’s 40 disciplinary categories or cost centres, from clinical medicine (£119m) to sports
science (£0.4m). This shows the breadth of academic engagement in EU programmes.
Our analysis reveals that there are 15 disciplines for which income from ‘EU government bodies’
represent 20% of more of their total research income (based on using HESA data by cost centre from

16
2014/1510). These disciplines are listed in Table 3. Archaeology appears at the top of this list and 38% of
the total research income allocated to this discipline corresponds to funding from EU government
bodies. Other disciplines include area studies (125), politics & international studies (128), architecture,
built environment & planning (123), art & design (143), sociology (132) and chemistry (113).
Of those 15 disciplines seven are in the social sciences (HESA cost centres 123, 126, 127, 128, 130, 132,
and 133), six are in the arts and humanities (HESA cost centres 125, 137, 140, 141, 143, and 145) and two
are part of the physical sciences, engineering and mathematics (HESA cost centres 113 and 121). The
predominance of AHSS subjects partly reflects their greater reliance on institutional funding, as
compared with the natural and physical sciences, and QR funding is outside the scope of these HESA
statistics on research income. Nevertheless, the analysis suggests these subject areas may be amongst
the most at risk from any change in the terms of access to EU funds going forward.
Table 3 The 15 HESA cost centres that received most income from EU government bodies as a proportion of total funding in 2014/15
HESA cost centre EU government bodies income over total income in 2014/15
126 Archaeology 38%
140 Classics 33%
121 IT, systems sciences & computer software engineering 30%
145 Media studies 27%
130 Law 26%
141 Philosophy 25%
137 Modern languages 24%
127 Anthropology & development studies 23%
133 Business & management studies 23%
113 Chemistry 23%
125 Area studies 23%
128 Politics & international studies 21%
123 Architecture, built environment & planning 21%
143 Art & design 21%
132 Sociology 20%
Source: HESA
Table 4 presents an overview of the 15 disciplines that received most research income from EU
government bodies in absolute terms. All of them received £10m or more in funding from EU
government bodies in 2014/15.
The natural and physical sciences dominate the figures, with HEIs reporting around £366m in research
income from EU government bodies (50%) for the top five subjects (by income) combined. These
comprise clinical medicine (£120m), biosciences (£91m), physics (£55m), chemistry (£55m) and IT
(£46m). Given this high absolute value, these disciplines may find it challenging to replace this income
from other sources.
10 See Appendix B for an overview for all academic cost centres

17
Table 4 The 15 HESA cost centres that received most income from EU government bodies in 2014/15, in £ thousands
HESA cost centre EU government bodies income in 2014/15
101 Clinical medicine £119,913
112 Biosciences £90,766
114 Physics £55,403
113 Chemistry £54,558
121 IT, systems sciences & computer software engineering £46,208
119 Electrical, electronic & computer engineering £39,290
120 Mechanical, aero & production engineering £34,633
111 Earth, marine & environmental sciences £34,538
115 General engineering £28,116
122 Mathematics £18,982
133 Business & management studies £14,765
104 Psychology & behavioural sciences £14,731
117 Mineral, metallurgy & materials engineering £14,546
118 Civil engineering £11,300
124 Geography & environmental studies £10,857
Source: HESA
We further explore the HESA data to examine disciplines that are relatively more dependent on funding
from ‘EU government bodies’ in comparison with funding from UK government bodies.
Figure 3 presents the relative dependency of disciplines in relation to i) income from EU government
bodies as a proportion of total income (vertical axis) and ii) income from UK government bodies as a
proportion of total income (horizontal axis). The area of symbols is proportional to total amount of EU
government funding for each discipline. Symbols shaded in blue represent the ten disciplines that
receive the most income from EU government bodies in absolute terms. The figure shows that there is a
wide range in the distribution of income from EU and UK government bodies in relative terms, ranging
from 4% to 38% for income from EU government bodies, to 26% to 76% for income from UK government
bodies. Some disciplines receive more funding from alternative sources, e.g. a substantial proportion of
funding for clinical medicine is provided by UK charities. A case study appended to this report details
the role of EU funding in academic research in clinical medicine in the UK.

18
Figure 3 Distribution of EU government and UK government income as a proportion of total funding in 2014/15, by HESA cost centre
Source: HESA
Higher Education Institution types
The average volume of income from EU government bodies received by UK HEIs in 2014/15 was close
to £4.9m and the median about £1.1m (based on data for 148 HEIs). 19 of these HEIs (13%) received no
funding from EU government bodies in 2014/15, but did receive UK government funding in the range
of £2k to £2.4m (all below the median HEI income from UK government sources of just under £2.7m).
Table 5 presents an overview of the ten UK HEIs that received most income from EU government bodies
in 2014/15, which ranges from £60.3m for the University of Oxford to £18.2m for the University of
Leeds. Table 6 presents the same for the ten UK HEIs that received most income from UK government
bodies in 2014/15. Our analysis reveals that:
• The Top 10 HEIs (based on EU government bodies income) account for 47% of the total EU
government bodies income in 2014/15, while the Top 20 account for 66%.
• This income from EU government bodies is less concentrated than research income from UK
government sources. The Top 10 HEIs (based on UK government income) account for 50% of total
research grants and contracts from the UK government, while the Top 20 accounted for 72%.

19
Table 5 The 10 HEIs that received most income from EU government bodies in 2014/15, in £ thousands
Income from EU government bodies in 2014/15
EU government income, % of total income from EU government bodies for UK HEIs in 2014/15
The University of Oxford £60,280 8%
The University of Cambridge £59,495 8%
University College London £45,710 6%
Imperial College of Science, Technology and Medicine £41,929 6%
The University of Edinburgh £25,680 4%
King's College London £24,845 3%
The University of Manchester £23,741 3%
The University of Sheffield £20,414 3%
The University of Bristol £18,623 3%
The University of Leeds £18,191 3%
Total top 10 HEIs £338,908 47%
Total top 20 HEIs £476,953 66%
Total top 30 HEIs £562,959 78%
Total all HEIs £723,944 100%
Source: HESA
Table 6 The 10 HEIs that received most income from UK government bodies in 2014/15, in £ thousands
Income from UK government bodies in 2014/15
Income from UK government, % of total UK government funding for UK HEIs in 2014/15
University College London £209,524 8%
The University of Oxford £197,379 7%
Imperial College of Science, Technology and Medicine £174,723 6%
The University of Cambridge £160,657 6%
The University of Manchester £156,855 6%
The University of Edinburgh £127,024 5%
The University of Bristol £92,966 3%
The University of Sheffield £89,314 3%
King's College London £81,347 3%
The University of Glasgow £80,760 3%
Total top 10 HEIs £1,370,549 50%
Total top 20 HEIs £1,958,133 72%
Total top 30 HEIs £2,271,416 83%
Total all HEIs £2,736,250 100%
Source: HESA
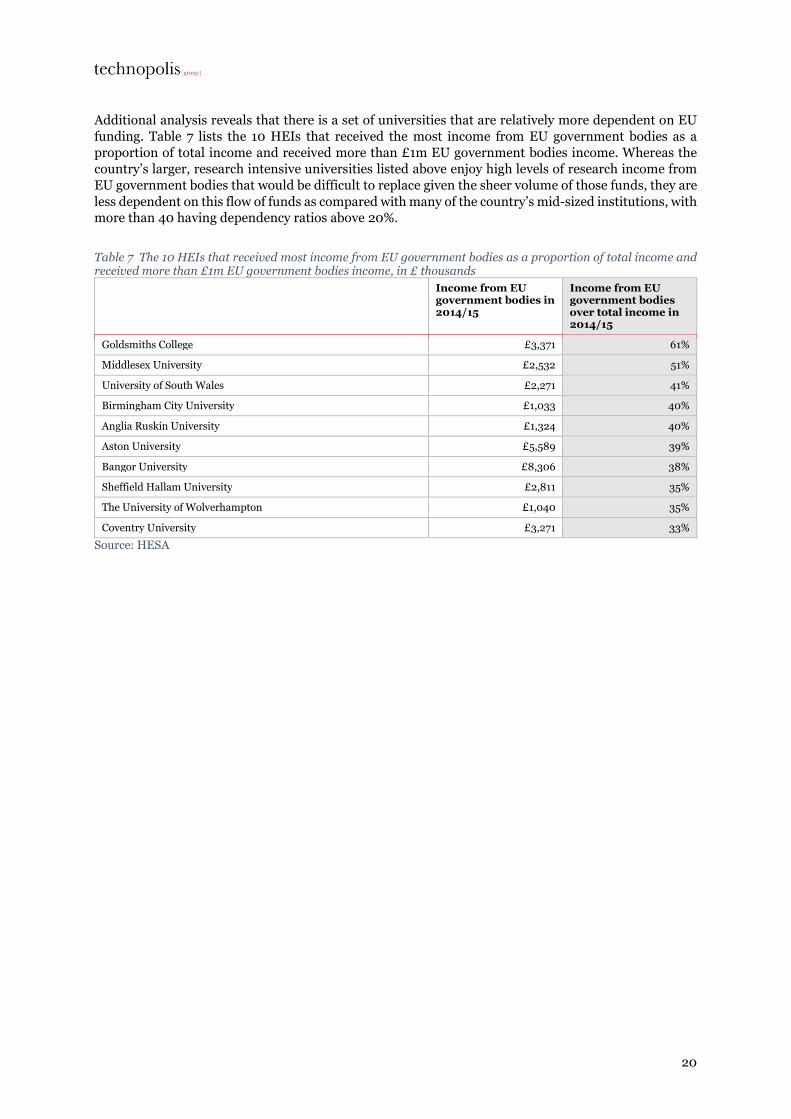
20
Additional analysis reveals that there is a set of universities that are relatively more dependent on EU
funding. Table 7 lists the 10 HEIs that received the most income from EU government bodies as a
proportion of total income and received more than £1m EU government bodies income. Whereas the
country’s larger, research intensive universities listed above enjoy high levels of research income from
EU government bodies that would be difficult to replace given the sheer volume of those funds, they are
less dependent on this flow of funds as compared with many of the country’s mid-sized institutions, with
more than 40 having dependency ratios above 20%.
Table 7 The 10 HEIs that received most income from EU government bodies as a proportion of total income and received more than £1m EU government bodies income, in £ thousands
Income from EU government bodies in 2014/15
Income from EU government bodies over total income in 2014/15
Goldsmiths College £3,371 61%
Middlesex University £2,532 51%
University of South Wales £2,271 41%
Birmingham City University £1,033 40%
Anglia Ruskin University £1,324 40%
Aston University £5,589 39%
Bangor University £8,306 38%
Sheffield Hallam University £2,811 35%
The University of Wolverhampton £1,040 35%
Coventry University £3,271 33%
Source: HESA

21
4 The role of EU funding in industry
Industry participation in Horizon 2020
UK Industry – defined here as UK for-profit companies (PRC) as classified in CORDA (see the Glossary)
– takes active part in the EU Framework Programmes and receive substantial amounts of funding for
research and innovation activities. In FP7, UK industry participants were particularly active in the
thematically structured ‘Cooperation’ programme (see Table 10 below). Under Horizon 2020 so far, UK
industry received significant amounts of funding through the new Pillar II, Industrial Leadership (which
includes specific programmes supporting key enabling technologies, space, and ICT), and Pillar III,
Societal Challenges which aims to look for innovative and research oriented solutions to common pan-
European challenges, such as energy efficiency, ageing populations, environmentally friendly transport,
and sustainable agriculture, among others (see Figure 4).
UK participation in projects under Pillar II and other parts of Horizon 2020 with strong industrial
resonances, is not limited to for-profit companies. UK higher or secondary education establishments
and other organisations also receive funding through these actions. As noted in the case study on the
role of EU funding in the UK ICT sector (See Box 1 below), Horizon 2020 offers unique opportunities
for universities and other organisations to work with for-profit companies on industrially relevant
research. Thus, EU funding for universities feed into broader ‘eco-systems’ and not only fund academic
research but also helps underpins a variety of innovation activities throughout the system. This is,
however, outside of the scope of this section, which focusses on EU funding granted directly to UK for-
profit companies.
The sub-sections below explore industry participation in the EU Framework Programmes across sectors
of the economy, company size, and benefits in terms of access to new markets.
Figure 4 EU Framework Programme funding granted to UK for-profit companies under Horizon 2020, by programme pillar
Source: CORDA
Thus, the EU contributes a substantial amount of funding to UK industry for research and innovation,
complementing what is available from UK sources. During two years, 2014/15 and 2015/16, UK’s
national innovation agency, Innovate UK, provided grants of a value of £516m per year to UK businesses.
In comparison, UK for-profit companies were awarded just under €500m during the first two years of

22
Horizon 2020 – an average of €250m or £189m per year – (calls issued in 2014 and 2015). This is
equivalent to 37% of the funding from Innovate UK.
SME participation11
UK SMEs have been successful at drawing down resources from FP7 and Horizon 2020 and funding
from these sources represents a high proportion of SMEs R&D expenditure.
Domestically, UK SMEs account for less than 5% of UK Business Enterprise R&D (BERD), but they
account for 65% of FP7 funding granted to UK companies. Consequently, EU funding constitutes a much
higher proportion of total R&D spend for SMEs than for the business sector as a whole, as shown in
Table 8. Furthermore, UK SMEs have drawn down more funding from FP7 and Horizon 2020 than
SMEs in any other country and account for the majority of the UK’s business participation.
Although less dependent on EU funding by volume, large companies also have a strong participation in
the EU Framework Programmes. They consequently also report significant benefits from the EU funding
they receive. These benefits are often indirect in nature: Participation in EU-funded actions facilitates
strategic collaboration across Europe and helps underpin the innovation ecosystem by supporting the
‘pipeline’ of ideas and talent from universities (e.g. see Box 3 on the Innovative Medicines Initiative).
Table 8 FP7 funding as proportion of total R&D expenditure by UK SMEs and large businesses
FP7 funding (2007-2013) [1]
Business Enterprise R&D (2007-2013)
FP7 funding as proportion of Business
Enterprise R&D expenditure (2007-2013)
UK SMEs £ 658m £ 3,885m 16.9%
UK large businesses £ 354m £ 112,660m 0.3%
All UK businesses £ 1,012m £ 116,545m 0.9%
Sources: CORDA and UK Office of National Statistics (ONS)12 [1] Average exchange for the period 2007 to 2013: 1.225 EUR/GBP
The role of EU funding for UK SMEs is described in more detail in the separate case study (see appendix
to this report).
Sectors of economic activity
Companies in a range of industry sectors receive EU funding for research and innovation activities.
Using the statistical classification of economic activities in the European Community (NACE)13 from EU
CORDA data, Figure 5 and Table 9 below provide a breakdown of FP7 funding for UK companies by
economic sector. UK companies within the sectors ‘Manufacturing, mining and quarrying and other
industry’ and ‘Professional, scientific and technical activities’ receive the highest total value of funding
from EU Framework Programmes. As the figures make clear, UK industry participating in FP7 largely
come from research-intensive sectors and the proportions or EU funding awarded to companies in
different sectors largely match the relative research intensity of those sectors in the UK.
11 This section is primarily based on data from FP7. At the time of writing, the available version of CORDA data for Horizon 2020 does not contain reliable data on company size. This problem might be addressed in an upcoming data release form the European Commission.
12 Office of National Statistics (2016), Business enterprise research and development, UK: 2015, Statistical Bulletin, November 2016, table 26.
13 The statistical classification of economic activities in the European Community (NACE) is used in EUROSTAT and CORDA data. NACE Revision 2 (Rev. 2) was agreed in December 2006 and implemented from 2007. See: http://ec.europa.eu/eurostat/statistics-explained/index.php/Glossary:Statistical_classification_of_economic_activities_in_the _European_Community_(NACE)

23
Figure 5 Distribution of EU Framework Programme funding and UK Business Enterprise R&D (BERD) by industrial sector in the UK
Source: Technopolis based on data from Eurostat and CORDA. [1] NACE Rev 2, Aggregated structure: high-level SNA/ISIC aggregation A*10/1114, [2] CORDA data contained meaningful NACE description for projects representing 73% of EC contribution in FP7 and 69% in Horizon 2020.
Table 9 Distribution of EU framework programme funding and UK Business Enterprise R&D (BERD) by sector
NACE Section [1]
Description FP7 [2] (2007-13)
H2020 [2] (2014-20)
UK BERD (2014)
A Agriculture, forestry and fishing 0.4% 0.3% 0.1%
B, C, D, E Manufacturing, mining and quarrying and other industry 38.0% 36.2% 40.5%
F Construction 0.7% 2.6% 0.5%
G, H, I Whole and retail trade, transportation and storage, accommodation and food service activities
1.8% 1.2% 3.9%
J Information and communication 12.5% 14.0% 14.7%
K Financial and insurance activities 0.1% 0.6% 1.9%
L Real estate activities 0.2% 0.2% 0.1%
M, N Professional, scientific, technical administration and support service activities
35.5% 39.5% 37.2%
O, P, Q Public Administration, defence, education, human health and social work activities
1.8% 0.9% 0.3%
R, S, T, U Other services 9.0% 4.6% 0.8%
Total 100.0% 100.0% 100.0%
Source: Technopolis based on data from Eurostat and CORDA. [1] NACE Rev 2, Aggregated structure: high-level SNA/ISIC aggregation A*10/1115, [2] CORDA data contained meaningful NACE description for projects representing 73% of EC contribution in FP7 and 69% in Horizon 2020.
14 Eurostat (2008), NACE Rev. 2 Statistical classification of economic activities in the European Community, European Communities, p. 43.
15 Idem

24
Thematic priorities
In FP7, both large enterprises and SMEs extensively participated in the ‘Cooperation’ specific
programme. In addition, SMEs also received a significant share of their funding from the ‘Capacities’
specific programme including from the “research for the benefit of SMEs” scheme and for research
infrastructures.16
Table 10 Participation of UK for-profit companies (PRC) in FP7 by company size and programme
FP7 Specific programme Large enterprises (PRC)
SMEs (PRC) All UK companies (PRC)
Capacities
- Of which Research for the benefit of SMEs - Of which Infrastructures
€ 14.0m
€ 9.7m € 2.3m
€ 249.8m
€ 156.2m € 88.9m
€ 263.9m
€ 165.8m € 91.2m
Cooperation € 374.7m € 517.1m € 891.8m
Ideas (ERC) € 8.9m € 1.5m € 10.4m
People € 2.5m - € 2.5m
EURATOM € 34.0m € 37.0m € 70.9m
Total FP7 € 434.1m € 805.4m € 1,239.5m
Source: CORDA
Under the ‘Cooperation’ specific programme in FP7, the ICT thematic programme provided the highest
amount of funding for both SMEs and large companies. As shown in Figure, SMEs received a much
higher share of funding from the thematic programmes on Health and ‘Nanosciences,
Nanotechnologies, Materials and new Production Technologies’, whereas large companies received
most funding from the Transport programmes (which also includes Aeronautics).
16 More than 90% of the funding for UK SMEs under infrastructures was awarded to Geant Limited, see the Case study on the role of EU funding for UK SMEs for details.

25
Figure 6 EU Funding for UK for-profit companies (PRC) in thematic areas under the FP7 ‘Cooperation’ specific programme, by company size.
Source: CORDA
Box 1: The role of EU funding for the UK ICT sector
In the UK, the digital sector is a key part of the UK economy, characterised by fast growth and high R&D intensity. In 2014, the sector accounted for 7.3% of UK Gross Value Added (GVA), 17% of UK Business R&D (BERD) and provided 4.4% of jobs in the UK. As part of the new UK Digital Strategy, published on the 1st March 2017, the government has confirmed its commitment to supporting research and innovation in ICT through Innovate UK and the Engineering and Physical Sciences Research Council (EPSRC).
The UK digital sector is heavily involved in EU research and innovation programmes and UK universities and businesses have been very successful in attracting EU funding for ICT research. Since 2007, UK universities have received more than €700m from the specific ICT programmes under FP7 and Horizon 2020, and income from EU government bodies has increased to approximately 30% of research income from grants and contracts, compared to 22% in 2007. UK companies have received more than €300m over the same period. Some companies depend directly on EU funding but non-monetary benefits from participation in large collaborations and accessing networks are equally important. EU funding feeds into broader ‘eco-systems’ in cities like Edinburgh and London and underpins a variety of innovation activities across academia and business.
The UK’s decision to leave the EU presents potential risks to the UK ICT sector. In addition to the risk of losing access to funding, talent and networks, stakeholders point to the strategic importance of participating in EU initiatives – such as the development of 5G technology – and the risk of losing influence on future European policy and programming.
Source: Case study on the role of EU funding in the UK ICT sector

26
Access to new markets
Participating in EU funding programmes often has benefits for companies beyond the immediate
financial award. There is a presumption in the innovation literature that international research
cooperation can provide participating businesses with a platform for entering new markets, and
especially so where the project work extends into technology demonstration and other near-market
commercialisation activities.17 The question of market access and exports is considered to be especially
important for SMEs, whereby smaller businesses typically face a larger number of market failures than
their larger counterparts, particularly around risk and uncertainty. It might also be a stepping stone for
expanding further afield. Horizon 2020 has a clear commitment to improving Europe’s competitiveness
globally, including innovation-led GDP growth and exports, and the EU Framework Programmes have
had an increased focus over successive programmes on ‘international’ collaboration, i.e. collaboration
with countries outside of the EU, for example to access advanced technology developed in the US, Japan
and Korea, or to collaborate with low and middle-income countries.18
Anecdotal evidence appears to support the supposition of a connection between EU funding and access
to markets. Stakeholders consulted for this study described, for example, how companies might be able
to establish relationships with future clients through EU projects. It was generally felt that companies
in receipt of EU funding were more likely to expand into new markets, but from available evidence it is
difficult to establish the direction of causality, i.e. whether companies, which already have plans to
expand, are more likely to seek EU funding.
While a full-scale econometric analysis is beyond the scope of this study, a systematic review of the
evaluation record has revealed evidence concerning the European Investment Bank (EIB) and the EU
Framework Programmes, although not specifically about UK firms.
Whereas market access is not covered in the standard evaluations of European Structural Funds
programmes an evaluation of EIB Group’s Support to the European Knowledge Economy reports access
to new markets among the observed positive impacts, especially for SMEs:
Beyond innovative products, processes and services, a majority of projects (31)
contributed to the strengthening or safeguarding of the promoters’ competitive
position in the market. In some cases, it helped them penetrate new markets as
well. 19
The number of data observations is small however, and does not allow for any further analysis at the
level of particular Member States or economic sectors.
The question of market access has been included in various EU Framework Programme evaluations,
albeit not in all cases and not always consistently. As noted above, these findings are from EU-wide
studies and do not provide evidence specifically about UK companies. The ex post evaluation of FP720
provides the best available evidence, particularly Programme evaluations with industry participation
such as ICT, NMP, Security, SMEs and Space. The overarching sentiment regarding access to markets
is one of improved access upon involvement within FP7 Programmes. This was marked not only within
companies’ motivation for participation, but is also reflected in the objectives achieved as reported by
beneficiaries.
17 https://ec.europa.eu/research/innovation-union/pdf/internationalisation_business-rd_final-report.pdf
18 https://ec.europa.eu/research/participants/portal/desktop/en/opportunities/h2020/ftags/international_cooperation.html#c,topics=flags/s/IntlCoop/1/1&+callStatus/asc
19 R-L Ballaguy et al. (2015), EIB Group’s Support to the European Knowledge Economy 2007-2013 – Synthesis report, European Investment Bank, p. 23.
20 The Commission has published reports of the individual FP7 components too: Evaluation report of the FP7 Cooperation Specific Programme, which is the part of FP7 most concerned with supporting European competitiveness. There is also the evaluation of the ‘Capacities Specific programme, which included the €1.3 bn Research for the Benefit of SMEs and two place-based innovation funds, regions of knowledge (€130M) and research potential in outermost regions (€340M).

27
For companies, objectives corresponding to commercialisation were understandably deemed to be
important, covering not only the opening up of new markets, but additionally the improvement of
existing market position and the establishment of new business areas. For industry participants in the
NMP Programme, opening-up new markets or new groups of customers was thought to be important
for 54% of respondents (of 822 industry partners) and is reflected in their motivation for participation.
While SMEs reported access to new markets as motivation for participation in the Research for SME
Programme and the Cooperation Programme at 63% and 55% respectively.
In terms of actualised impact, interviews with FP7 beneficiary SMEs found that increased sales to new
customers/markets was the most notable economic impact as a result of their participation. Of the
interviewees, 45% reported increased sales to new customers in other EU Member States, and 37%
reported increased sales to new markets as a product of their involvement in the programme. This
sentiment was also reported by beneficiary SMEs involved in the FP7 Space Programme, who reported
access to markets had been fully or somewhat achieved for 47% of respondents while an additional 45%
of respondents reported that while the objective had not been achieved at the point of survey response,
it is expected to be achieved in the future.
Figure 7 Achievement of stated objectives of Space Research under FP7 for beneficiary SMEs
Source: Final Evaluation of Space Research under FP7 2015 (beneficiary survey, 2014), N = 65
This sentiment is similarly reflected in the interim evaluation of the ICT research in FP7, whereby
around approximately 60% of respondents thought that the involvement in the project achieved
enhancing their ability to enter new markets.21 This is particularly significant in light of the fact the FP7
ICT Programme was thought by DG CONNECT officials, experts and project officers to have limited
market impact in supporting new market entries.22
21 Bravo et al. (2010), Interim evaluation of the ICT research in the 7th Framework Programme: Catalysing European Competitiveness in a Globalising World, European Commission, p. 36
22 DG CONNECT (2015), Ex-post evaluation of ICT research in the Seventh Framework Programme, Final Report prepared by DG CONNECT, January 2014, p. 24

28
5 The role of EU funding across regions in the UK
Introduction
This section explores the extent to which EU funding is supporting research and innovation activity
across the UK, and the degree to which different regions receive more or less funding from Horizon
2020 and the European Structural and Investment funds (ESIF), i.e. funding for research and
innovation under the European Regional Development Fund (ERDF).
Figure 8 presents the distribution of EU funding across the four nations in the UK, for both ESIF and
Horizon 2020. The chart shows that England has benefitted from the largest proportion of both types
of EU funds among the four nations, receiving around 55% of ERDF research and innovation funding
and about 85% of Horizon 2020 funding in the UK.23
The chart also shows that while the absolute amounts are smaller, ERDF research and innovation
funding is relatively more important than Framework Programme funding in Northern Ireland and
Wales. These two nations both receive a greater proportion of ERDF research and innovation funding
than Horizon 2020 funding. In relative terms, Wales is particularly reliant on ERDF research and
innovation funding, and relies much less on EU Framework Programme funding. Despite being awarded
a smaller amount of funding in absolute terms than England, Wales receives the most per capita ERDF
research and innovation funding. Northern Ireland and Scotland also receive relatively more per capita
ERDF research and innovation funding than England, as shown in Table 11.
Across all nations, the largest volume of ERDF research and innovation funding is allocated to SMEs,
e.g. in relation to investment in infrastructure, capacities and equipment, cluster support, voucher
schemes, etc.
Figure 8 Distribution of EU funding across the four nations
23 Estimations are based on the ERDF funding to be allocated for 2014-2020, by nation and the Horizon 2020 funding allocated by 2016 to each nation. Data is presented in the appendix.

29
Source: CORDA; analysis by BEIS
European Structural and Investment funds (ESIF)
Table 11 presents the government’s estimated distribution of the EU’s contribution to ERDF research
and innovation projects, for the UK and its four nations. The table also provides a breakdown of these
figures by type of actor. The table shows the clear focus on support for small businesses (SMEs), which
the ERDF programme has prioritised for support to encourage increased investment in research and
innovation through cooperation with research groups in universities and research institutes.
England accounts for the largest share of the pot, with around €816 million of the total (approximately
55%), with Northern Ireland accounting for around €113 million (8%). The table also includes an
estimate of income per capita, which uses population size to adjust for the marked differences in the size
of the four nations. On this basis, in proportionate terms, England is expected to secure around €15 per
person, while Wales, at the other end of the scale, is expected to achieve closer to €125 per person. That
is more than five times more than the UK average, which reflects Wales differential access to Structural
Funds support.
Table 11 Distribution of the EU’s contribution to ERDF research and innovation projects in the UK (2014-2020) by Region and organisation type
England Wales Scotland Northern Ireland
UK %
SMEs (directly or indirectly)
€ 508m €165m €112m €81m €865m 59%
Large companies
€o €15m €0 €33m €48m 3%
Public research centres
€ 111m € 88m € 0 € 0 € 199m 13%
Private research centres
€ 109m € 33m € 0 € 0 € 142m 10%
Unassigned € 89m € 88m € 46m € 0 € 223m 15%
Total € 816m € 388m € 158m € 113m € 1,476m 100%
Per capita € 15 € 125 € 29 € 60 € 23
Source: Technopolis based on UK ERDF operational programmes.
The box below shows two examples of how ERDF funds have been used in Wales to support research
and innovation (the full Case Study on the role of EU funding in Wales is presented in an appendix to
this report).
Box 2: Roles of EU funding in Wales
The Centre of Excellence for Mobile Applications and Services (CEMAS)
The University of South Wales received a £5.96m ERDF Convergence Funding grant in 2010-2015 for the establishment of the Centre of Excellence for Mobile Applications and Services (CEMAS). CEMAS support Welsh SMEs to develop, test and find a route to market for their mobile application product on a number of platforms including iOS, Android, Blackberry and Windows Phone. A REF case study submitted by the university specifies that “by July 2013, the Centre has aided in forms of research and development services to 66 companies, developed 28 products.”

30
The Sêr Cymru (‘Stars Wales’) programme
In Wales, funding from the Horizon 2020 and ERDF have been combined with national funding to fund the effort to strengthen research capacity. A €9.6m Horizon 2020 grant awarded to the Welsh Assembly part-funds the second phase of the Sêr Cymru (‘Stars Wales’) programme, which aims to strengthen the capacity of Wales’ leading research groups via talent attraction and training,24 and particularly in Wales’ three Grand Challenge science activities (advanced materials and manufacturing, life sciences, and energy and environment).25 The second phase of the programme is also supported through ERDF and regional and institutional funding. As of 2016, the four Sêr Cymru Research Chairs attracted to Wales, and the three National Research Networks had secured €36.4m26 of competitive research funding for Wales and had also been successful at winning Welsh research funding.27
Phase Support for Budget and funding source Duration
I Establishment of three National Research
Networks, with dedicated directors Appointment of Four Sêr Cymru Research Chairs
€58.6m 70% from Welsh Government 30% from the Higher Education Funding
Council for Wales
5 years
II
90x 3-year COFUND Research Fellows 30x 3-year Research Fellows 12x 3-year ‘Recapturing Research Talent’
Fellowships 26x 5-year ‘Rising Star’ fellowships Strategic Awards for Capital Equipment Staff to support rising stars Delivery team
€67.3m 11% from Marie-Skłodowska-Curie Co-Funds 41% from ERDF 12% Welsh Government 6% Higher Education Funding Council for
Wales 30% HEI match contribution
5 years
Source: Case study on the role of EU funding in the UK ICT sector and Case study on the role of EU funding in Wales.
Horizon 2020
Our analysis of the European Commission’s database shows the UK has secured more than €2.6 billion
(£2.2 billion) in Horizon 2020 grants, in the period up 2016.
Table 12 presents the distribution of Horizon 2020 funding for the nations of the UK in absolute terms,
as a percentage of the UK total and on a per capita basis. It shows England dominates the flow of funds
in absolute terms, with more than €2.2 billion in income, or 85% of the UK total. In proportionate
terms, however Scotland has achieved the highest level of income per capita. UK Horizon 2020 income
per capita is about £34 (€40) and this is substantially higher than the UK ESIF income per capita, which
is €23.
Table 12 Distribution of Horizon 2020 funding, by UK nation
England Wales Scotland
Northern Ireland UK
Total € 2,241m € 55m € 296m € 43m € 2,635m
% UK Total 85% 2% 11% 2% 100%
Per capita €41 €18 €55 €23 €40
24 Welsh Government (2015) New Frontiers: Cutting-edge Science in Wales. http://gov.wales/docs/det/publications/150807-new-frontiers-en.pdf
25 The three areas are: advanced materials and manufacturing, life sciences, and energy and environment, as per http://gov.wales/topics/science-and-technology/science/growing-research-in-wales/national-research-networks/?lang=en
26 Converted from GBP at current rates via InforEuro: http://ec.europa.eu/budget/contracts_grants/info_contracts/inforeuro/index_en.cfm
27 See: http://gov.wales/docs/det/report/160331-science-for-wales-report-2016-en.pdf

31
Source: CORDA
Table 13 present these same data on Horizon 2020 across the three nations and nine English regions.
The chart and table also include data on income by type of organisation, for all grants contracted in the
period up to 2016.
Greater London dominates the flow of funds (€633m). Over 60% of this funding is allocated to HEIs.
Other UK regions that receive a large proportion of total funding are the South-East England, the East
of England, Scotland and the South West of England. In all regions, HEIs are the primary recipients of
the total flow of EU income. Private companies are major beneficiaries too, especially in London, the
South and East of England.

32
Table 13 Distribution of Horizon 2020 funding by UK region and type of organisation, in € million
Region (NUTS 1) Private for profit organisation
Public body (excluding research and education)
Higher or secondary education
Research organisations
Other Total
Greater London € 135m 24% € 36m 41% € 406m 24% € 45m 19% € 12m 29% € 634m 24%
South East € 111m 20% € 1m 1% € 258m 15% € 48m 20% € 8m 20% € 427m 16%
East of England € 74m 13% € 1m 1% € 198m 12% € 41m 17% € 2m 4% € 316m 12%
Scotland € 50m 9% € 7m 8% € 218m 13% € 18m 7% € 3m 6% € 296m 11%
South West € 28m 5% € 18m 20% € 124m 7% € 68m 28% € 3m 8% € 241m 9%
Yorkshire and The Humber € 34m 6% € 2m 3% € 111m 7% € 9m 4% € 3m 8% € 160m 6%
West Midlands € 29m 5% € 2m 2% € 115m 7% € 5m 2% € 4m 9% € 155m 6%
North West € 38m 7% € 2m 2% € 104m 6% € 1m 0% € 3m 6% € 147m 6%
East Midlands € 28m 5% € 5m 6% € 57m 3% € 0 0% € 2m 5% € 92m 3%
North East € 14m 3% € 0 0% € 49m 3% € 5m 2% € 0 1% € 69m 3%
Wales € 10m 2% € 10m 11% € 35m 2% € 0 0% € 1m 2% € 55m 2%
Northern Ireland € 12m 2% € 4m 5% € 26m 2% € 1m 0% € 0 1% € 43m 2%
Total € 564m 100% € 88m 100% € 1,700m 100% € 242m 100% € 40m 100% € 2,635m 100%
Source: CORDA

33
6 Research activities uniquely supported by the EU
Introduction
The preceding sections have shown how EU funding has been distributed across the UK research and
innovation landscape, among organisations, academic disciplines and geographical areas. This section
explores the particular types of activities supported by EU programmes with a focus on the types of
activities that are uniquely funded by the EU or that cannot easily be organised domestically.
As explained above, the EIB has provided loans to support various UK capital investment projects,
mostly for the expansion and modernisation of campus buildings and related research infrastructure.
For the purpose of this chapter however, the EIB is largely supporting capital projects that could have
been funded, in principle at least, through existing national programmes (e.g. the Regional Growth Fund
or the Research Capital Investment Fund). Similarly, the UK’s five ERDF Operational Programmes28
list several types of standard activities used to support research and innovation in the regions, and
particularly for the benefit of SMEs. The added value of ERDF compared to what already exists in the
UK is in the volume and focus of funding it makes available for research and innovation infrastructure
in the UK’s more peripheral and economically less well-developed regions.
Horizon 2020 by contrast is unique, and is the only international research and innovation programme
of this scale anywhere in the world. Other international scientific programmes are orders of magnitude
smaller. Major intergovernmental science programmes, like CERN or ESA, do have annual budgets
running in to the billions, however, the very great majority of this expenditure is committed to the
operation and maintenance of the in-house facilities and programmes, and their calls for proposals are
very much fewer and very much smaller than those run by Horizon 2020. International cooperation is
part of the programme’s DNA too, which is absolutely not the case for the very great majority of national
research and innovation programmes. In general, governments around the world require national
research funds to be expended with people and organisations based in the same jurisdiction as their
taxpayers. While all science may be said to be global in outlook, successive EU Framework Programmes
for research and innovation have propelled our international engagement to new levels.
Putting aside the level of commitment to international cooperation, Horizon 2020 – and FP7 before it
– provides UK-based organisations with access to several types of instrument or programme that has
not been available nationally. In the following sub-sections, we explore two particular perspectives: (i)
large collaborations and partnerships and (ii) individual fellowships and investigator awards.
Large collaborations
6.2.1 Collaborative projects
The ability to collaborate with peers or potential customers is an important motivation for participating
in EU projects. Many parts of Horizon 2020 are specifically set up to support cross-border collaboration
and a large proportion of the programme’s funding is awarded as grants for collaborative projects. In
line with its predecessor programmes, two of the most commonly used funding instruments in Horizon
2020, Research and Innovation Actions (RIA) and Innovation Actions (IA), require at least three
participants from three different Member States (see Appendix C2). As shown in Table 14 below, it is
also striking that Horizon 2020 projects generally involve more partners, not least in Pillar III (Societal
Challenges) where an average project has more than 10 partners, and grants are typically larger than is
the case for national schemes.
28 Five UK ERDF Operational programmes include research and innovation actions: East Wales, West Wales and the Valleys, Northern Ireland, Scotland and England.

34
Table 14 Size of project consortia and awards from Horizon 2020 and UK funders.
Average number of project partners
Average grant size per project (£) [3]
(2014-2016)
Horizon 2020 [1]
Pillar I (Excellent Science) 2.3 £ 971,306
Pillar II (Industrial Leadership) 4.6 £ 1,295,880
Pillar III (Societal Challenges) 10.2 £ 2,876,242
Horizon 2020 (total) 4.4 £ 1,832,487
UK funding bodies [2]
AHRC 2.1 £ 142,310
BBSRC 1.8 £ 333,547
EPSRC 3.1 £ 622,914
ESRC 2.0 £ 356,501
MRC 4.3 £ 790,934
NERC 2.2 £ 301,571
STFC 2.5 £ 364,880
Innovate UK 2.8 £ 340,178
NC3Rs 1.2 £ 166,621
UK funders (total) 2.7 £ 459,849
Sources: [1] EU open CORDA data (updated 22 December 2016), [2] Gateway to Research, [3] EU grant size converted from Euros to GBP using average exchange rate for 2014-2016, 1.28 Euro/GBP.
6.2.2 Large partnerships
In addition to collaborative projects funded on the basis of calls for proposals issued by the European
Commission and carried out by the grant beneficiaries (so-called ‘indirect actions’), FP7 and Horizon
2020 also provide funding for a limited number of large scale partnerships to complement other
actions.29 The largest of these types of initiatives – Joint Technology Initiatives (JTIs) and so-called
Article 185 actions – are distinct from other activities funded in the EU Framework Programmes in
terms of their legal status and institutional setup and the scale. They involve very large budget
commitments from the EU as well as other partners, which run into the billions and dwarf the very great
majority of national collaborations here in the UK or elsewhere. As a case in point, the £700m Crick
Institute will be one of the largest inter-disciplinary biomedical centres in Europe, with 1,200 scientists
and an annual budget in excess of £100m. By comparison, the Innovative Medicines Initiative (IMI),
described in Box 3 below, is expected to invest more than €3.3 billion in the 10-year term from 2014-
2024.
The UK government has launched several large-scale collaborations with planned budgets running into
the hundreds of millions (e.g. the Energy Technology Institute) and even billions in some of the more
recent initiatives (the Aerospace Technology Institute, ATI). However, these are predominantly national
initiatives and do not have the international reach of Horizon 2020. The example of the Clean Sky JTI,
introduced in Box 4 below, illustrates the importance of being able to coordinate large-scale national
initiatives across borders in an industry where supply chains are very internationalised.
29 REGULATION (EU) No 1291/2013 OF THE EUROPEAN PARLIAMENT AND OF THE COUNCIL of 11 December 2013 establishing Horizon 2020 - the Framework Programme for Research and Innovation (2014-2020) and repealing Decision No 1982/2006/EC, Article 23.

35
Box 3: The Innovative Medicine Initiative Joint Technology Initiative was founded with the view of increasing the efficiency and efficacy of the drug development process through collaborative efforts between organisation and institutions across the pharmaceutical sector. As a JTI, half of the funding is contributed by the EC, while the remainder is contributed in kind by the European Federation of Pharmaceutical Industries and Associations (EFPIA) and its constituent members, and other associated partners. While EFPIA members are not eligible for funding from the EC, other organisations such as SMEs may obtain funding through calls for proposals. Under the second iteration of the IMI, IMI2, 25.6% EFPIA members and 15.4% of SMEs involved in IMI2 projects are based in the UK.
The benefits of being involved in the IMI are not limited to financial contributions, but also include fostering cross-sector collaboration, networking and knowledge sharing, as well as access to new tools and methods. The knowledge sharing and networking activities enable companies greater access to new and progressive research being conducted, and to the patient and regulatory bodies representing the market place applications for such technological developments. A tangible manifestation of such knowledge sharing are the database generation projects of the IMI such as Open PHACTS, PROTECT and the European Lead Factory, collating data concerning drug development, disease and patient responses to support the future development and production of drugs.
Source: Case study on Innovative Medicines Initiative (IMI)
Public-Private Partnerships (PPP) can be implemented under Horizon 2020 to support pre-
competitive research and innovation activities in areas of strategic importance and can take one of two
main forms: Contractual Public-Private Partnerships (cPPP) work on the basis of roadmaps developed
through open consultation and are implemented through open calls using normal Horizon 2020 rules
and regulations. There are currently nine cPPPs including ‘Factories of the Future’ and ‘Advanced 5G
Networks for the Future Internet’.30 Joint Technology Initiatives (JTIs) are larger scale initiatives,
implemented by Joint Undertakings on the basis of Article 187 of the Treaty on the Functioning of the
EU (TFEU). These initiatives are implemented where “the scope and objectives pursued and the scale of
the resources required justify it […]”.31 Table 15 shows the Joint Technology Initiatives currently running
under Horizon 2020.
Table 15 Joint Technology Initiatives in Horizon 2020
Name Horizon 2020 EU contribution
Industry / Member State contribution
Total budget
Innovative Medicines Initiative (IMI2)
€ 1,638m € 1,725m € 3,276m
Clean Sky 2 (Aeronautics and Air Transport)
€ 1,755m € 2,250m € 4,000m
Fuel Cells and Hydrogen (FCH2)
€ 665m € 665m € 1,300m
Electronic Components and Systems (ECSEL)
€ 1,185m € 3,600m € 4,785m
Bio-Based Industries (BBI) € 975m € 1,800m € 2,775m
Shift2Rail (S2R) € 450m € 470m € 920m
Source: European Commission32 Note: The Innovative Medicines Initiative and Clean Sky (both shaded) are described in separate case studies.
30 See: http://ec.europa.eu/research/industrial_technologies/ppp-in-research_en.html
31 REGULATION (EU) No 1291/2013, Op Cit., Article 24
32 See: http://ec.europa.eu/programmes/horizon2020/en/area/partnerships-industry-and-member-states
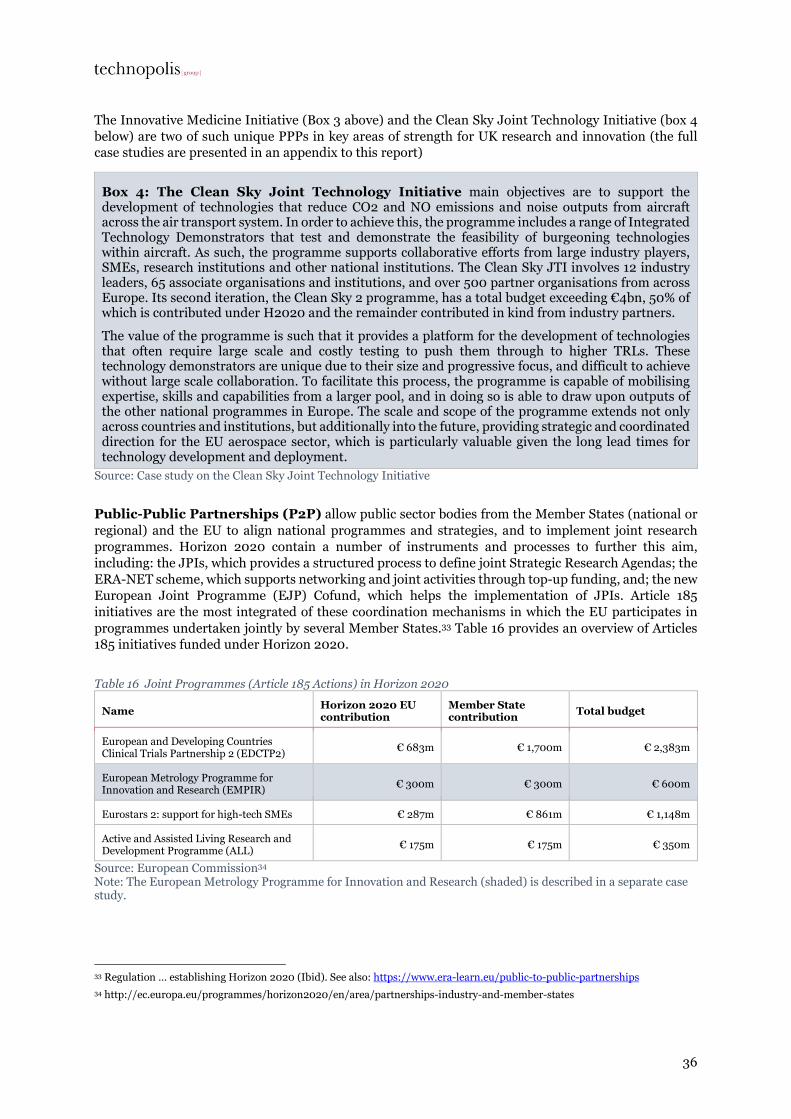
36
The Innovative Medicine Initiative (Box 3 above) and the Clean Sky Joint Technology Initiative (box 4
below) are two of such unique PPPs in key areas of strength for UK research and innovation (the full
case studies are presented in an appendix to this report)
Box 4: The Clean Sky Joint Technology Initiative main objectives are to support the development of technologies that reduce CO2 and NO emissions and noise outputs from aircraft across the air transport system. In order to achieve this, the programme includes a range of Integrated Technology Demonstrators that test and demonstrate the feasibility of burgeoning technologies within aircraft. As such, the programme supports collaborative efforts from large industry players, SMEs, research institutions and other national institutions. The Clean Sky JTI involves 12 industry leaders, 65 associate organisations and institutions, and over 500 partner organisations from across Europe. Its second iteration, the Clean Sky 2 programme, has a total budget exceeding €4bn, 50% of which is contributed under H2020 and the remainder contributed in kind from industry partners.
The value of the programme is such that it provides a platform for the development of technologies that often require large scale and costly testing to push them through to higher TRLs. These technology demonstrators are unique due to their size and progressive focus, and difficult to achieve without large scale collaboration. To facilitate this process, the programme is capable of mobilising expertise, skills and capabilities from a larger pool, and in doing so is able to draw upon outputs of the other national programmes in Europe. The scale and scope of the programme extends not only across countries and institutions, but additionally into the future, providing strategic and coordinated direction for the EU aerospace sector, which is particularly valuable given the long lead times for technology development and deployment.
Source: Case study on the Clean Sky Joint Technology Initiative
Public-Public Partnerships (P2P) allow public sector bodies from the Member States (national or
regional) and the EU to align national programmes and strategies, and to implement joint research
programmes. Horizon 2020 contain a number of instruments and processes to further this aim,
including: the JPIs, which provides a structured process to define joint Strategic Research Agendas; the
ERA-NET scheme, which supports networking and joint activities through top-up funding, and; the new
European Joint Programme (EJP) Cofund, which helps the implementation of JPIs. Article 185
initiatives are the most integrated of these coordination mechanisms in which the EU participates in
programmes undertaken jointly by several Member States.33 Table 16 provides an overview of Articles
185 initiatives funded under Horizon 2020.
Table 16 Joint Programmes (Article 185 Actions) in Horizon 2020
Name Horizon 2020 EU contribution
Member State contribution
Total budget
European and Developing Countries Clinical Trials Partnership 2 (EDCTP2)
€ 683m € 1,700m € 2,383m
European Metrology Programme for Innovation and Research (EMPIR)
€ 300m € 300m € 600m
Eurostars 2: support for high-tech SMEs € 287m € 861m € 1,148m
Active and Assisted Living Research and Development Programme (ALL)
€ 175m € 175m € 350m
Source: European Commission34 Note: The European Metrology Programme for Innovation and Research (shaded) is described in a separate case study.
33 Regulation … establishing Horizon 2020 (Ibid). See also: https://www.era-learn.eu/public-to-public-partnerships
34 http://ec.europa.eu/programmes/horizon2020/en/area/partnerships-industry-and-member-states

37
The European Metrology Programme for Innovation and Research (EMPIR) is a prime example of how
the EU’s P2P instruments have been used to develop gradually closer coordination between national
programmes with UK National Physical Laboratory (NPL) in a leading position (the full Case Study on
EMPIR is presented in an appendix to this report).
Box 5: The European Metrology Programme for Innovation and Research (EMPIR) is a Public-Public Partnership, implemented as a so-called Article 185 action, with a budget of €600m jointly funded by the European Commission and Member States. EMPIR is the culmination of more than 15 years of collaboration with EU support from a series of EU grants, including an ERA-NET preparatory grant (MERA), a full ERA-NET grant (iMERA), an ERA-NET Plus bridging grant (iMERA-Plus) leading the way for the European Metrology Research Programme (EMRP), a €400m programme, and EMPIR. The first EMPIR annual call was issued in 2014 and these will continue until 2020 with work continuing until 2024.
Much of the drive and thinking to develop the European Metrology Research programmes came from the National Physical Laboratory (NPL), and the UK is the second largest participant in the programmes, close behind Germany. Over the last few years NPL has seen a rapid increase in revenue from the EU, such that in 2014 it equated to 17% of its turnover.
Source: Case study on the European Metrology Programme for Innovation and Research (EMPIR)
6.2.3 Research Infrastructures
Research infrastructures funded by the EU are a clear example of where collaboration can help achieve
scale and reduce costs for individual countries. So far, UK participants have been granted €86m for
infrastructure projects in Horizon 2020 in addition to the €272m granted during FP7.35
European Research Infrastructure Consortia (ERICs) is a new legal structure created under EU
law. They are designed to facilitate the shared operation of research infrastructures and provide benefits
such as exemption from VAT.36 At the time of writing, 14 ERICs have been approved by the European
Commission. The European Social Survey (ESS) gained ERIC status in 2013 and is currently the only
ERIC to be hosted by the UK.
Box 6: The European Social Survey (ESS) is a biennial cross-national survey measuring attitudes, beliefs and behavioural patterns of diverse populations across Europe. Since its establishment in 2001, the survey has been conducted every two years using face-to-face interviews, each round having participation from between 22 and 31 countries, including EU Member States and other European countries.
ESS activities are financed by a combination of EU grants and funding from national and other sources, including initial support from the European Science Foundation. Eleven grants from successive EU Framework Programmes have been awarded to ESS with a total value of €26.5 million, which is very significant in the context of the social sciences. In 2013, the ESS was awarded status as a European Research Infrastructure Consortium (ERIC) by the European Commission and in 2016 was listed as a ‘Landmark’ Research Infrastructure in the European Strategy Forum on Research Infrastructures (ESFRI) Roadmap.
Source: Case study on the European Social Survey
Individual fellowships and investigator awards
Individual fellowships and investigator awards are another area where EU Framework Programmes for
research and innovation have played an increasingly prominent role in recent years. Successive EU
Framework Programmes have provided support to individual researchers working at different stages of
their career, with a view to improving the capacity and quality of the European research community
35 https://www.gov.uk/government/statistics/uks-participation-in-horizon-2020-february-2017
36 https://ec.europa.eu/research/infrastructures/index_en.cfm?pg=eric (accessed 7 March 2017).

38
overall and to help individual researchers stay in the sector and progress more quickly in their careers.
The European Research Council (ERC), first formed during the course of FP6 and launched in FP7, and
has established itself as a pre-eminent funder of investigator-driven frontier research.37 The UK has been
singularly successful in attracting ERC grants. During FP7, the UK won 22.4% of all grant funding from
the ERC.
Marie Skłodowska-Curie Actions (MSCA) are particularly relevant for early career researchers. As part
of Horizon 2020, MSCA provides funding for research training and career development focused on
innovation skills, thereby supporting PhD candidates as well as highly experienced researchers.38 MSCA
grants are generally recognised as generous and prestigious grants and may have a positive influence on
young researchers’ career development. Under FP7 (2017-2014), 1,297 UK-based academic staff
received a Marie Curie Fellowship and 2,175 staff participated in an exchange. The total budget awarded
to UK-based organisations under FP7 was €1,1bn, which involved 4,053 UK based organisations.39
As shown in Figure 9, ERC research grants and Marie Skłodowska-Curie Individual Fellowships now
make up a substantial proportion of the value of personal awards given to research based in the UK. This
success has meant that researchers in some academic disciplines have come to rely heavily on ERC
funding, as described in the case of Archaeology below (Box 7).
Figure 9 Value of individual grants awarded to UK-based researchers, by project start year40
Sources: CORDA, Gateway to Research and Wellcome Trust grant database. Note: The value of EU grants converted from Euros to GBP using average exchange rate for each year (2007-2015)
37 In addition to the investigator grants (96% of UK ERC funding in FP7), the ERC also offer Proof of Concept (PoC) and Synergy Grants (SyG) to ERC grantees to explore the commercial or societal potential and synergies of their work. These grants are not included in the analysis of fellowships and investigator grants presented here.
38 https://ec.europa.eu/research/mariecurieactions/about_en
39 http://ec.europa.eu/research/mariecurieactions/statistics_en
40 Funding figures for ERC decrease slightly in 2015 but increased again in 2016 (not included in this figure as data for other funding streams are unavailable). This temporary decrease in 2015 is probably explained by the transition from FP7 to Horizon 2020.

39
Box 7: The Role of EU funding for UK Archaeology Research
The latest financial data available show that 38% (£8.7m) of research grants and contracts for
Archaeology research at UK HEIs are derived from EU government funding sources. This proportion of
funding represents a more than tenfold increase in the volume of funding received since 2006/07, which
was just £658k, 4% of total funding. This increasing dependency on EU funding can be in part explained
by the availability of and success of UK-based archaeologists in winning competitive ERC funding, which
was launched in 2007 under FP7. ERC grants are unique to the discipline because of the size of the grants
(enabling sufficient funding for the salary of academics working at different career stages), the length of
the grants, and the collaborative nature of the funding. The ERC grants enable collaboration and
teamwork that helps advance research. For Archaeology, there are no other sources of multiannual
funding of this magnitude available. Similarly, Marie Skłodowska-Curie funding has helped advance the
careers and research of grant recipients working in the discipline and the absence of this type of funding
implies fewer resources available for early career researchers.
Source: Case study on the role of EU funding in the discipline of Archaeology
Compared to typical grants provided by UK funding bodies, ERC grants tend to be larger in terms of the
amounts and the time afforded to the recipient to pursue independent research. In the UK, only the
Wellcome Trust provides ‘investigator awards’ similar in size and scope to the ERC grants, and they are
concentrated in the medical sciences, although the Wellcome Trust also provides smaller grants for
research in the Humanities and Social Sciences that addresses health-related issues.41
Table 17 Size of personal grants from EU and UK funding bodies to UK researchers
Average grant size to UK-based researchers (2007-2013) [2]
Average grant size to UK-based researchers (2014-2016) [1] [2]
ERC Starting Grant £1,082,333 £1,164,891
ERC Consolidator Grant £1,462,334 £1,475,543
ERC Advanced Grant £1,792,833 £1,900,549
EU MSCA Individual Fellowships £170,665 £148,028
UK Research Council Fellowships £315,269 £440,954
Wellcome Trust Investigator Awards (science) - £1,704,487
Wellcome Trust Investigator Awards (H&SS) - £442,280
Source: CORDA, Gateway to Research, Wellcome Trust [1] Wellcome Trust Investigator Awards have been awarded since 2011. Data available for the period 2011-2015. [2] ERC grant size converted using average exchange rate: 2007-2013 1.225 Euros/GBP, 2014-2016: 1.281 Euros/GBP. Note: Shaded rows are EU Framework Programme grant schemes.
41 https://wellcome.ac.uk/what-we-do/our-work/research-humanities-and-social-sciences

40
7 Leverage effect of EU funding
Introduction
Up until now, we have largely discussed each funding stream in isolation, but in practice, different
streams of funding are interdependent in various ways. In this section, we will look at ‘leverage’, that is,
the extent to which one stream of EU funding leads to additional resources from other sources.
Contribution required by project participants
Each of the three EU funding programmes discussed in this report provides a degree of financial
leverage, by design.
Where the EIB provides loans to finance research and innovation schemes, its agreement is often an
endorsement of the proposals and can be the key to attracting other investors. These loans can cover up
to 50% of the total cost, however, on average the EIB share is about one-third of the total funding
required. From this simple financial perspective, the EIB’s provision of around €5bn in loans to various
UK universities and companies over the past 10 years would have been matched by additional
investments of around €10bn.
The ERDF rules require national co-financing of all supported projects, from either public or private
sources. The EC co-financing rates are typically 75% or 85% of the total budget, depending upon the
location of the project or the partners involved, with the higher level of support available to research and
innovation actions based in the ‘weakest’ regions economically. Importantly, those funds must be
additional to, and not replace, existing national funding.
From the EU Framework Programmes, UK participants have been awarded a total of €9.6bn during the
period considered in this study, including €7bn during FP7 and a further €2.6bn during the first 30
months of Horizon 2020. Depending on the funding instrument and types of organisation participating,
however, the EU contribution might not cover all project costs, and so project participants often have to
make monetary and in-kind contributions.
Again, the rate of funding, or the extent of the requirement to contribute to the project total costs, differs
across funding instruments and type of organisations involved. For example, whereas Research and
Innovation Actions (RIAs) and ERC grants are funded at a rate of up to 100%, Innovation Actions are
funded up to 70%, and support for Public Procurement of Innovative Solutions can fund no more than
20% of the costs (see Appendix C for details about H2020 funding schemes and funding rates).
Table 18, below, shows the contribution made by different types of organisations to the total project
costs. It shows that EU funding of €9.6bn (in FP7 and Horizon 2020) has leveraged €2.3bn from UK-
based participant organisations. This ratio is higher among companies (private for profit organisations)
where €1 million led to additional €633K, due to the rules of engagement for private organisations and
the instruments in which they usually take part (or are eligible for).

41
Table 18 EU contribution and other contributions to total project costs from UK participants in FP7 and Horizon 2020
EC
contribution Own
contribution Total project
cost
Own contribution as
a % of total project cost
Higher and secondary education institutes (HES)
€ 6,665m € 818m € 7,483m 11%
Private for profit (excluding education) (PRC)
€ 1,804m € 1,142m € 2,946m 39%
Research organisations (REC) € 831m € 218m € 1,050m 21%
Public body (excluding research and education) (PUB)
€ 232m € 126m € 358m 35%
Other (OTH) € 99m €19m € 118m 16%
Total € 9,631m € 2,323m € 11,955m 19%
Source: CORDA
‘Crowding-in’ of R&D investment
Beyond the required contribution by project participants, the literature suggests that public R&D
expenditure, such as EU funding for research and innovation, has a significant ‘crowding-in’ effect or
‘additionality’ leveraging further private investment in R&D.42 Econometric studies based on FP7
projects set the rate of additionality at 0.74, that is, for every €1 spent to support R&D by the European
Commission, a further €0.74 will be invested by universities, companies or other stakeholders.43 This
effect goes beyond the formal requirement for participants to contribute to project costs described
above, and includes additional investments made by organisations to expand the resources available for
a given project, or for follow-up research activities.
Applying this rate to the funding received by UK organisations in FP7 and Horizon 2020 (to date), we
arrive at an estimate of the effect of the participation on R&D expenditure (and derived benefits for
employment and economic growth) which is substantially higher than the €9.6bn received directly from
the European Commission. Already, contributions by UK participants in EU projects add €2.3bn of R&D
investment, as shown above. With the further estimated leverage effect, the outcome of UK participation
in FP7 and Horizon 2020 (so far) is estimated to be a total increase in research and innovation
expenditure of €16.6bn. Figure 10 illustrates the process from the initial ‘implementation’ phase where
EU Framework Programme funding is granted through to the ‘allocation phase’ when the leverage has
taken effect.
42 E.g. Economic Insight (2015), What is the relationship between public and private investment in science, research and innovation, April 2015.
43 See Zagamé, Paul, Arnaud, Fougeyrollas and Pierre le Mouël (2012) Consequences of the 2013 FP7 call for proposals for the economy and employment in the European Union. ERASME, 2012., and Fougeyrollas, Arnaud, Pierre le Mouël and Paul, Zagamé (2012) Consequences of the 2012 FP7 call for proposals for the economy and employment in the European Union. ERASME, 2013.

42
Figure 10 Estimated leverage effect of UK funding from FP7 and H2020
Source: Analysis by Technopolis, based on CORDA.

43
8 Conclusion
Since the first EU Framework Programmes for research and innovation in the 1980s, the UK has played
a central part in EU research and innovation actions. EU funding is an integral part of the UK research
and innovation landscape and many UK organisations are central actors in EU-funded projects and
research and innovation networks in Europe. The UK’s decision to withdraw from the EU entails
uncertainty and potential risks for many areas of UK research and innovation concerning future access
to EU programmes and funding. In this report, we have made use of existing data and evidence to
describe the role of EU funding for research and innovation in the UK and parts of the UK research and
innovation landscape that may be exposed in the event of a withdrawal from EU programmes.
The UK has been very successful in winning research and innovation grants from the EU Framework
Programmes. UK participants received a total of €7bn of research and innovation funding from FP7
(2007-2013) and have been awarded a further €2.6bn so far under Horizon 2020 (in the period 2014-
2016). Research and innovation is supported through the European Regional Development Fund
(ERDF), receiving €1.9bn during the previous programming period (2007-2013) and nearly €1.5bn in
the current period (2014-2020). Finally, our analysis shows that the European Investment Bank (EIB)
has signed loans for research and innovation-related activities in the UK of a value of some €5.9bn
(2007-2016), in large part for the development of university facilities.
UK Higher Education Institutions (HEIs) receive by far the largest share of EU funding for research and
innovation in the UK, including nearly two thirds of EU Framework Programme grants so far under
Horizon 2020 (based on CORDA data), and significant support from ERDF funds and EIB loans as well.
As a consequence, EU funding now accounts for a substantial proportion of research income in many
HEIs and academic disciplines. Some disciplines receive very large amounts of income from research
grants and contracts from EU government bodies every year, more than €100m in the case of Clinical
Medicine. Other disciplines, often with smaller research budgets, rely on funding from EU government
bodies for a much larger proportion of research income. Archaeology is a case in point, as 38% of income
from research grants and contracts within this discipline is derived from EU government bodies. A
number of other academic disciplines, many in the social sciences and humanities, are similarly exposed
with figures above 20% too.
UK industry also receives substantial amounts of EU funding for research and innovation. UK SMEs are
among the most successful in attracting EU funding and the amounts of funding awarded to UK SMEs
during FP7 is equivalent to more than 15% of R&D expenditure by SMEs in the UK. For larger
companies, the grant money is often not the primary motivation for participating in EU initiatives. For
industry stakeholders consulted for this study, access to networks and strategic initiatives were among
recurring concerns and several also emphasised the role of EU funding in supporting broader ‘eco-
systems’ within which they operate.
The UK Research Councils and other national funding bodies account for a much larger share of research
funding made available to UK researchers than EU programmes. Yet, there are certain types of activities
and projects which tend only to be funded by EU sources, and which may be difficult to replicate at the
UK level. Very large collaborative initiatives, such as Joint Technology Initiatives (JTIs) and Public-
Public Partnerships (P2P), have budgets running into the billions and, as illustrated in our case studies,
offer opportunities for large-scale collaboration and coordination not available in UK national
programmes. The European Research Council (ERC) has established itself as a major new source of
funding for investigator-driven frontier research and offers grants of a size usually not available to UK
researchers outside of the medical sciences. Grants from the ERC and Marie Skłodowska-Curie Actions
now account for some 50% of the value of personal awards to UK researchers, and offer new
opportunities in disciplines where no other such grants exist.
Finally, the report considered the leverage effect of EU funding. Public support for research and
innovation tend to ‘crowd in’ funding from other sources. According to our conservative estimate, the
UK’s participation in EU Framework Programmes – the €9.6bn awarded to UK participants from FP7

44
and Horizon 2020 (so far) – will lead to a total increase in research and innovation expenditure of
€16.6bn. This goes beyond the contributions made by participants given the rules of engagement set up
for the different instrument in the programmes.
This report provides an overview of the role of EU funding in UK research and innovation, primarily
based on existing sources of data on funding from EU and UK sources. This approach helps map volumes
and proportions of EU funding across disciplines, sectors, institutions and regions in the UK, but
necessarily provides a partial view of the role that EU funding plays. Some of the wider effects of
participating in EU-funded research and innovation projects are described in the short case studies
appended to this report, and these include issues such as access to networks and influence on policy
priorities.
This report focuses primarily on the current role of EU funding, and thereby provides the basis for
considering the implications of the UK’s decision to leave the EU. The UK government has guaranteed
funding for projects selected under the current EU Framework Programme, Horizon 2020, and for ESIF
projects already signed.44 Beyond this, there are different scenarios and policy options for the UK’s
future association with the EU research and innovation programmes, for example as a member of the
European Economic Area (EEA) or through bilateral agreements as an ‘associated’ or a ‘third country’.45
The terms of association will have implications for funding arrangements, regulatory requirements, and
the ability of the UK to influence EU programming priorities.
44 See: https://www.gov.uk/government/news/chancellor-philip-hammond-guarantees-eu-funding-beyond-date-uk-leaves-the-eu
45 Boekholt et al. (2012), Norway’s affiliation with the European Research Programmes: Options for the future, Technopolis Group for the Norwegian Ministry for Education and Research.


technopolis |group| United Kingdom 3 Pavilion Buildings Brighton BN1 1EE United Kingdom T +44 1273 204320 E [email protected] www.technopolis-group.com
Stakeholders consulted
• The Academy of Medical Sciences
• Association of Medical Research Charities (AMRC)
• Association of the British Pharmaceutical Industry (ABPI).
• The British Academy
• Cardiff University
• CBI (Confederation of British Industry)
• Centre for Research in the Arts, Social Sciences and Humanities (CRASSH), Cambridge University
• City, University of London
• Department for Business, Energy and Industrial Strategy (BEIS)
• Department for Skills and Higher Education, Welsh Government
• The Higher Education Funding Council for England (HEFCE)
• Innovate UK
• IoD Scotland
• Learned Society of Wales
• McDonald Institute for Archaeological Research, University of Cambridge
• National Physical Laboratory (NPL)
• Research Councils UK (RCUK)
• Rolls-Royce
• The Royal Academy of Engineering
• The Royal Society
• The Royal Society of Edinburgh
• The Royal Irish Academy
• Scottish Enterprise
• Scottish Funding Council (SFC)
• Shadow Robot Company
• TechUK
• UK Digital Catapult
• University of Southampton
• University of Ulster
• The Wellcome Trust

technopolis |group| United Kingdom 3 Pavilion Buildings Brighton BN1 1EE United Kingdom T +44 1273 204320 E [email protected] www.technopolis-group.com
REF2014 Units of Assessment and HESA cost centres
Table 19 REF2014 Units of Assessment (UOAs) and corresponding HESA cost centres
Main Panel
Unit of Assessment Unit of Assessment Name
HESA cost centre(s)
HESA cost centre(s) Name
A 1 Clinical Medicine 101 Clinical medicine
A 2 Public Health, Health Services and Primary Care
102 and 105
Clinical dentistry and Health & community studies
A 3 Allied Health Professions, Dentistry, Nursing and Pharmacy
102 and 103 and 107
Clinical dentistry and Nursing & allied health professions and Pharmacy & pharmacology
A 4 Psychology, Psychiatry and Neuroscience 104 Psychology & behavioural sciences
A 5 Biological Sciences 106 and 112 and 127
Anatomy & physiology and Biosciences and Anthropology & development studies
A 6 Agriculture, Veterinary and Food Science 109 and 110
Veterinary science and Agriculture, forestry & food science
B 7 Earth Systems and Environmental Sciences 111 Earth, marine & environmental sciences
B 8 Chemistry 113 Chemistry
B 9 Physics 114 Physics
B 10 Mathematical Sciences 122 Mathematics
B 11 Computer Science and Informatics 121 IT, systems sciences & computer software engineering
B 12
Aeronautical, Mechanical, Chemical and Manufacturing Engineering 116 and 120
Chemical engineering and Mechanical, aero & production engineering
B 13
Electrical and Electronic Engineering, Metallurgy and Materials 117 and 119
Mineral, metallurgy & materials engineering and Electrical, electronic & computer engineering
B 14 Civil and Construction Engineering 118 Civil engineering
B 15 General Engineering 115 General engineering
C 16 Architecture, Built Environment and Planning 123
Architecture, built environment & planning
C 17 Geography, Environmental Studies and Archaeology
111 and 124 and 126
Earth, marine & environmental sciences and Geography & environmental studies and Archaeology
C 18 Economics and Econometrics 129 Economics & econometrics
C 19 Business and Management Studies 133 Business & management studies
C 20 Law 130 Law
C 21 Politics and International Studies 128 Politics & international studies
C 22 Social Work and Social Policy 131 Social work & social policy

technopolis |group| United Kingdom 3 Pavilion Buildings Brighton BN1 1EE United Kingdom T +44 1273 204320 E [email protected] www.technopolis-group.com
Main Panel
Unit of Assessment Unit of Assessment Name
HESA cost centre(s)
HESA cost centre(s) Name
C 23 Sociology 132 Sociology
C 24 Anthropology and Development Studies 127 Anthropology & development studies
C 25 Education 135 and 136* Education and Continuing education
C 26 Sport and Exercise Sciences, Leisure and Tourism
108 and 134*
Sports science & leisure studies and Catering & hospitality management
D 27 Area Studies 125 Area studies
D 28 Modern Languages and Linguistics 137 Modern languages
D 29 English Language and Literature 138 English language & literature
D 30 History 139 History
D 31 Classics 140 Classics
D 32 Philosophy 141 Philosophy
D 33 Theology and Religious Studies 142 Theology & religious studies
D 34 Art and Design: History, Practice and Theory 143 Art & design
D 35 Music, Drama, Dance and Performing Arts 144 Music, dance, drama & performing arts
D 36
Communication, Cultural and Media Studies, Library and Information Management 145 Media studies
*Costs centres excluded from the analysis by discipline

technopolis |group| United Kingdom 3 Pavilion Buildings Brighton BN1 1EE United Kingdom T +44 1273 204320 E [email protected] www.technopolis-group.com
Overview EU Framework Programmes
The structure of FP7 and Horizon 2020
The EU’s multi-annual Framework Programmes for research and innovation represent the main
instrument for funding and supporting research and innovation at a European level. They provide
funding support to promote the achievement of the following objectives (now at the core of the Eighth
Framework Programme, Horizon 2020):
• Strengthening Europe’s position in global science, through support for top level research
• Reinforcing industrial leadership in innovation, including major investment in key technologies,
greater access to capital and support for SMEs
• Helping to address major societal challenges such as climate change, developing sustainable
transport and mobility, making renewable energy more affordable, ensuring food safety and
security, or coping with the challenge of an ageing population
FP7
The Seventh Framework Programme, FP7 (2007-2013), was organised around four pillars as shown
Figure 11. Additionally, in 2007 the European Commission introduced the Joint Technology Initiatives
(JTIs). This marked the first time that Public-Private Partnerships, involving industry, the research
community and public authorities, were proposed at European level to pursue ambitious common
research objectives. Six JTIs were funded under FP7 in the areas of innovative medicines (IMI),
aeronautics (Clean Sky), embedded computing systems (ARTEMIS), nanoelectronics (ENIAC),
hydrogen fuel cells (FCH) and space (GMES).46 FP7 was also ‘adopted’ by the Europe 2020 strategy
(2010) as a key instrument in the pursuit of a smart, sustainable and inclusive economy.
46 Note, GMES was not implemented as a JTI in a strict sense, but rather through a delegated agreement with ESA, which co-
financed 60% of the GMES space component, with the Commission delegating c. €750M of FP7 funds to ESA for the design, development and implementation of the Sentinels earth observation satellites.

technopolis |group| United Kingdom 3 Pavilion Buildings Brighton BN1 1EE United Kingdom T +44 1273 204320 E [email protected] www.technopolis-group.com
Figure 11 Pillars and programmes in FP7
Horizon 2020
The Eighth Framework Programme, Horizon 2020 (2014-2020), marks a further development of EU
Framework Programmes. The rationale for research and innovation policy intervention at the EU level
is driven by European added value, i.e. in support of the Europe 2020 agenda and the completion of the
single market. The Framework Programme for research and innovation intervenes above all in
transnational activities, promoting competition among top researchers, enhancing cross-border
cooperation in order to address common societal challenges and the competitiveness of the European
economy. The Horizon 2020 programme is structured around three main pillars (figure below). As in
FP7, it includes the European Research Council (ERC) and a programme on nuclear research, but also
incorporates what was previously the separate Innovation Programme and European Institute of
Innovation and Technology.
Horizon 2020 has also introduced a series of new or improved funding instruments, including the SME
Instrument, access to finance and novel public procurement methodologies. The programme has
enhanced the use of the co-funding system (used in FP7), which allows EU funds to be granted to
national funders to strengthen the international engagement of what are essentially national schemes
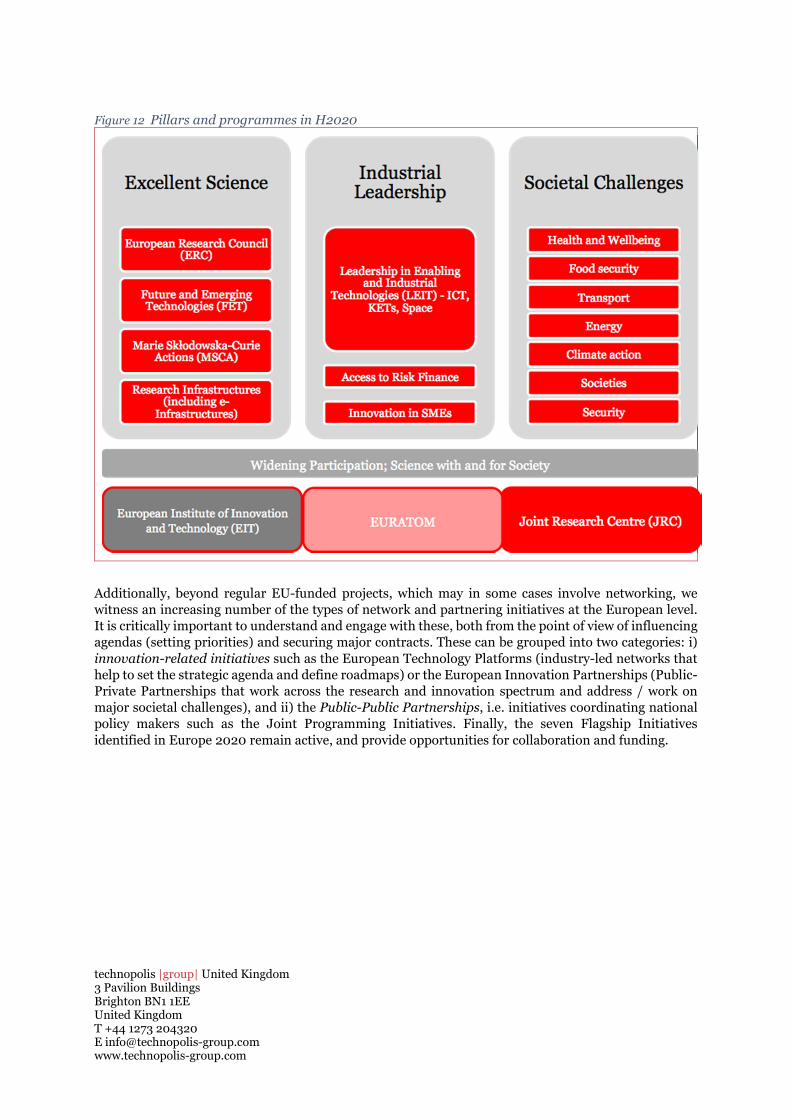
technopolis |group| United Kingdom 3 Pavilion Buildings Brighton BN1 1EE United Kingdom T +44 1273 204320 E [email protected] www.technopolis-group.com
Figure 12 Pillars and programmes in H2020
Additionally, beyond regular EU-funded projects, which may in some cases involve networking, we
witness an increasing number of the types of network and partnering initiatives at the European level.
It is critically important to understand and engage with these, both from the point of view of influencing
agendas (setting priorities) and securing major contracts. These can be grouped into two categories: i)
innovation-related initiatives such as the European Technology Platforms (industry-led networks that
help to set the strategic agenda and define roadmaps) or the European Innovation Partnerships (Public-
Private Partnerships that work across the research and innovation spectrum and address / work on
major societal challenges), and ii) the Public-Public Partnerships, i.e. initiatives coordinating national
policy makers such as the Joint Programming Initiatives. Finally, the seven Flagship Initiatives
identified in Europe 2020 remain active, and provide opportunities for collaboration and funding.

technopolis |group| United Kingdom 3 Pavilion Buildings Brighton BN1 1EE United Kingdom T +44 1273 204320 E [email protected] www.technopolis-group.com
Types of actions and grant characteristics under Horizon 2020
Table 20 Horizon 2020 – Types of Action
Type of Action47
Code Minimum Conditions48
Funding Rate
Typical Duration
Average EC Contribution
Aim
Research & Innovation Action
RIA ≥ 3 legal entities from 3 MS/AC
100% 36-48 months
€ 2.0 - 5.0M collaborative research projects
Innovation Action
IA ≥ 3 legal entities from 3 MS/AC
70%49 30-36 months
€ 2.0 - 5.0M
produce plans & arrangements or designs for new, altered or improved products, processes or services
Coordination & Support Action
CSA 1 legal entity 100% 12-30 months
€ 0.5 - 2.0M
accompanying measures (standardisation, dissemination, policy dialogues etc.) no research
MSCA50 (except Cofund)
MSCA
facilitate mobility of researchers for training & career development
ERC Grants ERC 1 legal entity in MS/AC
100% 60 months
Starting: ≤ €2.00M
Consolidator: ≤ €2.75M
Advanced: ≤ €3.50M
support excellent investigators and their research teams to pursue ground-breaking, high-gain/ high-risk research
Prizes PRI 1 legal entity n/a n/a variable
• recognise past achievements
• induce future activities
SME Instrument
SME 1 SME in MS/AC
3 phases:
• Phase 1: lump sum of € 50K / project
• Phase 2: € 1 – 2.5M / project (1-2 years) (70% of eligible costs reimbursed)
• Phase 3: no funding
combination of demonstration activities (testing, prototyping, …), market replication
Fast Track to Innovation
FTI ≤ 5 legal entities from 5 MS/AC
70%3 tbd ≤ €3.0M
produce plans & arrangements or designs for new, altered or improved products, processes or services
MSCA Cofund MSCA Cofund
1 legal entity 50% 36-60 months
≤ €10.0 M
Co-funding of regional, national & international doctoral & fellowship programmes
47 Defined in the Work Programme.
48 Additional conditions may be listed in the respective Work Programmes.
49 100% for non-profit organisation (= any legal entity except companies)
50 MSCA = Marie Skłodowska Curie Actions

technopolis |group| United Kingdom 3 Pavilion Buildings Brighton BN1 1EE United Kingdom T +44 1273 204320 E [email protected] www.technopolis-group.com
Type of Action47
Code Minimum Conditions48
Funding Rate
Typical Duration
Average EC Contribution
Aim
ERA-NETs ERA-NET
≥ 2 legal entities in MS/AC
33% 60 months variable, see respective topic
coordinate research efforts of participating MS/AC in the field described & implement joint transnational call for proposals with EU co-funding
Pre-Commercial Procurement
PCP ≥ 3 public procurers from MS/AC
70%
18-48 months for 2 Phases: A) Preparation B) Execution
variable, see respective topic
enable the public sector as a technologically demanding buyer to encourage research, development and validation of breakthrough solutions in areas of public interest
Public Procurement of Innovative Solutions
PPI ≥ 3 public procurers from MS/AC
20%
18-48 months for 2 Phases: A) Preparation B) Execution
variable, see respective topic
enable trans-national buyer groups of procurers to share the risks of acting as early adopters of innovative goods or services which are not yet available on a large-scale commercial basis
Source: Euresearch

technopolis |group| United Kingdom 3 Pavilion Buildings Brighton BN1 1EE United Kingdom T +44 1273 204320 E [email protected] www.technopolis-group.com
UK participation in Horizon 2020 European Research Council and Marie Skłodowska-
Curie Actions
Figure 13 ERC grants with UK-based Principal Investigators
Source: CORDA
Table 21 Horizon 2020 MSCA grants with UK-based Principal Investigator
Number of projects Sum of maximum EU contribution
Innovative Training Networks 85 € 281m
Individual Fellowships 875 € 167m
Research and Innovation Staff Exchange 44 € 32m
Co-funding of regional, national and international programmes 7 € 23m
European Researchers' Night (NIGHT) / Trans-national cooperation among Marie Skłodowska-Curie National Contact Points (NCP) 10 € 2m
Total 1,021 € 504m
Source: CORDA

technopolis |group| United Kingdom 3 Pavilion Buildings Brighton BN1 1EE United Kingdom T +44 1273 204320 E [email protected] www.technopolis-group.com
Overview of support from the European Structural and
Investment Funds to research and innovation projects in the UK
Overview of European Structural and Investment Funds (ESIF)
The five European Structural and Investment Funds (ESIF) are: the European Regional Development
Fund, the European Social Fund (ESF), the Cohesion Fund, the European Agricultural Fund for Rural
Development (EAFRD), and the European Maritime and Fisheries Fund (EMFF). EU funding for UK
research and innovation comes primarily through the ERDF, as shown in Figure 14.
Figure 14 Planned EU funding for the UK under the European Structural and Investment Funds (2014-2020)
Source: EU Cohesion data and UK ERDF operational programmes
EU funding for UK research and innovation under ERDF
Priorities for ERDF funding are determined in a multilevel process: The Common Strategic Framework
is set at the EU level and a Partnership Agreement is agreed between the European Commission and the
Member States, translating the programme objectives into the national or regional context. Finally,
national or regional bodies develop Operational Programmes detailing how the funds will be
implemented during the programming period.51
Table 22 details the planned expenditure on research and innovations contained in the five UK
operational programmes for ERDF (2014-2020). Most but not all actions are contained with ERDF
‘Priority Axis 1’, research and innovation.
51 See, for example, Briefing: How the budget is spent - The European Structural and Investment Funds, European Parliament, July 2015.
€ 4,278m
€ 1,476m
€ 4,736m
€ 412m
€ 5,200m
€ 243m
European Regional DevelopmentFund (ERDF) - excl. R&I
European Regional DevelopmentFund (ERDF) - R&I only
European Social Fund (ESF)
ESF / Youth EmploymentInitiative (YEI)
European agricultural fund forrural development (EAFRD)
European maritime and fisheriesfund (EMFF)

technopolis |group| United Kingdom 3 Pavilion Buildings Brighton BN1 1EE United Kingdom T +44 1273 204320 E [email protected] www.technopolis-group.com
Table 22 Planned EU funding for research and innovation projects in the UK under ERDF (2014-2020)
ERDF intervention field England Wales [1] Scotland Northern Ireland
UK total
001. Generic productive investment in small and medium –sized enterprises (‘SMEs’)
€ 0 € 0 € 16.5m € 0 € 16.5 m
02 Research and innovation processes in large enterprises
€ 0 € 9.2m € 0 € 0 € 9.2m
056 – investment in infrastructure, capacities and equipment in SMEs directly linked to research and innovation activities
€ 102.8m € 17.8m € 0 € 76.1m € 196.8m
57 Investment in infrastructure, capacities and equipment in large companies directly linked to research and innovation activities
€ 0 € 5.9m € 0 € 32.6m € 38.6m
058 – research and innovation infrastructure (public) € 55.3m € 69.7m € 0 € 0 € 125.0m
059 - research and innovation infrastructure (private, including science parks)
€ 55.3m € 23.7m € 0 € 0 € 79.1m
060 – research and innovation activities in public research centres and centres of competence including networking
€ 55.3m € 18.4m € 0 € 0 € 73.7 m
061 - research and innovation activities in private research centres including networking
€ 53.3m € 9.2m € 0 € 0 € 62.5m
062 – technology transfer and university-enterprise cooperation primarily benefiting SMEs
€ 100.8m € 55.2m € 47.0m € 0 € 203.0m
063 – cluster support and business networks primarily benefiting SMEs
€ 100.8m € 27.6m € 0 € 0 € 128.4m
064 – Research and innovation processes in SMEs (including voucher schemes, process, design, service and social innovation)
€ 100.8m € 63.9m € 48.0m € 4.7m € 217.4m
065 – Research and innovation infrastructure, processes, technology transfer and cooperation in enterprises focusing on the low carbon economy and on resilience to climate change
€ 88.9m € 86.2m € 46.1m € 0 € 221.3m
067 – SME business development, support to entrepreneurship and incubation (including support to spin offs and spin outs)
€ 102.8m € 0 € 0 € 0 € 102.8m
101 Cross-financing under the ERDF (support to ESF-type actions necessary for the satisfactory implementation of the ERDF part of the operation and directly linked to it)
€ 0 € 1.5m € 0 € 0 € 1.5m
TOTAL Research and Innovation funding € 816.1m € 388.4 € 157.6m € 113.5m € 1,475.6m
Source: Operational programmes for ERDF 2014-2020 (England, East Wales, West Wales and the Valleys, Northern Ireland, Scotland). Note [1]: The ‘Wales’ column adds figures from the two Welsh operational programmes

technopolis |group| United Kingdom 3 Pavilion Buildings Brighton BN1 1EE United Kingdom T +44 1273 204320 E [email protected] www.technopolis-group.com
European Investment Bank (EIB) support for research and
innovation in the UK
Overview of EIB loans to the UK
Figure 15 EIB loans to the UK (signed 2007-2016), by sector.
Source: EIB loans list (http://www.eib.org/projects/loan/list/index.htm)

technopolis |group| United Kingdom 3 Pavilion Buildings Brighton BN1 1EE United Kingdom T +44 1273 204320 E [email protected] www.technopolis-group.com
EIB loans to research and innovation-related projects in the UK
Table 23 Loans from the European Investment Bank (EIB) to research and innovation-related projects in the UK, contracts signed between 2007 and 2016.
EIB Sector Value of loans to UK Universities and Knowledge Transfer services
Value of loans to UK Businesses for R&D activities
Value of loans for the UK “Knowledge Economy programme”
Energy - € 141.1m -
Transport - - -
Urban development - - -
Health - - -
Education € 2,624.5m - € 500.6m
Credit lines - - -
Water, sewerage - - -
Telecommunications - € 9.5m -
Services € 223.9m € 129.1m -
Industry - € 2,251.4m -
Solid waste - - -
Total € 2,848.5m € 2,531.2m € 500.6m
Source: EIB loans list (http://www.eib.org/projects/loan/list/index.htm) Note: These figures are based on a manual categorisation by the study team, based on recipients and project descriptions.
EIB loans to UK universities
Figure 16 EIB university investments 2011-2016, by year of loan agreement
Source: EIB loans list (http://www.eib.org/projects/loan/list/index.htm)
€ 246,646,860
€ 135,306,706
€ 397,353,346
€ 553,916,190
€ 761,964,397
€ 670,485,323
2011
2012
2013
2014
2015
2016
EIB university investments in the UK, 2011-2016, By year

technopolis |group| United Kingdom 3 Pavilion Buildings Brighton BN1 1EE United Kingdom T +44 1273 204320 E [email protected] www.technopolis-group.com
Table 24 EIB loans to UK universities and knowledge transfer organisations, signed between 2007 and 2016
University Year
(signa
ture) Loan amount Description
University of Bristol
Infrastructure
2007 € 87.9m Upgrading of teaching and research facilities of Bristol University through
new construction and refurbishment of existing buildings.
University of York 2010 € 53.0m Construction and development of new university campus (Heslington East).
University of
Strathclyde 2011 € 100.9 m
Restructuring of the two main locations of the Strathclyde University in
Glasgow (Scotland)
University of Birmingham
2011 € 87.6m Construction of a new library, sports facility and installation of energy-efficient systems
University of
Edinburgh 2012 € 59.9m
Reconstruction and modernization of buildings on the campus of the
University of Edinburgh
Swansea
University 2012 € 31.7m
Establishment of an innovation platform with the aim of giving new impetus
to the economy of the Wales region through R & D activities in cooperation
with companies
Swansea
University 2012 € 43.8m
Establishment of an innovation platform with the aim of giving new impetus
to the economy of the Wales region through R & D activities in cooperation
with companies
University of East
Anglia 2013 € 47.4m
Development and refurbishment of campus of University of East Anglia in
Norwich
University of Leicester
2013 € 65.1m Support for University of Leicester campus development
Imperial
Innovations RDI 2013 € 35.0m
R&D and commercialisation of innovations developed by leading UK
universities in life sciences sector
University of
Exeter 2013 € 80.1m
The programme loan aims to fund a range of capex investments in British
research-intensive higher education institutions.
University of Bath 2013 € 74.4m
Refurbishment and restructuring of academic and administrative space aim
to improve spaces and facilities within faculties, to cater for growth in student and staff numbers and to enhance the overall student experience.
City of Glasgow
College PPP 2013 € 95.3m
Construction and maintenance of a new campus at two locations for the City
of Glasgow College
University of
Ulster 2014 € 182.6m
Relocation to Belfast City Centre by 2018 and upgrades at Magee, Coleraine
and Jordanstown campuses
Bangor University 2014 € 54.5m Bangor University campus investment and expansion
University of Kent 2014 € 94.3m Teaching and research facilities
ICL Research and
Teaching Excellence
2014 € 178.5m
The project entails the construction of the Research and Translation Hub,
new academic, research, laboratory and office buildings on the new Imperial
West Campus situated in the London Borough of Hammersmith & Fulham, as
well as renovation of the College’s Aeronautics and Mechanical Engineering buildings, located in the London Borough of Kensington & Chelsea.
Renovation and expansion of the College’s general laboratory and student
accommodation stock are also included in the project.

technopolis |group| United Kingdom 3 Pavilion Buildings Brighton BN1 1EE United Kingdom T +44 1273 204320 E [email protected] www.technopolis-group.com
Aston University 2014 € 44.0m
The project concerns the construction, redevelopment and refurbishment of
facilities of the Aston University (AU) Business School, Institute of Photonic
Technologies, School of Languages and Social Sciences, Medical School and the University’s main building on the campus in Birmingham.
University of Lincoln Higher
Education Corp
2015 € 67.3m
The project entails the construction of new buildings for the Schools of
Psychology, Health and Social Care (the Sarah Swift building) and for the
School of Engineering, Computing, Maths and Physics (the Isaac Newton building) on the University of Lincoln Brayford Campus in the city of Lincoln.
Refurbishment of the Joseph Banks Laboratories, development of Marina
Courts student accommodation and additional catering facilities, as well some
complementary reconfiguration and adaptation works are also included.
University of Hull 2015 € 54.2m Capital investment programme dedicated to the development and
refurbishment of the University of Hull's campus.
IP Group
Innovation
Investment
2015 € 42.4m
The project concerns investments in research and development (R&D) into
innovative start-up companies and SMEs. The borrower holds and manages a
portfolio of high-tech innovative spin-out companies and small and medium-
sized enterprises (SMEs) in five different sectors (energy & renewables; medical equipment & supplies; pharma & biotech; IT & communications;
chemicals & materials) in the UK.
Oxford University
Research & Teaching
Excellence
2015 € 278.8m For Oxford University’s programme of improvement and expansion of research and teaching facilities. This represents the largest ever single loan for
university investment by the EIB.
Imperial
Innovations – Life Sciences Research
2015 € 70.3m
The new loan will be used to support equity investment in life science spin-off
companies and follows the successful investment of a GBP 30 million EIB loan agreed two years ago
University of the
West of England Bristol
2015 € 86.0m
The project concerns the refurbishment of existing teaching and research
buildings and construction of new general teaching buildings at the current University of the West of England Frenchay Campus in Bristol.
University College
London Campus
Development
2015 € 163.0m
The 30-year loan will provide funding for UCL’s Bloomsbury campus in
central London which is undergoing an ambitious programme to upgrade and
expand its historic buildings as well as finance for the building of UCL East,
the university’s new site at the Queen Elizabeth Olympic Park in east London.
University of
Newcastle 2016 € 129.3m
Suite of projects including building refurbishment, the £58m Urban Sciences
Building and the £40m National Ageing Science and Innovation Centre.
University of Edinburgh Capex
Programme 2016 € 257.0m
Increase the relevance and quality of teaching, learning and academic
research capacity at the university by increasing and improving the overall quality of the existing academic space. The project will contribute to human
capital formation and research, development and innovation (RDI)
capabilities in the UK.
University College
London Campus
Development 2016 € 202.7m Development of the Bloomsbury and UCL East campuses.
Bangor University 2016 € 10.2m Bangor University campus investment and expansion
Swansea University Campus
Optimisation 2016 € 71.3m Enhance the Singleton Park Campus and expand research facilities at the new
Bay Campus.
Source: EIB funded projects data: http://www.eib.org/projects/loan/list/index.htm


