+ All Categories
Home > Documents > THE ROLE OF FAMILISM IN EXPLAINING THE HISPANIC...

THE ROLE OF FAMILISM IN EXPLAINING THE HISPANIC...

Date post: 26-Mar-2018
Category:
Upload: lamdang
View: 216 times
Download: 1 times
Share this document with a friend
53
THE ROLE OF FAMILISM IN EXPLAINING THE HISPANIC-WHITE COLLEGE APPLICATION GAP * by Matthew Desmond and Ruth N. López Turley Department of Sociology University of Wisconsin – Madison * This research was supported by the National Science Foundation (GRANT # SES-0350990), the Office of Population Research at Princeton University (NICHD Grant # R24 H0047879), and grants from the Ford, Mellon, Hewlett and Spencer Foundations. We thank Marta Tienda, Thurston Domina, John Levi Martin, Steven Alvarado, and four anonymous reviewers for their stimulating comments.
Transcript

THE ROLE OF FAMILISM IN EXPLAINING THE HISPANIC-WHITE

COLLEGE APPLICATION GAP *

by

Matthew Desmond

and

Ruth N. López Turley

Department of Sociology University of Wisconsin – Madison

* This research was supported by the National Science Foundation (GRANT # SES-0350990), the Office of Population Research at Princeton University (NICHD Grant # R24 H0047879), and grants from the Ford, Mellon, Hewlett and Spencer Foundations. We thank Marta Tienda, Thurston Domina, John Levi Martin, Steven Alvarado, and four anonymous reviewers for their stimulating comments.

The Role of Familism in Explaining the Hispanic-White College Application Gap

Abstract

Compared to other ethnic and racial groups, Hispanic youth are worse off in every

available measure of educational achievement and attainment at the primary, secondary, and

postsecondary levels. Using data from the Texas Higher Education Opportunity Project (2002),

we explore the degree to which students’ preferences to stay home for college can help explain

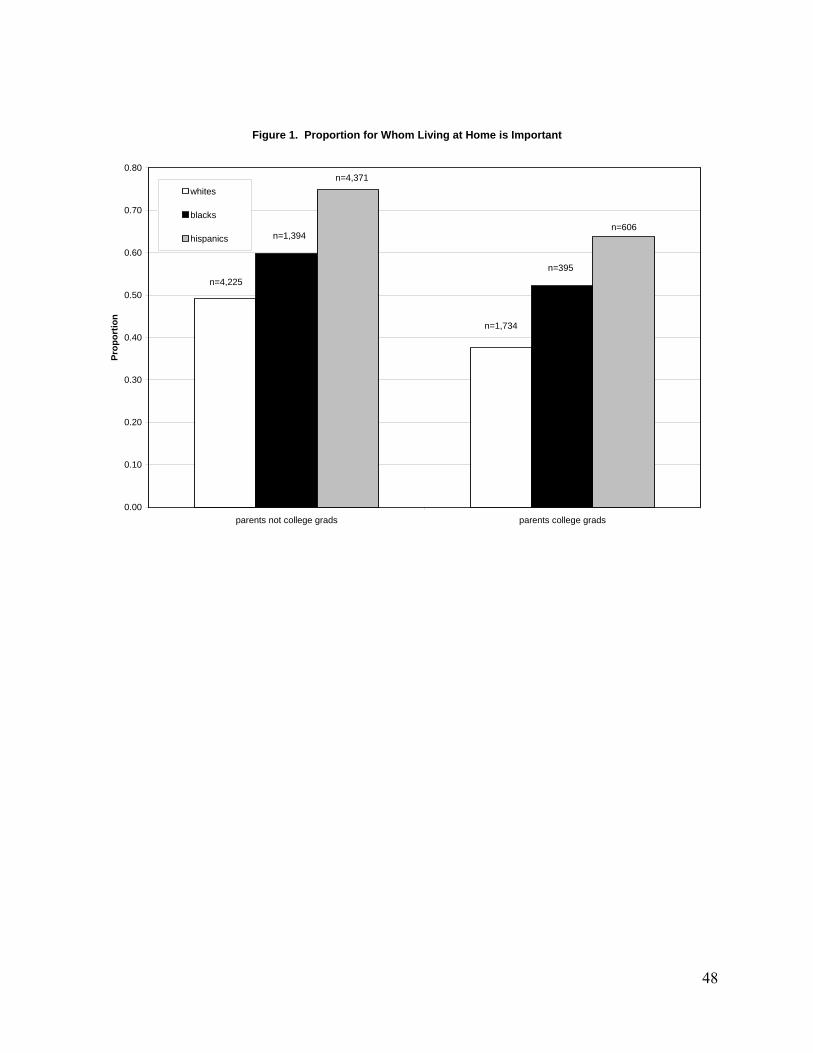
the low college application rates of Hispanic students. Among high school seniors, we find that

(1) Hispanics are the most likely to report it is important to live at home during college, even

those with college-educated parents; (2) net of other factors, students who indicate it is important

to stay home are significantly less likely to apply to college, especially to selective institutions;

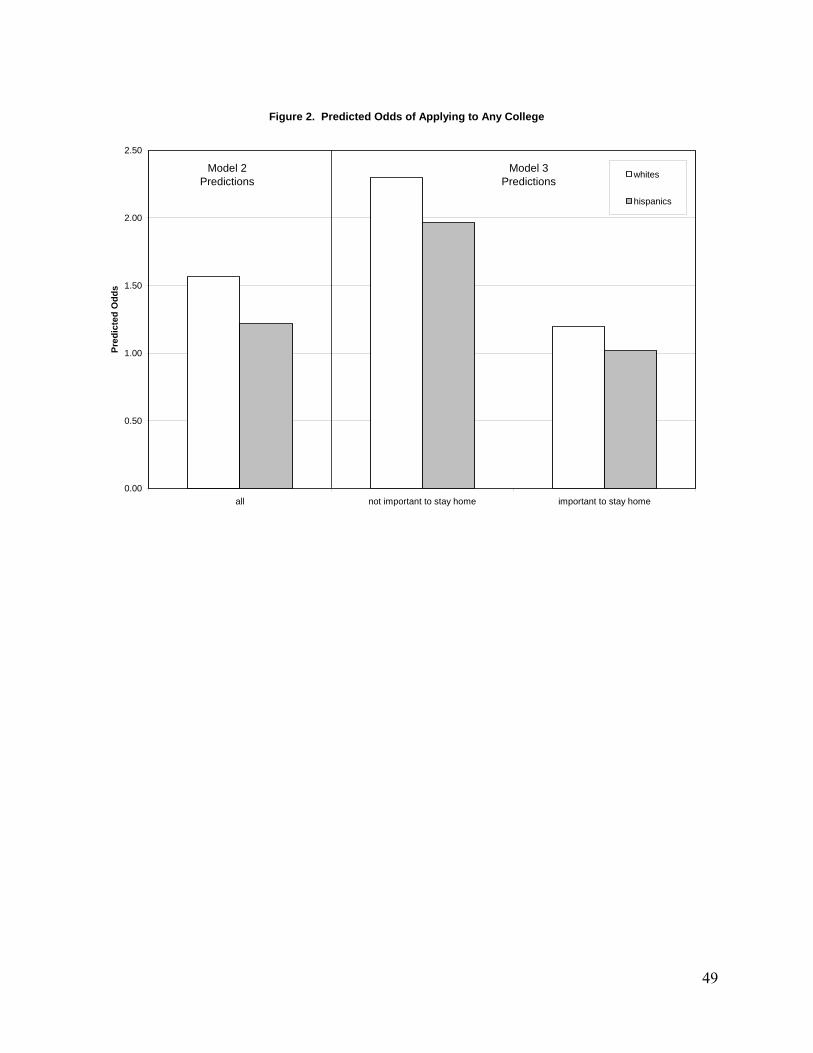
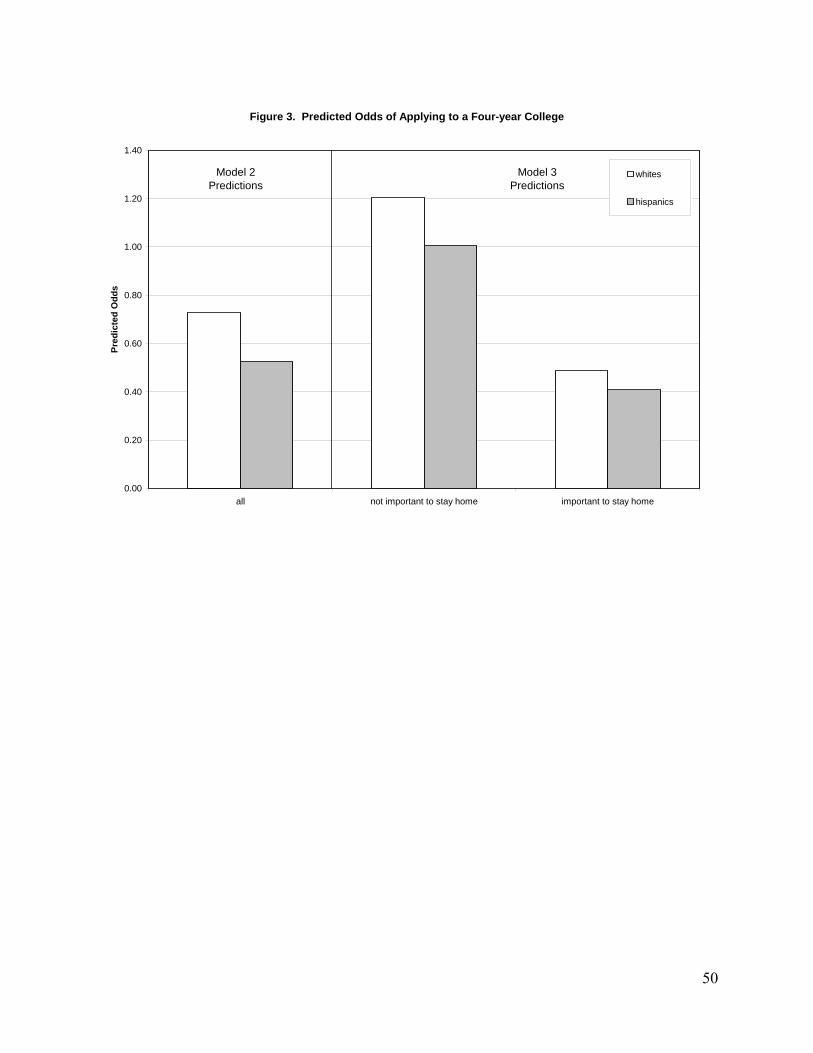
and (3) taking account of the preference to stay home significantly reduces the Hispanic-white

gap in applying to any college and a four-year college, and it makes the gap in applying to a

selective college disappear.

The Role of Familism in Explaining the Hispanic-White College Application Gap

State of the Problem

It is well-established that Hispanic youth, who make up no less than one-fifth of U.S.

public school students (U. S. Census Bureau 2002), are worse off in every available measure of

educational achievement and attainment at the primary, secondary, and postsecondary levels, and

that their access to and attendance at institutions of higher education remains, as it did nearly

forty years ago (Astin 1982), the lowest in the country vis-à-vis non-Hispanic whites, blacks, and

Asians.

In a nation where individuals can be more or less confident that their economic

prosperity, familial stability, and physical vitality will increase with educational attainment,

Hispanic students have the lowest educational aspirations and expectations of all major racial

and ethnic groups. Unlike other racial and ethnic groups, the majority of Hispanics do not

graduate from high school (Chapa and De La Rosa 2004). Non-Hispanic white, black, and Asian

high school seniors are far more likely to submit college applications than Hispanic seniors.

(Henceforth, we use simply “white” and “black” to refer to non-Hispanic whites and blacks.)

According to one study, only 47% of surveyed Hispanic seniors submitted an application, and a

quarter of those, a group that included many high-achieving students, applied to only one college

(Hurtado et al. 1997). Only 22% of Hispanics between the ages of 18 and 24 enrolled in a

postsecondary institution in 2000, compared to 39% of whites and 31% of blacks in this age

bracket (National Center for Education Statistics 2003). Most Hispanics who enroll in

postsecondary institutions attend community and two-year colleges (Chapa and De La Rosa

2004), institutions that do far less than selective four-year universities to equip students with the

skills, network ties, and pedigrees necessary to compete in a swelling knowledge economy.

1

Hispanic students who attend four-year universities are less likely to attend prestigious

institutions, relative to Asian and white students (Karen 2002); and those select few who enroll

in four-year universities are more likely to drop out after their first year, with an attrition rate of

34%, a rate that far outpaces that of blacks (29%), whites (25%), and Asians (14%) (Peng 1988).

College completion rates show equally alarming patterns. In 1980, only 8% of college

graduates were Hispanic, and that percentage rose a mere two points in 2000, a paltry increase

given the rapid demographic growth of Hispanic youth over the last two decades (Tienda and

Mitchell 2006). According to the National Center for Education Statistics (2003), the proportion

of Hispanic students graduating from college has not increased since 1990, despite the growth of

Hispanics within the United States, and, compared to Hispanics, whites are over three times, and

blacks are nearly two times, as likely to complete college. By one estimate, while 49% of

Asians, 30% of whites, and 16% of blacks enrolled in kindergarten today will grow up to earn a

bachelor’s degree, only 6% of Hispanics will obtain the same level of schooling (Williams

2003). All the evidence yields the conclusion that Hispanic students seem to be falling through

the cracks even as they are rising, en masse, at a population pace that is fundamentally altering

the American landscape.

Divergent Explanations and their Shortcomings

Researchers attempting to account for Hispanics’ low rates of educational achievement

and attainment have advanced at least three types of complementary explanations based on (1)

socioeconomic status and parental education, (2) inadequate schools and teachers, and (3) the

experiences faced by recent immigrants. We briefly take up these explanations in turn.

Socioeconomic status and parental education. — When calculating racial and ethnic gaps

in achievement and enrollment, socioeconomic status and parental education are regarded widely

2

as the most powerful predictors (Kao and Thompson 2003). An examination of individual

income estimates from 2006 reveals that, while whites on average made $38,253 a year, Asians

$40,511 a year, and blacks $26,919, Hispanics made only $25,674 a year. According to this

estimate, Hispanics earned roughly 33% less than whites in 2006. Some estimates place the

percentage even lower, finding that Hispanics earn a full 55% less. Recent research

approximates that one in five Hispanics lives below the poverty line (Tienda and Mitchell 2006),

a grim economic condition that severely limits the resources available to Hispanic children.

It is not surprising, then, that dozens of researchers have found that Hispanic students’

educational achievement increases when their parents’ socioeconomic status improves (Bradley

and Corwyn 2002; Brooks-Gunn and Duncan 1997; Vernez and Abrahamse 1996). Parental

education levels are a particularly important component of socioeconomic status; in some

analyses, their effect on college aspirations is equal to (and sometimes greater than) that of

family income (cf. Bohon et al. 2006). Not surprisingly, researchers have found that parental

education explains a significant portion of the low levels of Hispanic educational performance

(Chapa and Valencia 1993; Rodriguez and Morrobel 2004). Relative to other racial and ethnic

groups, Hispanic parents have particularly low levels of educational attainment, with Mexican

Americans having the lowest levels (National Center for Education Statistics 2003; Zambrana

1995).

Nevertheless, the low aspirations and expectations of Hispanic students seem to persist

even after controlling for socioeconomic status. And although a monotonic rise in educational

ambition has been documented among white students for each increasing interval of parental

education, the same cannot be said for Hispanic students. Indeed, at least one study has found

that “aspirations and expectations among Latino adolescents are not as sensitive to changes in the

3

levels of parental education as non-Latino whites are” (Bohon et al. 2006: 222). Moreover, as

network analysts long have argued, socioeconomic status manifests itself through students’

access to information only available through social ties (Kerckhoff and Campbell 1977; Stanton-

Salazar and Dornbusch 1995). Conventional status attainment models that do not take into

account the ways in which socioeconomic status is transferred to students through multiple social

networks fail to grasp the important interconnection between human capital and social capital

that Coleman (1988) articulated so forcefully.

Inadequate schools and teachers. — Pointing to the fact that Hispanic students are more

segregated in the educational realm than whites, blacks, or Asians, some analysts have attributed

low levels of Hispanic achievement and attainment to poor schools and unqualified teachers.

High levels of school segregation are negatively correlated with college enrollment and

completion (Orfield and Yun 1999). In Texas, Hispanic students attending public schools are

more likely to be taught by uncertified teachers than their white counterparts, and they are more

likely to drop out relative to other students (Haney 2000; Valencia 2000). Some researchers,

however, have cast doubt on the importance of deficient schools and teachers, claiming that, on

average, individual performance is affected only marginally by school quality, if at all (Arum

2000). And at least one researcher has argued that Hispanic students in segregated schools,

especially those employing minority teachers, are more receptive to schooling than their peers in

more integrated schools (Goldsmith 2004).

The struggles of immigrants. — Immigrants and children of immigrants comprise roughly

half of the entire population of Hispanic youth (Kao and Thompson 2003), and Hispanic

immigrants — foreign-born Mexican women, in particular — have exceptionally low levels of

educational attainment (Portes and Rumbaut 1996). As such, some researchers have accounted

4

for educational inequalities affecting Hispanic students by pointing to the unique struggles facing

recent immigrants. Yet this strand of literature is full of contradictory findings. Some have

found that Spanish use at home is associated with low aspirations and expectations (e.g., Valdes

2001), while others have found that students benefit greatly from bilingualism (e.g., Bohon et al.

2006). Moreover, while some claim that first-generation Hispanic students fare worse than

second- or third-generation students (White and Glick 2000; White and Kaufman 1997) and that

they have lower levels of attainment than native-born Hispanics (Tienda and Mitchell 2006;

Wojtkiewicz and Donato 1995), others have put forth opposite observations, finding that,

compared to first-generation Hispanic students, second-generation students have lower levels of

achievement (Driscoll 1999; Hirschman 2001; Rumbaut 1996) and less ambitious educational

aspirations (Kao and Tienda 1995; Suarez-Orozco and Suarez-Orozco 1995).

That socioeconomic status, parental education, school quality, and immigrant status are

important predictors of Hispanic educational performance and completion, few would deny.

Even taken together, however, these explanations cannot fully account for Hispanic

underachievement (Kao and Thompson 2003; Ream 2005). Another kind of explanation

investigates how familism affects educational outcomes. This approach is attractive for our

purposes not only because it incorporates the three aforementioned explanations within a

relational framework but also because numerous studies have concluded that familism is

especially pronounced in Hispanic culture—and that it may both help and hinder Hispanics in

school.

Hispanic Familism

Familism can be defined as a social pattern whereby individual interests, decisions, and

actions are conditioned by a network of relatives thought in many ways to take priority over the

5

individual. This social pattern manifests itself through three dimensions: (1) the attitudinal,

expressed in dispositions, values, and beliefs that prioritize the welfare of the family, (2) the

behavioral, expressed in everyday actions, or major decisions, informed by one’s attachment to

family ties, and (3) the structural, expressed in the spatial architecture of family networks

(Steidel and Contreras 2003; Valenzuela and Dornbusch 1994). Researchers from several

disciplines have observed that familism is an important component of Hispanic culture (Okagaki

and Frensch 1998; Oyserman et al. 2002). At the attitudinal level, Hispanic adults and

adolescents value interdependence, as well as family support and obligations, more so than

whites (Fuligni et al. 1999; Harrison et al. 1990; Sabogal et al. 1987). At the behavioral level,

Hispanics report higher degrees of familial cohesion and intimacy than whites (Niemann et al.

2000; Sabogal et al. 1987) and assist family members in instrumental ways more so than whites

(Sarkisian et al. 2006). And at the structural level, Hispanics, and Mexican Americans in

particular, live in larger and denser kinship networks than whites (Sarkisian et al. 2006;

Valenzuela and Dornbusch 1994).

It is no wonder, then, that researchers have explored how Hispanic familism affects

educational outcomes. By and large, they have discovered that Hispanic youth greatly benefit

from extended family ties. Psychologists have found that familism produces positive

psychological effects (Fuligni et al. 1999; Suarez-Orozco and Suarez-Orozco 1995), while

educational scholars argue that familism can mitigate the negative experiences associated with

minority status (Zhou and Bankston 1998). High academic performance of Mexican American

students has been linked to social capital provided by family and peer networks (Ream 2005;

Stanton-Salazar and Dornbusch 1995). Some have found that, while whites gain nothing from

familism when it comes to achievement, Hispanics gain much, on the condition that their parents

6

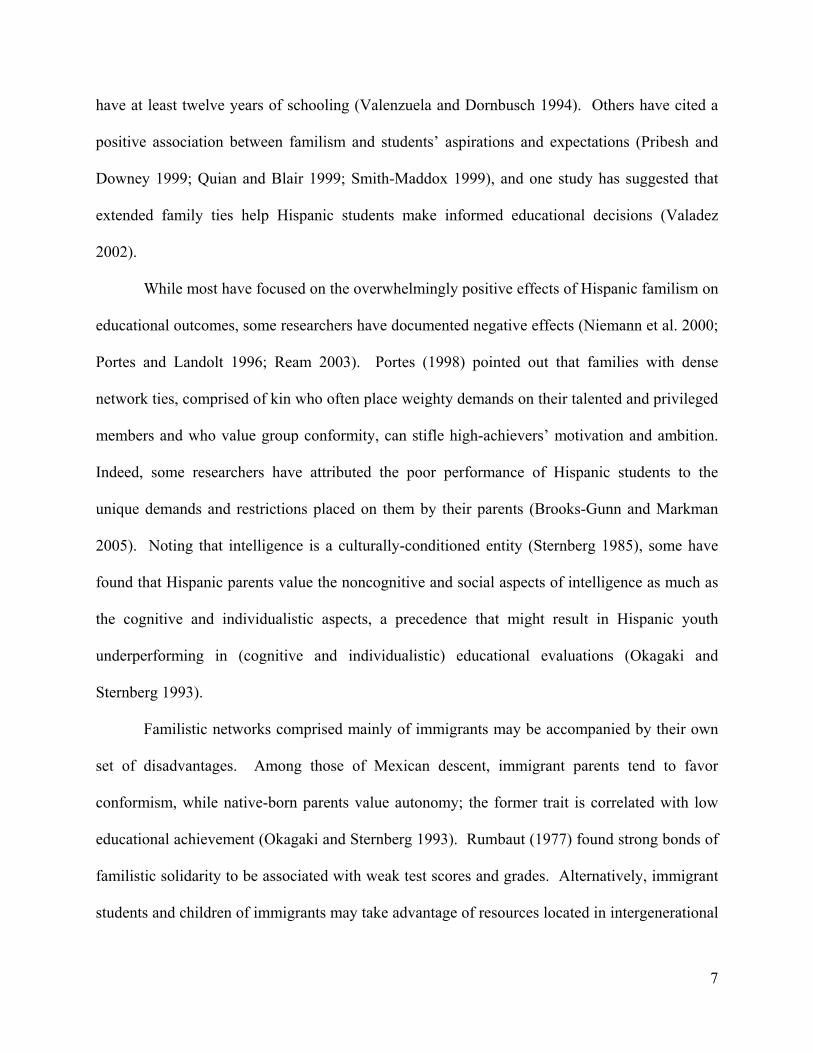
have at least twelve years of schooling (Valenzuela and Dornbusch 1994). Others have cited a

positive association between familism and students’ aspirations and expectations (Pribesh and

Downey 1999; Quian and Blair 1999; Smith-Maddox 1999), and one study has suggested that

extended family ties help Hispanic students make informed educational decisions (Valadez

2002).

While most have focused on the overwhelmingly positive effects of Hispanic familism on

educational outcomes, some researchers have documented negative effects (Niemann et al. 2000;

Portes and Landolt 1996; Ream 2003). Portes (1998) pointed out that families with dense

network ties, comprised of kin who often place weighty demands on their talented and privileged

members and who value group conformity, can stifle high-achievers’ motivation and ambition.

Indeed, some researchers have attributed the poor performance of Hispanic students to the

unique demands and restrictions placed on them by their parents (Brooks-Gunn and Markman

2005). Noting that intelligence is a culturally-conditioned entity (Sternberg 1985), some have

found that Hispanic parents value the noncognitive and social aspects of intelligence as much as

the cognitive and individualistic aspects, a precedence that might result in Hispanic youth

underperforming in (cognitive and individualistic) educational evaluations (Okagaki and

Sternberg 1993).

Familistic networks comprised mainly of immigrants may be accompanied by their own

set of disadvantages. Among those of Mexican descent, immigrant parents tend to favor

conformism, while native-born parents value autonomy; the former trait is correlated with low

educational achievement (Okagaki and Sternberg 1993). Rumbaut (1977) found strong bonds of

familistic solidarity to be associated with weak test scores and grades. Alternatively, immigrant

students and children of immigrants may take advantage of resources located in intergenerational

7

network relations more readily than their third-generation counterparts, who tend to be more

peer-oriented (Kao 1999; Zhou 1997). The peer networks in which Hispanic students are

embedded, some contend, discourage educational success. For example, 22% of Hispanic

students polled in a recent study claimed that “my friends make fun of people who try to do well

in school,” while only 13% of whites reported likewise (Ferguson 2002).

Currently, there is not enough evidence to conclude precisely how familism affects

Hispanic students’ performance and attainment; however, there is certainly enough evidence to

conclude that this topic deserves further investigation. Exploring college application patterns

provides an especially fruitful opportunity to understand how familism might serve or disserve

Hispanic students. During this critical juncture, students must decide if and where they will

apply to college, and, for most, going to college requires leaving home, severing oneself from

familistic support networks. A tension thus presents itself, as students are pulled in two

competing directions: One impulse encourages students to cultivate themselves, to leave home if

the best education requires it so, while another impulse encourages them to stay put, to uphold

familistic ties that have played such an important role in establishing their identity and, perhaps,

their academic success thus far. If one of the most important components of familism is the

subordination of the self to the family (Steidel and Contreras 2003), then students with durable

and deep family ties exploring the possibility of higher education might be reluctant to remove

themselves from such networks. For these students, assuming they have the ability, track record,

and drive to attend college, the question is not so much “Where should I apply?” but “Do I want

to leave home?”

Living at Home during College

Of course, there is a middle ground: Students may choose to live at home while attending

8

college. For many students and their parents, the ability to attend a college or university while

living at home is an important factor in selecting a post-secondary institution; in fact, 54% of

parents of high school seniors in 1992 felt that it was important for their children to live at home

during college, and 76% of those students agreed with their parents (Turley 2006). Even those

living in rural areas, where post-secondary institutions are scarce, want to stay close to home.

One survey found that nearly 75% of high school seniors living in rural Iowa communities

believed it was very important to live near their parents (Johnson et al. 2005). Indeed, the

chances a student will apply to a college increase as her household’s distance from that college

decreases (Weiler 1994). In addition, the likelihood of leaving home for college is higher for

those whose parents’ income is higher (Mulder and Clark 2002). Because living at home during

college offers students a way to remain embedded in family networks while defraying a

significant amount of college expenses (e.g., rent, food, start-up costs, out-of-state tuition), we

have strong reason to expect this option to be quite attractive for Hispanic students.

Living at home during college, however, may result in negative consequences regarding

students’ educational attainment. First, familistic obligations might narrow students’

postsecondary opportunities, resulting in many colleges and universities being tossed aside as

“discarded possibles,” to borrow an expression from Bourdieu (1998). Such self-imposed

restrictions, conditioned by familial relations, could force students to attend mediocre institutions

close to home rather than top-notch institutions further away — or, worse, they could discourage

students from applying to college at all (Portes 1998; Turley 2006; Wellman 1983). Indeed,

young adults who leave home to attend school obtain higher levels of educational attainment

than those who stay home (Bozick 2007; White and Lacy 1997). Second, while living away

from home during college cultivates students’ independence and establishes bonds of mutual

9

respect between parents and children (Flanagan et al. 1993), living at home during college often

whittles away students’ aspirations (Dubas and Petersen 1996). Finally, a surfeit of

responsibilities confronts students who live at home (e.g., caring for younger siblings, elderly

parents, grandparents, or other relatives), obligations that may distract them from their studies.

For all these reasons, investigating if, and to what degree, Hispanics find it important to

live at home during college, and the consequences of this decision on educational outcomes,

might help us better grasp their desperately low levels of college attendance. Our goals are

twofold: (1) to examine racial and ethnic differences in college application patterns (specifically,

if students applied to any college, a four-year college, and a selective college) and (2) to analyze

the extent to which, net of other factors, these differences can be explained by students’

preference to live at home during college. In doing so, we hope to concentrate on a dimension of

educational stratification rarely emphasized in the literature (college application patterns),

traverse the black-white binary that continues to saturate most work on educational stratification,

and highlight a unique mechanism, that of familism, that may help to explain why Hispanic

youth lag so far behind other racial and ethnic groups in virtually every measure of educational

success.

Data & Methods

This study draws on data from the Texas Higher Education Opportunity Project

(THEOP). The sample is comprised of 13,803 seniors who attended 96 Texas public high

schools in the spring of 2002, selected through stratified random sampling. All public high

schools in Texas were included in the sampling frame except charter schools, special education

schools, and schools with fewer than 10 seniors. Our study focuses on Hispanic seniors, who

make up 36% of the sample — a proportion almost as large as whites, who make up 42% of this

10

sample. All students were surveyed during their last semester in high school, a time when post-

graduation plans, for most, should have been solidified. Data were collected through self-

administered surveys, which, for the most part, were completed during class time (a small

number of surveys were mailed to students).

We focus on the preference to live at home during college and its influence on college

application patterns. Students were asked whether they had applied to college and to indicate the

colleges to which they had applied. Our main dependent variables are whether they had applied

to (1) at least one college of any type, (2) at least one four-year college, and (3) at least one

selective college. We defined students as having applied to a selective college if they had

applied to at least one school categorized as either more selective or most selective, according to

the U.S. News and World Report, which groups schools into five categories: least selective, less

selective, selective, more selective, and most selective. The U.S. News and World Report ranks

institutions based on 15 indicators, including peer assessment surveys, retention and graduation

rates, faculty resources, student academic performance before college, alumni gifts, and financial

resources. While many have criticized this ranking system, there is little doubt that it

significantly influences how students view prospective institutions (Chang and Osborn 2005).

Our measure of the importance of living at home during college is based on the question,

“In choosing a college or university to attend, how important to you are/were each of the

following? . . . Ability to attend school while living at home.” Approximately 59% of the

students responded that the ability to attend school while living at home was somewhat or very

important (these two categories, which yielded similar results in terms of college application,

were collapsed in order to obtain a more equal distribution). Students who indicated that they

did not aspire or expect to continue their education beyond high school (about 6% of the sample)

11

were not asked about college applications or their preference to live at home during college, and

about 50% of students who did not aspire or expect to continue their education were Hispanic.

(Although it may seem unusual that only 6% of the sample had no college plans, bear in mind

that our sample is comprised of second term high school seniors, staring down graduation. Many

students who did not intend to continue their education dropped out before this time and,

therefore, were excluded from our sample. A good number of students, however, aspired to

college but had not yet submitted an application.) Because this study is based only on students

who expect to continue their education, our findings may be somewhat conservative as students

not expecting to go to college systematically are excluded and a higher proportion of those

excluded are Hispanic (who are much more likely to state that living at home during college is

important). This means that it is quite likely that our analyses underestimate the Hispanic-white

gap in college application, as well as the effect of students’ desire to stay home for college.

Furthermore, colleges that do not require advanced application, which tend to be unselective,

may have been excluded if students had not applied by the second term of their senior year.

There are many factors that influence whether and where students apply, and we account

for several of them. High school academic achievement is clearly an important factor, which we

measure through class rank, grades, and curriculum track. Class rank is of special importance in

Texas because students in the top 10% of their class are guaranteed admission at any public

school in the state. Students who did not know their rank (about 39% of the sample) were asked

to provide their best estimate, yielding a response rate of 97%. For ease of interpretation, rank

was reverse-coded such that higher values represent a better rank. Grades were calculated as the

average grade in English, Math, Science, and History/Social Science during the most recent

grading period (1 = lower than C, 2 = C, 3 = B, 4 = A). Curriculum tracks were categorized as

12

general curriculum (reference category), college preparation, or distinguished achievement.

We also control for ascribed characteristics such as gender, race/ethnicity, and immigrant

status. Race/ethnicity was based on four categories: (1) non-Hispanic white (reference

category), (2) non-Hispanic black (3) Hispanic (Mexican/Mexican American and Other

Hispanic), and (4) other, which includes Asian and Native American students. Eighty-four

percent of the Hispanics in our sample identified as “Mexican/Mexican American,” although this

sizeable percentage is underestimated, as a non-negligible number of those who could be

categorized as “Mexican/Mexican American” instead listed a different ethnic label, such as

“Mexicano,” or “Mexican Azteca,” or they listed a specific city or state in Mexico. The

remaining 16% of Hispanics identified with several other Hispanic subgroups, rendering these

subgroups too small for separate analyses. Those who have analyzed intra-ethnic differentiation

within the Hispanic population have concluded that by and large Mexican Americans are the

most disadvantaged subgroup, scoring lower on standardized tests and other measures of

achievement (Crosnoe 2005; Portes and Rumbaut 2001), possessing lower educational

aspirations and expectations (Bohon et al. 2006), and completing college at lower rates than

other Hispanic subgroups (Chapa and Valencia 1993; Vernez and Mizell 2002). Although our

analyses group all Hispanics together, we emphasize that our results are most applicable to

students of Mexican descent.

If students were not born in the U.S., they were asked about the age at which they arrived

in the country. Those who arrived at age 12 or older were categorized as first-generation

immigrants, and those who arrived prior to age 12 were categorized as 1.5-generation

immigrants (cf. Rumbaut 2004), both of which were compared to native-born students (our

reference category). Unfortunately, we lack information on where students’ parents were born

13

and thus are unable to identify second-generation students. However, previous research suggests

that 1.5-generation and native-born, second-generation students are remarkably similar with

respect to educational indicators (Boyd 2002). That being the case, we expect the differences

between native-born respondents (including second-generation students) and 1.5-generation

immigrants to be appreciably smaller than those between native-born respondents and first-

generation immigrants.

We also take account of family structure and parents’ socioeconomic status (SES).

Family structure is comprised of three measures: (1) whether the students have two parents in

the household, including step-parents, foster parents, and guardians, (2) whether they have

siblings in the household, including step-siblings and half-siblings, and (3) whether they have

other relatives in the household, including grandparents, other children, and other adults.

Although SES typically is measured by education, income, and/or occupation, student-reported

data must collect SES data by alternative means. Because adolescents tend to report inaccurate

estimates of their parents’ income, respondents instead were asked to report their parents’

occupations. However, this (open-ended) question yielded equally unhelpful data, as 38% of

students left their father’s occupation blank, while a full 45% failed to report their mother’s

occupation. Of the students who did report their parents’ occupations, many listed uninformative

answers (e.g., “owner,” “self employed,” “none of your business”). Add to these complications

the fact that indexes of occupational socioeconomic status have been called scientifically

obsolete, especially for women, since many occupations do not correspond to the typical

relationships among prestige, education, and earnings (Hauser and Warren 1997). For these

reasons, we do not use occupation but parents’ education (whether parents completed a four-year

degree, based on the highest level completed by either parent or guardian), together with home

14

ownership, as a measure of SES. We enrich this measure by including school-level SES

variables: the percentage of students within each school receiving free or reduced-price lunch, as

well as the percentage of students who plan to go to college. We also include several measures

of school racial/ethnic composition, including the percentage of students enrolled in their schools

who are white, black, Asian American, and Hispanic. All of these school-level measures were

obtained from school administrative records and, as such, are based on all the students in the

schools, not just those in our sample.

We also account for the number of colleges in proximity to each student’s high school.

Using THEOP restricted data to obtain high school zip codes, and data from the Integrated

Postsecondary Education Data System (IPEDS) to obtain college zip codes, we employed a

customized software program to calculate the number of colleges (by type) within commuting

distance of each student’s high school. The estimate of a typical college commuting distance

was based on the median mileage between home and the first choice college of a national sample

of students who claimed that living at home during college was important (obtained from

NELS). Based on this estimate, a college was deemed proximate to a student’s home if it was

located within a 24-mile radius of those living in rural or suburban areas and within a 12-mile

radius of those living in urban areas. Although we were able to estimate the number of total

colleges and the number of four-year colleges in proximity, we were not able to estimate the

number of selective colleges in proximity because the college selectivity measure in our student

data (based on U.S. News and World Report) did not correspond with the college selectivity

measures in IPEDS data (which include admission rates and average SAT/ACT scores but not

US News and World Report rankings). As a result, for applying to a selective college, we use

the number of four-year colleges in proximity.

15

Some of the variables in our analyses contain a significant amount of missing data (see

Table 1). For example, two of the three dependent variables (applied to a four-year college and

applied to a selective college) have higher levels of missing data because they require more

information from the students. Each student was asked whether he/she had a 1st through 5th

college preference choice and, if so, to report each college’s name and state and to indicate

whether he/she had applied to each school. For the first dependent variable (applied to any

college), it was necessary only to know whether students had applied to any of their choices. But

the other two dependent variables required obtaining the schools’ names, which enabled us to

determine whether they were four-year or selective colleges. Because far fewer students filled in

the names of the colleges to which they had applied than indicated that they had applied to any

college, our second and third dependent variables have much more missing data than our first.

As a result, missing values were estimated using multiple imputation (executed by

NORM software, which is appropriate for both categorical and continuous variables). Multiple

imputation aims to preserve the characteristics of the dataset as a whole (including dependent

variables), rather than the attributes of specific variables, and is appropriate for addressing data

missing randomly and non-randomly (Schafer and Graham 2002). Five equally plausible

complete datasets were constructed through information obtained from the observed data (from a

total of 1,000 iterations), as accurate results typically can be obtained from five to ten

imputations (Schafer 1999). All statistical analyses were repeated on each of these datasets,

producing five sets of results, which were combined to produce one set of estimates and standard

errors that incorporate missing data uncertainty, using Rubin’s rule of combination (Rubin 1987).

[Table 1 about here.]

In what follows, we examine differences between whites, blacks, and Hispanics with

16

respect to college application. We begin by comparing the importance of living at home during

college by race/ethnicity and other factors. We then examine the association between the

preference to live at home and college application. Finally, using Hierarchical Linear Modeling

(HLM) software, we use multilevel models with student- and school-level variables to predict the

probability of applying to any college, a four-year college, and a selective college. The models

are summarized below.

Level 1:

∑=

• +−+=Q

qijjqqijqjjij rXXY

10 ββ

Level 2:

∑=

• +−+=qS

sqjssjqsqqj uWW

10 γγβ

Yij represents the log odds of applying to college for student i in school j; Xqij represents the

student-level predictors that are independent of rij; rij is the independent and normally distributed

student-level error term with mean of 0 and variance σ2 for every student i within each school j;

Wsj represents the school-level predictors; and uqj is the independent and normally distributed

school-level error term. For easier interpretation, most of the variables are centered around the

grand mean so that the reported intercept represents the predicted odds of applying to college for

the average student. Because we compare the odds of applying to college by race/ethnicity and

whether living at home during college is important, these variables and their interaction terms are

uncentered (also indicated in the tables).

Results

Compared to whites and blacks, Hispanic high school seniors are significantly less likely

to apply to any college (54% vs. 66% of whites and 70% of blacks), a four-year college (42% vs.

17

55% of whites and 56% of blacks), and a selective college (14% vs. 31% of whites and 19% of

blacks) (see Table 1). Chi-squared tests reveal that these differences are statistically significant

at p < 0.001.

Approximately 59% of high school seniors in this sample felt that living at home during

college was important, but this proportion varies significantly by race/ethnicity (see Table 1).

Hispanics are the most likely to state that living at home is important (74%), followed by blacks

(58%), then whites (46%), differences that are statistically significant. Furthermore, compared to

native-born students, those born outside the U.S. are significantly more likely to feel that living

at home is important (57% of native-born vs. 72% of 1.5-generation immigrants and 79% of

first-generation immigrants). In addition, students whose parents are less educated are

significantly more likely to feel that it is important to live at home during college (62% of

students whose parents do not have a college degree, compared to 47% of students of college-

educated parents). Finally, students whose parents rent their homes are significantly more likely

to feel it is important to live at home than students whose parents own their homes (68% vs.

56%), suggesting that lower socioeconomic status is associated with higher likelihood of

preferring to live at home during college.

The most significant differences in the preference to live at home during college were

found among students with different racial and ethnic identities and among those whose parents

had different education levels. Since Hispanics have the lowest educational attainment of all

U.S. racial and ethnic groups, the observed differences may be attributed in significant part to

parental educational differences instead of racial and ethnic differences per se. However, Figure

1 shows that, regardless of parents’ education level, Hispanics are more likely to indicate that

living at home during college is important. In fact, Hispanics whose parents are college

18

graduates are more likely to want to live at home than blacks or whites whose parents are not

college graduates. Parental educational differences alone cannot explain why Hispanics are

much more likely to report that it is important to live at home during college.

[Figure 1 about here.]

If this prevalent preference is disconcerting, it is because it is associated with a lower

likelihood of applying to college. We find that, relative to students who felt it was not important

to live at home during college, students who did feel this was important were significantly less

likely to apply to at least one college of any type (53% vs. 76%), at least one four-year college

(38% vs. 69%), and at least one selective college (12% vs. 42%). These findings imply that

there is a strong negative association between the preference to live at home and the likelihood of

applying to college.

Up to this point, we have not accounted for other influential factors that could explain the

likelihood of applying to college. We use multilevel models with student- and school-level

variables to predict the probability of applying to any college (Table 2), a four-year college

(Table 3), and a selective college (Table 4). For each outcome, we use four models to

demonstrate the impact of the preference to live at home on the Hispanic-white application gap.

Model 1 shows the effect of race/ethnicity without covariates; Model 2 adds student- and school-

level covariates, with the exception of the staying home variable; Model 3 adds the staying home

variable; and Model 4 adds terms for the interactions between staying home and parental

education, staying home and being Hispanic, parental education and being Hispanic, and a three-

way interaction between staying home, parental education, and being Hispanic. We report both

odds ratios and coefficients, as well as robust standard errors adjusted for clustering within high

schools.

19

Overall, Tables 2-4 suggest that, even after controlling for a variety of demographic,

academic, and socioeconomic factors, taking account of the preference to live at home during

college further reduces the Hispanic-white difference in the odds of applying to college. This is

especially true for applying to a selective college, where the Hispanic-white difference becomes

insignificant after controlling for preference to live at home. These tables also suggest that, for

Hispanics, the difference in odds of applying between those that desire to stay home and those

that do not is smaller than the difference for other groups. Despite this small buffering effect for

Hispanics, the preference to stay home for college is associated with significantly lower odds of

applying to college for all three groups, with Hispanics being much more likely to indicate that

staying home for college is important.

[Table 2 about here.]

Model 1 in Table 2 shows that, without controlling for any factors, Hispanic high school

students have about 44% lower odds of applying to any college than white students. Model 2

shows that even after controlling for academic achievement, gender, immigration status,

proximity to college, family structure, parents’ SES, and school-level factors, Hispanic students

still have significantly lower odds of applying to any college than white students (about 22%

lower). The same is not true for black students, who have much higher odds of applying to any

college than whites. But Model 3 shows that after controlling for the preference to stay home

during college, the application gap between whites and Hispanics is reduced further, such that

Hispanics have only 15% lower odds of applying than whites. Net of other factors, students who

indicate it is important to live at home during college have about 48% lower odds of applying to

any college than students who indicate it is not important. Finally, Model 4 includes interaction

terms and shows that there is a small buffering effect (β = 0.38) for Hispanics who want to stay

20

home. For them, the negative effects of being Hispanic (β = -0.42) and preferring to stay home

(β = -0.76) are not simply additive (-0.42 + -0.76 = -1.18) but rather are somewhat reduced,

though still negative (-0.42 + -0.76 + 0.38 = -0.80). Despite the small buffering effect for

Hispanics, it is important to bear in mind that a large majority of Hispanics – about three quarters

– believe it is important to live at home during college. Figure 2 shows the predicted odds of

applying to any college for white and Hispanic students, first without controlling for preference

to stay home (based on Model 2), then controlling for this preference (based on Model 3). This

figure illustrates that the Hispanic-white college application gap is slightly smaller when

preference to stay home is taken into account, especially among those for whom staying home is

important.

[Figure 2 about here.]

In Table 3, we examine four-year college applications and observe similar patterns.

Without controlling for any factors, Hispanic high school students have about 48% lower odds of

applying to a four-year college, compared to white students. Model 2 shows that even after

controlling for student- and school-level factors, Hispanics still have about 28% lower odds than

white students. However, Model 3 shows that after controlling for their preference to stay home

during college, the application gap between whites and Hispanics is reduced further, such that

Hispanics have only 17% lower odds of applying than whites. Net of other factors, students who

report it is important to live at home during college have about 59% lower odds of applying to a

four-year college than students who indicate this is not important. In Model 4, there is again a

small buffering effect (β = 0.41) for Hispanics who want to stay home, although the added

effects of being Hispanic (β = -0.44) and preferring to stay home for college (β = -1.02) remain

negative (-0.44 + -1.02 + 0.41 = -1.05). Figure 3 shows the predicted odds of applying to a four-

21

year college for white and Hispanic students, first without controlling for preference to stay

home (based on Model 2), then controlling for this preference (based on Model 3). This figure

illustrates that the Hispanic-white college application gap is again slightly smaller when

preference to stay home is taken into account, especially among those for whom staying home is

important.

[Table 3 & Figure 3 about here.]

In Table 4, we analyze selective college applications and, this time, find that the

Hispanic-white difference in the odds of applying not only is reduced but also becomes

insignificant after controlling for preference to live at home. Without controlling for any factors,

Hispanic high school students have about 48% lower odds of applying to a selective college than

white students and, even after controlling for student- and school-level factors, Hispanics have

roughly 22% lower odds of applying to a selective college. However, this difference is further

reduced and becomes insignificant after controlling for students’ preference to stay home during

college. Net of other factors, students who report it is important to live at home during college

have about 68% lower odds of applying to a selective college than students who indicate this is

not important. Model 4 includes interaction terms and shows that none of them are significant.

Figure 4 again shows the predicted odds of applying to a selective college for white and Hispanic

students, first without controlling for preference to stay home (based on Model 2), then

controlling for this preference (based on Model 3). This figure illustrates that the Hispanic-white

college application gap is significantly smaller and becomes insignificant when preference to

stay home is taken into account, both among those for whom staying home is important and

among those for whom staying home is not important.

[Table 4 and Figure 4 about here.]

22

There are other notable differences between applying to a selective college and applying

to any college or a four-year college. In terms of applying to a selective college, some student-

level factors seem to be less important while some school-level factors seem to be more

important. For example, while academic achievement (rank, track, and GPA) is important for all

three outcomes, parents’ education is important only for applying to any college and applying to

a four-year college — but not for applying to a selective college. Likewise, immigrant status is

important for applying to any college and a four-year college but not for applying to a selective

college. In contrast, while school-level racial/ethnic composition (in particular, percent Hispanic

and percent Asian American) is important for all three outcomes, school-level socioeconomic

status is important only for applying to a selective college. For instance, an increase in the

percentage of economically disadvantaged school peers is associated with a significant decrease

in the odds of applying to a selective college but does not seem to affect the odds of applying to

any college or a four-year college. Likewise, an increase in the number of colleges in proximity

to the high school is associated with a marginally significant increase in the odds of applying to a

selective college (p < 0.08) but not to any college or a four-year college. This suggests that

school-level and geographic factors are particularly important for applying to a selective college.

Moreover, some student-level factors have a very different effect on applying to a selective

college. For example, while female students have significantly higher odds of applying to any

college or a four-year college, they have significantly lower odds of applying to a selective

college. Similarly, compared to whites, black students have significantly higher odds of

applying to any college or a four year college but not a selective college. These findings suggest

that, for female and black students, there are important qualitative differences in the types of

colleges to which they apply. Despite these noteworthy differences, a clear pattern emerges

23

across all three college application outcomes, a pattern we now summarize and discuss.

Summary & Discussion

Unlike most studies, which tend to focus on the positive relationship between Hispanic

familism and educational outcomes, this study has documented one way in which family ties can

disadvantage students transitioning into adulthood. These analyses have shown that, among

Texas high school seniors, Hispanics are the most likely to feel that living at home during

college is important. The lower education of their parents does not account for this, as even

Hispanics with highly educated parents are more likely to indicate that staying home is

important, compared to whites whose parents are similarly educated. Moreover, net of student-

and school-level factors, including socioeconomic status and academic achievement, students for

whom the ability to live at home during college is important are far less likely to apply to college

than students who do not hold such a preference. The difference between the two groups grows

even more substantial when we examine applications to four-year and selective colleges.

Perhaps most significant, controlling for the preference to live at home renders the selective

college application gap between Hispanics and whites insignificant.

This study, therefore, has demonstrated that attitudinal familism is a powerful predictor

of Hispanic students’ college application rates. Although one’s preference to stay home during

college might be explained in part by socioeconomic factors (as this would defray a portion of

college costs), we have seen — to the extent that our data allow — that socioeconomic factors do

not entirely explain why living at home during college is so important to Hispanics. It follows,

then, that if we wish to understand the low levels of college application among Hispanics, we

must pay attention, not only to economic standing, school quality, and the struggles of

immigrants, as has been the convention, but also to familistic obligations.

24

Because this study focused on Hispanics, it sought out a sample with a large number and

proportion of Hispanics. With its significant proportion of Hispanics (36%, compared to only

12% in NELS), as well as its higher number of Hispanics (about 4,200, compared to only 2,100

in NELS), THEOP data was ideal for our purposes. THEOP data have enabled us to explore

questions of racial and ethnic variation even though, for generalizability purposes, national data

are more informative than regional data. Compared to other states, Texas may be peculiar with

respect to the analyses pursued here. There is, first, its size to consider. Many Hispanics in rural

Texas live a good distance away from many postsecondary institutions, but, nationally, most

Hispanics live in urban areas. Nevertheless, we believe that our key findings are not affected by

this difference, not only because we incorporate geographic distance into our models and find

that familism still matters, but also because our sample is overwhelmingly urban (approximately

90% of the students live in urban areas) and therefore resembles national population patterns. If

anything, our findings are conservative, as we would expect that students living in rural areas

who desired to remain at home during college would be less likely to apply to college than their

likeminded counterparts in urban areas.

Our findings might be biased toward the conservative on two other scores as well. First,

had we had the ability to analyze all high schools in Texas — not only public schools but also

private institutions, traditionally attended by a disproportionate number of white students from

wealthy families — we most likely would have observed even larger differentials with respect to

white and Hispanic college application rates. Second, Texas’s Top 10% law encourages students

to apply to college at higher rates than students living in states without this incentive (Tienda et

al. 2003). For this reason, we might reasonably expect that some high-achieving students from

low-income families that applied to college in Texas might not have done so had they resided in

25

a state where their admission was not guaranteed. This means that, on a national level, the

Hispanic-white application gap might be wider than these data suggest and that SES might have

a more powerful effect on application outcomes in states without admissions guarantees. We

encourage researchers with access to nationally representative statistics from which meaningful

racial and ethnic comparisons can be fashioned to carry out analyses that might challenge or

verify our findings.

We regret not possessing the ability to operationalize familism in deeper and more

complex ways by, for example, exploring the structure of family ties (e.g., their density and

relational configuration). Data limitations force us to leave unexplored several questions that

would elucidate the connection between familism and educational outcomes: Are educational

expectations negatively correlated with the density of family networks? How are some students

socialized (by familial, cultural, and social forces) to remain at home during college while others

are socialized to leave? We commit these important lines of inquiry to future research.

By way of conclusion, we would like to tender three complementary explanations, ones

that only can be championed or refuted by future research, as to why Hispanic students

overwhelmingly are less likely than other racial and ethnic groups to leave home to pursue a

college degree. The first has to do with the geographic location of post-secondary institutions.

Evidence suggests that Hispanics in Texas tend to live further away from colleges and

universities than other racial and ethnic groups. One study found that individuals living in

counties along the Texas-Mexico border, a predominantly Hispanic region, have to travel five

times as far as other Texans to reach a comprehensive university (Jones and Kauffman 1994).

Another concluded that students from predominantly minority high schools in Texas live the

furthest distance from the University of Texas and Texas A&M, the state’s flagship institutions

26

(Tienda and Niu 2006). Thus, for most Hispanic students living in Texas, leaving home for

college requires placing much more distance between themselves and their family than it does

for white students — a difference that might help explain why Hispanics are much more likely to

want to stay home for college. We have good reason to believe that the college application rates

of Hispanic students would increase at a significant pace if more Hispanic students were able to

stay home while attending college. If this is the case, then effective policy initiatives aimed at

improving the state of Hispanic education would attempt to bring postsecondary educational

offerings to communities a far throw from college campuses. This could be accomplished, for

example, by establishing satellite campuses in rural areas or through internet-based or video-

transmitted instruction.

That said, our findings demonstrate that one’s proximity to colleges does not fully

account for disparities in application rates. This brings us to our second explanation, one having

to do with America’s racial climate, in general, and the racial climate on college campuses, in

particular. America’s preoccupation with illegal immigration and the growing Hispanic

population has nourished anti-immigrant and anti-Hispanic sentiment. A recent study found that

whites’ attitudes toward nonwhites and immigrants grow more negative as their perceptions of

the size of these groups increases (Alba et al. 2005). Enveloped in a society conditioned by

racial domination, many college campuses, especially those with a majority white student body,

can be hostile environments for nonwhite students. Eleven percent of reported hate crimes occur

in schools and on college campuses (Federal Bureau of Investigation 2004), and several studies

have documented the workings of racism in the halls of the university (Gordon and Johnson

2003). Many nonwhites applying to college are aware of these hostile incidents, and some are

advised to steer clear of such institutions. This was the case for Onaje Barnes, who was a junior

27

at the University of Texas when he confessed to a reporter: “[My family and friends] warned me

because, quite frankly, the environment of UT is known for racism. . . . A lot of older people told

me not to come here, but I felt that I could deal with any issues that arise” (Shah 2002).

A good many nonwhite students may not be as confident as this young man. Perhaps

Hispanic students wish to stay home for college because they recognize the importance of having

a supportive network of family and friends to protect and sustain them from the racism they will

face at the university. And perhaps Hispanic parents discourage their children from attending

far-off colleges, not because they (consciously or unconsciously) work to reproduce their own

social positions, but because they know well of the scars American racism can inflict on the

mind and body of a young person. If this is the case, then efforts to reduce the Hispanic-white

application gap must interrogate the racial climate of college campuses and develop solutions to

combat institutional racism embedded within the structures of the university as well as everyday

prejudice thriving within the student body. Such solutions may include implementing programs

designed to recruit and retain students from underrepresented minority groups, hiring faculty of

color, establishing mandatory “ethnic studies” courses, providing student-organized anti-racist

organizations with adequate institutional support, and founding well financed and staffed

university offices that work toward sustaining a multicultural learning environment.

One wonders, however, why Hispanic students’ college application rates are so much

lower than those of black students, even though the latter group is affected by the racial climate

on college campuses just as much as the former. This observation prompts our final explanation,

one underscoring the unique importance Hispanic families place on familism. Our findings have

demonstrated that familism (as measured by one’s desire to stay home for college) plays an

important role in predicting inequalities in college application patterns; that familism is more

28

salient to Hispanic students; and that the familism effect is not merely a reflection of educational

or economic inequalities (though we do not deny the predictive power of these factors). For

these reasons, we believe a robust explanation of the Hispanic-white application gap must add to

the two institutional factors reviewed above (geographic distance and racial climate) a cultural

component that explores how one’s loyalty to the family is emphasized, reinforced, and

challenged in unique ways within Hispanic networks (cf. Okagaki and Frensch 1998; Oyserman

et al. 2002).

We hasten to add, however, that familism should not be thought of monochromatically,

as a social configuration that exerts positive effects on some outcomes and negative effects on

others. Familism at once may help bring about a whole array of positive outcomes (e.g., family

stability, reduced crime rates, community involvement) as well as an equally impressive array of

negative consequences (e.g., reduced educational attainment, a pressure toward conformity, the

creation of isolated communities). Likewise, familism can exert simultaneously mixed effects on

similar outcomes: a stable family life can encourage academic success even as it attenuates

students’ horizon of post-secondary possibilities. Finally, its goes without saying that familism

within one community may look nothing like familism in another and, therefore, may exhibit

very different effects. For example, relative to Mexican Americans, South Asians have high

levels of educational attainment, even though studies have shown that familism is equally

important to both groups (cf. Caplan et al. 1991). We believe that research on familism would

benefit greatly by examining variations in familistic attitudes and practices across racial and

ethnic lines, the unanticipated consequences of familism (that is, its divergent effects on different

outcomes), and how familism might serve as a vehicle through which certain opportunities are

transferred or denied.

29

The educational inequality between Hispanics and other groups is likely to become

increasingly important in the years to come, if for no other reason than because Hispanics are the

fastest growing minority group in America. Currently constituting about 12% of the total U.S.

population, the Hispanic population grew by about 57% between 1990 and 2000, whereas the

total U.S. population grew by only 13% during that time period (Chapa and De La Rosa 2004).

If current levels of educational disadvantage are unabated as the Hispanic population expands,

then an increasing fraction of the U.S. population will be insufficiently prepared for work and

civic life. The problem is not one for the Hispanic community alone but for the U.S. as a whole.

30

Works Cited

Alba, Richard, Rubén Rumbaut, and Karen Marotz. 2005. “A Distorted Nation: Perceptions of

Racial/Ethnic Group Size and Attitudes toward Immigrants and Other Minorities.” Social

Forces 84: 901-19.

Arum, Richard. 2000. “Schools and Communities: Ecological and Institutional Dimensions.”

Annual Review of Sociology 26: 395-418.

Astin, Alexander. 1982. Minorities in American Higher Education. San Francisco: Jossey-Bass.

Bohon, Stephanie, Monica Kirkpatrick Johnson, and Bridget Gorman. 2006. “College

Aspirations and Expectations among Latino Adolescents in the United States.” Social

Problems 53: 207-25.

Bourdieu, Pierre. 1998. Practical Reason: On the Theory of Action. Stanford, CA: Stanford

University.

Boyd, Monica. 2002. “Educational Attainments of Immigrant Offspring: Success or Segmented

Assimilation?” International Migration Review 36: 103-60.

Bozick, Robert. 2007. “Making It through the First Year of College: The Role of Students’

Economic Resources, Employment, and Living Arrangements.” Sociology of Education

80: 261-84.

Bradley, Robert and Robert Corwyn. 2002. “Socioeconomic Status and Child Development.”

Annual Review of Psychology 53: 341-69.

Brooks-Gunn, Jeanne and Greg Duncan. 1997. “The Effects of Poverty on Children.” The Future

of Children 7: 57-71.

Brooks-Gunn, Jeanne and Lisa Markman. 2005. “The Contribution of Parenting to Ethnic and

Racial Gaps in School Readiness.” The Future of Children 15: 139-68.

31

Caplan, Nathan, Marcella Choy, and John Whitmore. 1991. Children of the Boat People: A

Study of Educational Success. Ann Arbor, MI: University of Michigan Press.

Chang, Gordon and J. R. Osborn. 2005. “Spectacular Colleges and Spectacular Rankings: The

US News Rankings of American Best Colleges.” Journal of Consumer Culture 5: 338-64.

Chapa, Jorge and Richard Valencia. 1993. “Latino Population-Growth, Demographic

Characteristics, and Educational Stagnation: An Examination of Recent Trends.”

Hispanic Journal of Behavioral Sciences 15: 165-87.

Chapa, Jorge and Belinda De La Rosa. 2004. “Latino Population Growth, Socioeconomic and

Demographic Characteristics, and Implications for Educational Attainment.” Education

and Urban Society 36: 130-49.

Coleman, James 1988. “Social Capital in the Creation of Human-Capital.” American Journal of

Sociology 94: 95-120.

Crosnoe, Robert. 2005. “The Diverse Experiences of Hispanic Students in the American

Educational System.” Sociological Forum 20: 561-88.

Driscoll, Anne. 1999. “Risk of High School Dropout among Immigrant and Native Hispanic

Youth.” International Migration Review 33: 857-76.

Dubas, Judith Semon and Anne Petersen. 1996. “Geographical Distance from Parents and

Adjustment during Adolescence and Young Adulthood.” New Directions for Child

Development 71: 3-19.

Federal Bureau of Investigation. 2004. Hate Crime Statistics, 1995-2004. Washington, DC:

Department of Justice.

Ferguson, Ronald. 2002. “What Doesn't Meet the Eye: Understanding and Addressing Racial

Achievement Gaps in High Achieving Suburban School Systems.” Working paper.

32

North Central Regional Educational Laboratory Working Paper (ED 474 390).

Flanagan, Constance, John Schulenberg, and Andrew Fuligni. 1993. “Residential Setting and

Parent Adolescent Relationships during the College Years.” Journal of Youth and

Adolescence 22: 171-89.

Fuligni, Andrew, Vivian Tseng, and May Lam. 1999. “Attitudes toward Family Obligations

among American Adolescents with Asian, Latin American, and European Backgrounds.”

Child Development 70: 1030-44.

Goldsmith, Pat. 2004. “Schools’ Racial Mix, Students’ Optimism, and the Black-White and

Latino-White Achievement Gaps.” Sociology of Education 77: 121-47.

Gordon, Jill and Markus Johnson. 2003. “Race, Speech, and a Hostile Educational

Environment.” Journal of Social Philosophy 34: 414-36.

Haney, Walt. 2000. “The Myth of the Texas Miracle in Education.” Educational Policy Analysis

Archives 8(41), available at: http://epaa.asu.edu/epaa/v8n41.

Harrison, Algea, Melvin Wilson, Charles Pine, Samuel Chan, and Raymond Buriel. 1990.

“Family Ecologies of Ethnic Minority Children.” Child Development 61: 347-62.

Hauser, Robert and John Robert Warren. 1997. “Socioeconomic Indexes for Occupations: A

Review, Update, and Critique.” Pp. 177-298 in Sociological Methodology, edited by

Adrian Raftery. Cambridge: Basil Blackwell.

Hirschman, Charles. 2001. “The Educational Enrollment of Immigrant Youth: A Test of the

Segmented-Assimilation Hypothesis.” Demography 38: 317-36.

Hurtado, Sylvia, Karen Kurotsuchi Inkelas, Charles Briggs, and Byung-Shik Rhee. 1997.

“Differences in College Access and Choice among Racial/Ethnic Groups: Identifying

Continuing Barriers.” Research in Higher Education 38: 43-75.

33

Johnson, Monica Kirkpatrick, Glen Elder, and Michael Stern. 2005. “Attachments to Family and

Community and the Young Adult Transition of Rural Youth.” Journal of Research on

Adolescence 15: 99-125.

Jones, Richard and Albert Kauffman. 1994. “Accessibility to Comprehensive Higher-Education

in Texas.” Social Science Journal 31: 263-83.

Kao, Grace. 1999. “Psychological Well-being and Educational Achievement among Immigrant

Youth.” Pp. 410-77 in Children of Immigrants: Health, Adjustment, and Public

Assistance, edited by Donald Hernandez. Washington, DC: National Academy Press.

Kao, Grace and Jennifer Thompson. 2003. “Racial and Ethnic Stratification in Educational

Achievement and Attainment.” Annual Review of Sociology 29: 417-42.

Kao, Grace and Marta Tienda. 1995. “Optimism and Achievement: The Educational

Performance of Immigrant Youth.” Social Science Quarterly 76: 1-19.

Karen, David. 2002. “Changes in Access to Higher Education in the United States: 1980-1992.”

Sociology of Education 75: 191-210.

Kerckhoff, Alan and Richard Campbell. 1977. “Race and Social Status Differences in the

Explanation of Educational Ambition.” Social Forces 55: 701-14.

Mulder, Clara and William Clark. 2002. “Leaving Home for College and Gaining

Independence.” Environment and Planning A 34: 981-99.

National Center for Education Statistics. 2003. Status and Trends in the Education of Hispanics.

Washington, DC: United States Department of Education.

Niemann, Yolanda Flores, Andrea Romero, and Consuelo Arbona. 2000. “Effects of Cultural

Orientation on the Perception of Conflict between Relationship and Educational Goals

for Mexican American College Students.” Hispanic Journal of Behavioral Sciences 22:

34

46-63.

Okagaki, Lynn and Peter Frensch. 1998. “Parenting and Children’s School Achievement: A

Multiethnic Perspective.” American Educational Research Journal 35: 125-44.

Okagaki, Lynn and Robert Sternberg. 1993. “Parental Beliefs and Children’s School

Performance.” Child Development 64: 36-56.

Orfield, Gary and John Yun. 1999. “Resegregation in American Schools.” Working paper. The

Civil Rights Project, Harvard University.

Oyserman, Daphna, Heather Coon, and Markus Kemmelmeier. 2002. “Rethinking Individualism

and Collectivism: Evaluation of Theoretical Assumptions and Meta-Analyses.”

Psychological Bulletin 128: 3-72.

Peng, Samuel. 1988. Attainment Status of Asian Americans in Higher Education. Washington,

DC: U.S. Department of Education, Center for Education Statistics.

Portes, Alejandro. 1998. “Social Capital: Its Origins and Applications in Modern Sociology.”

Annual Review of Sociology 24: 1-24.

Portes, Alejandro and Patricia Landolt. 1996. “The Downside of Social Capital.” The American

Prospect 26: 18-21.

Portes, Alejandro and Rubén Rumbaut. 1996. Immigrant America: A Portrait. Berkeley, CA:

University of California Press.

—. 2001. Legacies: The Story of the Immigrant Second Generation. Berkeley, CA: University of

California Press.

Pribesh, Shana and Douglas Downey. 1999. “Why are Residential and School Moves Associated

with Poor School Performance?” Demography 36: 521-34.

Quian, Zhenchao and Sampson Lee Blair. 1999. “Racial/Ethnic Differences in Educational

35

Aspirations of High School Seniors.” Sociological Perspectives 42: 605-25.

Ream, Robert. 2003. “Counterfeit Social Capital and Mexican American Underachievement.”

Educational Evaluation and Policy Analysis 25: 237-62.

—. 2005. “Toward Understanding how Social Capital Mediates the Impact of Mobility on

Mexican American Achievement.” Social Forces 84: 210-24.

Rodriguez, Michael and Diana Morrobel. 2004. “A Review of Latino Youth Development

Research and a Call for an Asset Orientation.” Hispanic Journal of Behavioral Sciences

26: 107-27.

Rubin, D. 1987. Multiple Imputation for Nonresponse in Surveys. New York: John Wiley &

Sons.

Rumbaut, Rubén. 1977. “Ties that Bind: Immigration and Immigrant Families in the United

States.” Pp. 3-45 in Immigrants and the Family: Research and Policy on U.S.

Immigrants, edited by Alan Booth, Ann Crouter, and Nancy Landale. Mahwah: Erlbaum.

—. 1996. “The New Californians: Assessing the Educational Progress of Children of

Immigrants.” California Policy Seminar 8: 1-11.

—. 2004. “Ages, Life Stages, and Generational Cohorts: Decomposing the Immigrant First and

Second Generations in the United States.” International Migration Review 38: 1160-205.

Sabogal, Fabio, Gerardo Marin, Regina Otero-Sabogal, Barbara Banoss Marin, and Eliseo Perez-

Stable. 1987. “Hispanic Familism and Acculturation: What Changes and What Doesn’t?”

Hispanic Journal of Behavioral Sciences 9: 397-412.

Sarkisian, Natalia, Mariana Gerena, and Naomi Gerstel. 2006. “Extended Family Ties among

Mexicans, Puerto Ricans, and Whites: Superintegration or Disintegration?” Family

Relations 55: 331-44.

36

Schafer, Joseph. 1999. “NORM: Multiple Imputation of Incomplete Multivariate Data Under a

Normal Model,” available at www.stat.psu.edu/~jls/misoftwa.html.

Schafer, Joseph and John Graham. 2002. “Missing Data: Our View of the State of the Art.”

Psychological Methods 7: 147-77.

Shah, Aarti. 2002. “Racial Issues Influence UT Community,” The Daily Texan, February 7.

Smith-Maddox, Renee. 1999. “The Social Networks and Resources of African American Eighth

Graders: Evidence from the National Education Longitudinal Study of 1988.”

Adolescence 34: 169-83.

Stanton-Salazar, Ricardo and Sanford Dornbusch. 1995. “Social Capital and the Reproduction of

Inequality: Information Networks among Mexican-Origin High-School-Students.”

Sociology of Education 68: 116-35.

Steidel, Angel and Josefina Contreras. 2003. “A New Familism Scale for Use with Latino

Populations.” Hispanic Journal of Behavioral Sciences 25: 312-30.

Sternberg, Robert. 1985. Beyond IQ: A Triarchic Theory of Human Intelligence. New York:

Cambridge University Press.

Suarez-Orozco, Carola and Marcelo Suarez-Orozco. 1995. Transformations: Immigration,

Family Life, and Achievement Motivation among Latino Adolescents. Stanford, CA:

Stanford University Press.

Tienda, Marta and Faith Mitchell. 2006. Hispanics and the Future of America. Washington, DC:

National Academy Press.

Tienda, Marta and Sunny Niu. 2006. “Flagships, Feeders, and the Texas Top 10% Law: A Test

of the ‘Brain Drain’ Hypothesis.” Journal of Higher Education 77: 712-39.

Tienda, Marta, Kalena Cortes, and Sunny Niu. 2003. “College Attendance and the Texas Top 10

37

Percent Law: Permanent Contagion or Transitory Promise?” Paper presented at

Conference on Expanding Opportunity in Higher Education, Harvard Civil Rights

Project. Sacramento, California: October 23-25.

Turley, Ruth López. 2006. “When Parents Want Children to Stay Home for College.” Research

in Higher Education 47: 823-46.

U. S. Census Bureau. 2002. Statistical Abstract of the United States. Washington, DC: U.S.

Government Printing Office.

Valadez, James. 2002. “The Influence of Social Capital on Mathematics Course Selection by

Latino High School Students.” Hispanic Journal of Behavioral Sciences 24: 319-39.

Valdes, Guadalupe. 2001. Learning and Not Learning English. New York: Teachers College

Press.

Valencia, Richard. 2000. “Inequalities and the Schooling of Minority Students in Texas:

Historical and Contemporary Conditions.” Hispanic Journal of Behavioral Sciences 22:

445-59.

Valenzuela, Angela and Sanford Dornbusch. 1994. “Familism and Social Capital in the

Academic Achievement of Mexican Origin and Anglo Adolescents.” Social Science

Quarterly 75: 18-36.

Vernez, George and Allan Abrahamse. 1996. How Immigrants Fare in U.S. Education.

Washington, DC: RAND Corporation.

Vernez, George and Lee Mizell. 2002. Goal: To Double the Rate of Hispanics Earning a

Bachelor’s Degree. Washington, DC: RAND Corporation, Center for Research on

Immigration Policy.

Weiler, William. 1994. “Transition from Consideration of a College to the Decision to Apply.”

38

39

Research in Higher Education 35: 631-46.

Wellman, Barry. 1983. “Network Analysis: Some Basic Principles.” Pp. 155-200 in

Sociological Theory, edited by Randall Collins. San Francisco, CA: Jossey-Bass.

White, Lynn and Naomi Lacy. 1997. “The Effects of Age at Home Leaving and Pathways from

Home on Educational Attainment.” Journal of Marriage and the Family 59: 982-95.

White, Michael and Jennifer Glick. 2000. “Generation Status, Social Capital, and the Routes Out

of High School.” Sociological Forum 15: 671-91.

White, Michael and Gayle Kaufman. 1997. “Language Use, Social Capital and Schooling

Completion among Immigrants and Native-Born Ethnic Groups.” Social Science

Quarterly 78: 385-98.

Williams, Belinda. 2003. “What Else Do We Need to Know and Do?” Pp. 13-24 in Closing the

Achievement Gap, edited by Belinda Williams. Alexandria, VA: Association for

Supervision and Curriculum Development.

Wojtkiewicz, Roger and Katharine Donato. 1995. “Hispanic Educational Attainment: The

Effects of Family Background and Nativity.” Social Forces 74: 559-74.

Zambrana, Ruth (ed.). 1995. Understanding Latino Families: Scholarship, Policy, and Practice.

Thousand Oaks, CA: Sage.

Zhou, Min. 1997. “Growing Up American: The Challenge Confronting Immigrant Children and

Children of Immigrants.” Annual Review of Sociology 23: 63-95.

Zhou, Min and Carl Bankston. 1998. Growing Up American: How Vietnamese Children Adapt

to Life in the United States. New York: Russell Sage Foundation.

40

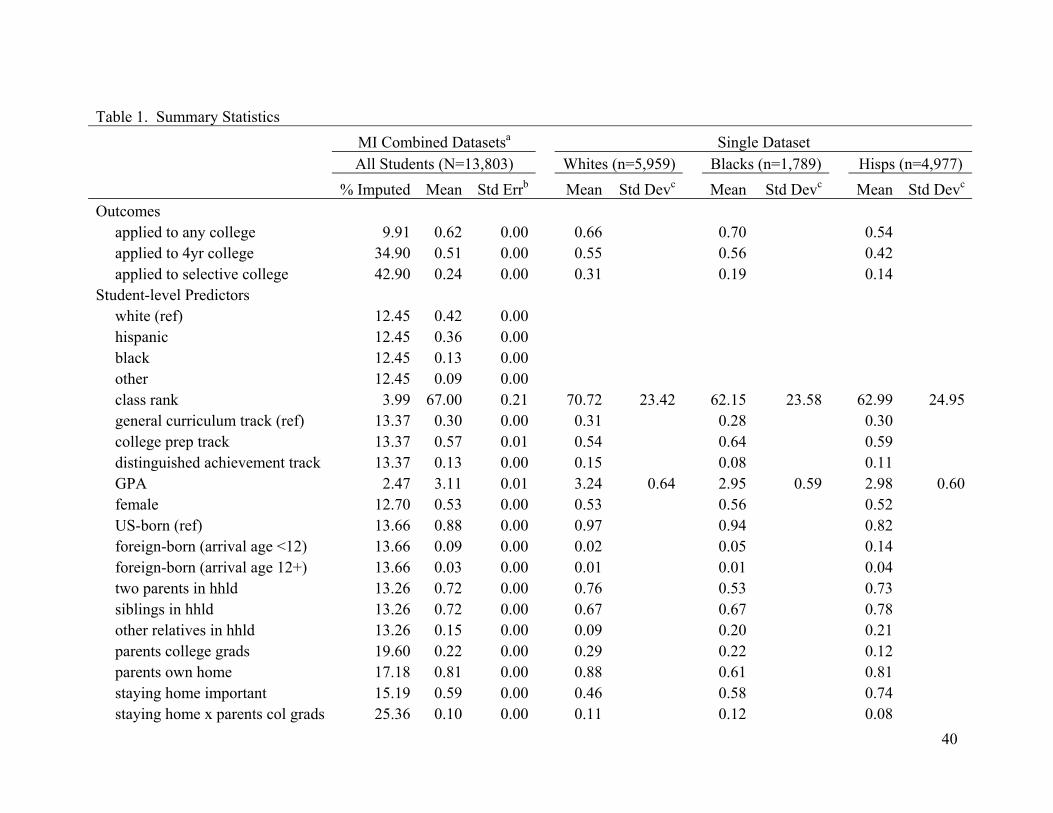
Table 1. Summary Statistics MI Combined Datasetsa Single Dataset All Students (N=13,803) Whites (n=5,959) Blacks (n=1,789) Hisps (n=4,977) % Imputed Mean Std Errb Mean Std Devc Mean Std Devc Mean Std Devc

Outcomes applied to any college 9.91 0.62 0.00 0.66 0.70 0.54 applied to 4yr college 34.90 0.51 0.00 0.55 0.56 0.42 applied to selective college 42.90 0.24 0.00 0.31 0.19 0.14 Student-level Predictors white (ref) 12.45 0.42 0.00 hispanic 12.45 0.36 0.00 black 12.45 0.13 0.00 other 12.45 0.09 0.00 class rank 3.99 67.00 0.21 70.72 23.42 62.15 23.58 62.99 24.95 general curriculum track (ref) 13.37 0.30 0.00 0.31 0.28 0.30 college prep track 13.37 0.57 0.01 0.54 0.64 0.59 distinguished achievement track 13.37 0.13 0.00 0.15 0.08 0.11 GPA 2.47 3.11 0.01 3.24 0.64 2.95 0.59 2.98 0.60 female 12.70 0.53 0.00 0.53 0.56 0.52 US-born (ref) 13.66 0.88 0.00 0.97 0.94 0.82 foreign-born (arrival age <12) 13.66 0.09 0.00 0.02 0.05 0.14 foreign-born (arrival age 12+) 13.66 0.03 0.00 0.01 0.01 0.04 two parents in hhld 13.26 0.72 0.00 0.76 0.53 0.73 siblings in hhld 13.26 0.72 0.00 0.67 0.67 0.78 other relatives in hhld 13.26 0.15 0.00 0.09 0.20 0.21 parents college grads 19.60 0.22 0.00 0.29 0.22 0.12 parents own home 17.18 0.81 0.00 0.88 0.61 0.81 staying home important 15.19 0.59 0.00 0.46 0.58 0.74 staying home x parents col grads 25.36 0.10 0.00 0.11 0.12 0.08

staying home x hispanic 19.11 0.27 0.00 0.00 0.00 0.74 hispanic x parents col grads 21.07 0.04 0.00 0.00 0.00 0.12 staying home x hisp x col grads 26.31 0.03 0.00 0.00 0.00 0.08 School-level Predictors % economically disadvantaged 0.00 34.29 n/a 21.41 15.65 36.71 19.76 51.34 23.66 % planning to go to college 0.00 75.31 n/a 76.96 19.96 76.32 19.84 72.35 20.66 % white enrollment 0.00 42.87 n/a 62.84 21.06 32.11 27.78 22.11 24.97 % black enrollment 0.00 13.87 n/a 11.80 10.55 31.18 23.83 9.47 14.11 % asian am enrollment 0.00 3.84 n/a 3.82 5.21 4.82 6.58 2.30 4.75 % hispanic enrollment 0.00 38.20 n/a 19.78 18.51 30.55 24.73 65.53 32.06 total colleges in proximity 0.42 9.50 0.03 6.64 6.78 15.51 11.29 10.20 11.29 4yr colleges in proximity 0.42 2.92 0.01 2.05 2.61 5.01 3.91 2.93 3.75 Source: Texas Higher Education Opportunity Project (THEOP) Senior Cohort Wave 1 (2002) aMissing values were imputed using multiple imputation; five datasets were combined using Rubin's rule of combination. bStandard errors are not applicable for variables with no missing data. cStandard deviations reported for continuous variables only.

41

42

Table 2. Multilevel Models Predicting Whether Students Applied to Any College Model 1 Model 2 Model 3 Model 4 OR Coef RSE OR Coef RSE OR Coef RSE OR Coef RSE Student-level Predictors (N=13,803) white ref ref ref ref hispanicuc 0.56 -0.58 0.08 *** 0.78 -0.25 0.07 *** 0.85 -0.16 0.07 * 0.66 -0.42 0.10 *** blackuc 1.45 0.37 0.09 *** 2.32 0.84 0.09 *** 2.35 0.85 0.09 *** 2.38 0.87 0.09 *** otheruc 1.04 0.04 0.08 1.10 0.09 0.09 1.17 0.15 0.09 1.19 0.18 0.09 * class rank 1.02 0.02 0.00 *** 1.02 0.02 0.00 *** 1.02 0.02 0.00 *** general curriculum track ref ref ref college prep track 1.77 0.57 0.05 *** 1.76 0.56 0.05 *** 1.75 0.56 0.06 *** distinguished achievement track 2.63 0.97 0.09 *** 2.43 0.89 0.09 *** 2.43 0.89 0.09 *** GPA 1.55 0.44 0.04 *** 1.55 0.44 0.04 *** 1.55 0.44 0.04 *** female 1.21 0.19 0.04 *** 1.23 0.21 0.04 *** 1.23 0.20 0.04 *** US-born ref ref ref foreign-born (arrival age <12) 0.79 -0.24 0.07 *** 0.82 -0.20 0.07 ** 0.81 -0.21 0.07 ** foreign-born (arrival age 12+) 0.74 -0.30 0.12 * 0.80 -0.22 0.12 0.79 -0.23 0.12 two parents in hhld 1.07 0.06 0.06 1.07 0.07 0.06 1.07 0.06 0.06 siblings in hhld 1.00 0.00 0.05 1.02 0.01 0.05 1.01 0.01 0.05 other relatives in hhld 0.88 -0.13 0.06 0.89 -0.11 0.07 0.89 -0.11 0.07 parents college gradsuc 1.21 0.19 0.05 *** 1.18 0.17 0.05 *** 1.27 0.24 0.10 * parents own home 1.23 0.21 0.08 * 1.21 0.19 0.08 * 1.21 0.19 0.08 * staying home importantuc 0.52 -0.66 0.07 *** 0.47 -0.76 0.08 *** staying home x parents col gradsuc 0.87 -0.14 0.13 staying home x hispanicuc 1.46 0.38 0.11 *** hispanic x parents col gradsuc 0.89 -0.12 0.22 staying home x hisp x col gradsuc 1.27 0.24 0.28

School-level Predictors (N=96) % economically disadvantaged 1.00 0.00 0.01 1.00 0.00 0.01 1.00 0.00 0.01 % planning to go to college 1.00 0.00 0.00 1.00 0.00 0.00 1.00 0.00 0.00 % white enrollment 1.00 0.00 0.00 1.00 0.00 0.00 1.00 0.00 0.00 % black enrollment 1.00 0.00 0.01 1.00 0.00 0.01 1.00 0.00 0.01 % asian am enrollment 1.06 0.06 0.02 * 1.06 0.06 0.02 * 1.06 0.05 0.02 * % hispanic enrollment 1.01 0.01 0.00 ** 1.01 0.01 0.00 ** 1.01 0.01 0.00 ** total colleges in proximity 0.98 -0.02 0.01 0.98 -0.02 0.01 0.98 -0.02 0.01 Intercept 1.89 0.63 0.07 *** 1.56 0.45 0.07 *** 2.30 0.83 0.08 *** 2.44 0.89 0.08 *** Source: Texas Higher Education Opportunity Project (THEOP) Senior Cohort Wave 1 (2002) ucUncentered variable; all other variables are grand-mean centered. * p < 0.05 ** p < 0.01 *** p < 0.001

43

44

Table 3. Multilevel Models Predicting Whether Students Applied to a Four-year College Model 1 Model 2 Model 3 Model 4 OR Coef RSE OR Coef RSE OR Coef RSE OR Coef RSE Student-level Predictors (N=13,803) white ref ref ref ref hispanicuc 0.52 -0.66 0.09 *** 0.72 -0.32 0.09 *** 0.83 -0.18 0.09 * 0.64 -0.44 0.11 *** blackuc 1.26 0.23 0.12 * 2.15 0.77 0.11 *** 2.20 0.79 0.11 *** 2.24 0.80 0.10 *** otheruc 1.05 0.05 0.10 1.09 0.08 0.11 1.20 0.18 0.12 1.23 0.21 0.13 class rank 1.03 0.03 0.00 *** 1.03 0.03 0.00 *** 1.03 0.03 0.00 *** general curriculum track ref ref ref college prep track 1.83 0.60 0.06 *** 1.81 0.59 0.06 *** 1.81 0.59 0.06 *** distinguished achievement track 2.87 1.06 0.08 *** 2.62 0.96 0.09 *** 2.63 0.97 0.09 *** GPA 1.46 0.38 0.05 *** 1.46 0.38 0.05 *** 1.46 0.38 0.05 *** female 1.10 0.09 0.05 * 1.12 0.11 0.05 * 1.12 0.11 0.05 * US-born ref ref ref foreign-born (arrival age <12) 0.78 -0.25 0.08 ** 0.82 -0.20 0.08 * 0.81 -0.21 0.08 * foreign-born (arrival age 12+) 0.70 -0.35 0.12 ** 0.79 -0.24 0.13 0.78 -0.25 0.13 * two parents in hhld 1.11 0.10 0.07 1.11 0.11 0.07 1.11 0.10 0.07 siblings in hhld 1.01 0.01 0.06 1.03 0.03 0.06 1.03 0.03 0.06 other relatives in hhld 0.93 -0.07 0.07 0.95 -0.05 0.07 0.95 -0.05 0.07 parents college gradsuc 1.24 0.21 0.05 *** 1.20 0.18 0.05 *** 1.28 0.25 0.11 * parents own home 1.16 0.15 0.09 1.13 0.12 0.09 1.13 0.12 0.09 staying home importantuc 0.41 -0.90 0.07 *** 0.36 -1.02 0.08 *** staying home x parents col gradsuc 0.89 -0.11 0.14 staying home x hispanicuc 1.51 0.41 0.14 ** hispanic x parents col gradsuc 0.77 -0.26 0.21 staying home x hisp x col gradsuc 1.41 0.34 0.28

School-level Predictors (N=96) % economically disadvantaged 0.99 -0.01 0.01 0.99 -0.01 0.01 0.99 -0.01 0.01 % planning to go to college 1.01 0.01 0.00 * 1.01 0.01 0.00 * 1.01 0.01 0.00 * % white enrollment 1.00 0.00 0.01 1.00 0.00 0.01 1.00 0.00 0.01 % black enrollment 1.00 0.00 0.01 1.00 0.00 0.01 1.00 0.00 0.01 % asian am enrollment 1.07 0.07 0.02 ** 1.07 0.07 0.02 ** 1.07 0.07 0.02 ** % hispanic enrollment 1.02 0.02 0.00 *** 1.02 0.02 0.00 *** 1.02 0.02 0.00 *** 4yr colleges in proximity 0.97 -0.03 0.03 0.97 -0.03 0.03 0.97 -0.03 0.03 Intercept 1.07 0.06 0.08 0.73 -0.32 0.08 *** 1.21 0.19 0.08 * 1.28 0.24 0.09 ** Source: Texas Higher Education Opportunity Project (THEOP) Senior Cohort Wave 1 (2002) ucUncentered variable; all other variables are grand-mean centered. * p < 0.05 ** p < 0.01 *** p < 0.001

45

46

Table 4. Multilevel Models Predicting Whether Students Applied to a Selective College Model 1 Model 2 Model 3 Model 4 OR Coef RSE OR Coef RSE OR Coef RSE OR Coef RSE Student-level Predictors (N=13,803) white ref ref ref ref hispanicuc 0.52 -0.65 0.10 *** 0.78 -0.25 0.09 ** 0.95 -0.05 0.09 0.81 -0.21 0.14 blackuc 0.66 -0.41 0.10 *** 1.08 0.08 0.09 1.05 0.05 0.10 1.06 0.06 0.10 otheruc 1.24 0.22 0.08 * 1.21 0.19 0.11 1.44 0.36 0.11 ** 1.47 0.39 0.11 ** class rank 1.04 0.04 0.00 *** 1.03 0.03 0.00 *** 1.03 0.03 0.00 *** general curriculum track ref ref ref college prep track 1.23 0.21 0.07 ** 1.18 0.17 0.07 * 1.18 0.17 0.07 * distinguished achievement track 1.99 0.69 0.12 *** 1.75 0.56 0.12 *** 1.75 0.56 0.12 *** GPA 1.34 0.29 0.06 *** 1.32 0.28 0.06 *** 1.32 0.28 0.06 *** female 0.81 -0.21 0.07 ** 0.80 -0.22 0.07 ** 0.79 -0.23 0.06 ** US-born ref ref ref foreign-born (arrival age <12) 0.91 -0.09 0.09 1.00 0.00 0.10 0.99 -0.01 0.10 foreign-born (arrival age 12+) 0.78 -0.25 0.24 0.94 -0.06 0.23 0.93 -0.07 0.23 two parents in hhld 1.06 0.06 0.07 1.06 0.06 0.07 1.06 0.06 0.07 siblings in hhld 0.97 -0.03 0.06 0.99 -0.01 0.06 0.99 -0.01 0.06 other relatives in hhld 0.94 -0.07 0.09 0.96 -0.04 0.10 0.96 -0.04 0.10 parents college gradsuc 1.06 0.06 0.07 1.01 0.01 0.06 1.01 0.01 0.08 parents own home 1.12 0.11 0.08 1.07 0.07 0.10 1.07 0.07 0.10 staying home importantuc 0.32 -1.13 0.09 *** 0.30 -1.20 0.12 *** staying home x parents col gradsuc 0.93 -0.08 0.17 staying home x hispanicuc 1.34 0.29 0.22 hispanic x parents col gradsuc 1.17 0.16 0.30 staying home x hisp x col gradsuc 0.91 -0.10 0.43

47

School-level Predictors (N=96) % economically disadvantaged 0.98 -0.02 0.01 *** 0.98 -0.02 0.00 *** 0.98 -0.02 0.00 *** % planning to go to college 1.00 0.00 0.00 1.00 0.00 0.00 1.00 0.00 0.00 % white enrollment 1.00 0.00 0.01 1.00 0.00 0.01 1.00 0.00 0.01 % black enrollment 1.01 0.01 0.01 1.01 0.01 0.01 1.01 0.01 0.01 % asian am enrollment 1.04 0.04 0.02 * 1.03 0.03 0.02 * 1.03 0.03 0.02 *

0.02 0.09 ***

* % hispanic enrollment 1.01 0.01 0.01 * 1.01 0.01 0.01 * 1.01 0.01 0.01 4yr colleges in proximity 1.03 0.03 0.02 1.04 0.04 0.02 1.04 0.03Intercept 0.34 -1.09 0.08 *** 0.17 -1.78 0.08 *** 0.29 -1.22 0.09 *** 0.30 -1.20

Source: Texas Higher Education Opportunity Project (THEOP) Senior Cohort Wave 1 (2002) Uncentered variable; all other variables are grand-mean centered.

* p < 0.05 ** p < 0.01 *** p < 0.001

uc

Figure 1. Proportion for Whom Living at Home is Important

0.00

0.10

0.20

0.30

0.40

0.50

0.60

0.70

0.80

parents not college grads parents college grads

Prop

ortio

n

whites

blacks

hispanics

n=4,225

n=1,734

n=1,394

n=395

n=4,371

n=606

48

Figure 2. Predicted Odds of Applying to Any College

0.00

0.50

1.00

1.50

2.00

2.50

all not important to stay home important to stay home

Pred

icte

d O

dds

whites

hispanics

Model 2 Predictions

Model 3Predictions

49

Figure 3. Predicted Odds of Applying to a Four-year College

0.00

0.20

0.40

0.60

0.80

1.00

1.20

1.40

all not important to stay home important to stay home

Pred

icte

d O

dds

whites

hispanics

Model 2 Predictions

Model 3 Predictions

50

Figure 4. Predicted Odds of Applying to a Selective College

0.00

0.05

0.10

0.15

0.20

0.25

0.30

all not important to stay home important to stay home

Pred

icte

d O

dds

whites

hispanics

Model 2 Predictions

Model 3Predictions

51


Recommended