Page 1
The Role of Fertilizer in Transforming the
Agricultural Economy in the Kyrgyz Republic
by
Dilshod Abdulhamidov Kyrgyz Agri-Input Enterprise Development Project
for
P.O. Box 2040 Muscle Shoals, Alabama 35662, USA
www.ifdc.org
and
October 2014
Page 2
ii
TableofContents
Page
Abbreviations and Acronyms ........................................................................................................ iv
Executive Summary ........................................................................................................................ v
Methodology and Approach ........................................................................................................ viii
1. Overview of the Agriculture Sector in Kyrgyzstan ................................................................... 1
Wheat ........................................................................................................................................ 3
Maize......................................................................................................................................... 5
Potato ........................................................................................................................................ 5
2. Role of Fertilizer Use in Transforming the Agricultural Economy ........................................... 6
Fertilizer Supply by Nutrients and Products ............................................................................. 7
Fertilizer Production Potentials................................................................................................. 9
3. Organic Fertilizer Consumption .............................................................................................. 10
Organo-Mineral Fertilizer Consumption ................................................................................ 10
Consumption of Organic Fertilizer ......................................................................................... 11
4. Structure of Fertilizer Market .................................................................................................. 13
The Role of the Government in Fertilizer Supply .................................................................. 17
Supply of Fertilizer From Russian Federation ........................................................................ 20
Import of Fertilizer From the Republic of Uzbekistan ........................................................... 21
Import of Fertilizer From Republic of Kazakhstan ................................................................. 22
5. Fertilizer Consumption by Oblasts .......................................................................................... 23
Fertilizer Use in Wheat Production ......................................................................................... 25
Fertilizer Use in Maize Production ......................................................................................... 27
Fertilizer Use in Potato Production ......................................................................................... 29
Fertilizer Consumption by Secondary Nutrients ..................................................................... 30
6. Fertilizer Use by Farm Size Classification .............................................................................. 30
Fertilizer Use by Farm Size for Wheat Production ................................................................. 31
Fertilizer Use by Farm Classification for Maize Production .................................................. 32
Fertilizer Use by Farm Classification for Potato Production .................................................. 32
7. Value-Cost Ratio of Fertilizer Use on Crop Yields ................................................................. 33
Looking Back: VCR Then and Now ....................................................................................... 39
Page 3
iii
8. Yield Gap Levels and Limiting Factors in Food Security ....................................................... 40
Yield Gap Levels in Wheat Production .................................................................................. 42
Yield Gap Levels in Maize Production ................................................................................... 45
Summary of Results and Recommendations ................................................................................ 51
Recommendations ................................................................................................................... 52
References ..................................................................................................................................... 55
Appendix A. Fertilizer Requirements by Oblasts ........................................................................ 56
Appendix B. Livestock Manure Production Rates and Nutrient Content .................................... 57
Appendix C. Farm Machinery Deficits in Kyrgyz Republic ................................................... 5960
Page 4
iv
AbbreviationsandAcronyms
AAK Association of Agribusinessmen of Kyrgyz Republic "Jer Azygy"
AN Ammonium Nitrate
DCPP Department of Chemicalization and Plant Protection
FAO Food and Agricultural Organization
IFDC International Fertilizer Development Center
KAED Kyrgyz Agro-Input Enterprise Development project
kg kilogram
km kilometer
KZ Republic of Kazakhstan
MAP Monoammonium Phosphate (Ammophos)
MAWR Ministry of Agriculture and Water Resources
mt metric ton
NGO Non-Governmental Organization
NSC National Statistical Committee of Kyrgyz Republic
RF Russian Federation
SCEPVR State Commission for Crops Variety Testing and Registration
SIDA Swedish International Development Cooperation Agency
UZ Republic of Uzbekistan
VCR Value-Cost Ratio
WB World Bank
Page 5
v
The Role of Fertilizer in Transforming the Agricultural
Economy in the Kyrgyz Republic
ExecutiveSummary
This report was produced as part of the Kyrgyz Agro-Input Development Follow-on project
(KAED) implemented by the International Fertilizer Development Center (IFDC) for the United
States Agency for International Development (USAID) and draws on trial and survey data from
the project in addition to official statistics of the Kyrgyz Republic.
FertilizerSupplyandConsumption
Fertilizer consumption levels in the Kyrgyz Republic fall far short of what the country’s soils
and crops require. Annually, less than half of the required nitrogen is applied to the soil.
During the last 10 years, the use of inorganic phosphate fertilizer did not surpass 8.5 percent
of the amount required. The use of inorganic potash fertilizer has been virtually nonexistent
since 2005, representing only 0.05 percent of the amount required.
Imported fertilizer products mostly originate in Uzbekistan, Kazakhstan and the Russian
Federation. These imports face high transportation costs, which add a considerable amount to
retail prices. There are more than 20 private input companies and additional private
entrepreneurs involved in fertilizer supply to the country.
Farmers in southern Kyrgyzstan use fertilizer more intensively than those in the north; in
terms of inorganic fertilizer, southern farmers use 48.2 percent of the required amount,
compared to 10.8 percent for northern farmers. The local price of nitrogen fertilizer in local
markets in northern Kyrgyzstan is at least 91 percent higher than producers’ prices and
111 percent higher at minimum in southern Kyrgyzstan.
FertilizerUseforWheat,MaizeandPotatoProduction
Wheat is mostly grown on a low-input and low-output system in northern Kyrgyzstan; only
33.7 percent of farmers use fertilizer in the north, compared to 82.7 percent of farmers in the
south.
Page 6
vi
Maize is the most commercial crop among cereals in the Kyrgyz Republic due to relatively
higher output prices and the potential to export the crop. A total of 68.3 percent of farmers
(covering 80.1 percent of land area) use fertilizer for maize production. Inorganic phosphate
fertilizer is applied on only 36.5 percent of maize area.
Potato is one of the most important food security crops, and it is one of the staple foods for
the majority of the country. Organic and/or inorganic fertilizer is used for 88.3 percent of
potato area. Inorganic nitrogen and phosphate fertilizers are applied on about 31.6 percent
and 24.4 percent of potato area, respectively.
FertilizerUsebyFarmScales
More than 70 percent of wheat-producing farmers are smallholder and household farmers.
The proportion of farms that use organic and/or inorganic fertilizer ranges from 45.4 percent
(small-scale farmers) to 63.5 percent (large-scale farmers). Smallholders and households use
more nutrients per hectare for wheat production than average-scale farmers. However, no
observable increase in yields is observed, which may be explained by other factors such as
the inappropriate timing of application, seed spacing, poor varieties and cultural farming
practices.
About 90 percent of maize producers in the country grow on a land area of 2 hectares (ha) or
less. Large farms receive 50 percent higher yields compared to smallholders and households
due to their more extensive use of phosphate nutrients and, to a greater extent, their use of
hybrid seeds and better agricultural practices.
About 97 percent of farmers producing potato are smallholders. They use twice as much
nitrogen and phosphate nutrients compared to large farms. However, the yields are about
50 percent lower compared to large-scale farmers. Again, as with wheat and maize, this can
be attributed to their improper use of fertilizer, seed quality and cultivation practices.
The yields of wheat, maize and potato in the country are negatively correlated to farm land
size. One of the limiting factors is that large-scale farming approaches, management and
activities cannot be transferred to small fields. High service costs for machinery and inputs
would lead smaller farms to lower productivity and increase variable expenses per hectare.
Page 7
vii
Value‐CostRatioofFertilizerUseonCropYields
As the results on test fields show, using complete (NPK) fertilizer when poor quality seed is
used is inefficient and risky for all selected crops and gives a value-cost ratio less than 2.
Value-cost ratios for complete (NPK) fertilizer use for the three crops described in this paper
range from 1.82 for improved wheat, 2.19 for hybrid maize, and 4.99 for quality potato
seeds.
VCRs of selected crops for 2013 prices are lower compared to 2002 prices. This means that
fertilizer price increases have been much higher compared to output prices for the last 10
years.
YieldGapLevelsandLimitingFactorsinFoodSecurity
More than 90 percent of farmers who use fertilizer are unaware of or reluctant to apply the
required amount of nutrients (NPK) to the soil to achieve higher yields.
Many wheat farmers believe that using complete (NPK) fertilizer inputs to obtain maximum
yield in wheat production will not lead to greater income. A high yield gap (79 percent from
attainable yield) is observed among smallholders with an average area less than 1 ha. Factors
are both socio-economic and technical due to the fact that increases in yield response per
hectare with poor-quality seed provide insufficient additional income to cover fertilizer costs.
Farmers who use best practices and complete fertilizer for maize production are large-scale
farmers and account for about 2 percent of those surveyed. The large share of farmers (more
than 80 percent) who use inappropriate seeds and limited nutrients are smallholders and
households that, on average, cultivate maize on less than 1 ha. Yield gaps of these farmers
range from 47.7 to 69.8 percent.
The majority of potato growers are households and smallholders, and only 1.3 percent of
them use complete nutrients with proper seeds. Yield gaps for those farmers who do not
apply full nutrients range from 45.4 to 74.8 percent. Even assuming all elite seeds are
multiplied to C4 generation with a standard seed multiplication ratio of 1:4, the required
seeds cover about 8,500 ha, which is less than 11 percent of the total potato area in the
country.
Page 8
viii
Recommendations
The government of Kyrgyzstan should negotiate with international partners to arrange
wholesale prices for local dealers without engaging in distribution, which could crowd out
the private sector. The relatively high cost of phosphate and potash fertilizer imports due to
high transportation costs may be alleviated to some extent by improved infrastructure
investment and increased demand arising from continued farm demonstration of best
agricultural practices.
Further decentralization and increasing of local governments’ capacities would increase
farmers’ knowledge, skills and capacities to increase food production and improve food
security. Empowering capacities of local governments would have positive impacts. Stronger
decentralization can also work in tandem with improved extension services, which would
overcome the knowledge gaps constraining Kyrgyz agriculture that are described in detail in
this paper.
Voluntary land consolidation can offset the effects of fragmentation and is widely considered
a viable means to improve farm productivity by making knowledge, inputs and machinery
more readily available to farmers. This could also provide greater access to wholesalers and
supply chains for small-scale farmers.
MethodologyandApproach
The following methods of data collection and analysis were used:
Collection of available information from government institutions such as the National
Statistics Committee, Ministry of Agriculture and Water Resource Departments.
Interviews with local agro-input dealers on fertilizer imports.
Review of other publications on the agriculture sector in the Kyrgyz Republic.
Analysis of the KAED/IFDC survey data.
Only limited general information on fertilizer use exists in national statistics and agricultural
departments and governments. Fertilizer use by nutrient has not been recorded by any
government agency. The KAED/IFDC survey was conducted in October and November 2013. A
structured questionnaire was used to elicit information from farmers and was administered by
Page 9
ix
KAED employees to 100 farmers in each of the oblasts, resulting in a total of 700 farmers who
were sampled and disaggregated by crops, oblasts, farm size, nutrient use and yields.
Page 10
1
1.831.37
2.462.83
3.80
5.144.69 4.79
6.206.47
7.1546.3%
34.2%
28.5% 28.7%26.9%
23.5%
18.8%17.5% 16.6% 17.5%
15.2%
24.6%
18.8%
15.5%16.2%
15.1%13.2%
10.0% 9.0% 8.4% 8.0%
0.00
1.00
2.00
3.00
4.00
5.00
6.00
7.00
8.00
1996 2000 2005 2006 2007 2008 2009 2010 2011 2012 2013
Bilion Dollars
GDP Ag.GDP Crop GDP*
The Role of Fertilizer in Transforming the Agricultural
Economy in the Kyrgyz Republic
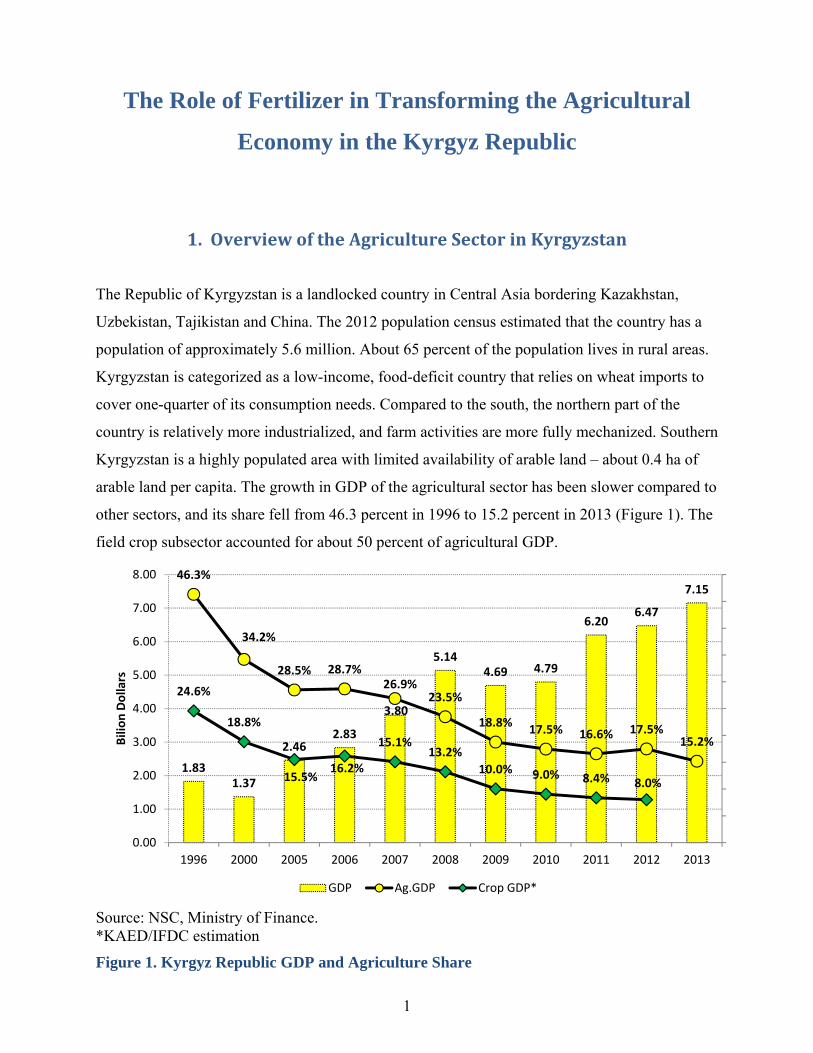
1.OverviewoftheAgricultureSectorinKyrgyzstan
The Republic of Kyrgyzstan is a landlocked country in Central Asia bordering Kazakhstan,
Uzbekistan, Tajikistan and China. The 2012 population census estimated that the country has a
population of approximately 5.6 million. About 65 percent of the population lives in rural areas.
Kyrgyzstan is categorized as a low-income, food-deficit country that relies on wheat imports to
cover one-quarter of its consumption needs. Compared to the south, the northern part of the
country is relatively more industrialized, and farm activities are more fully mechanized. Southern
Kyrgyzstan is a highly populated area with limited availability of arable land – about 0.4 ha of
arable land per capita. The growth in GDP of the agricultural sector has been slower compared to
other sectors, and its share fell from 46.3 percent in 1996 to 15.2 percent in 2013 (Figure 1). The
field crop subsector accounted for about 50 percent of agricultural GDP.
Source: NSC, Ministry of Finance. *KAED/IFDC estimation
Figure 1. Kyrgyz Republic GDP and Agriculture Share
Page 11
2
Agriculture has always been a vital sector of the Kyrgyz economy and should remain an
important focus of future support. Since the reorganization and distribution of 75 percent of land
to private individuals after the country’s independence, many small family farms and small farm
enterprises have become the engine of agricultural growth. Workers displaced during the
collapse of the industrial and service sectors after independence shifted their efforts to
agriculture to ensure food security, home consumption and physical survival. Labor productivity
declined due to the large increase in the agricultural labor force and the widespread lack of
farming know-how among the newly privatized farmers.
As shown in Table 1Table 1, more than 1 million legal entities and smallholder households are
involved in agriculture. The reduction of government and collective farms is apparent while
private enterprise farms have been steadily increasing over the years.
Table 1. Number of Agricultural Entities in the Kyrgyz Republic in 2007-2011
2007 2008 2009 2010 2011 Government & collective farms
1,758 (0.2%)
4,884 (0.5%)
1,390 (0.1%)
1,111 (0.1%)
621 (0.1%)
Smallholder households 726,632 (69.1%)
726,632 (69.0%)
726,632 (69.4%)
726,632 (68.6%)
726,632 (67.8%)
Private farm enterprises 323,555 (30.8%)
321,856 (30.6%)
318,815 (30.5%)
331,059 (31.3%)
344,492 (32.1%)
Total 1,051,945 1,053,372 1,046,837 1,058,802 1,071,745 Source: The NSCKR, 2012
Households hold only about 8.3 percent of the country’s agricultural land and account for about
25 percent of crop production value nationwide. Private farmers, with 85 percent of agricultural
land, remain the dominant source in crop production. There are significant constraints in the
agriculture sector – notably poor agricultural management practices, improper use of fertilizers
and seeds, resource constraints of small farms, and inadequate access to production technologies
using agricultural machinery
Wheat, maize and potato are the main staple crops in the Kyrgyz Republic and in total account
for about 43 percent of the arable land in the country. Wheat accounts for the largest share but is
steadily decreasing. Factors resulting in the reduction of wheat areas include low prices for the
Page 12
3
crop on the Kyrgyz market and the increase in planted areas of more profitable crops and forage
crops for cattle livestock.
In cereal markets in Central Asia, including Kyrgyzstan, quality, quantity and timing constraints
favor large-scale operations that are able to accommodate these requirements. Thus, private farm
enterprises, having relatively more access to mechanical operations resources, are involved in
low-value staple food crops that account for more than 34 percent of total income from
agricultural fields (Figure 2).
Figure 2. Arable Land of Kyrgyz Republic and Land Share of Selected Crops
Wheat
In Kyrgyzstan, wheat is the main staple, most important crop and is allocated the most land in
almost every part of the country, accounting for about 27.8 percent, or 325,000 ha, of cultivated
land. The average yield of winter wheat is up to 2.6 mt/ha in favorable years, which are much
less than the attainable yields. Wheat production occurs on irrigated land, which raises
production costs. There are a few factors, including fertilizer use, that are limiting yields in the
wheat sector – such as farm size, access to modern machinery and agricultural know-how – that
will be reviewed in the following chapters.
1,2121,134 1,129 1,160
1,170 1,146 1,159 1,16641.7%
36.3%31.7%
33.8% 34.4% 32.9% 32.6%27.8%
5.4%6.4%
6.7%
6.6% 6.7% 6.4% 6.4% 8.2%5.7% 7.2% 7.7%
7.2% 7.5% 7.4% 7.3% 7.0%
0
200
400
600
800
1,000
1,200
1,400
2000 2006 2007 2008 2009 2010 2011 2012
Thsd. h
a
Arable Land Wheat Maize Potato
Page 13
4
To meet the domestic demand, Kyrgyzstan regularly imports wheat from neighboring
Kazakhstan and Russia. The trend for increasing wheat and wheat flour imports (Figures 3 and 4)
results from Kazakhstan’s comparative advantages of relatively low production costs and
favorable natural conditions for growing high-quality hard spring wheat. The gluten quality and
content of local wheat is inadequate to produce good quality bread. Therefore, domestic flour
mills purchase and process Kazakh wheat and blend it with up to 30 percent Kyrgyz wheat to
produce flour for the local market. There are no import duties on Kazakh flour to protect local
mills.
Regardless of the volume of domestic production, the price for wheat is therefore largely
dependent on international prices, especially those in Kazakhstan and Russia. Low prices of
wheat in recent years have been forcing some farmers in Kyrgyzstan to shift to other crops.
However, many large farmers growing wheat do not shift because other crops, especially maize,
require modern machinery and additional inputs that they cannot afford.
Source: NSCKR, 2013
Figure 3. Wheat Grain Trade Balance in Kyrgyz Republic (thsd mt)
0
200
400
600
800
1000
1200
1400
1600
2009 2010 2011 2012
Domestic Production Import
Page 14
5
Source: The National Statistical Committee, 2012
Figure 4. Wheat Flour Import (thsd mt)
Maize
In the past, important land resources were allocated to the production of maize for grain and
livestock feed. Currently, maize is becoming a major commercial crop in Kyrgyzstan due to
higher yields and grain prices compared to wheat. The land area covered by maize increased
from 65,000 ha to about 95,000 ha during the last 10 years, accounting for 8.2 percent of
cultivated land in 2012, with average yields of 6.0 mt/ha. During the last few years, modern
hybrids have become popular among maize producers. A KAED/IFDC project has supported
farmers using high-yielding hybrids developed by Pioneer.
Potato
In terms of production volume, potatoes are the dominant vegetable in Kyrgyzstan. Compared to
Tajikistan and Uzbekistan, Kyrgyzstan has more favorable land and soil for potato production.
About 25 percent of all farmers produce potatoes. More than 95 percent of potato farms are
smallholder enterprises and household plots. Potatoes are the second most important crop for
food security after wheat and covers about 7 percent of the cultivated land with average yields of
16 mt/ha.
0
20
40
60
80
100
120
140
160
1998 1999 2000 2001 2002 2009 2010 2011 2012
Page 15
6
Source: The National Statistical Committee, 2012
Figure 5. Yield of Selected Crops in Kyrgyz Republic (mt)
2.RoleofFertilizerUseinTransformingtheAgriculturalEconomy
Agriculture can no longer rely solely on the inherited advantages of Kyrgyzstan – climate, land
and water. However, many Kyrgyz farmers are unaware of the potential impact of complex
fertilizers and high-quality crop production products. In order to prevent technological isolation,
Kyrgyzstan’s agriculture sector must embrace technology, especially within the agro-input
subsector. Kyrgyzstan relies on imported fertilizer to supplement its domestic production. Before
2010, more than 90 percent of fertilizer imports originated in Uzbekistan. While its market share
has decreased, Uzbekistan still accounts for most of the imports into Kyrgyzstan (Figure 6).
2.55 2.46 2.362.07 2.0 1.94
2.632.17 2.14
1.68
6.25
4.92
5.92 5.91 5.9 5.86 6.0 5.93 5.9 6.02
13.713.1
15.5 15.215.7 15.7 15.9 15.8 16.1 15.9
1990 1998 2003 2006 2007 2008 2009 2010 2011 2012
Metric Ton per ha
Wheat Maize Potato
Page 16
7
Figure 6. Market Share of Fertilizer Import by Countries in 2011-2013 ( percent)
FertilizerSupplybyNutrientsandProducts
The fertilizer situation has been worsening in Kyrgyzstan since the country gained independence,
and application of fertilizer has dramatically decreased since 1990. In 2013, the application of
fertilizers decreased to 27.7 percent of the amount required (Figure 7).
Source: DCPP, 2013
Figure 7. Fertilizer Requirements and Consumption as Product Weight in Kyrgyzstan, 1990-2013 (thousand mt)
60%
30%
10%
Uzbekistan Russia Kazakhstan
300319.9 328.6 337.6 338 339 340.8 340 340.8 340.8 340.8 340.8
300191.5
(59.9%)
100.4(30.6%) 85
(25.2%)
89(26.9%)
84.5(24.9%)
99.4(29.2%)
94.9(27.9%)
90.8(26.6%)
107.7(31.6%) 80.2
(23.5%)
94.3(27.7%)
0
50
100
150
200
250
300
350
400
1990 1995 2000 2005 2006 2007 2008 2009 2010 2011 2012 2013
mt
Fertilizer requirements Fertilizer applied
Page 17
8
The amount of fertilizer required in physical weight is updated annually by Kyrgyzstan’s
Department of Chemicalization and Plant Protection (DCPP) using crop area multiplication to
determine the nutrient requirements of each crop per hectare. Furthermore, the total sum amount
is expressed in terms of ammonium nitrate, ammophos and potassium chloride. Nutrient removal
rates and fertilizer nutrient requirements of each crop by oblast are presented in Appendix A.
The reduction in fertilizer use is only the tip of the iceberg in explaining Kyrgyzstan’s fertilizer
issues. According to soil analyses by the IFDC/KAED project in 2003, the recommended
application of potash and phosphate fertilizers ranges from 120 kilograms (kg)/ha to 250 kg/ha
for the selected crops. However, in reality, these phosphate (and especially potash) fertilizers are
rarely applied in Kyrgyzstan. Farmers no longer adhere to balanced application of fertilizer.
According to the Association of Agribusinessmen of Kyrgyzstan (AAK), more than 95 percent
of fertilizer used is nitrogen fertilizer (ammonium nitrate), 4.5 percent is phosphorus (ammonium
phosphate, superphosphate) and 0.5 percent is potash. It should be noted that these results were
obtained from the observation of 700 farmers in all oblasts (four rayons) of Kyrgyzstan. It is
inferred that most other Kyrgyz farmers have similar habits concerning input use.
Table 2 presents fertilizer requirements and use by nutrient. The majority of farmers apply
nitrogen fertilizer, and 46.7 percent of the amount of fertilizer required was used in 2003. During
the last decade, the highest application/requirement ratio (7.2 percent) for phosphate fertilizer
occurred in 2010. Potash fertilizer use was about 200 times less than the amount needed in 2003-
2005. The application of potash has rarely been observed since 2005. Only a small portion of
farmers used inorganic potash fertilizer from 2007-2009 for fertilizer use trials. It has been
argued that Kyrgyzstan’s soils have enough phosphate and potash nutrients without adding
fertilizer. However, the amount of these nutrients in the soil should be explored and discussed
when more data is available.
Page 18
9
Table 2. Fertilizer Requirements and Consumption in Kyrgyzstan in 2002-2011
Products 2002 2003 2004 2005 2006 2007 2008 2009 2010 2011
Nitrogen
Requirement 66,798 67,253 67,708 68,162 68,235 68,437 68,802 68,638 68,800 68,800
Applied 9,232
(13.8%) 31,383 (46.7%)
27,232(40.2%)
29,589(43.4%)
26,842 (39.3%)
26,141(38.2%)
22,530 (32.7%)
24,523 (35.7%)
25,252(36.7%)
29,952(43.5)
Phosphate (P2O5 equivalent)
Requirement 43,118 43,412 43,705 43,999 44,046 44,176 44,412 44,306 44,410 44,410
Applied 205
(0.5%) 1,810
(4.2%) 1,684
(3.9%)2,034
(4.6%)1,652 (3.8%)
2,601 (5.9%)
1,747 (3.9%)
2,301 (5.2%)
3,200 (7.2%)
3,796(8.5%)
Potash (K2O equivalent)
Requirement 3,908 3,934 3,961 3,987 3,992 4,004 4,025 4,015 4,025 4,025
Applied 46
(1.2%) 18
(0.5%) 8
(0.2%)0
(0%) 0
(0%) 1
(0.02%)1
(0.02%) 1
(0.02%) 0
(0%) 0
(0%)
Source: FAOSTAT (based on inorganic fertilizer) and author estimations
As Table 3 presents, nutrient removal of three selected crops accounts for a total of 96,538 mt,
even though these crops cover only 43 percent of arable area. More than 45 mt of K2O are
annually removed and are not properly replaced with inorganic fertilizer for years.
Table 3. Nutrient Removal at Country Level for Selected Crops (mt)
Crop Production
(mt) Nutrient removal kg/t*
N P2O5 K2O Total N P2O5 K2O Total
Wheat 540,531.2 27.2 10.2 34.5 71.9 14,702 5,513 18,648 38,863 Maize 578,294.1 28.6 10.2 28.7 67.5 16,539 5,899 16,597 39,035 Potato 1,312,699.3 4.4 2 7.8 14.2 5,776 2,625 10,239 18,640 Total 2,431,524.6 37,017 14,037 45,484 96,538 Source: Handbook of Agriculture, ICAR
FertilizerProductionPotentials
The Chinese company China Machinery Engineering Corporation plans to build a fertilizer plant
for production of nitrogen fertilizers at Tash-Kumyr, Jalalabad Oblast. A feasibility study of a
fertilizer plant using coal as feedstock was prepared by a Chinese company, CITIC, in 2005-
2006. The construction of the plant is valued at $350 million and the design capacity of the plant
is 310 mt of nitrogen fertilizer per year. The memorandum of exclusive cooperation in
construction of the mineral fertilizer plant was signed by the Kyrgyz Ministry of Agriculture and
Water Resources (MAWR), China's Machine Engineering Corporation and Mineral Fertilizers
Page 19
10
Plant Ltd. on July 2012. According to the agreement, the Chinese company will transfer a 30-
percent stake in the charter capital of the Mineral Fertilizers Plant Ltd. to the Kyrgyz
government.
Some argue that this will negatively impact the environment. Considering existing fertilizer
production in neighboring countries Uzbekistan and Kazakhstan, further studies should be done
to determine the environmental impacts and if the production is economically viable.
3.OrganicFertilizerConsumption
Organo‐MineralFertilizerConsumption
Due to the rise in price of fertilizers and the closing of the border with the Republic of
Uzbekistan in Kyrgyzstan in 2010, there was increase in the use of organo-mineral fertilizers and
their distribution among farmers. Input dealers have been actively working to expand
importation of these fertilizers into the country, and in 2012 the supply of organo-mineral
fertilizers increased up to 350 mt.
More than 40 types of organo-mineral fertilizers exist in the market. More than 70 percent of
supplied organo-mineral fertilizer is used in northern Kyrgyzstan. The domestic company Adaid
LLC established local production of the organo-mineral fertilizer “Kyrgyz Humate.” The
fertilizer is recommended for use with irrigation on all crops with an application rate of 1 liter
(L) per 1,000 L of water per hectare and a cost of 100 soms/L (~$2/L). Many users compare this
type of fertilizer with AN and give preference to organo-mineral fertilizer due to its very low
prices. As DCPP reported, using the local organo-fertilizer “Kyrgyz Humate” increased the
potato yields in Issyk-Kul Oblast by 50 percent. However, due to the unavailability of data on the
nutrient content of this type of fertilizer and its insignificant use at around 350mt, the use of
organo-mineral fertilizer nutrients is not included in this report.
Page 20
11
Figure 8. Supply of Organo-Mineral Fertilizer in Kyrgyz Republic (mt)
ConsumptionofOrganicFertilizer
Poor soil fertility is becoming a major constraint to agricultural production in Kyrgyzstan.
Insufficient application of fertilizer not only hampers the productivity but also the quality of the
soil. For the last 25 years, soil nutrient depletion has been significant due to the negative balance
of fertilizer use. Humus content in the topsoil, which is important for fertility, ranges from just 1-
3 percent (AAK, 2013).
Current agricultural methods have been stripping increasing amounts of nutrients from the soil,
leading to a reduction in humus reserves, which in turn leads to a significant loss of soil fertility,
to water erosion and to soil degradation. Humus is a reserve fund of nutrients; to maintain and
replenish soil humus, it is necessary to follow crop rotations with perennial grasses. In addition,
organic fertilizers should be applied to the soil.
Historically, manure application has been common in Kyrgyzstan, and many farmers maintain
organic matter of the soil using manure. Manure is the most important organic fertilizer in the
country. Numerous trials before 1992 suggest that increasing crop yields, especially in the non-
chernozem (non-black) zone, largely depends on the quality and quantity of manure applied.
5
53
350 350
0
50
100
150
200
250
300
350
400
2008 2011 2012 2013
Metric Ton
Page 21
12
According to 1992 trials, 20-30 mt/ha of manure increased cereal grains by 0.6-0.7 mt/ha and
potato yields by 6-7 mt/ha.
As Table 4 shows, 442,800 mt of organic fertilizer were applied in 2010, which is almost
32 percent less than in 2006 (Table 4). However, some growth in the use of organic fertilizers
has been observed since 2011.
Table 4. Organic Fertilizer Use in the Kyrgyz Republic in 2006-2012 (thsd mt)
Regions 2006 2007 2008 2009 2010 2011 2012
Total Kyrgyz Republic 649.7 429.8 697.7 375.9 393.2 401.0 442.8
Chuy Oblast 34.6 40.2 59.0 48.8 33.1 22.7 28.8
Issyk-Kul Oblast 34.4 20.0 142.0 81.1 146.0 151.4 185.0
Naryn Oblast 96.2 82.8 99.6 88.6 85.6 100.2 104.6
Talas Oblast 175.2 22.8 24.8 25.8 31.9 33.4 31.2
Subtotal Northen Oblasts 340.4 165.8 325.4 244.3 296.6 307.7 349.6
Osh Oblast 296.2 229.1 298.1 32.3 28.6 25.2 24.3
Jalal-Abad Oblast 5.5 26.5 69.4 94.4 58.3 57.2 63.9
Batken Oblast 7.6 8.4 4.8 4.9 9.7 10.9 5.0
Subtotal Southern Oblasts 309.3 264.0 372.3 131.6 96.6 93.3 93.2
The livestock subsector represents about half of the agricultural GDP. Because more than
90 percent of farmers from the survey own livestock – such as cattle, sheep, goats and poultry –
they can use organic fertilizer produced by their own farms or nearby. Table 5 represents the
approximate organic fertilizer production capabilities of major livestock producers in the
country. These physical and nutrient estimates have been done with livestock that spend the
majority of their time feeding in pastures, thus producing less retrievable manure than those who
spend most of their time in barns (see Appendix B, Tables B.1-B.4). One of the reasons that
farmers apply less than 5 percent of their livestock’s capacity of manure is that keeping livestock
in pastures makes it difficult to obtain the manure. The other reason is that the largest share of
available manure is used for heating houses during winter because it is much cheaper than
buying coal in the market.
Page 22
13
Table 5. Approximate Quantity, Composition and Value of Manure (in solid weight) Produced by Major Livestock in Kyrgyz Republic in 2013 (thsd mt)
Annual
Production Nitrogen
(N) Phosphorus
(P2O5) Potassium
(K2O) Calcium
(Ca) Magnesium
(Mg) Organic Matter
Kyrgyz Republic 8,717.7 175.1 129.8 207.9 262.6 63.3 5,688.9
Chuy Oblast 1,445.1 29.8 22.0 33.2 42.9 10.3 963.2
Issyk-Kul Oblast 1,242.2 25.0 18.5 29.7 37.5 9.0 808.7
Naryn Oblast 1,042.1 20.5 15.3 25.9 31.9 7.7 660.2
Talas Oblast 528.8 10.5 7.8 13.2 16.2 3.9 333.1
Subtotal Northen Oblasts
4,258.2 85.8 63.5 101.9 128.6 31.0 2,765.1
Osh Oblast 1,936.2 38.8 28.8 45.6 58.0 14.0 1,277.7
Jalal-Abad Oblast 1,756.1 35.2 26.1 42.0 52.9 12.8 1,144.3
Batken Oblast 767.2 15.3 11.4 18.3 23.1 5.6 501.8
Subtotal Southern Oblasts
4,459.6 89.3 66.3 105.9 134.0 32.3 2,923.8
4.StructureofFertilizerMarket
Imported fertilizers are supplied to Kyrgyzstan by Uzbekistan, Russia and Kazakhstan. Figure 10
represents the flow of fertilizer from these countries. All fertilizer is imported via railroad. Part
of the fertilizer from Uzbekistan is imported to the south via railroad without border transfer,
especially from FerganaAzot. Fertilizer is also imported from Kazakhstan by rail. Import tariff
rates account for an insignificant share (0.15 percent) of transportation and distribution expenses.
About 70 percent of fertilizer is distributed directly to large farms from the warehouses, and the
remaining 30 percent is distributed to small farmers in all major markets and regional cropping
areas (AAK, 2013). More than 20 firms and many private entrepreneurs are involved in fertilizer
import and supply to the country. Main fertilizer importers are listed on Table 6.
Page 23
14
Table 6. Fertilizer Importers to Kyrgyz Republic in 2013
Russian Federation Kazakhstan Uzbekistan
Agrokhimprom LLC Agrokhimiya LLC Agromet LLC Albico LLC Albi-Agro LLC Agropromishlennaya Pervaya LLCAlber LLC Agro-League LLC Fazenda Friend LLC JSC Geya Phosagro LLC Hartley Trade LLC Khimteks LLC Agrtostyle LLC Khimteks LLC Albi-Agro LLC Albico LLC Oligarch Trade LLC Hermes Treade LLC RR Compani LLC Negotiant LLC Yulita LLC Source: MAWR, 2013
In addition, some companies invest their available funds for import and wholesale activity at the
end of the year and before the beginning of the cropping season, even if fertilizer is not their
main business activity.
The price of fertilizer depends on costs accrued by road transportation, storage, handling,
distribution and marketing. For example, increases in ammonium nitrate (AN) prices in the
country range from 90.7 to 222 percent above the initial producer’s price depending on the
originating country and the oblasts where the products are sold (Table 7Tables 7 and 8).
Some input dealers do not have the capacity and time for storage, so they sell fertilizer at
wholesale prices a few days after it is imported. As Table 7 shows, AN fertilizer from Russia is
sold for $393/mt during December and January within a few days of being imported. Further, the
price is increased 19.6 percent by retail dealers in Chuy Oblast due to storage costs. The retail
fertilizer price for Uzbek and Kazakh dealers is increased from wholesale prices by 14.5 percent
and 13.5 percent. In Osh Oblast, wholesale dealers transport and sell for higher prices. For
example, the wholesale price of Russian AN in Osh Oblast is $462.35/mt, compared to
$393.13/mt in Chuy Oblast (Table 7).
Page 24
15
Table 7. Supply Chain Costs Components of Fertilizer in Chuy and Osh Oblasts
Costs
% of Retail Price Cumul. Costs
% of Retail Price Cumul. Costs
% of Retail Price Cumul.
Chuy Oblast (North)
Producer price, U.S. $/mt $210.00 41.4% $210.00 $255.00 52.4% $255.00 $310.00 58.8% $310.00
Transportation costs + customs duties
$108.37 21.4% $318.37 $92.65 19.1% $347.65 $58.83 11.2% $368.83
Overhead costs $9.30 1.8% $327.67 $3.20 0.7% $350.85 $4.42 0.8% $373.25
Storage costs $11.27 2.2% $338.94 $4.84 1.0% $355.69 $5.21 1.0% $378.46
Finance costs $30.50 6.0% $369.44 $21.34 4.4% $377.03 $22.71 4.3% $401.17
Operating costs $5.57 1.1% $375.01 $4.19 0.9% $381.22 $4.47 0.8% $405.64
Total margins $131.94 26.0% $506.95 $105.02 21.6% $486.24 $121.98 23.1% $527.62
Wholesale price, $/mt $393.13 $372.43 $424.16
Local market price, $/mt $506.95 $486.24 $527.62
Osh Oblast (South)
Retail price, U.S. $/mt $210.00 37.6% $210.00 $255.00 47.4% $255.00 $310.00 53.5% $310.00Transportation costs + customs duties
$157.10 31.0% $367.10 $141.38 26.3% $396.38 $107.56 18.6% $417.56
Overhead costs $8.63 1.7% $375.73 $2.89 0.5% $399.27 $3.39 0.6% $420.95
Storage costs $9.27 1.8% $385.00 $3.93 0.7% $403.20 $4.26 0.7% $425.21
Finance costs $34.65 6.8% $419.65 $24.19 4.5% $427.39 $25.51 4.4% $450.72
Operating costs $4.91 1.0% $424.56 $3.42 0.6% $430.81 $4.87 0.8% $455.59
Total margins $134.09 26.5% $558.65 $107.07 19.9% $537.88 $123.76 21.4% $579.35
Wholesale price, $/mt $462.35 $441.65 $493.38
Local market price, $/mt $558.65 $537.88 $579.35
Page 25
16
Table 8. Supply Chain Costs Components of Fertilizer by Oblasts
Fertilizer Retail Price Component
Ammonium Nitrate (Tolyatti, Russia)
Ammonium Nitrate (NavoiAzot, Uzbekistan)
Ammophos (Kazphosphate, Kazakhstan)
Costs
% of Retail Price
Cum. Costs Costs
% of Retail Price
Cum. Costs Costs
% of Retail Price
Cum. Costs
Import Parity Price Costs
Producer Price, U.S. $/mt $210.00 41.42% $210.00 $255.00 52.44% $255.00 $310.00 58.75% $310.00
Railroad Transportation costs:
Russia $19.84 3.91% $229.84 $0.00 0.00% $255.00 $310.00
Uzbekistan $229.84 $30.05 6.18% $285.05 $310.00
Kazakhstan $53.91 10.63% $283.75 $27.98 5.75% $313.03 $24.21 4.59% $334.21
Kyrgyzstan $6.13 1.21% $289.88 $6.13 1.26% $319.16 $6.13 1.16% $340.34
Custom duties $1.00 0.20% $290.88 $1.00 0.21% $320.16 $1.00 0.19% $341.34
Total Rail Transporation, U.S. $/mt $80.88 15.95% $290.88 $65.16 13.40% $320.16 $31.34 5.94% $341.34
Unloading/Uploading $7.00 1.38% $297.88 $7.00 1.44% $327.16 $7.00 1.33% $348.34
Import Parity Price $297.88 $327.16 $348.34
Chuy Oblast
Road Transportation $20.49 4.04% $318.37 $20.49 4.21% $347.65 $20.49 3.88% $368.83
Storage, Distribution, Net Margin $188.58 37.20% $506.95 $138.59 28.50% $486.24 $158.79 30.10% $527.62
Retail Price, U.S. $/mt $506.95 $506.95 $486.24 $486.24 $527.62 $527.62
Issyk-Kul Oblast
Road Transportation $38.49 7.29% $336.37 $38.49 7.59% $365.65 $38.49 7.02% $386.83
Storage, Distribution, Net Margin $191.26 36.25% $527.63 $141.28 27.87% $506.93 $161.48 29.45% $548.31
Retail Price, U.S. $/mt $527.63 $527.63 $506.93 $506.93 $548.31 $548.31
Naryn Oblast
Road Transportation $54.60 9.96% $352.48 $54.60 10.35% $381.76 $54.60 9.60% $402.94
Storage, Distribution, Net Margin $195.84 35.72% $548.32 $145.87 27.65% $527.63 $166.06 29.18% $569.00
Retail Price, U.S. $/mt $548.32 $548.32 $527.63 $527.63 $569.00 $569.00
Osh Oblast
Road Transportation $69.22 12.39% $367.10 $69.22 12.87% $396.38 $69.22 11.95% $417.56
Storage, Distribution, Net Margin $191.55 34.29% $558.65 $141.50 26.31% $537.88 $161.79 27.93% $579.35
Retail Price, U.S. $/mt $558.65 $558.65 $537.88 $537.88 $579.35 $579.35
Jalalabad Oblast
Road Transportation $61.84 11.28% $359.72 $61.84 11.72% $389.00 $61.84 10.87% $410.18
Storage, Distribution, Net Margin $188.52 34.39% $548.24 $138.62 26.27% $527.62 $158.82 27.91% $569.00
Retail Price, U.S. $/mt $548.24 $548.24 $527.62 $527.62 $569.00 $569.00
Batken Oblast
Road Transportation $112.47 18.43% $410.35 $112.47 19.41% $439.63 $112.47 17.82% $460.81
Storage, Distribution, Net Margin $199.89 32.76% $610.24 $139.72 24.12% $579.35 $170.27 26.98% $631.08
Retail Price, U.S. $/mt $610.24 $610.24 $579.35 $579.35 $631.08 $631.08
A basic problem facing fertilizer traders across the country is that fertilizer requires high
transportation costs. This accounts for 49-57.2 percent of the price increase, depending on the
Page 26
17
region. While rail transport of Uzbek AN accounts for 25.6 percent of additional costs to
fertilizer, additional long-distance transportation by road incurs an additional cost ranging from
8-44 percent, which causes an increase in retail prices.
For example, AN fertilizer in Batken Oblast is more than doubled because it requires at least 730
km of road transportation to be sold. Some dealers supply fertilizer to Laylak, a town in Batken
Oblast, and also sell to dealers and farmers from Tajikistan. There are high re-export duties,
about $286/mt, but it is very difficult to prohibit illegal re-export due to the poorly controlled
Kyrgyz-Tajik border. Resale to Tajik dealers and farmers is apparently why some dealers
transport fertilizer to Batken Oblast despite its high costs. Transportation and delivery costs to
southern oblasts accrue about an additional $70/mt. As for Batken Oblast in the south, near to
Tajikistan, the delivery costs including unloading and uploading are about $100/mt.
TheRoleoftheGovernmentinFertilizerSupply
The Kyrgyz Government negotiated an agreement with the Government of Uzbekistan to supply
200,000 mt of ammonium nitrate and urea to the country. A total of 18,000 mt of ammonium
nitrate and urea for the retail price of $295.11 and $351.50/mt, respectively, was supplied
directly to farmers by mid-February 2014. Under this arrangement, fertilizers are distributed
without private contractors through the State Fund of Material Reserves at a prime cost. There
are several selling points in the southern oblasts with the support of local governments. There are
plans to expand this network to the northern oblasts of Chuy and Issyk-Kul.
The argument for fertilizer supply at cheap prices is that farmers with limited financial resources
are unwilling to make large financial investments and/or take risks to buy fertilizer at high
current market prices. Fertilizer supply at cheaper prices, by a minimum of 35 percent,
encourages many farmers to buy inputs, reduce soil erosion and increase yield opportunities.
However, there is also the possibility that this will discourage private sector businesses that have
already purchased and stored fertilizer during winter and would not be able to sell for expected
prices.
The Association of Agribusinessmen of Kyrgyzstan (AAK), supported by the KAED/IFDC
project, has had an important private sector influence on agricultural policy. The association
Page 27
18
helped remove the 20-percent value-added tax on fertilizer imports in 2004, which resulted in a
slight increase in nitrogen and phosphate fertilizer use compared to the previous year.
Figure 9. Supply Chain of Fertilizer in Kyrgyz Republic
Fertilizer Points (RF, UzR, KzR)
AN (RF ) $210/mtAN (UzR) $255/mt
APh (KzR) $310/mt
Fertilizer Dealers
Farmers
Southern Fertilizer Dealers
FarmersFarmersFarmers
Farmers
Road TransportationNorthern Oblasts: $20/mt-$55/mt
Southern Oblasts: $69/mt-$112/mt
Railroad Transportation
$38/mt-$88/mt
Page 28
19
Figure 10. Flow of Fertilizer From Uzbekistan, Kazakhstan and Russia, and Further Distribution Map
UZ: Navoiazot (AN)
UZ: FerganaAzot (AN)
KZ: KazAzot (AN)
KZ: Kazphosphate (Ammophos, Superphosphate)
RF: All Types of fertilizer
Page 29
20
SupplyofFertilizerFromRussianFederation
There are a large number of plants producing nitrogen and phosphate fertilizers in Russia.
These fertilizer plants are located in Kemerovo, Kyrovsk, Solykamsk, Velkyi Novgorod,
Perm, Tver, Tolyatti, Voskresensk, Meleuz (Bashkortostan) and other cities. Since the
demand increases early each year in Russia, a few Kyrgyz dealers contact Russian fertilizer
plants in October and November. Long-term agreements with a fertilizer plant are not
practical because of the possibility of price changes in subsequent years. Searching for lower
factory gate prices and rail transportation costs are the main tasks for importers in October
and November each year. Fertilizers from Russia are imported during the winter months and
stored until the growing season. Factory prices in producing countries such as Russia and
Kazakhstan are cheaper in the winter than during the seeding and growing seasons when non-
resident importers must compete with local Russian or Kazakh demand for supplies.
Although fertilizer in Russia is cheaper than in Kazakhstan, importers shoulder high rail costs
of at least $87.88/mt (17.3 percent of the supply chain cost component).
Figure 11. Supply Chain Cost Components of Ammonium Nitrate from Russian Federation in 2013 ($/mt)
$210(34.4%)
$210(38.3%)
$210(37.6%)
$210(38.3%)
$210(39.8%)
$210(41.4%)
$87.88(14.4%)
$87.88(16.0%)
$87.88(15.7%)
$87.88(16.0%)
$87.88(16.7%)
$87.88(17.3%)
$112.47(18.4%)
$61.84(11.3%)
$69.22(12.4%)
$54.60(10.0%)
$38.49(7.3%)
$20.49(4.0%)
$199.89(32.8%)
$188.52(34.4%)
$191.55(34.3%)
$195.84(35.7%)
$191.26(36.2%)
$188.58(37.2%)
$0 $100 $200 $300 $400 $500 $600
Batken
Jalalabad
Osh
Naryn
Issyk-Kul
Chuy
Producer Price Railroad Transportation
Road Transportation Storage, Distribution, Marketing
Page 30
21
ImportofFertilizerFromtheRepublicofUzbekistan
There are several large fertilizer plants in Uzbekistan that produce nitrogen, phosphate and
compound fertilizers: FerganaAzot, Navoiazot, Chirchik Fertilizer Plant, Samarkand
Superphosphate Factory, Maxam-Chirchik, Ammofos-Maxam and Kukon Superphosphate
JSC. Until 2010, Oshkrastex LLC was an exclusive importer of fertilizer from FerganaAzot,
which is situated about 35 km from Kyzyl-Kiya, Batken Oblast, in southern Kyrgyz
Republic. However, civil instability in 2010 compelled Uzbek authorities to close its Kyrgyz
border and disrupted fertilizer supply.
A significant but limited share of imported ammonium nitrate came from Uzbekistan through
Kazakhstan. The fertilizer plant Navoiazot in Uzbekistan uses a Commodity Exchange to sell
fertilizer at the end of each year for coming seasons. Dealers use this opportunity and request
fertilizer for early spring via Commodity Exchange.
It should be noted that the import parity price of Russian AN supplied from Uzbekistan is
lower by about 9 percent compared to Uzbek AN, while the retail price is higher by about
4 percent. This is due to a storage of Russian fertilizer during winter, which leads to higher
costs.
In the middle of 2013, Agromet LLC began legally importing fertilizer from FerganaAzot.
Page 31
22
Figure 12. Supply Chain Cost Components of Ammonium Nitrate from Uzbekistan (Navoiazot) in 2013 ($/mt)
ImportofFertilizerFromRepublicofKazakhstan
The neighboring country Kazakhstan has rich natural resources and a thriving mining
industry, led by developments in its oil and gas sectors. KazAzot is the sole producer of
ammonia and ammonium nitrate in the country. In addition, the country is significantly
developing phosphate deposits and producing fertilizers under the management of a private
company, Kazphosphate. In Kazakhstan, the KazAzot plants situated in Aktau and Taraz are
manufacturing phosphate and compound fertilizers. Only a few companies obtain nitrogen
and phosphate fertilizer directly from the Kazphosphate and KazAzot plants. Small Kyrgyz
agro-dealers receive inputs through the hub of Lugovaya.
$255(44.0%)
$255(48.3%)
$255(47.4%)
$255(48.3%)
$255(50.3%)
$255(52.4%)
$72.16((12.5%)
$72.16(13.7%)
$72.16(13.4%)
$72.16(13.7%)
$72.16(14.2%)
$72.16(14.8%)(
$112.47(19.4%)
$61.84(11.7%)
$69.22(12.9%)
$54.60(10.3%)
$38.49(7.6%)
$20.49(4.2%)
$139.72(24.1%)
$138.62(26.3%)
$141.50(26.3%)
$145.87(27.6%)
$141.28(27.9%)
$138.59(28.5%)
$0 $100 $200 $300 $400 $500
Batken
Jalalabad
Osh
Naryn
Issyk-Kul
Chuy
Producer Price Railroad Transportation
Road Transportation Storage, Distribution, Marketing
Page 32
23
Figure 13. Supply Chain Cost Components of Ammonium Nitrate from Kazakhstan (Kazphosphatet) in 2013 ($/mt)
5.FertilizerConsumptionbyOblasts
Farmers in the south, including the Osh, Jalalabad and Batken oblasts, use more fertilizer
(48.2 percent of the requirement) than their northern counterparts (10.8 percent of the
requirement). This is due to the fact that the Association of Agribusinessmen of Kyrgyzstan –
“Jer-Azygy” – was initially established in the south in 2002 with the help of IFDC’s KAED
project and IFDC technical support, directed toward southern dealers and farmers. Farmers in
the south also had access to lower-cost Uzbek fertilizers. Until 2010, fertilizers were mostly
imported from Uzbekistan to Osh Oblast. These normally accounted for over 95 percent of
the country’s supply and were mainly composed of ammonium nitrate. This encouraged
farmers to use cheaper fertilizer.
$310(49.1%)
$310(54.5%)
$310(53.5%)
$310(54.5%)
$310(58.5%)
$310(58.8%)
$38.34(6/1%)
$38.34(6.7%)
$38.34(6.6%)
$38.34(6.7%)
$38.34(7.0%)
$38.34(7.3%)
$112.47(17.8%)
$61.84(10.9%)
$69.22(11.9%)
$54.60(9.6%)
$38.49(7.0%)
$20.49(3.9%)
$170.27(27.0%)
$158.82(27.9%)
$161.79(27.9%)
$166.06(29.2%)
$161.48(29.5%)
$158.79(30.1%)
$0 $100 $200 $300 $400 $500 $600
Batken
Jalalabad
Osh
Naryn
Issyk-Kul
Chuy
Producer Price Railroad Transportation
Road Transportation Storage, Distribution, Marketing
Page 33
24
Source: DCPP Figure 14. Fertilizer Requirement and Use in Physical Weight by Oblasts in 2011 (mt)
According to the National Statistical Committee of Kyrgyz Republic (NSC), fertilizer
consumption from 2007-2011 ranged from 20.9 kg to 25.5 kg (Table 9). However, fertilizer
was used for only about one-third of the portion of cultivated land. Fertilizer is often used for
commercial crops, cotton and potato, while in 2011, use with food crops averaged about
17.5 kg of fertilizer nutrient.
7,90039.3%
27,390(47.9%)
25,296(52.2%)
60,586(48.2%)
4,438(18.2%)
14,453(14.1%)
4,000(6.4%)
277(1.1%)
23,168(10.8%)
12,200
29,81023,204
65,214
19,962
88,147
58,700
25,023
191,832
0
50,000
100,000
150,000
200,000
250,000m
t Fertilzerrequrement
Fertilizerapplied
Page 34
25
Table 9. Mineral Fertilizer Consumption per Cultivated Land in 2007-2011 (kg/ha)
Products/Years 2007 2008 2009 2010 2011 Fertilizer consumption (sum of N, P2O5 and K2O equivalent) per ha
25.5 20.9 22.9 24.8 20.8
Including: Nitrogen fertilizer 23.2 19.4 21.0 22.0 N/A Phosphate (P2O5 equivalent) 2.3 1.5 2.0 2.8 N/A Potash (K2O equivalent) 0.0 0.001 0.001 0.000 N/A Fertilizer (sum of N, P2O5 and K2O equivalent) applied for selected crops: Cereals (excluding maize) 26.6 20.7 27.6 29.7 22.7 Sugar beet 21.7 N/A 13.2 26.7 16.5 Cotton 134 101.9 103.4 102.2 103.1 Tobacco 56.5 19.7 88.5 32.7 73.1 Potato 38.5 32.1 28.5 25.5 24.4 Vegetables 18.6 31.2 25.1 30 24.1 Agriculture land portion where fertilizer applied (%)
27.4% 23.9% 35.9% 33.7% 33.1%
Source: FAOSTAT, The National Statistical Committee, 2012 FertilizerUseinWheatProduction
As the KAED surveys shows, only 49.9 percent of farmers covering 63.8 percent of the land
area use mineral and/or organic fertilizers in wheat production. Inorganic nitrogen fertilizers
are used 77.3 percent more often by southern farmers than northern farmers. The lower usage
of nutrients in the northern part of the country can be explained by a large area (50.4 ha/farm)
allocated for wheat, especially in Chuy Oblast, which accounts for about 44 percent of the
country’s total wheat land area. However, this type of farming is also one of the major causes
of soil depletion and low yields in the country.
Page 35
26
Table 10. Fertilizer Use by Farmers for Wheat Production in Kyrgyz Republic in 2011-2013
Average Land Area (ha)
Yield (kg/ha)
Seed Rate(kg)
Fertilizer Use Any Type of
Fertilizer Inorganic Nitrgen
Fertilizer Inorganic Phosphate
Fertilizer
% of Farmers
% of Land Area
% of Farmers
% of Land Area
% of Farmers
% of Land Area
Chuy 50.4 2,972 255 57.4% 66.3% 52.5% 58.7% 4.9% 8.1% Issyk-Kul 2.4 2,373 290 30.2% 37.4% 15.9% 21.4% 13.7% 16.6% Talas 2.1 3,126 274 52.3% 70.9% 16.8% 38.9% 49.5% 69.6% Naryn 1.65 2,147 260 11.2% 18.2% 0.0% 0.0% 6.9% 14.2% Northern Oblasts
11.9 2,921 270 33.7% 62.6% 18.5% 53.2% 16.2% 10.9%
Osh 1.64 2,028 239 86.6% 81.5% 79.2% 75.7% 4.7% 2.8% Jalalabat 0.89 3,227 253 76.8% 74.6% 69.6% 70.7% 1.4% 1.0% Batken 1.90 2,512 263 80.5% 89.3% 80.5% 89.3% 11.7% 14.9% Southern Oblasts
1.53 2,862 252 82.7% 83.1% 77.3% 79.4% 5.8% 6.5%
Total KR 8.5 2,890 263 49.9% 63.8% 37.9% 54.8% 12.8% 10.6% Source: KAED/IFDC Survey As the KAED surveys implies, given the yields in 2012, removed nutrients are not fully
replaced with nutrients from fertilizer. Less than 20 percent of removed potash is applied to
land using manure (Table 11).
Page 36
27
Table 11. Nutrient Removal and Application by Oblasts in Wheat Production in 2012 (kg/ha)
Oblasts Yielda (kg/ha)
N (kg/ha) P2O5 (kg/ha) K2O (kg/ha) Removalb Appliedc +/- Removalb Appliedc +/- Removalb Appliedc +/-
Chuy 1,609 43.8 22.6 -21.2
(-48.4%)16.4 15.1
-1.3 (-7.9%)
55.5 12.4 -43.1
(-77.7%)
Issyk-Kul 1,350 36.7 12.5 -24.2
(-65.9%)13.8 8.8
-5 (-36.2%)
46.6 8.2 -38.4
(-82.4%)
Talas 1,968 53.5 13.5 -40
(-74.8%)20.1 21.4
+1.3 (+6.5%)
67.9 0.0 -67.9
(-100%)
Naryn 1,714 46.6 7.7 -38.9
(-83.5%)17.5 13.3
-4.2 (-24.0%)
59.1 6.1 -53
(-89.7%)Northern Oblasts
1,557 42.4 38.3 -21.1
(-49.8%)15.9 14.9
-1 (-6.3%)
53.7 11.5 -42.2
(-78.6%)
Osh 2,079 56.5 57.9 +1.4
(+2.5%)21.2 3.7
-17.5 (-82.5%)
71.7 3.1 -68.6
(-95.7%)
Jalalabad 1,990 54.1 75.4 +21.3
(+39.4%)20.3 5.1
-15.2 (-74.9%)
68.7 6.9 -61.8
(-90.0%)
Batken 1,755 47.7 109.5 +61.8
(+129.6%)17.9 4.4
-13.5 (-75.4%)
60.5 2.1 -58.4
(-96.5%)Southern Oblasts
1,993 54.2 77.0 +22.8
(+42.1%)20.3 4.1
-16.2 (-79.8%)
68.8 3.3 -65.5
(-95.2%)
Total KR 1,670 45.4 40.6 -4.8
(-15.6%)17.0 14.2
-2.8 (-16.5%)
57.6 11.0 -46.6
(-80.9%)Source: a. NSCKR. a. 2013, Handbook of Agriculture. b. ICAR, KAED/IFDC Survey.
FertilizerUseinMaizeProduction
Maize has been the most profitable crop among cereals in the Kyrgyz Republic due to its
relatively high output prices and export possibilities. Also, new maize hybrids, especially
Pioneer Company seeds, are becoming popular through KAED/IFDC support to farmers. It is
apparent that, compared to wheat production, more farmers (61.4 percent) apply inorganic
fertilizer for maize. However, no type of fertilizer use in maize production was observed in
Talas Oblast, where only about 5 percent of the total land area is devoted to maize.
Page 37
28
Table 12. Fertilizer Use by Farmers for Maize Production in Kyrgyz Republic in 2011-2013
Average Land Area (ha)
Yield (kg/ha)
Seed Rate(kg)
Fertilizer Use Organic and/or
Inorganic Inorganic Nitrogen
Fertilizer Inorganic
Phosphate Fertilizer
% of Farmers
% of Land Area
% of Farmers
% of Land Area
% of Farmers
% of Land Area
Chuy 6.7 7,168 22 58.5% 79.7% 46.6% 75.4% 5.1% 51.5%Talas 0.3 2,134 20 0.0% 0.0% 0.0% 0.0% 0.0% 0.0%Northern Oblasts
3.0 6,873 21 24.3% 75.0% 19.4% 71.0% 2.1% 48.5%
Osh 0.58 6,526 29 94.7% 94.7% 83.7% 91.2% 3.3% 2.3%Jalalabat 0.71 4,680 22 87.3% 90.3% 82.9% 88.4% 0.6% 0.8%Batken 0.60 7,196 32 100.0% 100.0% 92.7% 94.7% 11.0% 22.1%Southern Oblasts
0.63 6,449 28 92.9% 93.7% 84.9% 90.6% 3.5% 4.7%
Total KR 1.5 6,603 25 68.3% 80.1% 61.4% 76.4% 3.0% 36.5%Source: KAED/IFDC Survey Deficiency in all types of nutrient use is apparent (Table 13). Even though prices for
phosphate fertilizers are higher in the south, due to smaller land area resources, southern
farmers use available areas more intensively than northern farmers do.
Table 13. Nutrient Removal and Application by Oblasts in Maize Production in 2012 (kg/ha)
Oblasts Yielda (kg/ha)
N (kg/ha) P2O5 (kg/ha) K2O (kg/ha) Removalb Appliedc +/- Removalb Appliedc +/- Removalb Appliedc +/-
Chuy 6,277 179.5 79.5 -100
(-55.7%)64.0 45.8
-18.2 (-28.4%)
180.1 13.5 -166.6
(-92.5%)
Talas 6,210 177.6 0.0 -177.6
(-100%) 63.3 0.0
-63.3 (-100%)
178.2 0.0 -178.2
(-100%)
Naryn 4,993 142.8 0.0 -142.8
(-100%) 50.9 0.0
-50.9 (-100%)
143.3 0.0 -143.3
(-100%) Northern Oblasts
6,262 179.1 74.8 -104.3
(-58.2%)63.9 43.1
-20.8 (-32.6%)
179.7 12.7 -167
(-92.9%)
Osh 6,516 186.4 138.8 47.6
(-25.5%)66.5 18.6
-47.9 (-72.0%)
187.0 26.1 -160.9
(-86.0%)
Jalalabad 5,672 162.2 163.8 +1.6
(+1.0%)57.9 2.9
-55 (-95.0%)
162.8 3.2 -159.6
(-98.0%)
Batken 5,865 167.7 147.1 -20.6
(-12.3%)59.8 25.6
-34.2 (-57.2%)
168.3 17.5 -150.8
(-89.6%)Southern Oblasts
6,023 172.3 150.1 -22.2
(-12.9%)61.4 13.4
-48 (-78.2%)
172.9 15.6 -157.3
(-91.0%)
Total KR 6,097 174.4 95.5 -78.9
(-45.2%)62.2 35.0
-27.2 (-43.7%)
175.0 13.5 -161.5
(-92.3%)Source: a. NSCKR. a. 2013, Handbook of Agriculture. b. ICAR, KAED/IFDC Survey.
Page 38
29
FertilizerUseinPotatoProduction
Potato production incurs higher costs than cereals and is also labor intensive with a high
degree of dependence on labor during planting and harvesting seasons. Therefore, small
farms with less than 1 ha account for most of the potato-growing area in the country. More
than 82 percent of potato farmers use organic and/or inorganic fertilizers. A small share of
these farms (32 percent) use inorganic fertilizer, preferring organic fertilizers when they are
available at little or no cost.
Table 14. Fertilizer Use by Farmers for Potato Production in Kyrgyz Republic in 2011-2013
Average Land Area (ha)
Yield (kg/ha)
Seed Rate(kg)
Fertilizer Use Organic and/or
Inorganic Inorganic Nitrogen
Fertilizer Inorganic
Phosphate Fertilizer
% of Farmers
% of Land Area
% of Farmers
% of Land Area
% of Farmers
% of Land Area
Chuy 0.9 10,776 2,944 68.8% 75.9% 25.0% 51.7% 37.5% 55.2%Issyk-Kul 1.3 31,169 3,003 83.6% 91.1% 25.2% 30.9% 33.3% 47.7%Talas 0.5 18,140 2,987 65.5% 78.5% 1.7% 3.5% 0.0% 0.0%Naryn 0.72 17,834 2,865 83.7% 88.9% 5.1% 17.3% 2.3% 5.5%Northern Oblasts
0.9 23,890 2,950 79.0% 88.0% 11.2% 22.8% 12.6% 26.2%
Osh 0.24 13,446 2,818 90.5% 92.8% 62.6% 72.2% 12.6% 11.8%Jalalabat 0.31 11,506 2,765 75.0% 80.3% 52.3% 64.2% 1.1% 0.6%Batken 0.31 15,026 2,891 98.3% 95.6% 82.8% 91.0% 27.6% 44.7%Southern Oblasts
0.27 20,730 2,824 87.8% 89.7% 63.4% 73.6% 12.2% 14.9%
Total all country
0.6 22,037 2,890 82.5% 88.3% 32.0% 31.6% 12.4% 24.2%
Source: KAED/IFDC Survey.
Page 39
30
Table 15. Nutrient Removal and Application by Oblasts in Potato Production in 2012 (mt)
Oblasts Yielda (kg/ha)
N (kg/ha) P2O5 (kg/ha) K2O (kg/ha) Removalb Appliedc +/- Removalb Appliedc +/- Removalb Appliedc +/-
Chuy 16,868 74.2 47.8 -26.4
(-35.6%) 33.7 45.3 +11.6
(+34.4%) 131.6 33.4 -98.2
(-74.6%)
Issyk-Kul 16,818 74.0 87.9 +13.9
(+18.8%) 33.6 82.7 +49.1
(+146.1%) 131.2 55.9 -75.3
(-57.4%)
Talas 17,195 75.7 125.8 +50.1
(+66.2%) 34.4 92.9 +58.5
(+170.1%) 134.1 136.3 +2.2
(+1.6%)
Naryn 14,018 61.7 132.6 +70.9
(+114.9%) 28.0 97.1 +69.1
(+246.8%) 109.3 139.3 +30
(+27.4%)Northern Oblasts
16,648 73.3 107.8 +34.5 (+47.1%) 33.3 88.0 +54.7
(+164.3%) 129.9 96.3 -33.6 (-25.9%)
Osh 15,232 67.0 175.1 +108.1
(+161.3%) 30.5 74.0 +43.5
(+142.6%) 118.8 80.8 -38
(-32.0%)
Jalalabat 13,976 61.5 135.0 +73.5
(+119.5%) 28.0 11.3 -16.7
(-59.6%) 109.0 15.9 -93.1
(-85.4%)
Batken 13,755 60.5 248.0 +187.5
(+309.9%) 27.5 150.2 +122.7
(+446.2%) 107.3 111.6 +4.3
(+4.0%)Southern Oblasts
14,604 64.3 177.6 +113.3 (+176.2%) 29.2 70.5 +41.3
(+141.4%) 113.9 67.7 -46.2 (-40.6%)
Total KR 16,103 70.9 119.9 +49 (+69.1%) 32.2 85.0 +52.8
(+164.0%) 125.6 91.3 -34.3 (-27.3%)
FertilizerConsumptionbySecondaryNutrients
Table 16. Fertilizer Consumption by Micronutrients
Wheat Maize Potato Ca Mg Ca Mg Ca Mg
Chuy 24.7 6.0 22.3 5.4 58.0 14.0 Issyk-Kul 28.7 6.9 0.0 0.0 81.0 19.5 Talas 0.0 0.0 0.0 0.0 228.8 55.2 Naryn 44.0 10.6 0.0 0.0 206.60 49.90 Northern Oblasts 24.4 5.9 22.3 5.4 143.6 34.7 Osh 5.1 1.2 36.3 8.8 114.80 27.70 Jalalabat 12.3 3.0 4.7 1.1 26.10 6.30 Batken 3.1 0.8 23.1 5.6 154.00 37.20 Southern Oblasts 6.8 1.6 21.4 5.2 98.30 23.70 Total KR 22.7 5.5 22.2 5.4 136.4 32.9 Source: KAED/IFDC Survey
6.FertilizerUsebyFarmSizeClassification
Three types of farms managed by agricultural producers or farmers and defined by their sizes
are evaluated in this study: households and smallholders, average-scale farms, and large-scale
farms.
Page 40
31
The types of farms that are typical of each scale follow this scale:
Households and smallholders manage up to 2 ha of land.
Average-scale farms manage 2 ha to 10 ha of land.
Large-scale farms manage more than 10 ha of land.
FertilizerUsebyFarmSizeforWheatProduction
As Table 17 presents, more than 70 percent of wheat-producing farmers were households and
smallholders. The portion of farms that use organic and/or inorganic fertilizer ranges from
45.4 percent (small-scale farmers) to 63.5 percent (large-scale farmers). Consequently, large-
scale farmers received 17 percent higher yields than small-scale farmers (2,999 kg/ha
compared to 2,555 kg/ha).
Average-scale farmers achieved almost the same yields as small-scale farmers using less
fertilizer. This can be explained by their relatively more efficient use of fertilizers, improved
seed quality, access to modern machinery and cultivation management. Factors that reduce
yields of small-scale farmers include inappropriate timing of application, seed rates and
cultural farming practices. Also, lack of access to modern machinery should be noted here,
since the majority of small-scale farmers are dependent on this type of machinery service.
Harvest losses due to old machinery and delayed harvests are estimated to range from 15-
25 percent above normal losses (Guadagni, M., and Fileccia, T. 2012).
Table 17. Fertilizer Use in Wheat Production by Farm Classification, 2011-2013
Farm Classification
Share of Land Area
(%)
Seed Rate
(kg/ha)
Fertilizer Use
% of Farms Applying
Any Type of Fertilizer
% of Farms Using
Organic Fertilizer
% of Farms Using
Inorganic Nitrogen Fertilizer
% of Farms Using
Inorganic Phosphate Fertilizer
% of Farms Using
Inorganic N&P
Fertilizer Household and smallholders
71.3% 266 45.4% 11.5% 34.9% 9.7% 4.1%
Average-scale farms 22.9% 261 60.5% 5.4% 42.9% 22.9% 10.2% Large-scale farms 5.8% 243 63.5% 5.8% 55.8% 9.6% 1.9% Source: KAED/IFDC Survey
Page 41
32
Table 18. Nutrient Use in Wheat Production by Farm Classification in 2011-2013 (kg/ha)
Farm Classification Fertilizer Use Yield
(kg/ha) N P2O5 K2O Ca Mg Households and Smallholders
36.7 11.6 8.9 11.7 2.8 2,555
Average-Scale Farms 27.6 7.9 2.8 3.6 0.9 2,557 Large-Scale Farms 43.4 15.7 12.7 16.7 4.0 2,990 FertilizerUsebyFarmClassificationforMaizeProduction
About 90 percent of maize producers in the country have land area of 2 ha or less (Table 19).
These farmers, on average, apply more nutrients compared to large-scale farmers. However,
large-scale farmers receive higher yields (51 percent higher) from their relatively high-level
use of phosphate fertilizer (54.5 percent of farmers), and use of mainly hybrid seeds, as well
as other agricultural practices such as proper application of fertilizer and crop rotation.
Table 19. Fertilizer Use in Maize Production by Farm Classification, 2011-2013
Farm Classification
Share of Land Area
(%)
Seed Rate
(kg/ha)
Fertilizer Use
% of Farms Applying
Any Type of Fertilizer
% of Farms Using
Organic Fertilizer
% of Farms Using
Inorganic Nitrogen Fertilizer
% of Farms Using
Inorganic Phosphate Fertilizer
% of Farms Using
Inorganic N&P
Fertilizer Household and smallholders
90.5% 25 67.5% 24.5% 61.0% 2.5% 2.5%
Average-scale farms 8.1% 23 75.0% 28.1% 62.5% 0.0% 0.0% Large-scale farms 1.4% 19 81.8% 0.0% 81.8% 54.5% 54.5%Source: KAED/IFDC Survey
Table 20. Nutrient Use in Maize Production by Farm Classification in 2011-2013 (kg/ha)
Farm Classification Fertilizer Use Yield
(kg/ha) N P2O5 K2O Ca Mg Households and smallholders 116.8 14.9 18.4 24.3 5.9 5,207
Average-Scale Farms 70.0 20.0 29.4 38.7 9.3 6,330 Large-Scale Farms 94.1 59.8 0.0 0.0 0.0 7,865
Source: KAED/IFDC Survey
FertilizerUsebyFarmClassificationforPotatoProduction
Small-scale farmers lack the land, capital and labor to cultivate potatoes using best practices,
but the large number of small-scale farmers produce a large total volume using small amounts
Page 42
33
of fertilizer, water and labor. However, because most small farmers use low-quality seed,
either saved seed or cheap C7-C10 generation seed from informal markets, their yields per
hectare are low and not responsive to balanced and adequate fertilizer application. Even
though the proportion of area for large-scale farmers is less than 1 percent, they reap double
yields compared to small-scale farmers.
Table 21. Fertilizer Use in Potato Production by Farm Classification, 2011-2013
Farm Classification
Share of Land Area
(%)
Seed Rate
(kg/ha)
Fertilizer Use
% of Farms Applying
Any Type of Fertilizer
% of Farms Using
Organic Fertilizer
% of Farms Using
Inorganic Nitrogen Fertilizer
% of Farms Using
Inorganic Phosphate Fertilizer
% of Farms Using
Inorganic N&P
Fertilizer Household and smallholders
97.2% 2,895 82.2% 64.9% 31.1% 11.7% 5.4%
Average-scale farms 2.4% 2,715 90.0% 50.0% 70.0% 35.0% 35.0% Large-scale farms 0.5% 2,875 100.0% 75.0% 25.0% 50.0% 0.0% Source: KAED/IFDC Survey
Table 22. Nutrient Use in Potato Production by Farm Classification in 2011-2013 (kg/ha)
Farm Classification Fertilizer Use Yield
(kg/ha) N P2O5 K2O Ca Mg Households and smallholders 132.3 86.6 105.4 138.9 33.5 18,437
Average-Scale Farms 83.1 67.1 34.3 45.2 10.9 22,078 Large-Scale Farms 66.3 98.8 55.0 72.5 17.5 38,764 Source: KAED/IFDC Survey
7.Value‐CostRatioofFertilizerUseonCropYields
Fertilizer application in Kyrgyzstan results in low yields because of inefficient and
imbalanced use. Traditionally, local farmers only use nitrogen fertilizers, mainly ammonium
nitrate. Some are unaware of the potential benefits of phosphate and potash fertilizers for
crops and believe that using any type is enough, reflecting the misconception that one type of
fertilizer can be substituted for another. Moreover, it is believed that phosphate and potash
fertilizers are unnecessary since local soils are rich in these nutrients, especially potash. Even
though some farmers understand fertilizer nutrient roles, this awareness does not necessarily
lead to efficient usage because other factors, such as financial constraints, may limit their
Page 43
34
access to required fertilizer. Additional limiting factors include low yields caused by
deficiencies in other nutrients, low fertilizer use efficiency and low profits for farmers, even
for those who apply large amounts of nitrogen. Therefore, increasing farmers’ knowledge of
the importance of balanced fertilization and quality seed for increasing crop yields must be a
priority.
Another issue that must be explored is fertilizer use in terms of value-cost ratio (VCR) for
selected crops. Value-cost ratio is calculated as VCR = (ΔY*P)/C where ΔY is the
incremental yield gain resulting from fertilizer use, P is the price of output per kg and C is the
cost of added fertilizer. A minimum VCR of 2 implies profitability from fertilizer use. A
greater VCR ratio means higher profit from incremental costs.
VCRs estimates are based on trial plots where winter wheat, maize, potato varieties and
hybrids were tested in 2007-2009 in order to investigate the benefits of seed varieties, hybrids
and balanced fertilizer application compared to traditional use of inputs data. It should be
noted that during these analyses, input and output fertilizer prices were adjusted to 2013
levels because of the higher output prices in 2012 as a result of drought. VCRs vary from
year to year based on input and output prices.
Wheat. On-farm trials of wheat varieties were organized in 2008 by IFDC’s KAED project
in two farms in Sokuluk Rayon, Chuy Oblast, and Aksuy Rayon, Issyk-Kul Oblast. In 56
plots of 0.2 ha each, 13 winter wheat varieties were grown and tested with two levels of
fertilizer application using certified seeds and one undefined variety of non-certified (poor-
quality seeds) seeds that farmers traditionally purchase from a bazaar because of the low
price. These varieties included the following:
Zhamin, Almira, Starshina, Petr, Suleiman, Intensivnaya, Araket, Kasiet,
Krasnodar, Eritrosppermum 760, Nota, Moskvich, Tanya and undefined non-
certified (improper seeds)
The rates of fertilizer application were determined by soil tests and were the same for all
demonstrations:
Traditional practice of 350 kg AN/ha (34 percent N)
Improved practice:
o 264 kg AN/ha (34 percent N).
o 300 kg Ammophos (11 percent N, 46 percent P2O5).
Page 44
35
o 150 kg Potassium Chloride (K2O).
The objective of these trials was to see yield and value-cost ratio for four types of
possibilities in farming activities:
1. Undefined seed quality under traditional fertilizer treatment using only nitrogen fertilizer.
2. Undefined seed quality under improved fertilizer practice (NPK).
3. Good quality varieties under traditional fertilizer treatment.
4. Good quality varieties under improved fertilizer practice (NPK).
The yields of the 13 recommended varieties ranged from 2,600 kg/ha to 4,800 kg/ha under
the traditional practice of nitrogen application; under balanced fertilization, these varieties
ranged from 3,660 kg/ha to 6,230 kg/ha. The average results shown in Table 23 reveal that
balanced fertilizer application benefited certified varieties, resulting in a yield increase from
3.932 mt/ha to 5.514 mt/ha. Taking into account the additional cost for fertilizer
($381.32/ha), the resulting profit was $162.94. For undefined varieties and seed qualities,
balanced NPK reduced profitability due to a low increase in yield of only 670 kg/ha,
compared to 1,582 kg/ha using KAED-recommended varieties. Indeed, as the data in Table
25 shows, 1 kg of additional NPK resulted in a yield increase of 6.8 kg for quality varieties;
only the undefined variety was less responsive to fertilizer, showing a yield increase of only
2.8 kg. In terms of value-cost ratios, each dollar spent on balanced nutrients gives the output
of $1.84 for quality varieties and $0.77 for undefined seed quality. These are lower than the
acceptable VCR of 2.
Comparing quality varieties under recommended fertilizer practice with undefined seeds
under traditional practice, response to NPK and quality seeds is about 10.1 kg grain per 1 kg
of NPK, or a 2.76 VCR. All this analysis implies that at various levels of seed and fertilizer
treatments, the potential yield increase is about 77.3 percent. Improved practice of fertilizer
use with traditional undefined varieties accounts for only a 21.3-percent increase. It should be
noted that the potential increase of 26.4 percent from using proper varieties is not cumulative
but independent from best improved fertilizer application practices. Yields are more
responsive to seed characteristics than fertilizer if compared independently. However, much
more benefit can be achieved with a combination of quality seed and balanced fertilizer
application.
Page 45
36
Maize. In 2009, KAED used an undefined variety of maize and the following five maize
hybrids for trials:
Tulpar – 539, Marko – 419, Arman – 689, Altay – 329 and Skif – 619
The rates of fertilizer application were determined by soil tests and were the same for all
demonstrations:
Traditional practice of 300 kg AN/ha (34 percent N).
Improved practice:
o 300 kg AN/ha (34 percent N).
o 500 kg Diammaphoska (11 percent N, 26 percent P2O5, K2O 26 percent).
These trials helped to estimate four types of operations related to seed and fertilizer
applications. The results in Table 23 and Table 25 show results similar to wheat trials: the
undefined variety does not have a large response to the use of NPK and gives only 2.6 kg of
yield per kg of NPK nutrients. A significant increase is observed when both hybrid seeds and
NPK fertilizer application are used, compared to traditional practices of undefined seeds and
only nitrogen fertilizer use, resulting in a 14.9-kg increase per kg of NPK, or in value-cost
ratio terms, 4.99. Maize yields can be increased by 71.1 percent over traditional practice if
best operations in seed and fertilizer aspects are used.
Potato. KAED/IFDC supported two farms in Sokuluk Rayon, Chuy Oblast, and Aksuy
Rayon, Issyk-Kul Oblast, in variety trials of potato in 2007 where one local variety and the
following nine varieties were tested:
Agave, Delicate, Molly, Karlena, Fazan, Fontane, Rokko, Marlen and Impala
The rates of fertilizer application were determined by soil tests and were the same for all
demonstrations:
Traditional practice of 350 kg AN/ha (34 percent N).
Improved practice:
o 250 kg AN/ha (34 percent N).
o 500 kg Diammaphoska (11 percent N, 26 percent P2O5, K2O 26 percent).
The yields of recommended potato varieties, excluding undefined seeds, ranged from
19.5 mt/ha to 38.5 mt/ha. Under the traditional practice of nitrogen application and
Page 46
37
unbalanced fertilization, these varieties produced yields from 15.8 mt/ha to 33.2 mt/ha. Out
of nine varieties, only four (Agave, Karlena, Rokko and Impala) resulted in high yields of
31 mt/ha or higher. The results of these four varieties were used for the analysis. The
resulting VCRs are higher compared to cereals, and the return is $4.99 per dollar spent for
NPK nutrient. Yield of potato can be increased by up to 78 percent using best practices.
Page 47
38
Table 23. Response and Benefits for Recommended Levels of Balanced Fertilizer Application
Crop
Output Price
Fields A Fields B
Yield Increase
Cost of Additional
Fertilizer Use Benefits Fertilizer Used Yields Fertilizer Used Yields ($/mt) (kg) (U.S. $) (kg) (U.S. $) (kg) (U.S. $) (kg) (U.S. $) (kg) (U.S. $) (U.S. $) (U.S. $)
Wheat $228 N120 $166.56 3,932 $896 N124P138K90 $364.62 5,514 $1,257 1,582 $361 $198.06 $162.94 Wheat (improper seeds) $228 N120 $166.56 3,110 $709 N124P138K90 $364.62 3,780 $862 670 $153 $198.06 -$45.06 Maize $217 N103 $142.77 7,998 $1,736 N153P130K130 $453.13 11,123 $2,414 3,125 $678 $310.36 $367.64 Maize (improper seeds) $217 N103 $142.77 6,500 $1,411 N153P130K130 $453.13 7,300 $1,584 800 $173 $310.36 -$137.36 Potato $166 N120 $166.56 24,225 $4,021 N136P130K130 $429.34 32,138 $5,335 7,913 $1,314 $262.78 $1,051.22 Potato (improper seeds) $166 N120 $166.56 18,050 $2,996 N136P130K130 $429.34 21,000 $3,486 2,950 $490 $262.78 $227.22
Table 24. Response and Benefits for Recommended Quality Seeds and Levels of Balanced Fertilizer Application
Crop
Output Price
Fields A Fields B
Yield Increase
Cost of Additional
Fertilizer Use Benefits Fertilizer Used Yields Fertilizer Used Yields ($/mt) (kg) (U.S. $) (kg) (U.S. $) (kg) (U.S. $) ($/mt) (kg) (kg) (U.S. $) (U.S. $) (U.S. $)
Wheat $228 N120 $166.56 3,110 $709 N124P138K90 364.62 5,514 1,257 2,404 1,257 1,257 1,257 Maize $217 N103 $142.77 6,500 $1,411 N153P95K95 453.13 11,123 2,414 4,623 2,414 2,414 2,414 Potato $166 N120 $167 $18,050 $2,996 N136P130K130 429.34 32,138 5,335 14,088 5,335 5,335 5,335
Page 48
39
Table 25. Response and Value-Cost Ratios for Recommended Levels of Balanced Fertilizer Application
Crop
Fields A Fields B Yield Increase per kg of NPK
(kg)
Cost of Added
Fertilizers (U.S. $/kg nutrient) VCR
Fertilizer Used (kg)
Yield (kg)
Fertilizer Used (kg)
Yield (kg) (kg) (U.S. $)
Wheat N120 3,932 N124P138K90 5,514 6.8 $1.55 $0.85 1.82 Wheat (improper seeds) N120 3,110 N124P138K90 3,780 2.9 $0.66 $0.85 0.77 Maize N103 7,998 N153 P130K130 11,123 10.1 $2.19 $1.00 2.19Maize (improper seeds) N103 6,500 N153 P130K130 7,300 2.6 $0.56 $1.00 0.56 Potato N120 24,225 N136P130K130 32,138 28.7 $4.75 $0.95 4.99 Potato (improper seeds) N120 18,050 N136P130K130 21,000 10.7 $1.77 $0.95 1.86
Table 26. Response and Value-Cost Ratios for Recommended Quality Seeds and Levels of Balanced Fertilizer Application
Crop
Fields A Fields B Yield Increase per kg of NPK
(kg)
Cost of Added
Fertilizers (U.S. $/kg nutrient) VCR
Fertilizer Used (kg)
Yield (kg)
Fertilizer Used (kg)
Yield (kg) (kg) (U.S. $)
Wheat N120 3,110 N124P138K90 5,514 10.4 $2.36 $0.85 2.76 Maize N103 6,500 N153 P130K130 11,123 14.9 $3.39 $1.00 3.39 Potato N120 18,050 N136P130K130 32,138 45.4 $10.34 $0.95 10.86
LookingBack:VCRThenandNow
Table 27. VCR Comparisons for Recommended Quality Seeds and Levels of Balanced Fertilizer Application in 2002 and 2013
Crop
Fertilizer Added (kg)
Yield Increase per kg of NPK (kg) Cost of Added Fertilizers
(U.S. $/kg nutrient) Value-Cost Ratio kg
U.S. $ 2002 2013 2002 2013 2002 2013
Wheat N4P138K90 10.4 $1.03 $2.36 $0.22 $0.85 4.75 2.76 Maize N53 P130K130 14.9 $1.49 $3.39 $0.21 $1.00 7.08 3.99 Potato N16P130K130 45.4 $4.53 $10.34 $0.19 $0.95 23.36 10.86
The fall in VCR values is a result of a rise in output prices of around 130 percent compared to fertilizer
price increases of 300-400 percent.
Page 49
40
Figure 15. VCR for Recommended Levels of Balanced Fertilizer Application in 2002 and 2013
8.YieldGapLevelsandLimitingFactorsinFoodSecurity
There are two ways of interpreting yield gaps. One interpretation defines optimum yield in an
environment where all factors are non-limiting. However, farmers cannot achieve these optimum
yields considering the existing environment, cost-benefit factors, marginal return to additional inputs
and other efforts, access to proper machinery, and other socio-economic factors.
It is almost impossible to separate the effects of fertilizer and seeds in improving crop yields. In order
to produce high yields, crops require a continuous effort to eliminate constraints such as improper
variety, deficiency in nutrients, agricultural climate, improper fertilizer placement, diseases, pests,
water and other factors. As the survey results show, there is a large gap between economically
achievable yields and average yields obtained in the country. While the trials showed the impact of
only two factors, improved varieties and additional fertilizer, the survey showed the real farm-level
gaps in the country as it was divided into the following levels:
1.34
3.13
1.09
4.37 4.18
11.14
0.77
1.82
0.56
2.19
1.86
4.99
-2.00
0.00
2.00
4.00
6.00
8.00
10.00
12.00
Wheat(improper
seeds)
Wheat Maize(improper
seeds)
Maize Potato(improper
seeds)
Potato
2002 2013
Page 50
41
Yield Gap Level I
This gap exists mainly due to socio-economic factors such as knowledge, the small scale of
farming, access to modern machinery, small land plots and labor shortage. Farmers in this level
achieve yields at minimum costs, do not use any type of fertilizer and do not follow basic soil
management and crop cultivation techniques. Some of these farmers face financial constraints
in running best management practices, and others have alternate sources of income that
overcome low incomes from farming.
Yield Gap Level II
Farmers in this level have access to required machinery and tools for farming. However, these
farmers follow traditional cultural practices using suboptimal inputs and growing the same crop
every year. They use only limited amounts of manure as fertilizer and use local varieties or
their own multiplied seeds. These farmers are unaware of best cultivation practices, basic
agricultural soil management and the negative factors of monoculture cropping systems. Many
consider the types of farming under Gap Levels I and II as a result of land distribution among
all people living in rural areas, regardless of experience in farming.
Yield Gap Level III
The majority of commercial farmers in the country have gained some knowledge in farming
management over the last 20 years, but they do not use, or are not able to use, recommended
varieties and fertilizer nutrients for the cultivation of crops due to financial constraints. They
use traditional, local varieties or non-certified seeds and only use nitrogen fertilizer and
manure. Farmers in this level have limited access to agricultural inputs, such as high-yielding
varieties of seed and complex fertilizer.
Yield Gap Level IV
Farmers in this level use seeds of high quality and of different varieties but are still unaware of
or reluctant to apply required nutrients to the soil to achieve high yields. They apply limited
quantities of livestock manure and only use inorganic nitrogen fertilizer for the cultivation of
crops. These farmers have limited access to agricultural inputs, such as high-yielding varieties
of seed and complex fertilizer. Also, benefit-cost factors influence this gap, considering given
regions and output prices.
Best-Practice Farmers
A small proportion of farmers achieve high optimum yields using recommended high-yielding
varieties and balanced fertilizer nutrients. These are relatively large-scale farmers who are
involved in growing cereals and some small-scale farmers growing potato.
Page 51
42
Attainable Yields
These are yields that can be obtained under trial conditions in Kyrgyzstan with the available
improved varieties that have been tested by the State Commission for the Evaluation of Plant
Variety Registration (SCEPVR) and KAED/IFDC in several regions in the country.
It should be noted that the share of farmers using complete fertilizer along with undefined seeds, or
those that do not follow soil management practices, is insignificant and therefore not assigned to any
level.
YieldGapLevelsinWheatProduction
As the results of trials by KAED showed,
the improved fertilizer and variety practices
on trial fields resulted in wheat yields of
5.5 mt/ha in trials, compared to the national
average yield of 2.4 mt/ha.; maize yields of
11.1 mt/ha, compared to a national average
of 5.9 mt/ha in country level; and a potato
yield of 32.1 mt/ha, compared to 16 mt/ha
nationally. As shown in Figure 16,
inefficient use of fertilizers and the use of
inappropriate varieties and seed reduce
wheat yield by 43.6 percent. A variety of
factors contribute to Yield Gap II in spite
of farmers’ efforts to achieve higher output using best nutrient management. Also, use of best varieties
without proper nutrient management results in a 28.7-percent gap from potential achievable yields.
While these trials illustrate only the potential capacities of the given varieties using required inputs and
benefits from added nutrients, Table 28 represents the actual existing yield gap levels in the country.
About 5.9 percent of farmers, from Gap Level I, are mainly households and small farmers with an
average area of 1 ha. They produce wheat as the single crop at minimum costs, do not use any type of
fertilizer or quality seeds, and have limited access to agricultural machinery services. Their wheat
yields on average are 1.7 mt/ha, that is, 73 percent lower than the attainable yield in the country. About
1.5 percent of agricultural land is used for wheat production by this type of farmer.
Yield Gap 1 (43.6%)
P2O5 and K2O deficiencies
Improper variety/ poor seed quality
Yield Gap 2 (31.4%)
Optimal NPK nutrients
Improper variety/ poor seed quality
Yield Gap 3 (28.7%)
Proper variety/ quality seed
P2O5 and K2O deficiencies
Yield potential given proper varieties and
efficient nutrients
Figure 16. Wheat Yield Gap at Fertilizer and Seed Levels on KAED/IFDC Trials in 2008
Page 52
43
Table 28. Yield Gap Levels in Wheat Production on Farm Scales
GAP Level
I
GAP Level
II
GAP Level
III
GAP Level
IV
Best- Practice Farmers
Attainable Yield
Yield, kg/ha 1,676 2,227 3,071 4,414 5,720 6,214 Yield gap as percent of achievable
(73.0%) (64.2%) (50.6%) (29.0%) (7.9%)
% of farmers 5.9% 7.3% 41.4% 35.2% 6.0% Average size of land, ha
0.98 1.10 3.1 24.7 12.4
% of land, ha 1.5% 1.7% 33.4% 52.7% 7.1% Source: KAED/IFDC Survey.
Farmers who use suboptimal inputs and mainly manure as fertilizer but still grow poor-quality,
unimproved wheat varieties and fail to use crop rotations account for 7.3 percent of farmers and
achieve yields 64.2 percent less than attainable. These are also households and small farmers with an
average land area of 1.1 ha. Approximately 55 percent of farmers use non-certified seeds, and the
majority of them fall under Yield Gap Level III. They follow relatively good agricultural soil
management practices, especially using crop rotation as a way to reduce some production expenses
and to manage sustainable farming. However, these farmers have scarce financial resources for using
required inputs and risk averse attitudes to receiving higher net incomes from additional expenditures
by improving agro-inputs.
About 35.2 percent of farmers with an average land area of 24.7 ha, covering more than half of the
total wheat area and located mainly in northern oblasts, use quality seeds to produce wheat but do not
follow nutrient requirements, thus missing an additional 29-percent increase in yields. The majority of
these farmers are risk-averse due to droughts in 2010 and 2012 when optimal inputs did not give
expected yields and many wheat-growing farmers, especially advanced ones, had to face losses. Rather
than intensify production, they prefer to use extensive low-input management for wheat production.
Best-practice farms in wheat production account for about 7.1 percent of wheat land area and achieve
average yields of 5,720 mt/ha, which is only 7.9 percent less than attainable yields in trials.
Page 53
44
Figure 17. Yield Gap Levels in Wheat Production by Category
Gap III
3,071 kg/ha (50.6%)
Imbalanced fertilizer application
Improper variety and seeds
Gap II
2,227 kg/ha (64.2%)
Poor cultivation practices
Imbalanced fertilizer application
Improper variety and seeds
Limited access to machinery
Yield of “Best
Practice” Farmers
5,720 kg/ha (7.9%)
Gap IV
4,414 kg/ha (29.0%)
Imbalanced fertilizer application
Attainable Yield
6,179 kg/ha
Gap I
1,676 kg/ha (73.0%)
Poor cultivation and land use practices
No organic/inorganic fertilizer application
Improper variety and seeds
Limited access to machinery
Page 54
45
YieldGapLevelsinMaizeProduction
As with wheat production, inefficient use of
fertilizer and inappropriate varieties and
seed reduce maize yield by 41.6 percent in
trials supported by KAED/IFDC. Using
best nutrient management for undefined
non-certified or non-hybrid maize accounts
for 34.4 percent of yield gaps. As for only
nutrient deficiencies, yield gaps of
28.1 percent resulted in trials.
Table 29 represents country-level yield
gaps in maize production. About 16 percent
of farmers, mainly households and
smallholders with an average area of less
than 0.7 ha, account for 10.5 percent of
maize land area and are in Gap Levels I and
II. About 66.1 percent of farmers using undefined non-hybrid maize seeds with limited fertilizer,
mainly organic and/or nitrogen fertilizer, achieve yields that are 47.7 percent lower than attainable.
These gaps exist due to lack of knowledge and scarce financial resources to buy required inputs.
Table 29. Yield Gap Levels in Maize Production on Farm Scales
GAP Level
I
GAP Level
II
GAP Level
III
GAP Level
IV
Best- Practice Farmers
Attainable Yield
Yield, kg/ha 3,356 4,500 5,819 6,657 9,254 11,123 Yield gap as percent of achievable
(69.8%) (59.5%) (47.7%) (40.2%) (16.8%)
% of farmers 2.4% 13.7% 66.1% 9.8% 1.9% Average size of land, ha
0.63 0.66 1.0 2.1 62.0
% of land, ha 1.5% 9.0% 34.6% 36.2% 12.2% Source: KAED/IFDC Survey.
Hybrid maize seeds are available from Pioneer Company, maize seed-producing companies from
Kazakhstan and China, and local Ala-too hybrids. The costs of hybrid seeds are considerably higher
than local non-certified varieties. Therefore, the majority of farmers are unaware of or choose not to
make the investment in hybrid seed. Farmers using hybrid seed but applying insufficient or unbalanced
Yield Gap 1 (41.6%)
P2O5 and K2O deficiencies
Improper variety/ poor seed quality
Yield Gap 2 (34.4%)
Optimal NPK nutrients
Improper variety/ poor seed quality
Yield Gap 3 (28.1%)
Proper variety/ quality seed
P2O5 and K2O deficiencies
Yield potential given proper varieties and
efficient nutrients
Figure 18. Maize Yield Gap at Fertilizer and Seed Levels on KAED/IFDC Trials in 2008
Page 55
46
fertilizer have a 40.2-percent yield gap from attainable yield because hybrid maize is responsive to
balanced fertilizer use. A little less than 2 percent of farmers with larger maize cultivation areas
(62 ha) use all required inputs to obtain optimal yields and, on average, achieve 9,254 mt/ha.
Page 56
47
Figure 19. Yield Gap Levels in Maize Production by Category
Gap III
5,819 kg/ha (47.7%)
Imbalanced fertilizer application
Improper variety and seeds
Gap II
4,500 kg/ha (59.5%)
Poor cultivation practices
Imbalanced fertilizer application
Improper variety and seeds
Limited access to machinery
Yield of “Best Practice”
Farmers
9,254 kg/ha (16.8%)
Gap IV
6,657 kg/ha (40.2%)
Imbalanced fertilizer application
Attainable Yield
11,123 kg/ha
Gap I
3,356 kg/ha (69.8%)
Poor cultivation and land use practices
No organic/inorganic fertilizer application
Improper variety and seeds
Limited access to machinery
Page 57
48
KAED trials resulted in a 43.8-percent
yield gap when inappropriate variety
seeds and only nitrogen fertilizer were
used in potato production (Figure 20).
Using best nutrient management for non-
certified undefined seeds accounts for a
34.7-percent yield gap. As for only
nutrient deficiencies, a 24.6-percent yield
gap resulted.
Table 30 represents yield gaps by
category. The majority of potato growers
are households and smallholders, and only
1.3 percent of them use complete nutrients with the
proper seeds.
More than 90 percent of potato farmers use non-certified or older generation potato seeds (C4 and
older) due to existing supply and demand effects. Good quality potato seeds cost more than $1,500/ha,
about 10 times higher than those for wheat and maize seed costs per hectare. The majority of
smallholders and households plant their own seed or buy cheap seed because they are either unaware
of the potential of quality seeds or because of they cannot afford them. These factors create limitations
on quality seed use which leads to low yields nationally. Two seed farms, a potato-seed-producing
cooperative in the south and the cooperative “Zarya” in the north, annually import no more than
100 mt of elite potato seeds for further multiplication. Even assuming all elite seeds are multiplied to
the C4 generation with standard seed multiplication ratio of 1:4, the required seeds cover only about
8,500 ha, less than 11 percent of the total potato area in the country. Certainly, many seed-producing
farmers sell C2 generation for farmers to produce outputs for consumption markets.
Yield Gap 1
(43.8%)
P2O5 and K2O deficiencies
Improper variety/ poor seed quality
Yield Gap 2 (34.7%)
Optimal NPK nutrients
Improper variety/ poor seed quality
Yield Gap 3 (24.6%)
Proper variety/ quality seed
P2O5 and K2O deficiencies
Yield potential given proper varieties and
efficient nutrients
Figure 20. Yield Gap Levels in Potato Production
Page 58
49
Table 30. Yield Gap Levels in Potato Production by Category
GAP Level
I
GAP Level
II
GAP Level
III
GAP Level
IV
Best- Practice Farmers
Attainable Yield
Yield, kg/ha 10,569 14,948 18,608 22,930 36,807 41,970 Yield gap as percent of achievable
(74.8%) (64.4%) (55.7%) (45.4%) (12.3%)
% of farmers 10.9% 9.6% 65.1% 7.4% 1.3% Average size of land, ha 0.34 0.85 0.5 0.4 1.1 % of land, ha 7.8% 17.3% 65.3% 5.2% 2.9% Source: KAED/IFDC Survey.
Farmers growing Sante variety obtained high yield results (34 mt/ha) compared to other varieties. The
second variety was the German variety Jelly. It showed high yield results of 23.8 mt/ha. As for other
varieties, yields ranged from 14.6 mt/ha to 22.6 mt/ha. Sante had higher yields because high quality
tubers of this variety are imported annually. Small yields from other varieties are related to their
generational age, since some of them are older than C8-C10.
As it is apparent from the table above that about 1.3 percent of farmers, covering 2.9 percent of total
potato area, use the full potential of seed inputs and nutrients together.
Page 59
50
Figure 20. Yield Gap Levels in Potato Production on Farm Scales
Gap III
18,608 kg/ha (55.7%)
Imbalanced fertilizer application
Improper variety and seeds
Gap II
14,948 kg/ha (64.4%)
Poor cultivation practices Imbalanced fertilizer
application Improper variety and
seeds Limited access to
machinery
Yield of “Best Practice”
Farmers
29,504 kg/ha (12.3%)
Gap IV
22,930 kg/ha (45.4%)
Imbalanced fertilizer application
Attainable Yield
41,970 kg/ha
Gap I
10,569 kg/ha (74.8%)
Poor cultivation and land use practices
No organic/inorganic fertilizer application
Improper variety and seeds
Limited access to machinery
Page 60
51
SummaryofResultsandRecommendations
The following general conclusions regarding the fertilizer use situation can be drawn from this study:
Only one-third of the required fertilizer is supplied and used in the country. Nitrogen fertilizer is
popular among farmers even though its use has not been more 43.5 percent of the required use.
Less than one-tenth of the required phosphate fertilizer is applied by farmers. Inorganic fertilizer
with potash nutrients is rarely used (up to 0.02 percent of required since 2004).
High transportation costs are the biggest constraint on fertilizer use, making the majority of crops
less competitive when compared to crops from neighboring Uzbekistan and Kazakhstan, where
fertilizers are produced.
Fertilizers from Russia and Kazakhstan are imported during winter when prices are lower and
stored until the growing season. During seeding and growing seasons, fertilizer prices are low only
for Russian and Kazakh residents and farmers but are expensive or unavailable for non-residents.
Only three laboratories exist in the country but do not track soil analysis of nutrients on the country
level – only for selected farms. Land fragmentation may complicate this type of activity since soil
management of smallholders differs greatly from one to the next. Farms and farming households in
the country total more than 1 million, which far exceeds the existing capacities of these
laboratories.
The analysis shows that farmers have little formal agricultural experience. The majority of them
shifted to agriculture after the country gained independence. Some farmers are highly educated in
different fields of study but are new to the field of agriculture. They have only a basic knowledge
of when and how to apply agro-inputs, and many farmers are unaware of the need for a balanced
fertilizer program. Farmers prefer nitrogen fertilizer due to its quick response and visual effects.
The effects of phosphate and potash fertilizers are usually not visual, despite the significant impact
on yields (strengthening of the root system, disease resistance, hardiness, increased flowering,
etc.). In addition, applied phosphate and potash fertilizers have a long-term impact on production
that provides benefits for future seasons.
The yields of wheat, maize and potato are negatively correlated to farm size. Economies of scale
and resources available allow larger farms to achieve higher yields with the use of improved
technology and mechanized farming. Very small farms established from the land fragmentation
following independence lack the resources and the knowledge to implement best management
practices, and the efficiency of large farms cannot be directly transferred to these very small farms.
For example, traveling to distant small fields, using expensive machinery services, inability to
rotate crops and purchasing small quantities of inputs for small plots all reduce productivity.
Page 61
52
A portion of smallholders do not use the technology of crop rotation on small plots. Food security
of the family dictates the cultivation of the same crop every year.
Complete fertilizer use for wheat does not show sufficient benefits due to low output prices that are
not competitive with Kazakh and Russian subsidized rates. However, farmers continue to produce
wheat for food security reasons. Also, growing alternative crops requires more inputs and labor-
intensive activity, access to agricultural machinery and financial investment. An increase in land
area gives more benefits in wheat production than intensive fertilizer use with complete nutrient
applications. Large farms implement soil management practices, such as crop rotations with
perennial grasses to manage existing yields and provide stabilization for the following years.
Maize is the most profitable crop among cereals. Farmers can obtain benefits from using balanced
fertilizer, especially with modern hybrid varieties that are becoming more popular. The potential
exists with use of hybrids and balanced fertilization to increase maize production by about
50 percent at the national level.
The majority of potato producers are households and smallholders. The majority of farmers use
organic fertilizer (manure) due to cheap costs or no expense. One-third of farmers apply nitrogen,
and only about 12 percent of farmers apply phosphate fertilizer. Potatoes are the most expensive
crop to grow; if proper quality potato seeds are used, the cost of potato seed can often exceed the
total cost of wheat production. A large quantity of labor is employed in potato production, and
primarily manual labor (rather than machinery) is used in potato harvesting. Regardless of these
expenses, this crop has more opportunities for an increase in production. One dollar of additional
complete (balanced) fertilizer gives about $5 of benefit. As the study shows, average potato
production can be significantly increased if farmers adopt advanced farming techniques and
practice balanced fertilizer use.
Recommendations
On the basis of the findings of the study, the following recommendations are made for policy
consideration:
1. Fertilizer Supply. The government has already agreed with Uzbekistan on providing 200,000 mt
of nitrogen fertilizer, which is considered by the DCPP to be the total amount of nitrogen fertilizer
required for the country. However, the government is also distributing these fertilizers to farmers
through its own channels for prices that are 35 percent lower than retail prices dictated by the
market price. This is undermining private-sector fertilizer supply channels. It is recommended that
the role of government should be to negotiate with the supply countries, Uzbekistan, Kazakhstan
and Russia, for bulk import volumes of phosphate and potash fertilizer in addition to nitrogen
Page 62
53
fertilizer at affordable prices and make these available to the private sector for distribution to
farmers. These steps would increase supply and decrease fertilizer prices.
2. Empower Local Governance and Extension Services. Many Kyrgyz farmers require additional
technical knowledge on best farming practices and the efficient use of fertilizer. Addressing these
requirements requires investment in the provision of extension services to offer practical education
to farmers. Over the years, many interventions have been made by the government and
international donors to develop smallholder agriculture but with limited success. Many countries
have extension services that support farmers. Current independent extension services are not
capable of providing countrywide services due to limitations of given tasks, budgets and human
resources. Also, they are dependent on donor funding to secure constant supply support to all
farmers in all regions every year. Nevertheless, they contain high potential in introducing modern
agricultural methods, input use and new varieties to complement government agricultural
activities.
Local governments could be empowered to initiate and direct the provision of agricultural
services and determine and implement projects to complement the activities of the central
government in their areas. Further decentralization and increasing the capacities of local
governments could increase farmers’ knowledge, skills and capacities to increase food production
and improve food security. Empowering capacities of local governments would have a positive
impact for the following reasons:
The service will be closer to farmers – especially households and smallholders – and more
attentive to their problems.
Decentralized extension reduces the costs of the central government, and the extension
activities fulfill needs according to the agricultural zones and main crops grown in the area.
Constraints and limiting factors are analyzed locally, and further steps to overcome existing
problems are prioritized by local farmers.
Depending on needs and opportunities, local governments should be able to do the following:
Improve access to other agriculture support services, such as finance, inputs, markets, etc.
Endow farmers with skills and knowledge of sustainable farm management.
Facilitate their access to new technologies.
Establish trial fields to estimate benefits of fertilizer, varieties and farm management.
Page 63
54
3. Land Consolidation into Viable Farms on a Voluntary Basis. Smallholders lag behind medium-
and large-sized farmers in agricultural productivity and have lower crop yields. Land consolidation
is considered worldwide to be a way to improve farm productivity through reduction of inputs and
transportation costs, efficient soil management, easier mechanization and higher productivity. The
government could consider establishing an incentive program to encourage small farmers to initiate
consolidation of their land on a voluntary basis into economically viable larger farms, such as
cooperatives with shared ownership, making them capable of accessing larger markets and
developing linkages with wholesale dealers and buyers. Large farms are able to buy inputs, such as
fertilizer and seeds, for lower prices, use machinery services for lower fees and have better soil
management through crop rotation,
diversification and other activities. Figure 21
represents the impact of the lower wholesale
NPK fertilizer prices compared to retail prices
for the selected crops. Even though wheat is
still inefficient when complete fertilizer is used,
significant increases of VCRs for maize and
potato are apparent.
The activity of land consolidation should also
be initiated by aiyl-okmotus (local
governments), keeping budgetary constraints in
mind. Their main income comes from land tax.
It is considered by some central government
authorities that land tax is significantly low and should be increased in order to motivate farmers in
efficient agricultural land use to increase productivity. Indeed, higher land tax may motivate farmers
and households to intensify the use of modern agricultural inputs to increase land productivity and
optimize the allocation of resources. Thus, the additional tax income sources should be used for
extension services and land consolidation initiatives at local government levels.
Wheat
Maize
Potato
0
1
2
3
4
5
6
7
CurrentImpact
1.82 1.94
2.19 2.62
4.99
6.21
Figure 21. Effect of Complete Fertilizer Wholesale Price to VCR
Page 64
55
References
AAK. 2013. “Market Research Report of Vegetable Seeds, Fruit Seedlings, Fertilizer in Fruit
&Vegetable Sector Value Chains of Kyrgyz Republic,” Osh, Kyrgyzstan.
Abdullaev, U. 2009. Results of Varieties and Hybrids on Trials Yields, KAED/IFDC, Bishkek, Kyrgyz
Republic.
Baanante, C., and D. Abdulhamidov. 2003. “Comparative Advantage of Agricultural Production in
Kyrgyz Republic,” IFDC Alabama, USA.
Efimov, V.N., I.N. Donskikh and V.P. Tsarenko. 2002. “Fertilizer Systems,” Kolos S, Moscow,
Russian Federation
Guadagni, M., and T. Fileccia. 2012. “Farm Mechanization and Agricultural Productivity, 2009 and
MAWR,” FAO, World Bank, Rome Italy.
Kim, O. 2013. Survey Database on Farmers’ Yield on Selected Crops on 2011-2013, KAED/IFDC,
Bishkek, Kyrgyz Republic
NCS. 2012. Agriculture of Kyrgyz Republic 2007-2011, Bishkek, Kyrgyz Republic
NCS. 2013. Results Excluding Livestock and Poultry in Kyrgyz Republic, Bishkek, Kyrgyz Republic
World Development Indicators 2012, The World Bank, Washington, D.C., USA.
Page 65
56
AppendixA.FertilizerRequirementsbyOblasts
Table A.1. Fertilizer Nutrient Requirements in Kyrgyz Republic by Oblast in Kyrgyz Republic
Country Batken Jalalabad Issyk-kul Naryn Osh Talas Chuy
All cultivated area excluding perennial grasses
N54P49K30 N43P57K23 N59P56K33 N68P60K37 N59P54K30 N55P50K31 N49P48K31 N48P42K26
Winter wheat N46P37K25 N40P31K21 N51P40K27 N55P44K29 N0P0K0 N47P37K25 N45P36K24 N44P35K25
Spring wheat N58P55K32 N45P43K25 N61P61K35 N70P63K38 N59P54K30 N60P60K36 N52P57K36 N50P46K26
Grains and pulses N56P46K28 N44P35K23 N57P46K29 N79P63K38 N66P54K30 N48P39K25 N50P45K27 N51P42K24
Industrial crops (cotton, tobacco, sugar beet, oil crops)
N63P62K39 N58P60K37 N73P76K45 N13P17K12 N20P22K17 N79P82K49 N44P40K28 N45P37K27
Potato, vegetables and melons N49P58K42 N47P50K34 N47P51K34 N52P61K47 N48P66K52 N50P56K39 N57P67K51 N51P55K38
Forage crops N17P32K14 N14P24K10 N16P30K10 N18P36K14 N20P42K19 N19P31K15 N7P15K7 N18P31K16
Fruits and berries N21P20K10 N10P10K5 N26P26K13 N27P26K13 N0P0K0 N39P38K19 N39P39K20 N7P7K4
Grapes N16P16K9 N18P18K10 N12P11K6 N0P0K0 N0P0K0 N52P51K27 N0P0K0 N6P6K3
All for the region N47P45K26 N35P32K19 N55P53K52 N57P54K32 N44P49K27 N51P48K30 N39P40K25 N41P39K23
Source: DCPP
Page 66
57
AppendixB.LivestockManureProductionRatesandNutrientContent
Table B.1. Nutrient Availability on Manure
Nitrogen
(N) Phosphorus
(P2O5) Potassium
(K2O) Calcium
(Ca) Magnesium
(Mg) Organic Matter
Fresh manure % % % % % % Cattle 0.5 0.3 0.5 0.3 0.1 16.7 Sheep 0.9 0.5 0.8 0.2 0.3 30.7 Poultry 0.9 0.5 0.8 0.4 2 30.7 Horse 0.5 0.3 0.6 0.3 0.12 7 Swine 0.6 0.5 0.4 0.2 0.03 15.5
Treated dried manure % % % % % % Cattle 2 1.5 2.2 2.9 0.7 69.9 Sheep 1.9 1.4 2.9 3.3 0.8 53.9 Poultry 4.5 2.7 1.4 2.9 0.6 58.6
Source: EcoChem (http://www.ecochem.com/t_manure_fert.html)
Table B.2. Approximate Annual Dried Manure Production and Fertilizer Content with Loss Adjustments
Animal mt/Year* Nitrogen
(N) Phosphorus
(P2O5) Potassium
(K2O) Calcium
(Ca) Magnesium
(Mg) Organic Matter
Cattle 4.5 2.0% 1.5% 2.2% 2.9% 0.7% 69.9%
Sheep 0.45 1.9% 1.4% 2.9% 3.3% 0.8% 53.9%
Poultry 0.025 4.5% 2.7% 1.4% 2.9% 0.6% 58.6%
Source: *Efimov and others (2002) “Fertilizer Systems”
Table B.3. Approximate Quantity, Composition and Value of Dried Cattle Manure
Total
Annual Production
(mt) Nitrogen
(N) Phosphorus
(P2O5) Potassium
(K2O) Calcium
(Ca) Magnesium
(Mg) OrganicMatter
Kyrgyz Republic 1,367,466 6,153,597 123,072 92,304 135,379 178,454 43,075 4,301,364
Chuy Oblast 251,824 1,133,208 22,664 16,998 24,931 32,863 7,932 792,112
Bishkek city 1,065 4,793 96 72 105 139 34 3,350
Issyk-Kul Oblast 191,974 863,883 17,278 12,958 19,005 25,053 6,047 603,854
Naryn Oblast 136,552 614,484 12,290 9,217 13,519 17,820 4,301 429,524
Talas Oblast 66,291 298,310 5,966 4,475 6,563 8,651 2,088 208,518Subtotal Northen Oblasts
647,706 2,914,677 58,294 43,720 64,123 84,526 20,403 2,037,359
Osh Oblast 314,647 1,415,912 28,318 21,239 31,150 41,061 9,911 989,722
Osh city 9,123 41,054 821 616 903 1,191 287 28,696
Jalal-Abad Oblast 273,136 1,229,112 24,582 18,437 27,040 35,644 8,604 859,149
Batken Oblast 122,164 549,738 10,995 8,246 12,094 15,942 3,848 384,267
Subtotal Southern 719,070 3,235,815 64,716 48,537 71,188 93,839 22,651 2,261,835
Page 67
58
Oblasts
Table B.4. Approximate Quantity, Composition and Value of Dried Sheep and Goat Manure
Total
Annual Production
(mt) Nitrogen
(N) Phosphorus
(P2O5) Potassium
(K2O) Calcium
(Ca) Magnesium
(Mg) OrganicMatter
Kyrgyz Republic 5,423,881 2,440,746 46,374 34,170 70,782 80,545 19,526 1,315,562
Chuy Oblast 574,882 258,697 4,915 3,622 7,502 8,537 2,070 139,438
Bishkek city 3,773 1,698 32 24 49 56 14 915
Issyk-Kul Oblast 796,451 358,403 6,810 5,018 10,394 11,827 2,867 193,179
Naryn Oblast 940,291 423,131 8,039 5,924 12,271 13,963 3,385 228,068
Talas Oblast 498,606 224,373 4,263 3,141 6,507 7,404 1,795 120,937
Subtotal Northen Oblasts
2,814,003 1,266,301 24,060 17,728 36,723 41,788 10,130 682,536
Osh Oblast 1,002,482 451,117 8,571 6,316 13,082 14,887 3,609 243,152
Osh city 16,413 7,386 140 103 214 244 59 3,981
Jalal-Abad Oblast 1,121,282 504,577 9,587 7,064 14,633 16,651 4,037 271,967
Batken Oblast 468,714 210,921 4,008 2,953 6,117 6,960 1,687 113,687
Subtotal Southern Oblasts
2,608,891 1,174,001 22,306 16,436 34,046 38,742 9,392 632,787
Table B.5. Approximate Quantity, Composition and Value of Dried Poultry Manure
Total
Annual Production
(mt) Nitrogen
(N) Phosphorus
(P2O5) Potassium
(K2O) Calcium
(Ca) Magnesium
(Mg) OrganicMatter
Kyrgyz Republic 5,076,559 126,914 5,711 3,427 1,777 3,681 761 74,372
Chuy Oblast 1,843,111 46,078 2,07 3 1,244 645 1,336 276 27,002
Bishkek city 23,400 585 26 16 8 17 4 343
Issyk-Kul Oblast 797,127 19,928 897 538 279 578 120 11,678
Naryn Oblast 177,917 4,448 200 120 62 129 27 2,606
Talas Oblast 245,402 6,135 276 166 86 178 37 3,595
Subtotal Northen Oblasts
3,086,957 3,086,957 138,913 83,348 43,217 89,522 18,522 1,808,957
Osh Oblast 799,115 19,978 899 539 280 579 120 11,707
Osh city 30,503 763 34 21 11 22 5 447
Jalal-Abad Oblast 897,396 22,435 1,010 606 314 651 135 13,147
Batken Oblast 262,509 6,563 295 177 92 190 39 3,846Subtotal Southern Oblasts
1,989,523 1,989,523 89,529 53,717 27,853 57,696 11,937 1,165,860
Page 68
59
AppendixC.FarmMachineryDeficitsinKyrgyzRepublic
Table C. 1. Machinery Deficit in Kyrgyz Republic, 2012
Oblasts
Sown Area All Crops
('000 ha) Grains Area
Tractor Need for Average Sown Area
(based on tech. para.)
Operational Tractors
Average Tractor Deficit
Grain Combine Harvester Need
for Average Grains Sown
Area (estimated) Operational Combines
Average Combine Deficit
('000 ha) % ('000 ha) % Quantity % Quantity (%)
Chuy oblast 403.4 35% 251.7 40% 10,086 5,475 4,611 46% 1,259 614 645 51%
Issyk-kul oblast 179.4 15% 96.5 15% 4,485 2,792 1,693 38% 483 498
Talas oblast 102.7 9% 62.8 10% 2,568 1,268 1,300 51% 314 92 222 71%
Naryn oblast 102.3 9% 27.8 4% 2,559 1,402 1,157 45% 139 240
Northern oblasts 787.9 68% 438.9 70% 19,697 10,937 8,760 44% 2,194 1,444 750 34%
Osh oblast 173.1 15% 88.6 14% 4,327 2,995 1,332 31% 443 160 283 64%
Jalalabad oblast 143.6 12% 58.1 9% 3,590 2,361 1,229 34% 291 102 189 65%
Batken oblast 61.2 5% 39.6 6% 1,529 1,040 489 32% 198 38 160 81%
Southern oblasts 377.8 32% 186.3 30% 9,446 6,396 3,050 32% 932 300 632 68%
Kyrgyz Republic
1,165.7 100% 625.2 100% 29,143 17,333 11,810 41% 3,126 1,744 1,382 44%
Source: WB, Farm mechanization and agricultural productivity, 2009 and MAWR, 2012. Updated by the author.
Page 69
60
Source: WB, Farm mechanization and agricultural productivity, 2009
Figure C.1. Aging Farm Machinery in Kyrgyz Republic, 2003
Source: WB, World Development Indicators 2012
Figure C.2. Agricultural Machinery (tractors per 100 km2 of arable land, 2009)
91%86%
9%14%
0%
10%
20%
30%
40%
50%
60%
70%
80%
90%
100%
Wheel tractors Combines
Older than 1990
Newr than 1990
310.2
291.6
216.9
197.6
188.1
0 50 100 150 200 250 300 350
Tajikistan
Armenia
Georgia
Moldova
KyrgyzRepublic
Page 70
61
Table C.2. International Comparison of Private Investments in Agriculture in 2012
Machine Deficit (No.) Average Price
(U.S. $) Total Financial
Requirement (U.S. $) Tractors 11,810 20,000 236,196,500 Combine harvesters 1,382 100,000 138,191,000 Seeders 1,255 12,000 15,058,920 Total 389,446,420 Source: WB, Farm mechanization and agricultural productivity, 2009 & updated by author.