Economia Aplicada, v. 15, n. 1, 2011, pp. 103-130 THE ROLE OF FIRM AND TERRITORY IN INNOVATIVE ACTIVITIES IN BRAZILIAN POST-OPENING ECONOMY Eduardo Gonçalves Mauro Borges Lemos † João Alberto de Negri ‡ Abstract The aim of this paper is to estimate the role of territory and the in- dividual firm in innovation in the Brazilian industrial economy after the trade-opening period from 1998 onwards. This study is based on a database whose micro-data are a merger between the Technological Innovation Sur- vey (PINTEC) and the Yearly Industrial Survey (PIA) of the Brazilian In- stitute of Geography and Statistics (IBGE). These micro-data are analyzed by the logit regression method as well as using hierarchical regression models. The main results reveal that firm-level variables and region-level variables are complementary but with the former having more impact on the propensity to innovate than the latter. Keywords: innovation; firm; region; hierarchical regression models; Brazil JEL classification: R10; R30; O30. Resumo O objetivo desse artigo é identificar o papel do território e da firma na inovação da economia industrial brasileira após o período de abertura econômica em 1998. Esse artigo baseia-se em uma base de dados cujos mi- crodados são provenientes da fusão da Pesquisa de Inovação Tecnológica (PINTEC) e da Pesquisa de Inovação Industrial (PIA) do Instituto Brasi- leiro de Geografia e Estatística (IBGE). A base de dados é submetida a métodos de regressão logística e hierárquica. Os principais resultados re- velam que variáveis ao nível da firma e região são complementares, sendo que os primeiros possuem impacto superior sobre a propensão a inovar das firmas em relação aos últimos. Keywords: inovação; firma; região; modelos hierárquicos; Brasil. Universidade Federal de Juiz de Fora. E-mail [email protected]. † Universidade Federal de Minas Gerais. E-mail: [email protected]. ‡ Instituto de Pesquisa Econômica Aplicada. E-mail: [email protected]. Recebido em 25 de março de 2010 . Aceito em 22 de dezembro de 2010.
Transcript
Economia Aplicada, v. 15, n. 1, 2011, pp. 103-130
THE ROLE OF FIRM AND TERRITORY ININNOVATIVE ACTIVITIES IN BRAZILIAN
POST-OPENING ECONOMY
Eduardo Gonçalves*
Mauro Borges Lemos†
João Alberto de Negri‡
Abstract
The aim of this paper is to estimate the role of territory and the in-dividual firm in innovation in the Brazilian industrial economy after thetrade-opening period from 1998 onwards. This study is based on a databasewhose micro-data are amerger between the Technological Innovation Sur-vey (PINTEC) and the Yearly Industrial Survey (PIA) of the Brazilian In-stitute of Geography and Statistics (IBGE). These micro-data are analyzedby the logit regression method as well as using hierarchical regressionmodels. The main results reveal that firm-level variables and region-levelvariables are complementary but with the former having more impact onthe propensity to innovate than the latter.
Keywords: innovation; firm; region; hierarchical regressionmodels; Brazil
JEL classification: R10; R30; O30.
Resumo
O objetivo desse artigo é identificar o papel do território e da firmana inovação da economia industrial brasileira após o período de aberturaeconômica em 1998. Esse artigo baseia-se em uma base de dados cujos mi-crodados são provenientes da fusão da Pesquisa de Inovação Tecnológica(PINTEC) e da Pesquisa de Inovação Industrial (PIA) do Instituto Brasi-leiro de Geografia e Estatística (IBGE). A base de dados é submetida amétodos de regressão logística e hierárquica. Os principais resultados re-velam que variáveis ao nível da firma e região são complementares, sendoque os primeiros possuem impacto superior sobre a propensão a inovardas firmas em relação aos últimos.
Keywords: inovação; firma; região; modelos hierárquicos; Brasil.
104 Gonçalves, Lemos, De Negri Economia Aplicada, v.15, n.1
1 Introduction
This article starts out from two theoretical sources dealing with the factorsthat determine innovation. The first treats innovation as the result of a setof incentives and restrictions internal to the firm. The work of Dosi (1988),Nelson &Winter (1982), Lundvall (1992), Richardson (1972), Penrose (1959),Chandler (1977), Grant (1996) and Foss (1997) are found within this frame-work. Such works consider the large business organization as the principalagent in the innovative process, because it takes the initiative in the processand possesses most of the resources necessary for it. Besides, part of thistheoretical framework includes firm internal knowledge related characteris-tics, the firm’s absorptive capacity and a rationale for a firm to have externalknowledge relations, being known as “the knowledge based view of the firm”.
The second theoretical source focuses on the contextual conditions linkedto specific territorial and urban factors in which innovation occurs, as in thework of Carlino et al. (2007), Markusen et al. (1986) and Feldman & Florida(1994). These last are good representatives of this viewpoint, emphasizingthat the capacity to innovate is located beyond the limits of the organization,as innovation no longer falls within the domains of the inventor, of the risk-taking entrepreneur, of the capitalist with a keen eye, or of the resource-richlarge corporation. On the contrary, innovation has its sources in a wider spa-tial and social structure, which is defined by a landscape of agglomeratedand synergistic economic and social institutions. This means that geographypossesses a central role in the innovative process. Accordingly, innovation is,above all, a geographical process.
The motivation of this article is based on the potential for the integra-tion of these two theoretical approaches, considered as supplementary to eachother, instead of considering them separately. Innovation, in this way, canonly be truly understood if the conditioning factors internal to the companyand the role of external players, territorially speaking, are identified. Becauseof this, all the effort expended in trying to integrate the neo-Schumpeterianwork to theories that emphasize the role of the territorial environment con-tributes to develop what Dosi (1988) called the regional economy of technicalchange. The consideration itself of the properties of innovation permits theconclusion that it is a complex process because it involves various players, inthe same way that territory is also a social construct arising out of the actionsof players in space (Markusen 2005).
In order to achieve this aim, the article is based on a rich and uniquedatabase organized for the period 1998-2000 by the Institute of Applied Eco-nomic Research (Instituto de Pesquisa Econômica Aplicada – IPEA) and theCenter for Regional Development and Planning (Centro de Desenvolvimentoe Planejamento Regional – CEDEPLAR). The original data stems from micro-data of the Technological Innovation Survey (Pesquisa de Inovação Tecnológica– PINTEC) and the Annual Industrial Survey (Pesquisa Industrial Anual – PIA)of the Brazilian Institute of Geography and Statistics (Instituto Brasileiro deGeografia e Estatística – IBGE), covering the period 1998-2000. Our method-ological approach takes into account the contribution of endowments morerelated to firms and those linked to territory. It is carried out by means of lo-gistic and hierarchical regression models. The latter provides the distinctiveadvantage of carrying out estimates while simultaneously considering bothlevels of variable sets which characterize the problem under study.
The role of firm and territory in innovative activities 105
Two hypotheses are tested in this study for the Brazilian manufacturingfirms. The first is that regional attributes are complementary to attributes in-ternal to firms, despite their varying importance according to the type of inno-vation under consideration. The second is that intra-regional technological-knowledge externalities, measured by patents per capita and R&D expendi-ture, exert significant effects on firms’ innovation. That is, knowledge exter-nalities internal to the regions may play an important role in innovation incountries where the disparity in knowledge between the regions is very high.
The first hypothesis is expected to be confirmed because there are theoret-ical arguments and some previous empirical evidence that validate it. Amongfactors internal to the region which generate or make possible the ability toinnovate within the firm, the following stand out: skilled specialized locallabor force; R&D structure; infrastructure for technology transfer; service in-frastructure for specialized business; performance and level of specializationof regional economic structures; locational factors linked with urban and cul-tural amenities; “institutional robustness”; proportion of unionized workersin the region; level of urbanization and place in urban hierarchy; concentra-tion of federal financial resources for basic research and defense spending(Sternberg & Arndt (2001); Harrison et al. (1996); Markusen et al. (1986);Amin & Thrift (1994)).
2 A Brief Review of the Literature
2.1 Internal and External Determinants of Innovation in the Firm
The factors cited above act in the sense of increasing the potential of the firmto generate differentiated productive services, understanding by company acombination of accumulated tangible and intangible assets (Penrose 1959).Depending on the manner in which these resources are combined they cangive rise to different services. Resources are therefore regarded as a set of po-tential new services. Penrose’s emphasis was on the role of human resources,especially the entrepreneur, who provides corporate services related to thetask of applying part of the firm’s resources in investigation and creation ofnew and profitable productive trajectories in its process of diversification.
In his turn, Chandler (1977, 1962, 1992) emphasizes capacity-building inorganizations as a basis for understanding the innovative power of large com-panies. He makes firms the main players shaping the territorial environmentin which they are inserted. In Nelson (1996)’s proposal of a summary of theo-retical elements by Chandler, Penrose and neo-Schumpeterian formulations,he characterizes the firm as a set made up of strategy, organizational and pro-ductive structure and core capabilities. In this sense, the theoretical perspec-tive so-called “the resource-based perspective” emphasize that differences infirm’s resource endowments cause performance differences (Foss 1997). Firmsseek to create, maintain and renewal competitive advantage in terms of theirresource side. Based on this perspective, the firm is an entity that seeks tomatch the opportunities of the environment with what the firm is capable ofdoing.
On empirical grounds, Sternberg & Arndt (2001) test the influence of firmand regional-level variables on the innovative behavior. The authors reach theconclusion that regional variables exert weaker influence on innovation thanfirm variables. Such a conclusion weakens the theorizing regarding the piv-
106 Gonçalves, Lemos, De Negri Economia Aplicada, v.15, n.1
otal role of territory to innovate, confirming previous findings of the literatureon the complementary nature of the role played by organizational internalcapabilities and territorial emersion, as pointed out by Harrison et al. (1996).This influence is also nuanced, depending on the type of innovation. Whereasregional variables were more heterogeneous in their impact on product inno-vation, in process innovation the only relevant variable was the proportionof local workers employed in manufacturing. For product innovation, tech-nical and scientific staff and proximity to reputable research institutions ex-erted highly positive effects and regional research capability proved to be themost important territorial variable. In contrast, four out of the five variablesrelated to the firm, when positive, increase the firm’s probability of gener-ating product innovations. Company size and R&D expenditures had smallrelevance in increasing tendency toward innovation, in the case of products.The significant variable with the greatest impact was permanent research anddevelopment. Regarding process innovations, the number of employees mat-tered having positive impact on the probability of innovating. The remainingvariables were not statistically significant. The role territorial link networksformed by firms showed for process innovation statistical significance both atintra-regional and inter-regional levels. In the case of product innovation itwas not significant.
These results led the authors to the conclusion that it is more likely thatfirms with favorable internal endowment will be capable of innovating, evenin a region with unfavorable influences than the other way round. In un-favorable environments, the firm may develop strategies to overcome suchrestrictions. Development of inter-regional networks is an example of suchstrategies. Therefore, according to the authors, the regional environment, de-spite its influence on the firm’s innovative behavior, can never be consideredmore important than firm’s capabilities of processing information and work-ing in networks. This statement adds weight to building capabilities and com-petences within firms, giving high priority to theories by Chandler (1992),Penrose (1959) and Nelson & Plosser (1982).
Méndez (2002) also acknowledges that both internal organization and ter-ritorial environment affects innovation together in a complementary fashion,although their importance varies according to the type of company. Smallcompanies may rely more on their networks in surrounding areas to innovate,since there are myriad restrictions, such as insufficient financial resources,lack of technical personnel and less access to technical and market informa-tion.
Regarding the second hypothesis, the expectation of its confirmation islinked to the literature that highlights the importance of external factors inthe generation of innovations. According to Dosi (1988), innovations dependof a set of “non-tradable interdependencies” and “contextual conditions”.The “non-tradable interdependencies” are associated with the public part ofknowledge or the non-appropriable private part of knowledge, that is, thatpart of knowledge used in company innovation, but not appropriated exclu-sively by it. These interdependencies between sectors, technologies and com-panies take the form of technological complementarities or synergies, whichcan constitute collective assets of groups of companies within countries orregions and/or can be internalized by companies.
The interdependencies that are not appropriated give rise to spatial group-ings of companies which take advantage of the positive externalities of such
The role of firm and territory in innovative activities 107
knowledge overflows. The mechanisms through which these overflows occur,and their geographical limits, are investigated by some authors. The consen-sus is that the overflows are geographically limited in space, which functionsas an intermediary by facilitating interaction and communication, in addi-tion to increasing the intensity of seeking and the coordination between theplayers (Feldman & Florida 1994, Jaffe 1989).
Although many studies discuss relative impacts on the capacity to inno-vate of attributes internal to the firm and to the territory, little is known abouthow these factors work in late-industrializing countries such as Brazil. Theobjective of this article is thus to find evidence about the relative importanceof firms and territory regarding Brazilian firms’ innovation capabilities, com-paring these results with those available for developed countries.
The following section focuses on characteristics of the process of technicalchange in late-industrializing countries and particularly in Brazil after tradeopening and privatizations in the 90s. The third section describes method-ological aspects related to regression models and specifications, to variablesas proxies of firm and region attributes and to the database. The fourth sec-tion contains the results and the fifth the conclusions.
2.2 The limits of Brazilian late industrialization to technologicalinnovation
In late-industrializing countries, the way that a firm’s organization and terri-tory complement each other in the innovation process must take into accountthe characteristics of the peripheral institutional environment regarding in-novation. Such an environment can be regarded as the so-called national in-novation system, which provides the institutional and infrastructural base totechnological change (Nelson 1988, Lundvall 1992).
The Brazilian innovation system is characterized as poorly developed andimmature (Albuquerque 2000) inasmuch as it suffers from: i) low involvementof manufacturing firms in innovation; ii) reduced internal innovative effort byfirms, as shown by the small share of R&D expenditure in the total amount ofinnovation expenditure compared to the share of expenditure on machineryand equipment; iii) non-continuous nature of innovation activities, shown bythe relative weight of occasional R&D; iv) incremental nature of the innova-tive process based on absorption of diffused technologies of leading countriesby means of machinery and equipment imports, other external knowledgepurchases (such as patents, licensing and know-how) and, last but not least,the strong presence of multinational companies’ subsidiaries in both science-based and scale-intensive sectors; v) low level of inter-relations among agentsmaking up the national innovation system, in particular weak links betweenscientific knowledge institutions, such as the universities, and manufacturingfirms.
The characteristics above depict many limitations of Brazilian firms. Ifindeed companies are the main protagonists in the innovation process, howcan regional scale elements in the national innovation system contribute togeneration of innovation, compensating for these organizational limitations?
Whereas regions are important for innovation even in countries with lowterritorial inequality they are much more relevant in the case of countrieswith strong territorial unbalance, as is the case of Brazil. This is due to highregional heterogeneity in terms of indicators related to the university system
108 Gonçalves, Lemos, De Negri Economia Aplicada, v.15, n.1
(number of establishments, professorship and students’ background) and tothe regional infrastructure for research and learning at the institutional andcompany levels (Diniz & Gonçalves 2001).
Historically, the Brazilian economic development process is characterizedby deep social and regional inequalities (Azzoni 1997). The Southeast andSouth regions have the largest share of industrial production, the best aca-demic university and research system, an integrated urban network and themost dynamic industrial centers. The Center-West and the North are agri-cultural and mineral frontiers, less prepared for the development of moreintensive knowledge industries. And the Northeast is home to nearly a thirdof the population but has low levels of economic development, poor levels ofeducation and living standards (Diniz & Gonçalves 2001).
More recently, a database organized by the IPEA and the CEDEPLAR basedon a pool of data sources, mainly frommicro-data of the PINTEC and the PIAof the IBGE, gave rise to a series of articles organized by De Negri & Salermo(2005).1 These studies reinforce regional inequalities from another point ofview. The Brazilian industrial firms are classified into three groups accordingtheir innovative capability and exhibit distinctive patterns of regional distri-bution as well as locational requirements.
According to their competitive strategy of product differentiation in theperiod 1998-2000, Brazilian industrial firms2 were classified into three cate-gories: 1) Category A: firms introducing product innovation on the Brazilianmarket and with export premium price of 30%; 2) Category B: firms whichexport and are not included in category A or firms which do not export buthave efficiency standards (labor productivity) similar to the export firms ofthis category; 3) Category C: the residual firms which do not innovate and donot export.
The distribution of industrial value-added in Brazil shows high level ofspatial concentration. Comparatively, the 250 major municipalities accountfor 98% of the total of industrial value-added (IVA) of type A companies, 87%of IVA of type B companies and 78% of IVA of type C companies.
Firms in category A have superior technological standards because theyinnovate and differentiate products. They have advanced competitive strate-gies focused on high value-added new goods. They are, in general, leadingmanufacturing firms with large market shares and belong to more dynamicproduct markets. Although they represent no more than 1.7% of the totalnumber of industrial firms, they account for 26% of overall sales and 13.2%of industrial employment. Thus, it is in this group that the largest firms canbe found. Their average sales are approximately 5.3 times higher than thosein category B and close to 104 times higher than those in the third category.Productivity of these product-innovating firms, when measured by the ratiovalue added to employment, is 67% higher than that of firms with standard-ized goods. The category A firms are very unevenly distributed among mu-nicipalities in Brazil. The presence of this category of firm occurs in 465 mu-nicipalities, mainly in the Southeast Region and the State of São Paulo. Thearea surrounding the São Paulo metropolitan area tends to be most preferredby these industrial companies. In the North Region, only five municipalities
1Details of the methodology for construction of the database can be found in De Negri &Salermo (2005).
2In this text “firm” stands for “local production unit”. Any regional study should take intoaccount the existence of local production units since a firm may have several production units.
The role of firm and territory in innovative activities 109
have type A companies, while the Southeast Region have 234 municipalitieswith type A companies.
Firms in category B are mostly scale-intensive firms producing intermedi-ate standardized goods and having technological upgrading based mainly onprocess innovations. They represent 21.3% of all firms, 62.6% of total indus-trial sales and 48.7% of all industrial employment in the country. The maincompetitive strategy of this type of firm is towards costs reducing rather thanvalue-added increasing by new product introduction, more common in cate-gory A companies. Thus, they are operationally up-to-date, regarding manu-facturing, production management, compliance-quality management and lo-gistics, but have lower capacity regarding R&D, marketing and brand man-agement. Out of a total of 5,507, the category B firms are located over 1,561Brazilian municipalities. The B companies do not really need to be presentin large urban areas. Based on spatial autocorrelation statistics, Domingues& Ruiz (2005) emphasize that agglomeration of type A firms seems to attracttype B firms, but the opposite is not true. This locational requirement is ex-plained by the fact that the latter firms benefit from external savings stem-ming from downward linkages between type B suppliers and type A users ofindustrial inputs.
Category C firms do not differentiate products and have lower productiv-ity. They do not export, are smaller and generally employ price-competitionstrategies. They account for 77% of all Brazilian industrial firms, 11.5% ofoverall sales and 38.2% of employment. The category C firms are more spreadacross the territory and occur in 2,100 municipalities. According Domingues& Ruiz (2005), these types of firms tend to locate outside the large industrialagglomerations because of the high costs associated with urban agglomera-tions can only be supported by categories A and B firms. On the other hand,few type C firms can be found in major agglomerations, “occupying inter-stices of the metropolitan space and offering products of low unit price andhigh transportation cost, including some standardized food products”.
Given this framework of existing inequalities among regions, which is re-produced at lower territorial scales, inter-relations between entrepreneurialcapacity to innovate and regional development take on leading roles in thecountry’s innovation process. This is due to the fact that parallel to the cre-ation of new market opportunities for firms, innovation also brings develop-ment for the regions. Thus, innovation has attracted increasing attention as aninstrument for industrial and regional policy, including objectives such as fos-tering development in backward regions (Sternberg & Arndt (2001); Malecki(1997)).
By classifying the Brazilian industrial firm into three types according theirinnovative capability, this database allows addressing the contribution of en-dowments more related to firms and those linked to territory. This aim can beonly tackled by means of this database in Brazil, because of issues related tosample representativeness by municipalities.
110 Gonçalves, Lemos, De Negri Economia Aplicada, v.15, n.1
3 Methodology
3.1 Database and Variable Descriptions
Database
The database used in this article is organized by the IPEA and the CEDEPLARbased on a pool of data sources, mainly from micro-data of the PINTEC andthe PIA of the IBGE, covering the period 1998-2000. The integration of theseveral databases was carried out through the National Corporate TaxpayersRegistry (CNPJ). The classification of the participant companies in PINTEC incategories A, B and C was guaranteed because all of them also participated inthe PIA-2000. However, the inverse was not true. It was therefore necessaryto apply a methodology that allowed identification in PIA, which possessesin its sample certain representativeness by municipalities, the companies thatinnovated, generating new products for the market where they were active.PINTEC-2000 possessed 8,195 companies with more than 30 people occu-pied. Of these, 7,941 also replied to the complete questionnaire of the PIA-2000, which represented 21,746 companies with more than 30 people occu-pied, when expanded by the PINTEC expansion factor. The companies thatparticipated in the PIA census, which completed the complete model of thequestionnaire of the Brazilian Institute of Geography and Statistics (IBGE),totalled 24,263.
The classification of the PIA companies could use three of the four in-dicators through which the PINTEC companies were classified, such as: thefact of the firm being or not an exporter, work productivity and its exportsprice-premium. Information, however, on whether it had innovated or not,was not available for all the companies of the PIA sampling plan. The optionadopted was that of classifying the companies based on estimated probabilityof a firm being innovative of new products for the market, starting from PIN-TEC. Company matching was carried out by means of a probabilistic model.In this way, for 7,941 companies, the classification was made simply by com-parison of the PINTEC and PIA questionnaires, in view of the fact that allthese companies participated in these two research projects. The remainder,16,322 companies, was submitted to a probit regression which evaluated theprobability of the firm being innovative, this having to be equal to or higherthan that of the other 7,941. Should the firm meet this prerequisite, it wouldbe considered a new product innovator for the market.
De Negri & Salermo (2005) summarize the whole methodological proce-dure, as done below:
a) direct utilization of the PINTEC firms data, if these also made up partof the PIA sampling plan in the period 1998-2000.
b) probabilistic matching carried out for companies present in the PIA, butthat did not participate in PINTEC;
c) estimation of the probabilistic model for companies with 30 or morepeople occupied, that participated simultaneously in the two samplingplans (PINTEC and PIA), in 2000;
d) weighting of the model by the PINTEC expansion factor, so that the sumof the observations represents the universe of the industry;
The role of firm and territory in innovative activities 111
e) definition of the binary dependent variable as the condition of beinginnovative of new products for the domestic market and of the inde-pendent variables as characteristics of the companies, their personneloccupied, sectors and units of the federation (states) to which they be-long;
f) calculation of the propensity score of all the companies;
g) grouping of the companies in four sets according to whether they are ornot exporters and have a foreign origin in order to reduce the variance ofthe propensity score and increase the efficiency of the estimate criterion;
h) calculation of the average and standard deviation of the propensity scoreof the innovating companies of new products in each of the four group-ings created;
i) identification of the innovating companies of new products if the propen-sity score is equal to or higher than the average, adding or subtractingfractions of the standard deviation of the propensity score of the inno-vating companies of their group;
j) classification of the companies in the project categories (companies A, Band C), after arbitrary choice of the fraction of the standard deviation;
k) definition of the calibration criterion for the choice of the fraction of thestandard deviation, obtaining, in the PIA-2000, the percentage figure ofcompanies in the project categories that was near that of the PINTEC-2000;
l) choice of the average of the propensity score as that which adjusts better;
m) estimation of the condition of being or not innovative of new productsfor the market based on the model and the average propensity score ofthe groupings of companies.
After estimation of the probabilistic model, the averages of various char-acteristics of the companies of each of the three project categories were com-pared to check the consistency of the classifications of the sampling plan ofPIA and PINTEC. Close resemblance was found between these characteristics,confirming the consistency of the procedures carried out.
This database covers, therefore, the post trade-opening and privatizationperiod in the late nineties and early years of this decade. Thus, industrialfirms were already more exposed to import competition and benefited morefrom international technology transfers of both tangible technologies, espe-cially capital goods, and intangible ones, such as licensing, R&D purchasesand external technological services. Additionally, privatization of both in-termediate goods and public-utility companies changed their behavior andinnovating strategies.
Model’s variables
The starting point of econometric specification follows Sternberg & Arndt(2001) in order to provide an international empirical comparability, in this
112 Gonçalves, Lemos, De Negri Economia Aplicada, v.15, n.1
case with regions of the European Union countries. Some adaptations weremade in order to contemplate availability of variables in the database.
These authors use introduction of product innovation and, alternately,introduction of process innovation, as a dependent dummy variable in the1995-1999 period. Nevertheless, the database used is restricted to small andmedium-sized industrial firms. The first methodological difference in thisarticle is the use of a sample of industrial firms not limited to small andmedium-sized companies. The second regards the dependent variable, whichrefers to categories of companies with different innovation strategies, fromthose centered on new processes (predominantly in category B companies) tonew products, which allow the firm to lead domestic product markets andcharge premium prices in the international market. Inasmuch as our esti-mates are carried out by each category of firms (A and B) one can compareeach result with the empirical international bench mark.
Departing from these sample procedures we used two dependent vari-ables. The first is a dummy which receives the value of 1 if the firm is incategory A and zero if it is in categories B or C. The second, whose sample isrestricted to firms in categories B and C, the dummy receives the value of 1 ifthe firm is in category B and zero if it is in C. That is, the first dependent vari-able regards innovating firms which introduce product innovations able tocapture premium price in international markets. The second one includes theremaining innovating firms: product innovators without international pre-mium prices and process innovators which either export or do not export buthave similar efficiency standards.
The firm-level variables are: size of the firm, in-house R&D expenditure,total innovation expenditure (not including in-house R&D expenditure), ori-gin of the capital and differences in technological opportunities among sec-tors, connected to four major product-market categories: extractive products,durable consumer and capital goods, intermediary goods and nondurableconsumer goods.
The firm size variable is included to control the influence which differ-ences in size have on the capacity to innovate. This argument, which goesback to Schumpeter (1961), associates positively capacity for innovation andfirm size. Internal expenditure on R&D is included because it is the prin-cipal mechanism for identifying, assimilating and exploiting information orknowledge already existing in the environment, as well as for producing newknowledge useful in innovation (Cohen & Levinthal 1989).
Other disbursements with innovation, in addition to R&D, are consideredto capture the contribution of the purchase of unincorporated forms of tech-nological knowledge for innovation, which traditionally are very importantin developing countries (Fransman 1985). The control of the origin of capi-tal is included because the participation of branches of multinational compa-nies has always characterized the industrialization process of Latin Americaneconomies, conditioning, in the last resort, the innovation process in coun-tries. There is evidence that multinational companies participate activelyin the process of technological up-dating of countries such as Brazil, allow-ing the introduction of products and processes new to the Brazilian market,although already existing in the international market (Gonçalves & França2008). Intersectoral differences in innovation are considered by means of thedurable and capital goods producing sectors, intermediary and non-durableconsumption goods and mineral extraction goods because technological op-
The role of firm and territory in innovative activities 113
portunity varies intensely between sectors (Scherer 1965, Pavitt 1984).Of all the variables cited, only the first two above coincide with the speci-
fication in Sternberg & Arndt (2001) because of differences in the variable setof the two surveys. In addition to the reasons specified above, the variableswhich capture intersectoral technological differences and those that measureexternal disbursements with innovation and the origin of company capitalpossess the role of substituting two variables which the authors above in-cluded in their study, in accordance with the following explanation.
In order to substitute the variable related to the frequency of internal R&Dexpenditure we used the four product-market categories since they reflect dif-ferences in technological opportunities due to specific technological regimes,with distinct R&D frequencies. In fact, the alternative of using 2-digit CNAEsectors would more precisely capture sectoral differences in these opportuni-ties. However, two levels of estimation of the hierarchical model restrict useof several variables. Inclusion of 22 sectoral dummies could result in non-convergence of the model.
Regarding variables of firm’s network innovation, both internal and ex-ternal to the region, we used two proxies: intensity of external innovationexpenditure (that is, except in-house R&D) and origin of its capital. The for-mer represents technological transfers especially via purchase of machineryand equipment and R&D acquisition, which supposes innovation networksexternal to the firm. The second refers to transfers from abroad via internalhierarchy of foreign companies, that is an innovation network internal to thefirm. These two types of technology transfer are the most frequent innovationnetworks in late-industrializing countries, i.e., connections with suppliers ofcapital goods and technological services and intra-firm knowledge exchangesof multinational companies.
We used the following variables to measure the influence of the regionalenvironment in which the firms are located: adult population schooling, in-dustrialization level, patenting per capita, R&D expenditure intensity, ac-cessibility to São Paulo, and industrial and technological scales. This spec-ification closely resembles that of Sternberg & Arndt (2001). For the core-periphery accessibility the European Commission index, which defines howmuch a region is at the periphery of development, was substituted for theaccessibility to the city of São Paulo, considering its central position in theBrazilian urban hierarchy. We included the industrial and technological-scalevariables in order to measure effects of agglomeration economies. Presum-ably, they are indirectly linked to intra-regional networks which reflect lo-cal positive externalities since innovation depends both on concentration ofindustrial activities and existing technological production in the region, re-spectively. How can these regional variables affect innovative behavior of theindividual firm and, therefore, its position in the hierarchy of Brazilian firms?
Access to the city of São Paulo is a form of assessment of the extent towhich distance to the main Brazilian manufacturing and financial center af-fects a company’s propensity to innovate, which is decisive in the definitionof its hierarchical position. We expect that this variable is significant and itsnegative sign reveals the centrality of the city in terms of knowledge urbanhierarchy. Diniz & Gonçalves (2001) claim that the metropolitan area of SãoPaulo, despite problems of excessive urban agglomeration and traffic conges-tions, is still the primary location for development of intensive knowledge-related activities, due to modern services and presence of the headquarters of
114 Gonçalves, Lemos, De Negri Economia Aplicada, v.15, n.1
the main Brazilian and multinational companies. Although this metropolitanarea now has a lower share in the Brazilian industrial production, it is no-ticeable that it is still the preferred location of the most important Brazilianinnovating companies.
Schooling level, in turn, measured here by the percentage of the popu-lation over 25 years of age with 11 years or more of education, reflects theexistence of a regional labor market which can influence locational prefer-ences of firms more sensitive to employees’ skills to innovation generation.In the case of product-innovating firms with premium export prices (cate-gory A), this variable is expected to be positive and significant, while it is lessimportant for process-innovating companies with homogenous products (pre-dominant in category B), which employ less qualified labor than the former.The findings of De Negri & Salermo (2005) show that Brazilian manufactur-ing firms which employ more qualified labor are better able to differentiatetheir products and ensure their quality. The category A firms have employeeswith approximately nine years of schooling on average, while category B firmsemploy individuals having on average 7.6 years of schooling.
Taking into account the Marshallian external pecuniary economies, theindustrialization level of the region is expected to act as an important deter-minant of a firm’s propensity to innovate, in our case, its propensity to be clas-sified as category A or category B. However, it is our belief that the industrialenvironment generating pecuniary externalities is more important for inno-vations in type B companies than for innovations in type A companies, dueto locational patterns of these two types of company. The B companies seekto exploit scale economies internal to both the company and the localized in-dustrial agglomeration, while they do not depend on the innovating urbandiversified environments which generate the so-called Jacobian externalities(Jacobs 1969).
Thus, most firms in category B tend to seek either specialized peers ag-glomerations or A firms’ agglomerations where they are suppliers in the pro-duction chain. Others seek specific locational advantages, e.g. proximity tosources of raw materials. In the case of manufacturing sectors which produceintermediary inputs, most common in type B firms, the requirements for sup-ply of urban services are low and they could be located relatively far awayfrom large urban agglomerations, as in the case of integrated steel-workingplants. Type A Brazilian companies would, on the contrary, have greater needfor locations in large urban centers, and, thus, higher tolerance for high ur-ban costs, since part of their locational requirements is intimately linked tointensive information and knowledge activities, with strong territorial basesin more developed metropolitan areas (Lemos et al. 2005a,b).
Regarding the variables of patents per capita and R&D in the region, thereis strong evidence that they measure different aspects of the Brazilian inno-vation system. According to Albuquerque (2000), sectors prone to patentingcan reach a high number of patents even if little investment is made in for-mal R&D. Since Brazil has low participation in patents of more advancedand sophisticated technological classes (Albuquerque 2005), the variable ofpatents per capita is expected to capture the level of regional innovation, thuscapturing as well any tendency to make use of technological knowledge ex-ternalities. The variable of R&D in the region, on the other hand, seeks tocapture a different aspect of the innovation system, considering that this typeof expenditure is regarded as a pre-requisite for identification, assimilation
The role of firm and territory in innovative activities 115
and exploration of information or knowledge previously in existence in theenvironment (Cohen & Levinthal 1989). Other types of externalities may bederived from this type of expenditure, which justifies spatial agglomerationof firms to take advantage of efforts undertaken by neighboring R&D depart-ments of both large companies and state research institutions.
Scale variables are expected to be significant and positive in both inno-vation categories, given the importance of agglomeration economies for thebirth of innovations.
Last but not least the territorial scale is a relevant aspect of our database.Instead of a selected sample of regions, such as that used by Sternberg &Arndt (2001) for the European Union, our regions comprise the universe ofthe Brazilian territory. We chose the micro level for our territorial scale sincethe municipality level is too small and the states excessively large. We believethat the micro-region as defined by the Brazilian Institute of Geography andStatistics (IBGE) is suitable to undertake this study, providing simultaneouslystatistical power for the estimates, territorial diversity based on a reasonableset of municipalities, spatial economic scale and a comparative basis regard-ing the international literature.3
3.2 Logit and Hierarchical Regression Model
Evaluation of the contribution of endowments more related to firms and thoselinked to territory is carried out by means of logistic and hierarchical regres-sion models. The latter provides the distinctive advantage of carrying outestimates while simultaneously considering both levels of variable sets whichcharacterize the problem under study. The first level refers to characteristicsof individuals, namely the firms, while the second level refers to characteris-tics of the regions in which the firms are located.
According to Raudenbush & Bryk (2002), the use of hierarchical modelsmeets the following pre-requisites: 1) avoiding the need for choosing the mostappropriate level for dealing with data (more aggregated or disaggregated),thus avoiding ecological and atomistic fallacy problems (Hox 1995); 2) avoid-ing violation of the assumption of independence of observations; and 3) notignoring dependence between the two levels of data aggregation, which couldviolate the hypotheses of homoscedasticity and independent and identicallydistributed error terms in the linear regression model.
The logistic regression model can be formalized as follows (Greene 2003):
Y ∗ij = βkjXij + ε (1)
Where,
3The variables tested as determinants of the firm’s innovative behavior differ from the greatmajority of the variables used in the research design by IPEA and CEDEPLAR in order to avoidany risk of tautology. The latter includes only the following firm-level variables: number of em-ployees, industrial value-added/sales ratio, dummy for origin capital, dummy for technologicalcapability investments, average years of schooling of employees, average length of tenure, averagewages of employees, dummy for export and import conditions, dummy for export premium price,expenditures with royalties and technical assistance as percentage of sales, profits as percentageof sales, dummies for 3-digit industrial classification (CNAE sectors) and dummies for Brazilianstates. Our purpose was to identify the contribution of variables, both firm and regional-level,that go beyond the IPEA and CEDEPLAR’s categorization.
116 Gonçalves, Lemos, De Negri Economia Aplicada, v.15, n.1
Y ∗ij = continuous latent variable, non-observable, which represents the capac-ity to innovate of firm i in region j;
Xij = vector of k independent variables;
βkj = vector of k parameters to be estimated by the model;
ε = normally distributed error term with a mean of zero and constant vari-ance.
The hierarchical generalized linear model employed is in accordance toRaudenbush & Bryk (2002),4 taking the following form:
ηij = β0j + β1jX1ij + β2jX2ij + β3jX3ij + β4jX4ij
+ β5jX5ij + β6jX6ij + β7jX7ij + εij (2)
where subscripts i and j are indices, respectively, for level 1 and 2 units andηij is the logarithm of the odds ratio of success (in our case, log-odds ratio ofinnovation). Furthermore,
β0j = intercept;
βkj = parameters to be estimated by the model;
εij = random error term;
X1ij = dummy variable, which receives value if the company has more than50% of its capital held by foreigners (a multinational subsidiary), andzero otherwise;
X2ij = dummy variable, which takes on the value of unity if he company pro-duces goods from the extractive industry, and zero otherwise;
X3ij = dummy variable, which takes on the value of unity if the company pro-duces durable consumer goods and capital goods, and zero otherwise;
X4ij = dummy variable, which takes on the value of unity if the companyproduces intermediate goods, and zero otherwise;
X5ij = size of the firm, measured by the logarithm of employees;
X6ij = R&D intensity, measured by logarithm of in-house R&D expenditurein relation to sales of the firm;
X7ij = intensity of innovation expenditure (except in-house R&D), as mea-sured by the ratio of logarithm of total innovation expenditure of thefirm (machinery and equipment, R&D purchase, other external knowl-edge, training, industrial projects and introduction of market innova-tion) to firm’s ouput;
4The HLM 5.0 statistic package is used in estimation of the hierarchical regression.
The role of firm and territory in innovative activities 117
The β estimates in the equation above make possible to generate a pre-dicted log-odds ratio, considering the chosen link function. Thus, the con-version of the log-odds ratio into a predicted probability for innovation isachieved by computing:
ϕij =1
1+ exp(
−ηij)
In its simplest case, the level-2 model will contain a random term, with β0labeled as random effect variable and expressed as follows:
β0j = γ00 + u0j , (3)
with u0j ∼N (0,τ00) and,
γ00 = average of log-odds ratio of innovation across regions;
τ00 = variance of the log-odds ratio regional average.
After estimation of this simpler case, which is also labeled unconditionalmultilevel model and checking if variance is significantly different from zero5,we proceed to step-by-step inclusion of variables explaining the intercept. Atthis point, variance in this model becomes conditional. Inclusion and statis-tical significance of these explanatory variables mean that the average prob-ability of a firm being innovative varies among regions due to characteristicsof the context in which they are located. These contextual characteristics canbe represented as shown in the following model:
β0j = γ00 +7∑
s=1
γ07Z7j + u0j , (4)
where,
Z1j = regional accessibility, measured by the distance from the largest city inthe region to the reference city (São Paulo);
Z2j = regional schooling level of adult population;
Z3j = regional industrialization level, measured by the percentage of the re-gional work force employed by industries;
Z4j = regional innovation index, measured by the ratio patent applications toregional population;
Z5j = regional R&D intensity index, measured by the ratio R&D regional ex-penditure to regional industrial value-added;
Z6j = regional industrial scale, measured by the proportion of regional in-dustrial output to national industrial output;
Z7j = regional technological scale, measured by the proportion of regionalpatent applications to the total of national patent applications.
5Whenever variance is not significantly different from zero, there is no statistical justificationfor inclusion of variables explaining the intercept.
118 Gonçalves, Lemos, De Negri Economia Aplicada, v.15, n.1
The specification above makes it possible to test the hypothesis whichstates that intra-regional technological-knowledge externalities, measured bypatents per capita and by the regional R&D intensity index, affect innovationin Brazilian manufacturing firms significantly, controlling for other variableswhich the literature regards as relevant to regional innovation.
In order to guide contextual variable inclusion and estimates its impor-tance in terms of explaining intercept variability, the following expression isused:
Percentage of Explained Variance =τ̂00(unconditional) − τ̂00(conditional)
τ̂00(unconditional)
In the next section we describe the database and the dependent and inde-pendent variables included in this model.
4 Regression Results
The regression models for category A companies estimate factors contributingto the firm’s propensity to be A (dummy value of 1)6, i.e., a product innovatingfirm with export premium price (at least 30%). And the models for categoryB companies estimate the propensity of a firm to be B (dummy value of 1),i.e., a process-innovating in the domestic market and occasionally product-innovating with no export premium price, which can be both exporters andnon-exporters with similar productivity levels. In summary, estimation ofthe firms’ propensity to innovate is made indirectly by means of a typologybased on their marketing and innovating activities. In short, firms are roughlydivided into product-innovating per excellence (A firms), which have prod-uct differentiation as their main competitive strategy, and process-innovatingfirms, with more homogenous products, and competitive strategy focused onefficient production processes.
4.1 Results for category A Firms
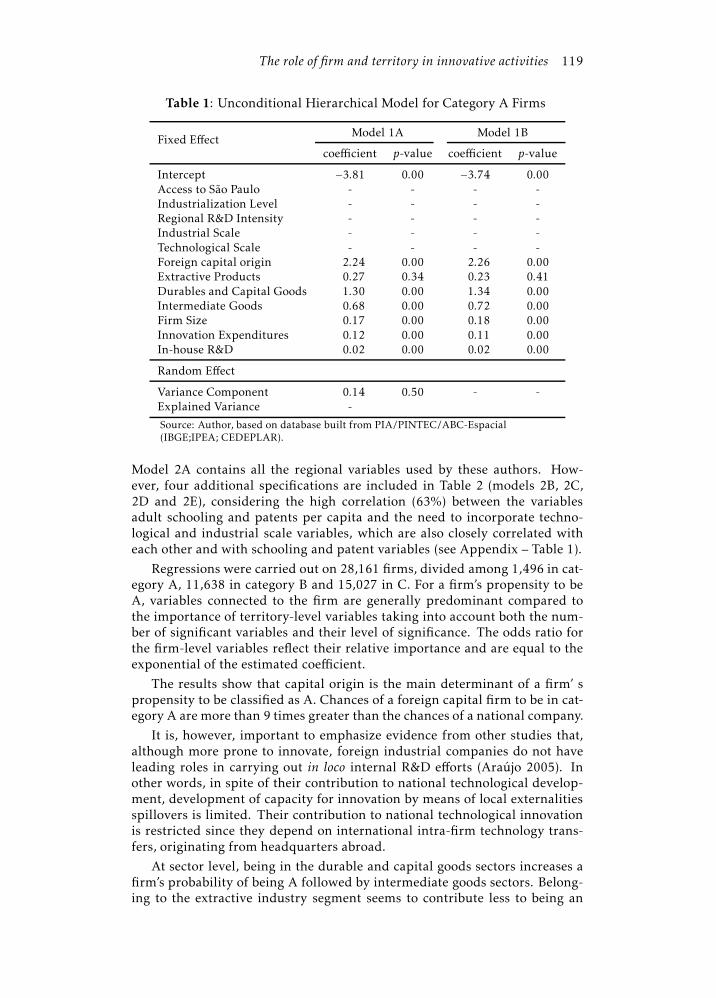
Table 1 shows the first specification of the hierarchical model, which was es-timated for category A innovating companies. It is the unconditional model,in which no regional variable is incorporated at level 2 (model 1A). The mainuse of this model is testing the null hypothesis of no difference between theintercept coefficients in Brazilian micro-regions. This hypothesis is not re-jected (see bottom part of table). This means that level-2 variables need notbe included in the explanation of intercept variability, given that it may beconsidered fixed among Brazilian micro-regions. This is no different fromsaying that in order to evaluate the importance of regional variables the logitregression model is sufficient. Model 1B is estimated with no random effects,yielding results similar to 1A.
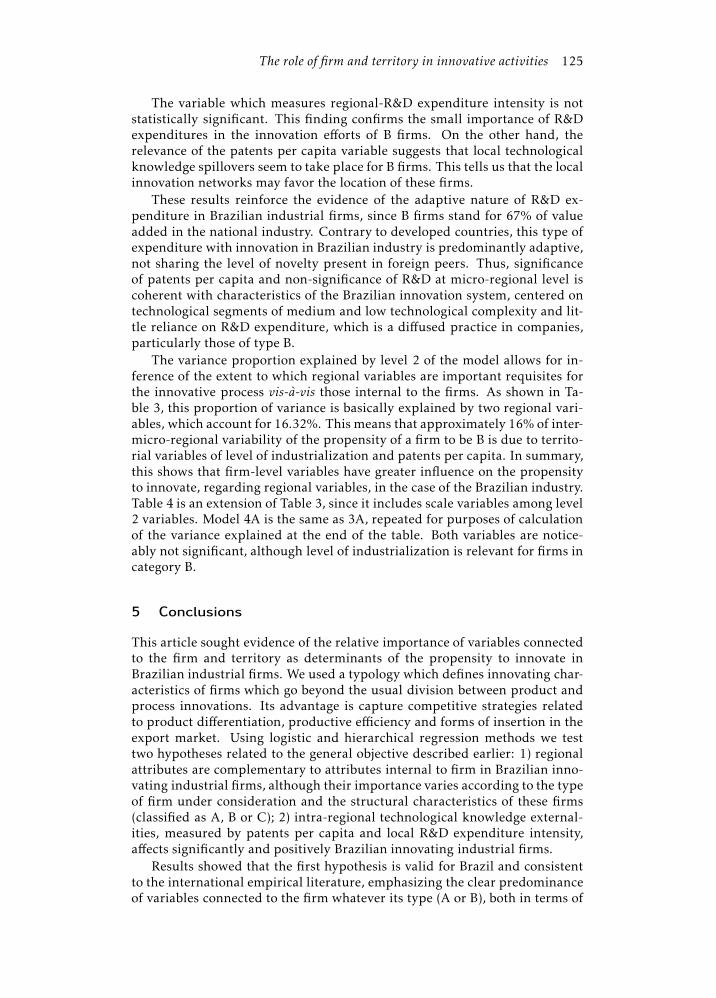
Table 2 contains three models constructed in line with the logistic spec-ification suggested by Sternberg & Arndt (2001), thus enabling comparisonof results, given some differences in dependent and explanatory variables.
6In the complete sample, B and C firms are represented by a dummy which receives zero asits value.
The role of firm and territory in innovative activities 119
Table 1: Unconditional Hierarchical Model for Category A Firms
Source: Author, based on database built from PIA/PINTEC/ABC-Espacial(IBGE;IPEA; CEDEPLAR).
Model 2A contains all the regional variables used by these authors. How-ever, four additional specifications are included in Table 2 (models 2B, 2C,2D and 2E), considering the high correlation (63%) between the variablesadult schooling and patents per capita and the need to incorporate techno-logical and industrial scale variables, which are also closely correlated witheach other and with schooling and patent variables (see Appendix – Table 1).
Regressions were carried out on 28,161 firms, divided among 1,496 in cat-egory A, 11,638 in category B and 15,027 in C. For a firm’s propensity to beA, variables connected to the firm are generally predominant compared tothe importance of territory-level variables taking into account both the num-ber of significant variables and their level of significance. The odds ratio forthe firm-level variables reflect their relative importance and are equal to theexponential of the estimated coefficient.
The results show that capital origin is the main determinant of a firm’ spropensity to be classified as A. Chances of a foreign capital firm to be in cat-egory A are more than 9 times greater than the chances of a national company.
It is, however, important to emphasize evidence from other studies that,although more prone to innovate, foreign industrial companies do not haveleading roles in carrying out in loco internal R&D efforts (Araújo 2005). Inother words, in spite of their contribution to national technological develop-ment, development of capacity for innovation by means of local externalitiesspillovers is limited. Their contribution to national technological innovationis restricted since they depend on international intra-firm technology trans-fers, originating from headquarters abroad.
At sector level, being in the durable and capital goods sectors increases afirm’s probability of being A followed by intermediate goods sectors. Belong-ing to the extractive industry segment seems to contribute less to being an
120 Gonçalves, Lemos, De Negri Economia Aplicada, v.15, n.1
innovating firm of this type.Size of the firm also increases the propensity to be A, although exerting
less influence than the previous characteristics. This result is in accordancewith the so-called “Schumpeterian hypothesis”, which states that larger firmsshould be more capable of innovating, especially concerning product differ-entiation (Cohen & Levinthal 1989).
Regarding inputs for the innovation process, in-house R&D expenditurehas far less impact on the propensity of the firm to be A than other innovatingexpenditure. Added to the importance of transnationals, this result reflectsfirms’ difficulties in internalizing innovation even among these top Brazilianfirms which are by definition the most dynamic, and which have the greatestcapacity for product differentiation in the country’s industrial structure. Thisis true despite distribution of internal R&D costs being concentrated in thelocal company headquarters unit.7 Therefore, a firm’s innovation process ismainly based on knowledge acquisition, and capital goods and services pur-chases, instead of in-house R&D efforts. In summary, such a weakness of theleading innovating firmsmay reflect on the inability to form networks of localexternalities fostering innovation in its stricter Schumpeterian sense, which iscommon in developed countries.
Regional-level variables, in turn, showed a positive and significant effectof the education variable in model 2C, which excludes the patents per capitavariable. This evidence corroborates results found by Lemos et al. (2005b) ,in which category A companies stand out as important users of highly skilledlabor.
The city of São Paulo seems to really exert strong attraction of product-innovating top Brazilian companies, since the coefficient of the variable accessto São Paulo is negative and statistically significant, no matter what specifica-tion is used.
Level of industrialization, measured by the logarithm of manufacturingemployment, is a significant locational factor for innovating companies inthis category at 3% in the model which excludes patents per capita (2C), al-though it is not significant in the model which excludes adult schooling (2B).In fact, this variable is expected to be of little relevance for category A in-novations, considering the fact that these companies are mostly concentratedin the metropolitan areas of the South and Southeast, especially São Paulo,where the high share of service activities reduces the relative importance ofmanufacturing.
The other two regional variables which try to identify externalities of tech-nological knowledge (patents per capita and regional R&D expenditure inten-sity) only patents per capita is significant.
Among variables which capture the influence of agglomeration economies,which are industrial and technological scales, none are verifiably significant(models 2D and 2E). These results are not favorable for manufacturing andtechnological concentration to explaining product premium innovations andare not expected taking into account the empirical literature on agglomerationeconomies, specially the findings for Brazil (Galinari et al. 2006). A possibleexplanation for this apparent paradox is the fact that the accessibility variablemay be capturing most of the geographical spillover effects since its signifi-
7In the case of companies with no branches, the local unit and the headquarters are necessar-ily the same.
The role of firm and territory in innovative activities 121
Table2:
Log
isticRegressionMod
elsforCategoryAFirm
s
Variables
Mod
el2A
Mod
el2B
Mod
el2C
Mod
el2D
Mod
el2E
coef.
p-val.
Odds
coef.
p-val.
Odds
coef.
p-val.
Odds
coef.
p-val.
Odds
coef.
p-val.
Odds
Ratio
Ratio
Ratio
Ratio
Ratio
Intercep
t−4.03
0.00
-−3.90
0.00
-−4.08
0.00
-−3.82
0.00
-−3.79
0.00
-
Region-Level
Variables
Accessto
SãoPa
ulo
−0.11
0.02
0.89
−0.14
0.00
0.87
−0.12
0.01
0.89
−0.18
0.00
0.84
−0.19
0.00
0.83
Adu
ltSchoo
ling
0.01
0.28
1.02
--
-0.03
0.02
1.03
--
--
--
Indu
strializationLevel
0.10
0.10
1.10
0.08
0.17
1.08
0.13
0.03
1.14
0.10
0.08
1.11
0.09
0.11
1.10
Patents
per
Cap
ita
0.06
0.03
1.06
0.07
0.00
1.08
--
--
--
--
-Regional
R&
DIntensity
−0.10
0.64
0.90
−0.07
0.76
0.94
−0.03
0.90
0.97
0.05
0.81
1.05
0.09
0.67
1.09
Indu
strial
Scale
--
--
--
--
-0.44
0.58
1.56
--
-Te
chnolog
ical
Scale
--
--
--
--
--
--
0.00
1.00
1.00
Firm
-Level
Variables
Originof
Cap
ital
2.25
0.00
9.44
2.25
0.00
9.52
2.23
0.00
9.32
2.24
0.00
9.43
2.25
0.00
9.45
ExtractiveProdu
cts
0.33
0.24
1.39
0.32
0.25
1.38
0.31
0.27
1.36
0.29
0.30
1.34
0.29
0.30
1.34
Durables
andCap
ital
Goo
ds
1.27
0.00
3.57
1.28
0.00
3.60
1.29
0.00
3.62
1.31
0.00
3.69
1.31
0.00
3.71
Interm
ediate
Goo
ds
0.67
0.00
1.95
0.68
0.00
1.97
0.67
0.00
1.96
0.69
0.00
1.99
0.69
0.00
2.00
Firm
Size
0.16
0.00
1.17
0.16
0.00
1.18
0.16
0.00
1.17
0.16
0.00
1.18
0.16
0.00
1.00
In-hou
seR&
D0.02
0.00
1.02
0.02
0.00
1.02
0.02
0.00
1.02
0.02
0.00
1.02
0.02
0.00
1.02
Innov
ationExp
enditures
0.12
0.00
1.12
0.12
0.00
1.12
0.12
0.00
1.12
0.12
0.00
1.12
0.12
0.00
1.12
Prob.
ofCorrect
Prediction
90,40%
90,40%
90,40%
90,30%
90,30%
Log
Likelihoo
d4.07
2,87
***
4.07
1,68
***
4.06
7,95
***
4.06
2,55
***
4.06
2,24
***
WaldStatistic
2.44
8,2*
**2.44
6,53
***
2.45
0,32
***
2.44
7,07
***
2.44
6,86
***
Numbe
rof
Firm
s-CategoryA:1
,496
Numbe
rof
Firm
sBan
dC:2
6,66
5***Statisticallysign
ificantat
1%So
urce:
Author,b
ased
ondatab
asebu
iltfrom
PIA
/PIN
TEC/A
BC-Esp
acial(IBGE;IPEA;C
EDEPLAR).
122 Gonçalves, Lemos, De Negri Economia Aplicada, v.15, n.1
cance and coefficient level do not reduce with the introduction of these scalevariables.
4.2 Results for Category B Firms
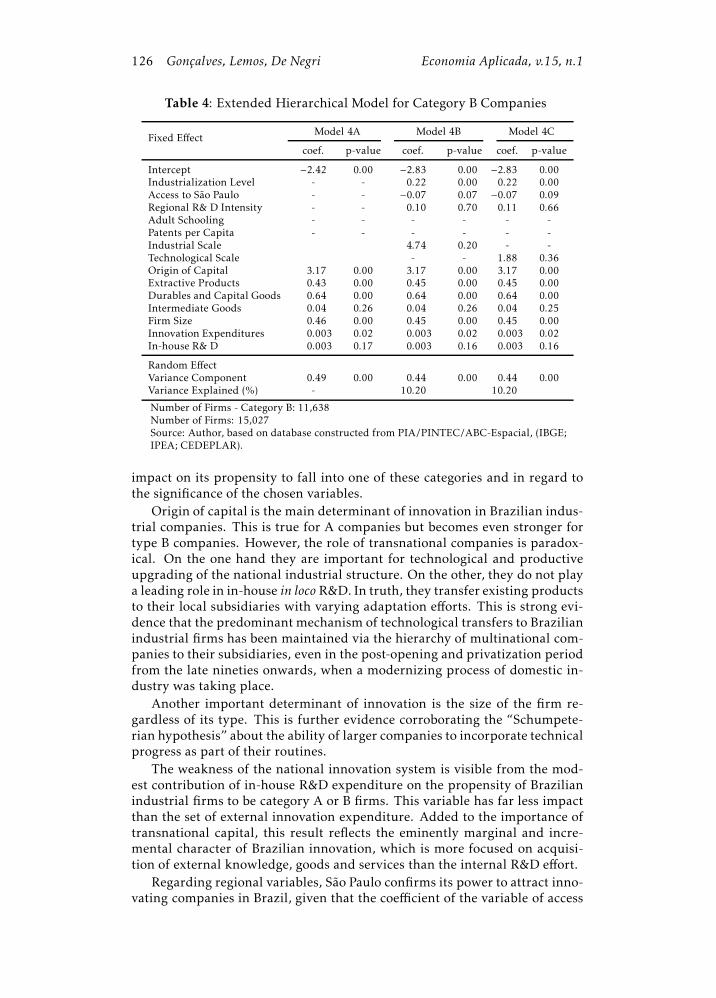
In this section, factors explaining the tendency of a firm to be classified as Bare estimated. Type A companies were removed from the sample and the de-pendent variable receives the value of one if the company belongs to categoryB and zero if it falls under category C. Exclusion of A firms in regression of Bfirms is in accordance with the assumption of technological progression fromone firm category to the next. Approximately 1,496 local units were removedfrom the sample, leaving 11,638 units in category B and 15,027 in category C.Table 3 contains six different specifications for explaining a firm’s propensityto be a category B company, with the B and C company sample. According toRaudenbush & Bryk (2002), the coefficients estimated by these models can beinterpreted as the expected difference in the log-odds ratio of a firm being B,associated with the increase of one unit in the explanatory variable, all elseremaining constant, as well as the value of the random effect (u0j).
Model 3A, which is unconditional, only has level-1 variables (firm at-tributes). Successive inclusion of explanatory variables at level 2, fromModel3B to 3F, increased explained intercept variance from10.20% to 16.32%. Level-1 variables had very stable coefficients regardless of the model specification,which indicates robustness of attributes of firms as explanatory factors for Bfirms. Thus, analysis of Model 6A results serves as analytical reference forlevel-1 variables.
Except for the dummy variables which represent the intermediate-goodssector and in-house R&D expenditures, all estimated parameters are verifi-ably highly significant and have the expected direction. If the firm belongs toa multinational group, the expected log-odds ratio for a firm to fall under cat-egory B is 3.17, which is 23.81 times higher than the odds ratio of a nationalfirm in the sample set. Since the estimated coefficient for this variable is theone with highest absolute value, this means the presence of firms which aresubsidiaries of multinational companies is the main entrepreneurial charac-teristic in terms of impact in the probability of a firm being classified as B, i.e.,scale-intensive, specialized in homogenous products, exporting (mostly) andfocused on process innovation. This result illustrates rather well how the factthat a firm’s efforts toward innovation in Brazil is still greatly influenced bytechnology transfers, especially know-how, resources, products and processesdeveloped by headquarters for later adaptation in the incumbent economy.
As in the case of type A firms size is positively associated with the log-odds ratio of a firm to be B, suggesting, according to literature, that largerfirms are better prepared for successful innovation. An increase of 1.12 units(one standard deviation) in the size of the company leads to an increase in thelog-odds ratio of 0.5152 or to a relative odds ratio of exp(0,5152) = 1,6740.These results corroborate the “Schumpeterian hypothesis” of the importanceof size for Brazilian manufacturing B firms for their capacity to innovate andgrow.
In terms of technological efforts, there is a clear preponderance of exter-nal innovation expenditure over in-house R&D given its non significance. Inaddition to purchases of knowledge incorporated into machinery and equip-ment this comparison also shows the importance of acquiring external disem-
The role of firm and territory in innovative activities 123
bodied knowledge to innovate in B companies. This is an important differenceof B firms from the A firms. These, unlike B firms, undertake some internalR&D effort despite being less important than external innovation expendi-ture.
Unconditional intercept variance estimates in Table 3, i.e., random effectsof the models, show that the probability value enables rejection of the nullhypothesis at 0.1% that the intercept is fixed, in favor of the alternative hy-pothesis that Model 3A intercept is random at level 2. This result justifiesinclusion of level-2 variables to model the intercept.
Model 3B, which contains the first regional level-2 variable included inthis study, shows that the level of industrialization explains intercept vari-ance, by approximately 10.20%. This means that 10% of the variation in theaverage tendency of a company to fall under the B category is explained bythe differences, in terms of in differences of industrialization level observedamong micro-regions.
With successive inclusion of explanatory variables at level 2, the percent-age of variance explained in models 3C to 3F increases gradually to 16.32%.Model 3F contributes most to explaining this variance, despite some variablesincluded, such as access to São Paulo and R&D intensity in the micro-region,are not statistically significant. Thus, in this model, approximately 16% of thevariance is explained by inclusion of level of industrialization and patents percapita.
Access to the São Paulo micro-region does not seem to be a fundamentaldeterminant of this category, unlike category A companies whose proximityto a network of highly qualified services matters. On the other hand, thepercentage of adults with over 11 years of education is relevant as a locationalrequisite for type B companies at the 10% level (model 6E).
The secondmost important variable to explain intercept variance is patentsper capita. This means that the probability of finding an innovating B com-pany is higher when themicro-region has high performance in terms of patentsper capita. This evidences that an effort to innovate exists as a result of patent-ing activities in locally established B firms, which may enable intra-micro-regional technological knowledge spillovers among companies. The search byB firms for more innovating regions may reflect locational strategies to takeadvantage of these externalities, albeit taking place in segments of lesser tech-nological intensity. As shown by Albuquerque (2005), the Brazilian patentingactivity is predominant in low to middle-technology sectors, as in the scopeof “family consumption” and “mechanical components”, with little emphasisplaced on the scope of more advanced technology, such as “biotechnology”,“semiconductors” and “organic and macromolecular chemistry”.
Findings that the most relevant regional variables are level of industrial-ization and patents per capita lead us to conclude that type B firms have loca-tional behavior of greater proximity to industrialized regions with large con-sumer markets compared to C firms, which are more geographically spreadout and seek local and regional markets. According to Lemos et al. (2005a) ,type B companies follow a locational behavior intended to maximize internalscale advantages either being durable consumer-goods producers or interme-diate goods ones. Thus, part of the B firms tends to agglomerate with eachother or among A companies. Others search for specific locational advan-tages, such as proximity to sources of raw material.
124 Gonçalves, Lemos, De Negri Economia Aplicada, v.15, n.1
Table3:
HierarchicalM
odel
forInnov
atingFirm
s–CategoryB
FixedEffect
Mod
el3A
Mod
el3B
Mod
el3C
Mod
el3D
Mod
el3E
Mod
el3F
coef.
p-val.
coef.
p-val.
coef.
p-val.
coef.
p-val.
coef.
p-val.
coef.
p-val.
Intercep
t−2.42
0.00
−2.94
0.00
−2.81
0.00
−2.81
0.00
−3.08
0.00
−2.92
0.00
Indu
strializationLevel
--
0.24
0.00
0.23
0.00
0.22
0.00
0.23
0.00
0.18
0.00
Accessto
SãoPa
ulo
--
--
−0.07
0.07
−0.07
0.07
−0.01
0.76
−0.01
0.76
Reg
ional
R&D
Intensity
--
--
--
0.13
0.62
0.14
0.59
−0.04
0.87
Adu
ltScho
oling
--
--
--
--
0.04
0.04
--
Patents
per
Cap
ita
--
--
--
--
--
0.21
0.00
Originof
Cap
ital
3.17
0.00
3.17
0.00
3.17
0.00
3.17
0.00
3.17
0.00
3.17
0.00
ExtractiveProdu
cts
0.43
0.00
0.44
0.00
0.45
0.00
0.45
0.00
0.46
0.00
0.46
0.00
Durables
andCap
ital
Goo
ds
0.64
0.00
0.64
0.00
0.64
0.00
0.64
0.00
0.64
0.00
0.64
0.00
Interm
ediate
Goo
ds
0.04
0.26
0.03
0.27
0.04
0.24
0.04
0.24
0.04
0.24
0.04
0.25
Firm
Size
0.46
0.00
0.45
0.00
0.45
0.00
0.45
0.00
0.45
0.00
0.45
0.00
Innov
ationExp
enditures
0.00
30.02
0.00
30.02
0.00
30.02
0.00
30.02
0.00
30.02
0.00
30.02
In-hou
seR&D
0.00
30.17
0.00
50.16
0.00
30.16
0.00
30.16
0.00
30.16
0.00
30.17
Ran
dom
Effect
Variance
Com
pon
ent
0.49
0.00
0.44
0.00
0.43
0.00
0.44
0.00
0.43
0.00
0.41
0.00
Variance
Exp
lained
(%)
-10
.20
12.24
10.20
12.24
16.32
Numbe
rof
Firm
s-CategoryB:1
1,63
8Numbe
rof
Firm
s-CategoryC:1
5,02
7So
urce:
Author,b
ased
ondatab
asebu
iltfrom
PIA
/PIN
TEC/A
BC-Esp
acial(IBGE;IPEA;C
EDEPLAR).
The role of firm and territory in innovative activities 125
The variable which measures regional-R&D expenditure intensity is notstatistically significant. This finding confirms the small importance of R&Dexpenditures in the innovation efforts of B firms. On the other hand, therelevance of the patents per capita variable suggests that local technologicalknowledge spillovers seem to take place for B firms. This tells us that the localinnovation networks may favor the location of these firms.
These results reinforce the evidence of the adaptive nature of R&D ex-penditure in Brazilian industrial firms, since B firms stand for 67% of valueadded in the national industry. Contrary to developed countries, this type ofexpenditure with innovation in Brazilian industry is predominantly adaptive,not sharing the level of novelty present in foreign peers. Thus, significanceof patents per capita and non-significance of R&D at micro-regional level iscoherent with characteristics of the Brazilian innovation system, centered ontechnological segments of medium and low technological complexity and lit-tle reliance on R&D expenditure, which is a diffused practice in companies,particularly those of type B.
The variance proportion explained by level 2 of the model allows for in-ference of the extent to which regional variables are important requisites forthe innovative process vis-à-vis those internal to the firms. As shown in Ta-ble 3, this proportion of variance is basically explained by two regional vari-ables, which account for 16.32%. This means that approximately 16% of inter-micro-regional variability of the propensity of a firm to be B is due to territo-rial variables of level of industrialization and patents per capita. In summary,this shows that firm-level variables have greater influence on the propensityto innovate, regarding regional variables, in the case of the Brazilian industry.Table 4 is an extension of Table 3, since it includes scale variables among level2 variables. Model 4A is the same as 3A, repeated for purposes of calculationof the variance explained at the end of the table. Both variables are notice-ably not significant, although level of industrialization is relevant for firms incategory B.
5 Conclusions
This article sought evidence of the relative importance of variables connectedto the firm and territory as determinants of the propensity to innovate inBrazilian industrial firms. We used a typology which defines innovating char-acteristics of firms which go beyond the usual division between product andprocess innovations. Its advantage is capture competitive strategies relatedto product differentiation, productive efficiency and forms of insertion in theexport market. Using logistic and hierarchical regression methods we testtwo hypotheses related to the general objective described earlier: 1) regionalattributes are complementary to attributes internal to firm in Brazilian inno-vating industrial firms, although their importance varies according to the typeof firm under consideration and the structural characteristics of these firms(classified as A, B or C); 2) intra-regional technological knowledge external-ities, measured by patents per capita and local R&D expenditure intensity,affects significantly and positively Brazilian innovating industrial firms.
Results showed that the first hypothesis is valid for Brazil and consistentto the international empirical literature, emphasizing the clear predominanceof variables connected to the firm whatever its type (A or B), both in terms of
126 Gonçalves, Lemos, De Negri Economia Aplicada, v.15, n.1
Table 4: Extended Hierarchical Model for Category B Companies
Number of Firms - Category B: 11,638Number of Firms: 15,027Source: Author, based on database constructed from PIA/PINTEC/ABC-Espacial, (IBGE;IPEA; CEDEPLAR).
impact on its propensity to fall into one of these categories and in regard tothe significance of the chosen variables.
Origin of capital is the main determinant of innovation in Brazilian indus-trial companies. This is true for A companies but becomes even stronger fortype B companies. However, the role of transnational companies is paradox-ical. On the one hand they are important for technological and productiveupgrading of the national industrial structure. On the other, they do not playa leading role in in-house in loco R&D. In truth, they transfer existing productsto their local subsidiaries with varying adaptation efforts. This is strong evi-dence that the predominant mechanism of technological transfers to Brazilianindustrial firms has been maintained via the hierarchy of multinational com-panies to their subsidiaries, even in the post-opening and privatization periodfrom the late nineties onwards, when a modernizing process of domestic in-dustry was taking place.
Another important determinant of innovation is the size of the firm re-gardless of its type. This is further evidence corroborating the “Schumpete-rian hypothesis” about the ability of larger companies to incorporate technicalprogress as part of their routines.
The weakness of the national innovation system is visible from the mod-est contribution of in-house R&D expenditure on the propensity of Brazilianindustrial firms to be category A or B firms. This variable has far less impactthan the set of external innovation expenditure. Added to the importance oftransnational capital, this result reflects the eminently marginal and incre-mental character of Brazilian innovation, which is more focused on acquisi-tion of external knowledge, goods and services than the internal R&D effort.
Regarding regional variables, São Paulo confirms its power to attract inno-vating companies in Brazil, given that the coefficient of the variable of access
The role of firm and territory in innovative activities 127
to São Paulo is negative and statistically significant for the type of innovatingfirm taken as reference for this study (A companies). Industrialization levelis a relevant locational factor for innovating companies, although its impor-tance is more evident in category B companies than in those of category A.The relevant role of adult population schooling in both types of companies isalso noteworthy.
Of the two regional variables which seek to capture the existence of intra-micro-regional externalities of technological knowledge (patents per capitaand micro-regional R&D intensity), only patents per capita were statisticallysignificant for companies in both categories A and B. This result shows thatthe second hypothesis in this study is only partially confirmed. Significanceof patents per capita and the lack of micro-regional R&D significance is co-herent with characteristics of the Brazilian innovation system, centered ontechnological segments of low and middle complexity and low in-house R&Dexpenditures, especially for type B firms.
Variables of industrial and technological scales were not significant forclassification in both categories of firms, a finding which may best be ex-plained by statistical problems rather than non-relevance of these variables,given their role in theoretical and empirical literature.Their strong correla-tion with both the accessibility and education variables show the statisticaldifficulties in handling adequately these scale variables.8
Despite methodological differences, some comparisons between this ar-ticle and Sternberg & Arndt (2001) can be made. The common point is thatvariables referring to territory are secondary to those regarding the firm. Nev-ertheless, level of industrialization, patents per capita and R&D intensity ofthe micro-region increases the probability of innovating, especially productinnovations estimated by the propensity to be an A firm. In the case of Brazil,level of industrialization is also important, as well as proximity to São Paulo.The greater the distance to this metropolitan micro-region, the less likely itis to find category A or B companies, although this result is notably more im-portant for category A companies. Schooling of the local working populationis also relevant in both cases.
A striking difference between the two studies is the importance of thethree R&D dimensions captured by the European survey, considering botha regional indicator, measuring R&D expenditure to Gross Domestic Product,and firm-level indicators, measuring in-house R&D and R&D frequency. InplaceEurope, they were considered relevant in product innovations, but not inprocess innovations. In Brazil, internal R&D expenditure is relevant, particu-larly in category A companies. On the other hand, regional R&D intensity wasnot significant in any of the regressions, which could reveal differences in thenature of innovations among European countries and late-industrializationcountries related to the importance of intra-regional networks to innovate.
Territorial connection networks formed by small and medium Europeanfirms were not statistically significant in the model for product innovations.But, in the case of process innovations, statistical significance was found bothin intra- and inter-regional links. In the case of Brazil, inter-firm links wereindirectly measured by total innovation expenditure external to the firm and
8It should be noted that in Table 1 of the Appendix, for instance, the correlation matrix for thewhole sample of companies indicates correlation of these variables with the variable of educationof 0.78 and 0.75, respectively.
128 Gonçalves, Lemos, De Negri Economia Aplicada, v.15, n.1
by origin of capital. Both variables are very important for both categoriesof firms, corroborating the importance of links between innovators and sup-pliers of capital goods and subsidiaries with headquarters of multinationalcompanies.
Another difference is found in the fact that size of the company mattersconsiderably in Brazil, but not in the study of the authors mentioned above.The reason for this is probably the inexistence of large firms in the Europeansample.
Bibliography
Albuquerque, C. R. (2005), Taxas de câmbio e inflação no Brasil: Um estudoeconométrico, PhD thesis, UFRGS.
Albuquerque, M. E. (2000), ‘Domestic patents and developing countries: ar-guments for their study and data from brazil (1980-1995).’, Research Policy29, 1047 – 1060.
Amin, A. & Thrift, N. (1994), Living in the global., in ‘Globalization, institu-tions, and regional development in Europe.’, Oxford University.
Araújo, B. C. P. O. (2005), Os determinantes do comércio internacional aonível da firma: Evidências empíricas, Textos para discussão, IPEA.
Azzoni, C. R. (1997), ‘Concentração regional e dispersão das rendas percapita estaduais: análise a partir de séries históricas estaduais de pib, 1939-1995’, Estudos Econômicos 27, 341 – 393.
Carlino, A. G., Chatterjee, S. & Hunt, R. M. (2007), ‘Urban density and therate of invention’, Journal of Urban Economics 61, 389 – 419.
Chandler, A. D. (1962), Strategy and structure, Technical report, Cambridge:MA, MIT Press.
Chandler, A. D. (1977), The visible hand: the managerial revolution in amer-ican business, Technical report, Cambridge, Mass.: Belknap.
Chandler, A. D. (1992), ‘Organizational capabilities and the economic his-tory of the industrial enterprise’, Journal of Economic Perspectives 6, 79 – 100.
Cohen, W. M. & Levinthal, D. A. (1989), ‘Innovation and learning: the twofaces of r&d’, Economic Journal 99, 569 – 596.
De Negri, J. A. & Salermo, M. S. (2005), Inovações, padrões tecnológicose desempenho das firmas industriais brasileiras, in ‘Inovação, padrões tec-nológicos e desempenho das firmas industriais brasileiras’, IPEA, Brasília,pp. 5–46.
Diniz, C. C. & Gonçalves, E. (2001), Knowledge economy and regional de-velopment in brazil., in ‘LES TROISIÈMES JOURNÉES DE LA PROXIMITÉ= THE THIRD CONGRESS ON PROXIMITY, Paris, França’.
Domingues, E. P. & Ruiz, R. M. (2005), Industrial cores and peripheries inbrazil, Technical report, Belo Horizonte: UFMG.
The role of firm and territory in innovative activities 129
Dosi, G. (1988), The nature of the innovative process, in ‘Technical changeand economic theory’, Pinter Publishers, London, pp. 221–238.
Feldman, M. P. & Florida, R. (1994), ‘The geographic sources of innovation:technological infrastructure and product innovation in the united states’,Annals of the Association of American Geographers 84, 210 – 229.
Foss, N. J. (1997), Resources and strategy: a brief overview of themes andcontributions, in ‘Resources, firms and strategies: a reader in the resource-based perspective’, Nova York: Oxford University Press.
Fransman, M. (1985), ‘Conceptualizing technical change in the third worldin the 1980’s: an interpretive survey’, Journal of Development Studies21(4), 572–652.
Galinari, R., Lemos, M. B. & Amaral, P. (2006), Retornos crescentes urbanos:a influência do espaço na diferenciação da taxa salarial no Brasil., in ‘Tec-nologia, Exportação e Emprego’, Brasília: IPEA.
Gonçalves, F. O. & França, M. T. A. (2008), ‘Transmissão intergeracionalde desigualdade e qualidade educacional: avaliando o sistema educacionalbrasileiro a partir do saeb 2003’, Ensaio: avaliação de políticas públicas emEducação 16.
Grant, R. M. (1996), ‘Toward a knowledge-based theory of the firm’, StrategicManagement Journal 17, 109 – 122.
Greene, W. H. (2003), Econometric Analysis, Prentice-hall.
Harrison, B., Kelley, M. & Gant, J. (1996), ‘Innovative firm behavior and localmilieu: exploring the intersection of agglomeration, firm effects, and techno-logical change’, Economic Geography 72, 233 – 258.
Hox, J. J. (1995), Applied multilevel analysis, Publikaties.
Jacobs, J. (1969), The economie of cities, Random House, New York.
Jaffe, A. B. (1989), ‘Real effects of academic research’, The American EconomicReview 79(5), 957–970.
Lemos, M. B., Moro, S., Domingues, E. P. & Ruiz, R. M. (2005a), Espaçospreferenciais e aglomerações industriais, in ‘Inovação, Padrões Tecnológicose Desempenho das Firmas Industriais Brasileiras’, IPEA.
Lemos, M. B., Moro, S., Domingues, E. P. & Ruiz, R. M. (2005b), A organi-zação territorial da indústria no Brasil, in ‘Inovação, padrões tecnológicos edesempenho das firmas industriais brasileiras’, IPEA.
Lundvall, B. (1992), National systems of innovation: towards a theory ofinnovation and interactive learning, Technical report, London: Pinter.
Malecki, E. J. (1997), Technology and economic development: the dynamics oflocal, regional, and national competitiveness, New York : Longman.
Markusen, A. (2005), Mudança econômica refional segundo o enfoque cen-trado no autor, in ‘Economia e território’, UFMG, Belo Horizonte, pp. 57–75.
130 Gonçalves, Lemos, De Negri Economia Aplicada, v.15, n.1
Markusen, A., Hall, P. & Glasmeier, A. (1986), High tech America: the what,how, where and why of the sunrise industries, Boston: Allen & Unwin.
Méndez, R. (2002), ‘Innovación y desarrollo territorial: algunos debatesteóricos recientes’, Revista EURE 28, 63 – 83.
Nelson, C. & Plosser, C. (1982), ‘Trends and random walks in macroeco-nomics time séries’, Journal of Monetary Economics 10, 139–162.
Nelson, R. (1988), Institutions supporting technical change in the unitedstates, inG. Dosi, C. Freeman, R. Nelson, G. Silverberg & L. Soete, eds, ‘Tech-nical change and economic theory’, London: Pinter.
Nelson, R. (1996), Why do firms differ, and how does it matter?, in ‘Thesources of economic growth’, Cambridge: Havard University.
Nelson, R. & Winter, S. G. (1982), An evolutionary theory of economic change,Cambridge: Harvard University.
Pavitt, K. (1984), ‘Sectoral patterns of technical change: towards a taxonomyand a theory’, Research Policy 13 - 6, 343 – 373.
Penrose, E. (1959), The growth of the firm, Technical report, Oxford: BasilBlackwell.
Raudenbush, W. S. & Bryk, A. S. (2002), Hierarchical linear models: applica-tions and data analysis methods, London, New Deli: Sage.
Richardson, G. B. (1972), ‘The organisation of industry’, Economic Journal82(327), 883–896.
Scherer, F. M. (1965), ‘Firm size, market structure, opportunity, and the out-put of patented inventions’, American Economic Review 55 - 5, 1097 – 1125.
Schumpeter, J. A. (1961), Capitalismo, socialismo e democracia, Rio de Janeiro:Fundo de Cultura.
Sternberg, R. & Arndt, O. (2001), ‘The firm or the region: what determinesthe innovation behavior of european firms?’, Economic Geography 77, 364 –382.