28
The Role of GIS in Emergency Planning City of Philadelphia Office of Emergency Management
The Role of GIS in Emergency Planning
City of Philadelphia
Office of Emergency Management

Overview
• OEM
• Emergency Planning
• Role of GIS
– Evacuation plan
– Hazard-specific plans
– Operations planning
OEM Mission
The Philadelphia Office of Emergency Management is responsible for ensuring the preparedness of the City of Philadelphia through the judicious planning, assignment, and coordination of all available resources in an integrated program of prevention, mitigation, preparedness, response, and recovery for emergencies of any kind

Implementing the Mission
• Work to mitigate the impact of emergencies • Educate the public on disaster preparedness • Oversee development of the City’s plans for
large-scale emergencies and disasters • Conduct training programs and disaster exercises
to evaluate the effectiveness of plans • Coordinate and support responses to and
recovery from emergencies • Collect, analyze, and disseminate incident
information

Implementing the Mission with GIS
• Work to mitigate the impact of emergencies – Hazard analysis and risk modeling
• Educate the public on disaster preparedness – Interactive web application and public maps
• Oversee development of the City’s plans for large-scale emergencies and disasters – Geospatial analysis and modeling
• Coordinate and support responses to and recovery from emergencies – Situational awareness applications and recovery workflows
• Collect, analyze, and disseminate incident information – Geospatial analysis and incident maps
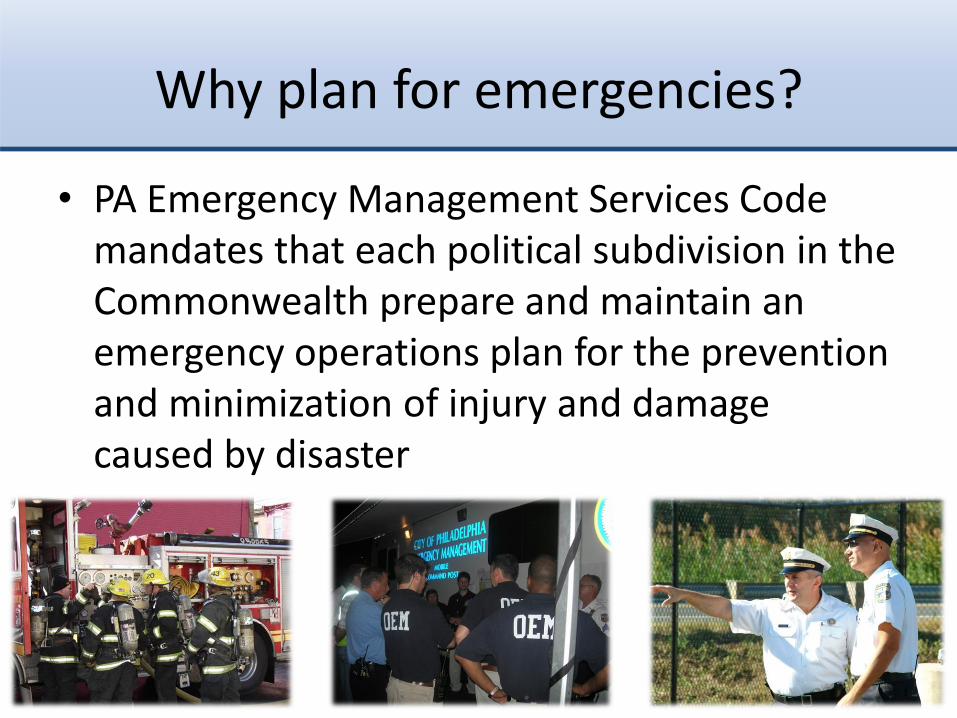
Why plan for emergencies?
• PA Emergency Management Services Code mandates that each political subdivision in the Commonwealth prepare and maintain an emergency operations plan for the prevention and minimization of injury and damage caused by disaster
Emergency Planning for Philadelphia
• Plans need to address the complexities of emergency response in a densely populated urban area
• Demands a more detailed, operationally-oriented planning process
• Special considerations
– Large population with special needs
– Critical infrastructure and sensitive facilities

Emergency Operations Plan
• Presents a collection of strategies and procedures
• Assigns roles and responsibilities to organizations to manage an emergency incident or a planned event across all phases of an incident
• Communicates a holistic approach to managing an emergency incident or planned event

Component Emergency Plans
• Human Services – Shelter and Mass Care – Disaster Mental Health – Vulnerable Populations – Animals and Pets
• Health and Medical – Healthcare Facility
Preparedness – Mass Casualty
• Recovery – Damage Assessment – Debris Removal
• Transportation and Infrastructure – Evacuation – Transportation
Emergencies – Infrastructure and Utility
Emergencies
• Hazard Specific – Heat Emergency – Winter Weather – Flood Emergency – Coastal Storm/Hurricane
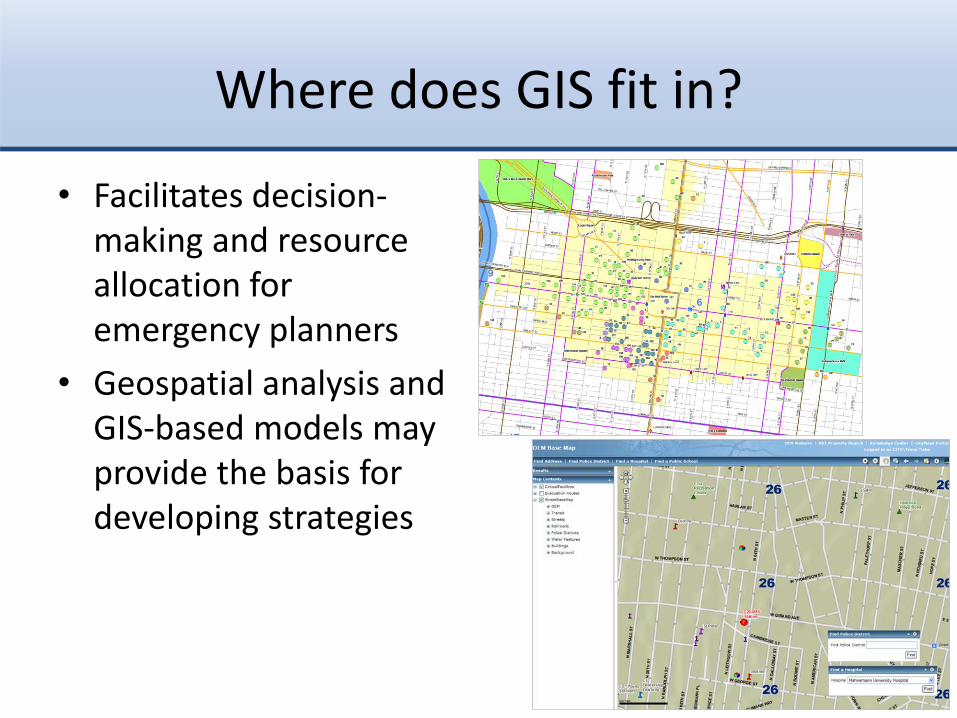
Where does GIS fit in?
• Facilitates decision-making and resource allocation for emergency planners
• Geospatial analysis and GIS-based models may provide the basis for developing strategies
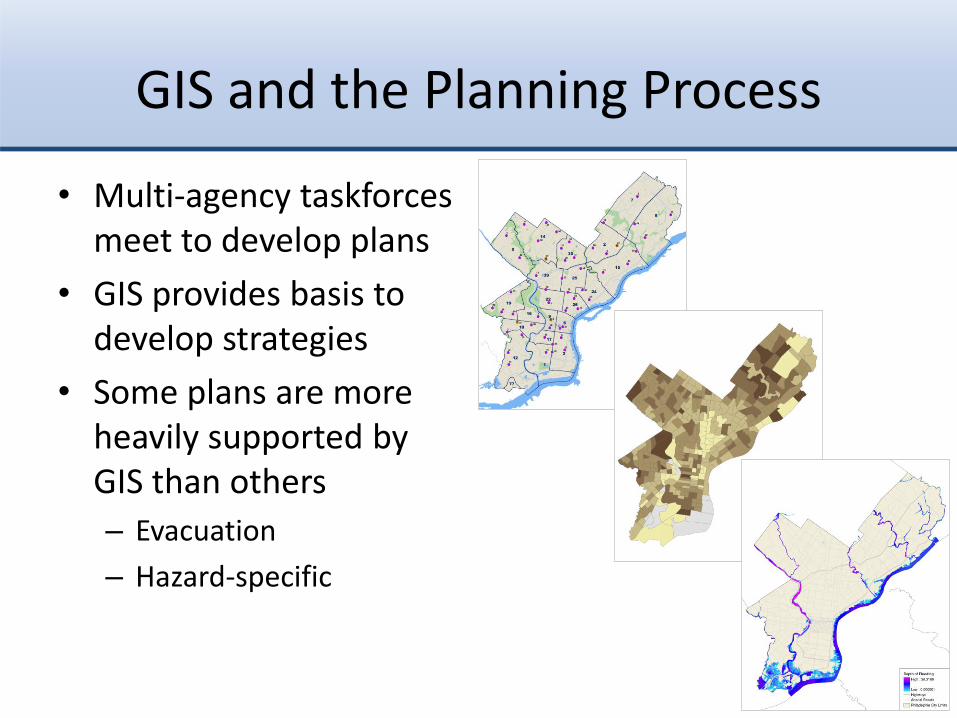
GIS and the Planning Process
• Multi-agency taskforces meet to develop plans
• GIS provides basis to develop strategies
• Some plans are more heavily supported by GIS than others
– Evacuation
– Hazard-specific
EVACUATION PLAN

Evacuation Plan
• Evacuation Routes
• High-rise building evacuation rallying points – Center City
– University City
• Communities with unique needs – Sports Complex
– Sunoco
– Frankford/Bridesburg
• Regional, cross-border evacuation
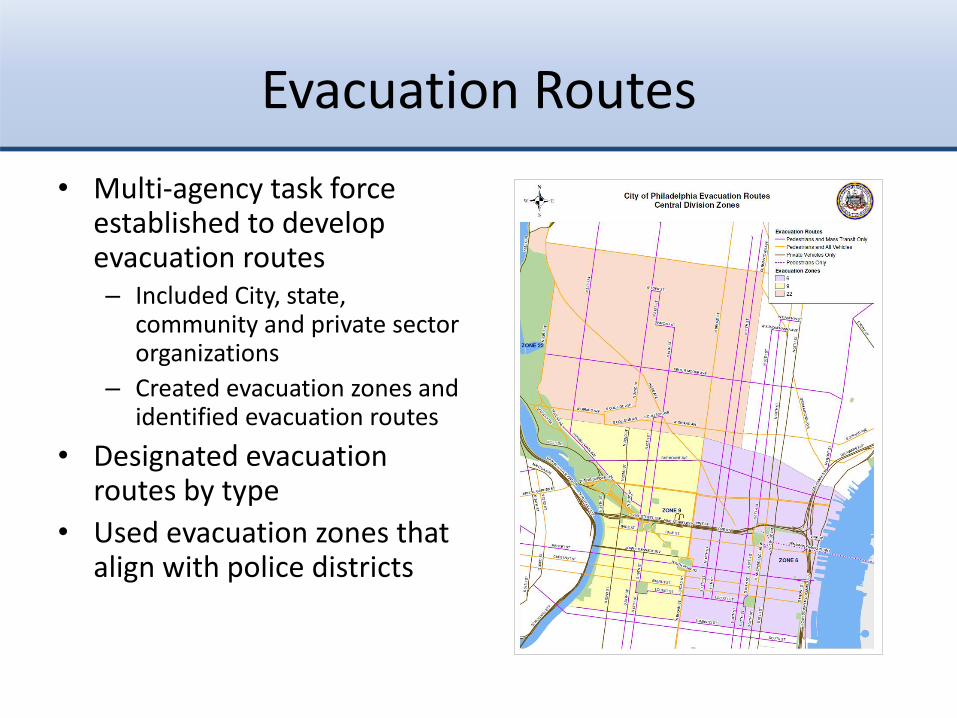
Evacuation Routes
• Multi-agency task force established to develop evacuation routes – Included City, state,
community and private sector organizations
– Created evacuation zones and identified evacuation routes
• Designated evacuation routes by type
• Used evacuation zones that align with police districts
Evacuation Routes – GIS Analysis
• Street network analysis – Identification of streets suitable for evacuation routes – Consideration for construction projects and bridges
• Low clearance and weight-restrictions
• Location-based analysis of other factors affecting the evacuation of communities – Population and households – Dominant languages spoken – Vulnerability factors – Healthcare facilities – Schools – Critical infrastructure
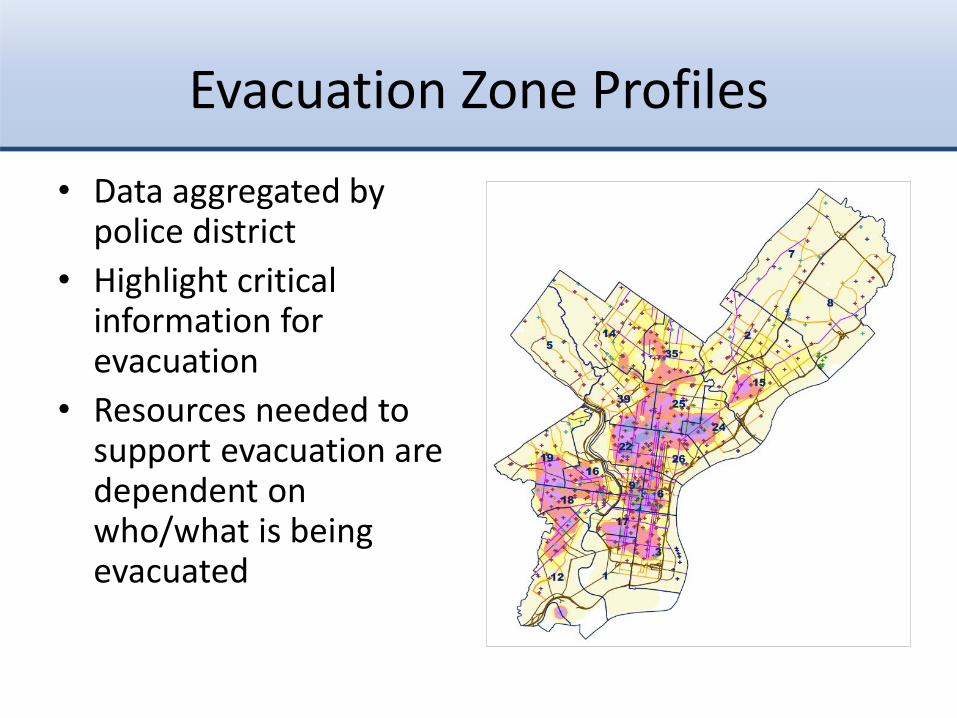
Evacuation Zone Profiles
• Data aggregated by police district
• Highlight critical information for evacuation
• Resources needed to support evacuation are dependent on who/what is being evacuated

High-Rise Building Evacuation
• Centralized assignment of rallying points for high-rise office buildings in Center City and University City
• Previously many buildings were using the same small areas for rallying points – Not suitable for multiple
building evacuations
Criteria
High-Rise Buildings
• Office buildings seven stories or higher
• In Center City and University City
• Occupancy estimated based on finished square footage – 200 square feet per person
for “worst case scenario”
– Building surveys to validate estimates
Evacuation Rallying Points
• Open spaces, preferably City controlled
• Three to eight blocks away from building
• Capacity estimated based on open area with no building – 10 square feet per person for
temporary gathering

Methodology
• Locate spaces from on impervious surfaces – Remove buildings, walkways,
unusable space – Calculate rallying point capacity
and building occupancy
• Route buildings to rallying points where capacity exceeds building occupancy
• Select candidate rallying points within distance thresholds – Minimize overall distance – Avoid “crossing paths”
• Developed several scenarios for planning group to review

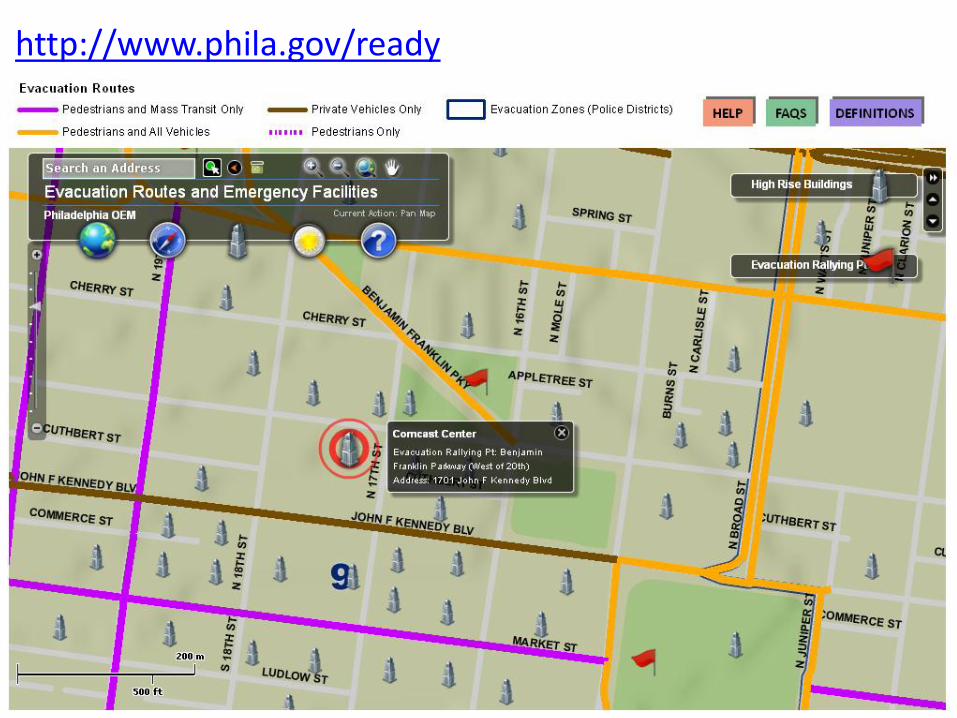
Communicating Plans to the Public
• Providing critical information before an emergency happens to allow the public to make the best decisions when an emergency occurs
• Flex-based interactive map on OEM website – http://oem.readyphiladelphia.org/Map
– Evacuation routes
– High-rise building evacuation rallying points
– Cooling centers and swimming pools (Heat Plan)
• Public evacuation maps at libraries and senior centers

HAZARD-SPECIFIC PLANS

SLOSH Storm Surge Modeling
• NOAA Sea, Lake, and Overland Surge from Hurricane (SLOSH)
• Provides grid with maximum storm surge values for each category of storm
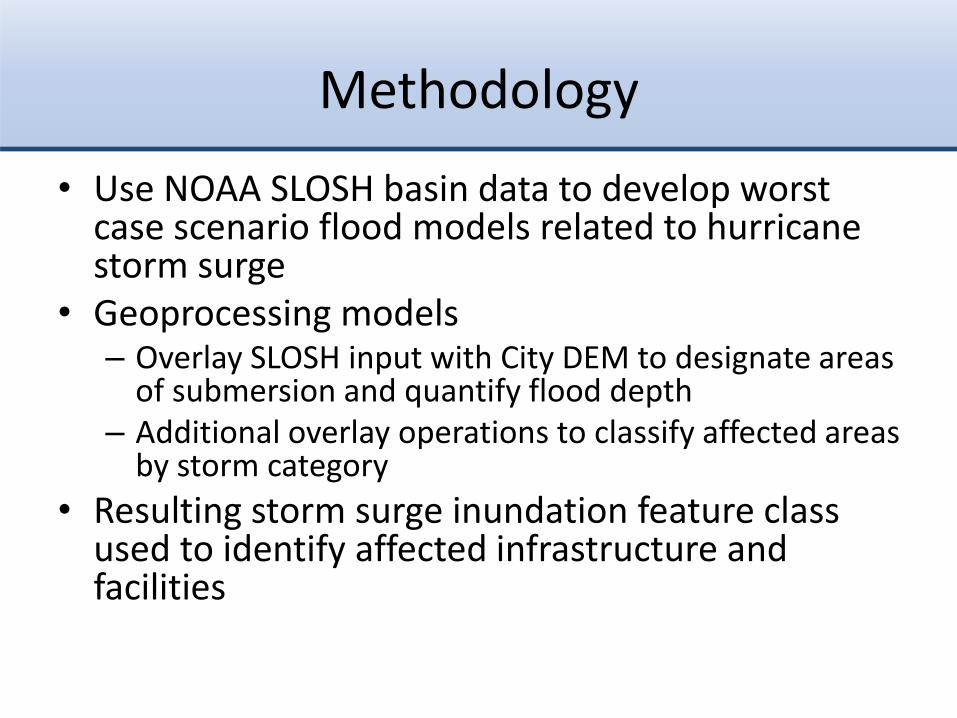
Methodology
• Use NOAA SLOSH basin data to develop worst case scenario flood models related to hurricane storm surge
• Geoprocessing models – Overlay SLOSH input with City DEM to designate areas
of submersion and quantify flood depth – Additional overlay operations to classify affected areas
by storm category
• Resulting storm surge inundation feature class used to identify affected infrastructure and facilities

OPERATIONAL PLANS
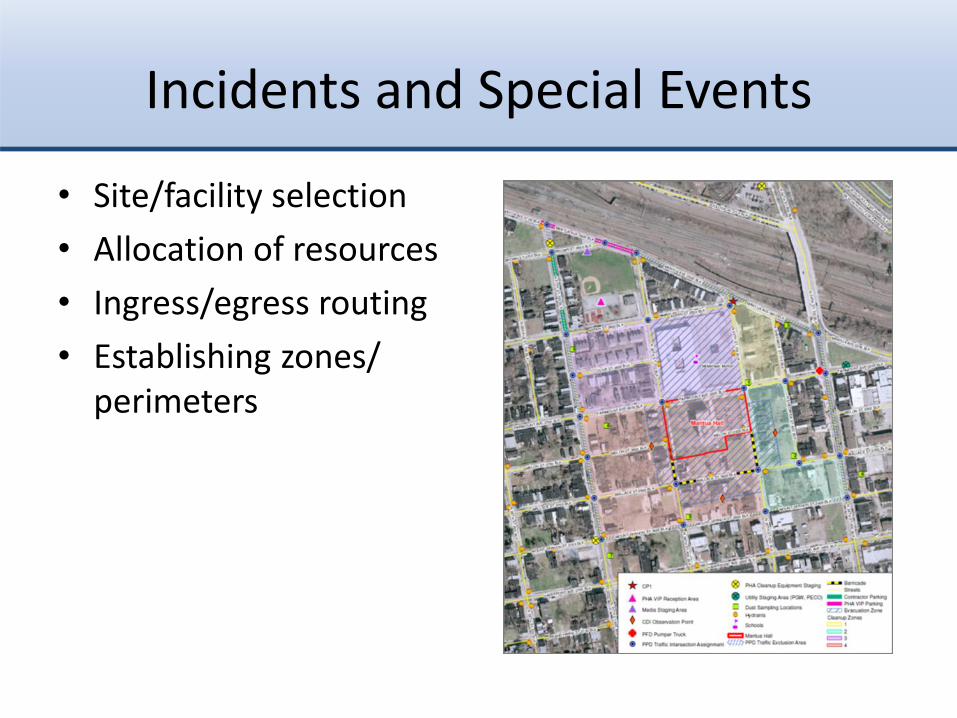
Incidents and Special Events
• Site/facility selection
• Allocation of resources
• Ingress/egress routing
• Establishing zones/ perimeters
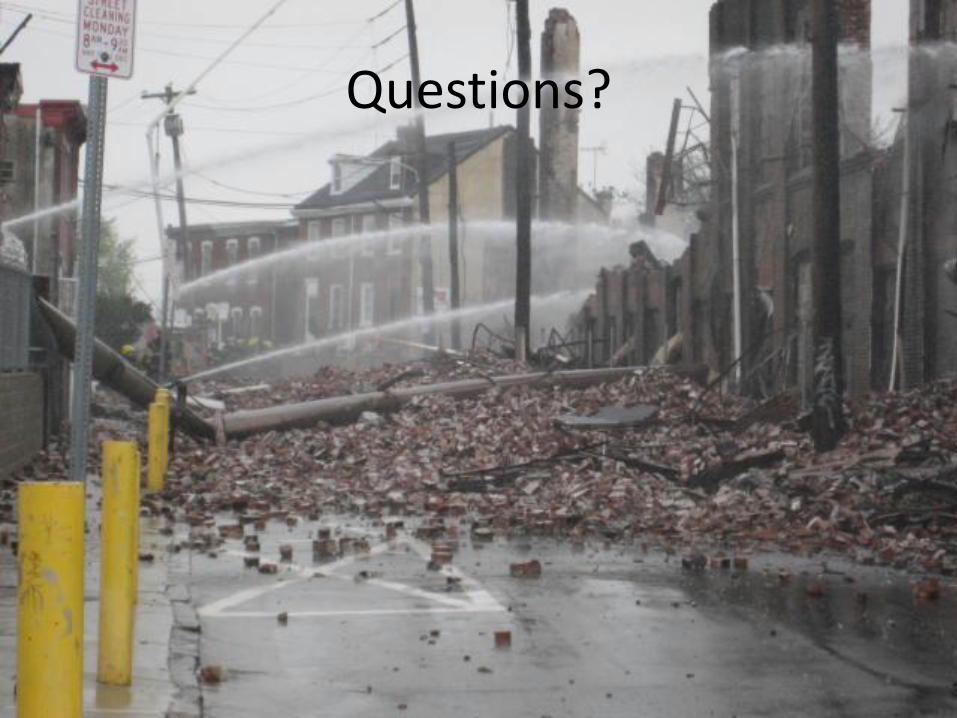
Questions?

Thank You
http://www.phila.gov/ready