40
The Role of Glare in Driving Gary S. Rubin Institute of Ophthalmology London, UK
| Date post: | 02-Jan-2016 |
| Category: |
Documents |
| Upload: | timothy-mccarthy |
| View: | 213 times |
| Download: | 0 times |

The Role of Glare in Driving
Gary S. Rubin
Institute of Ophthalmology
London, UK

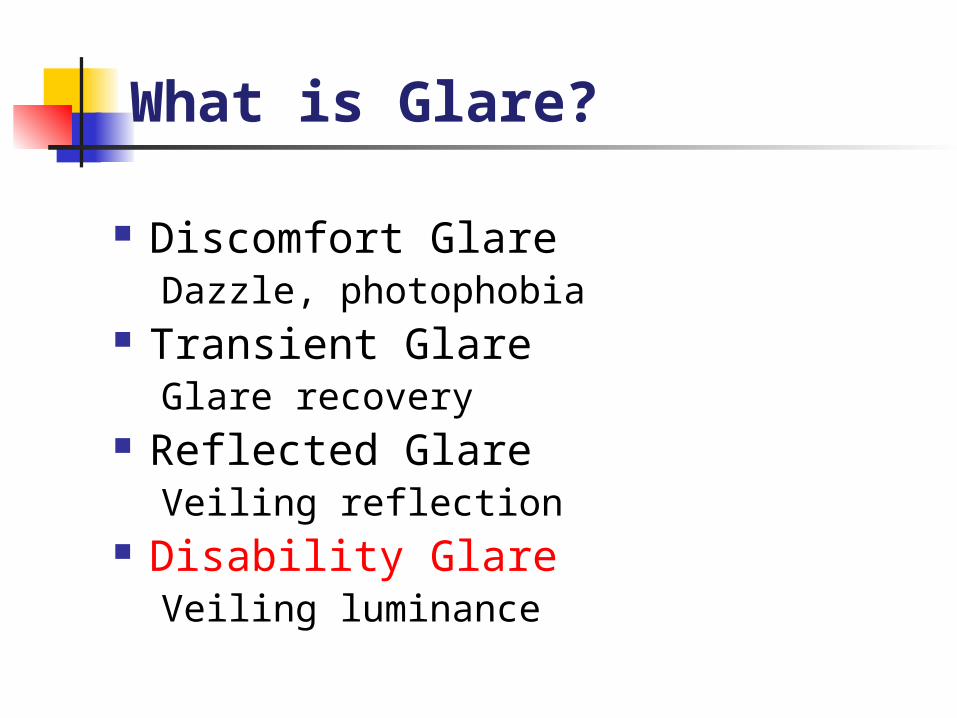
What is Glare?
Discomfort GlareDazzle, photophobia
Transient GlareGlare recovery
Reflected GlareVeiling reflection
Disability GlareVeiling luminance

Reflected Glare
What is Glare?
Discomfort GlareDazzle, photophobia
Transient GlareGlare recovery
Reflected GlareVeiling reflection
Disability GlareVeiling luminance

Starbursts

Halos

Flare

Glare Reduces Contrast

Glare Tests
Measures of visual function Increment threshold Acuity Contrast sensitivity
Glare Source Point source Extended glare Full-field glare

Clinical Glare Tests

Clinical Glare Tests
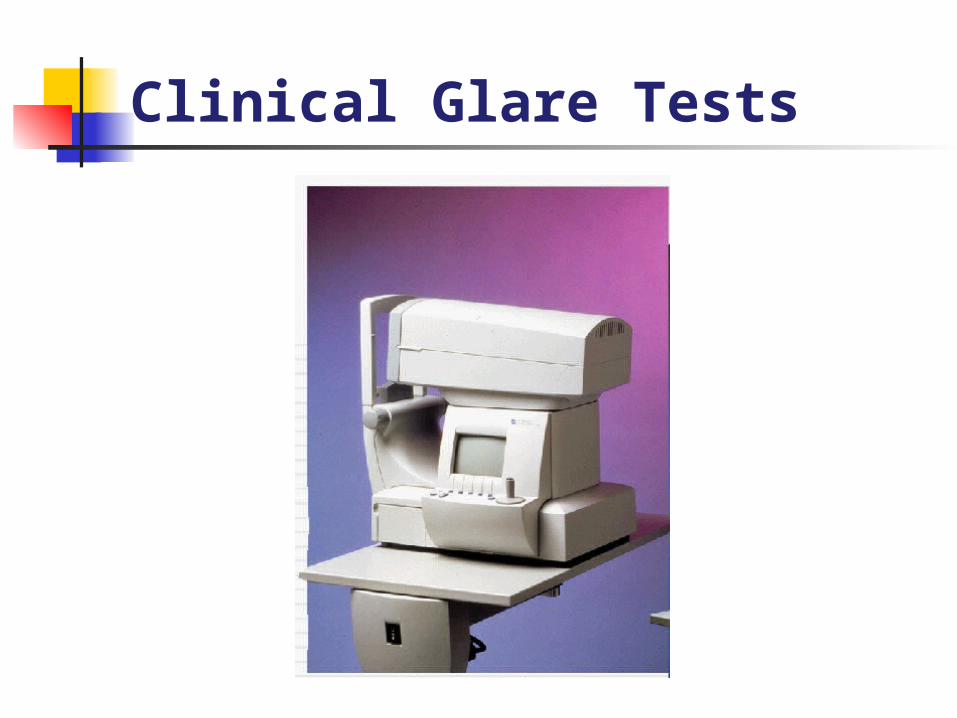
Clinical Glare Tests

Normal Age-Related Changes
Cornea - accounts for 30% Lens - accounts for 70%
Increased scatterBackscatter increases 16X from age 40 to 80Forward scatter probably increases even
faster Also reduced transmission
20X at shortest wavelengths from age 20 to 60
Only 1.2 X at longer wavelengths Fluorescence - at short wavelengths
Vitreous - Floaters and increased scatter

Glare and Aging
From Wolf (1960)

Ocular Pathology
Cataract - disability glare Macular Degeneration - glare recovery Retinitis Pigmentosa - discomfort glare Albinism - discomfort & disability glare

Glare and Cataract
0
10
20
30
40
50
-12 -6 0 6 12 18 24 30 36 42 48 54
Pre Op
Post Op
Fre
qu
en
cy
Letters Lost with GlareFrom Rubin, et al (1993)

Glare, Aging, and Driving
From Pulling, et al (1980)

Salisbury Eye Evaluation (SEE)
2520 residents of Salisbury, Maryland, selected from HCFA Medicare database
Eligibility 65-85 years of age MMSE score ≥ 18 Non institutionalized Able to travel to neighborhood clinic
26% of sample African American Ten-year longitudinal study

Components of SEE
Home interview (2 hours) Cognitive status screening test - MMSE Questionnaire on difficulty with visual activities (including
driving) - ADVS Medical history
Clinic exam (4 hours) Vision tests Visual attention test Eye exam Performance tests - reading, faces, IADLs, mobility Ocular photos
Examination of state driving records

Driving Evaluation
Past driving experience, miles driven, and recent driving limitations from Activities of Daily Vision Scale
Crashes (1991-1997) from Maryland Automated Accident Reporting System (MAARS) database

Glare Tests - BAT

Driving Study Population
Completed baseline examination 2,520 Refusals more likely to be older, female, and to
have less education Current drivers at baseline exam
1,974 Non-drivers more likely to be older, female, have
less education and more comorbid conditions Completed 2-year follow up (90%)1,780
Most of loss to follow up due to death

Measured Glare Sensitivity
20
25
30
35
66 68 70 72 74 76 78 80 82 84
Gla
re S
en
sit
ivit
y (
lett
ers
id
en
tifi
ed
)
Age

Self-Reported Glare Disability
50
55
60
65
70
75
80
85
90
66 68 70 72 74 76 78 80 82 84
Gla
re D
iffi
cu
lty
Sc
ore
Age
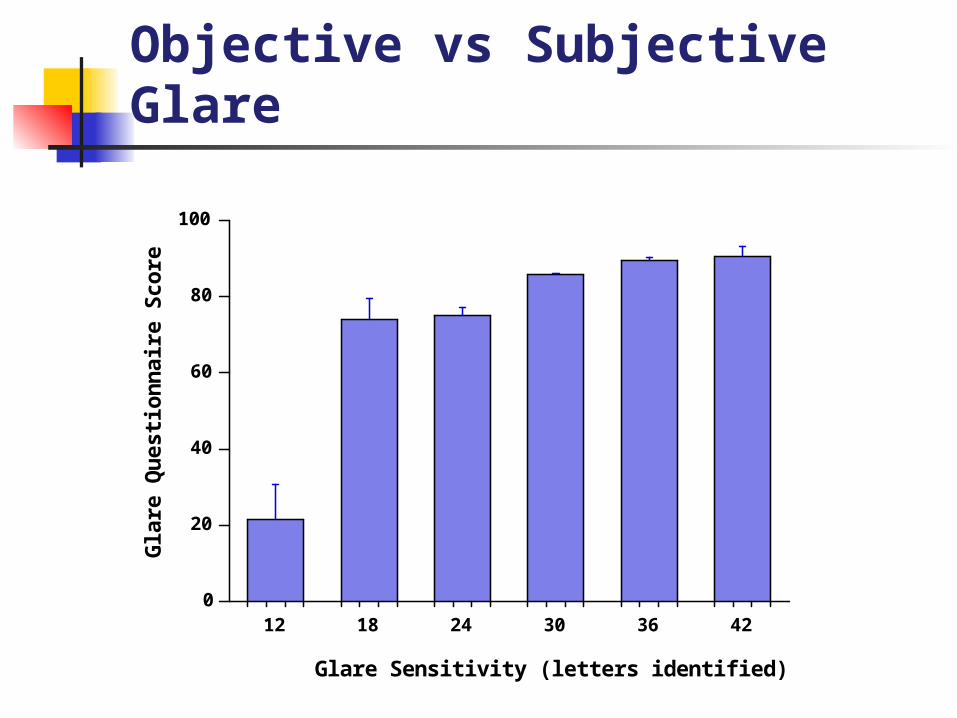
Objective vs Subjective Glare
0
20
40
60
80
100
12 18 24 30 36 42
Gla
re Q
ue
sti
on
na
ire
Sc
ore
Glare Sensitivity (letters identified)
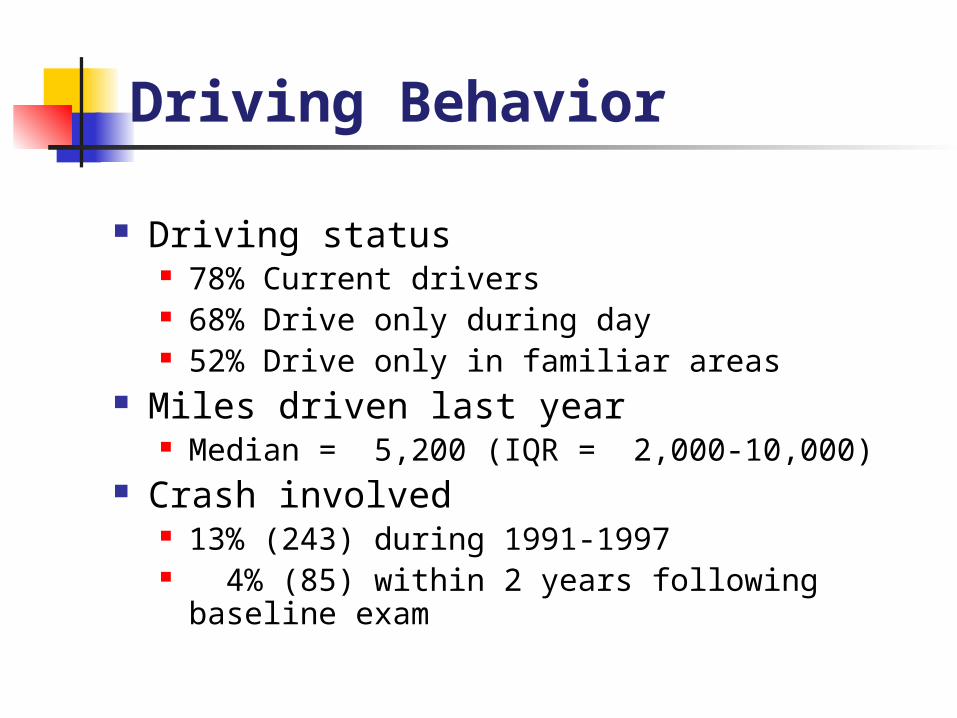
Driving Behavior
Driving status 78% Current drivers 68% Drive only during day 52% Drive only in familiar areas
Miles driven last year Median = 5,200 (IQR = 2,000-10,000)
Crash involved 13% (243) during 1991-1997 4% (85) within 2 years following baseline exam

Predictors of Crash Involvement
0.6X 0.8X 1.0X 1.2X 1.4X 1.6X 1.8X
Acuity(per line)
Contrast Sens.(per line)
Glare Sens.(per line)
StereoacuityDefect
Visual FieldLoss
Odds of a Crash

Effect of Glare Sensitivity on Mileage
1.0
1.5
2.0
2.5
3.0
3.5
4.0
4.5
5.0
12 18 24 30 36 42
Lo
g M
ile
s D
riv
en
in
Pa
st
Ye
ar
Glare Sensitivity (letters identified)

Change in Mileage at Follow Up
-3.0
-2.5
-2.0
-1.5
-1.0
-0.5
0.0
0.5
12 18 24 30 36 42
Ch
an
ge
in
Lo
g M
ile
s D
riv
en
Glare Sensitivity (letters identified)

Glare and Night Driving
20
22
24
26
28
30
32
34
None Little Moderate Extreme Don't Drive
Gla
re S
en
sit
ivit
y (
lett
ers
id
en
tifi
ed
)
Night Driving Glare Problems

Glare and Night Driving Cessation
20
22
24
26
28
30
32
34
Never Stop Still Resume
Gla
re S
en
sit
ivit
y (
lett
ers
id
en
tifi
ed
)
Night Driving at 2-Year Follow Up

Glare Problems for Bioptic Drivers
Daytime Glare Nighttime Glare
* *
*Data on bioptic drivers kindly provided by A Bowers, Schepens Eye Research Institute, Boston, USA
0
10
20
30
40
50
60
70
80
Extreme Severe Moderate Mild None
Bioptic Drivers
SEE Study
Per
cen
t o
f P
arti
cip
ants
0
10
20
30
40
50
60
70
80
Extreme Severe Moderate Mild None
Bioptic Drivers
SEE Study
Per
cen
t o
f P
arti
cip
ants
Summary
Marked increase in glare sensitivity with age “Normal” aging Age-related pathology esp. cataract
Measured glare sensitivity is related to self-reported glare disability
Glare sensitivity does not predict crashes Glare sensitivity does predict changes in
driving behaviour Miles driven Driving at night

Is there anything we can do to reduce glare?

Neutral Density (sunglasses)

Polarizing Lenses

Anti Reflective Coatings
Without coating With coating
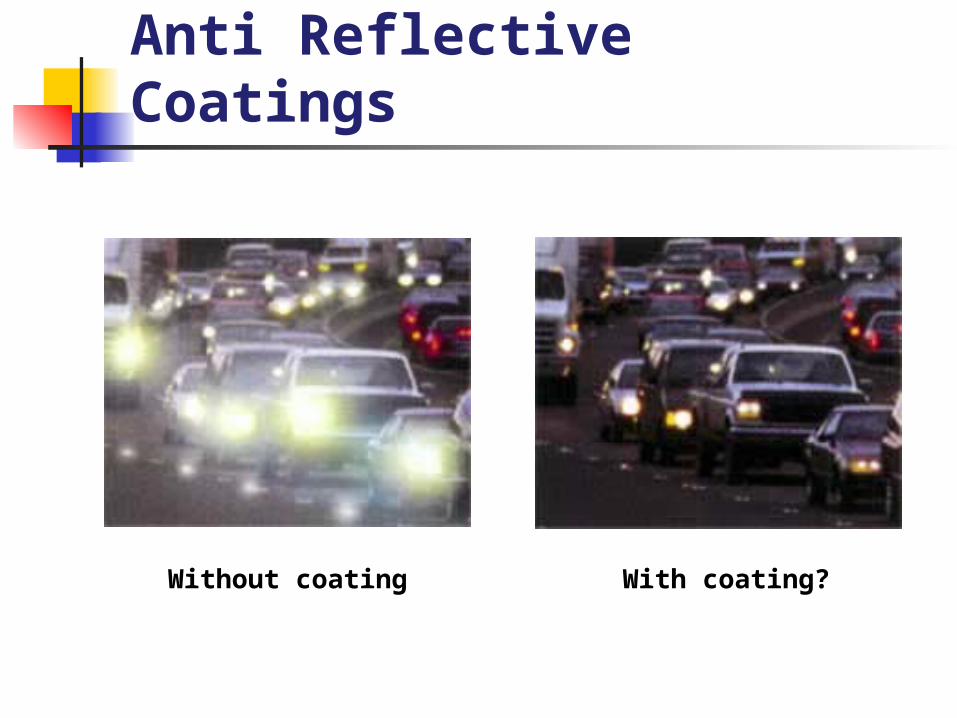
Anti Reflective Coatings
Without coating With coating?

The Future
Improving assessment of glare sensitivity Temporal factors Spatial factors
Reducing nighttime glare Reducing off-axis sources of light scatter Reduce scattering of short-wavelength light Cross polarization

Acknowledgements
Collaborators Sheila West and the SEE Project Team Ingrid Adamsons Walter Stark
Financial Support National Institute on Aging National Eye Institute Fight for Sight (UK)


