Connect with Vanguard > vanguard.com Executive summary. Diversification is a common objective for global investors. But even though there is general agreement on the importance of exposure to a variety of asset classes (dependent, of course, on investor-specific factors), there is less agreement on the role of foreign securities in a domestic portfolio. Investors display a persistent and significant home bias, regardless of domicile, which often conflicts with the tenets of broad global diversification. It is interesting that this bias is often conscious and intentional, with investors actively overweighting domestic holdings at the expense of foreign securities. This paper asks the question, “In a world in which a portfolio’s diversification benefits from broad allocations to global securities, how much home bias is reasonable?” We explore home bias in four developed markets: the United States, the United Kingdom, Australia, and Canada. 1 To address our governing question, we outline a decision framework that Vanguard research June 2012 Note: We thank James D. Martielli in Vanguard’s Portfolio Review Department for insight and perspective with the initial framework and articulation of this research. We also thank Daniel Piquet for assistance with data and analysis. 1 We selected these countries primarily because they represent nations where Vanguard has established domestic operations. The role of home bias in global asset allocation decisions Authors Christopher B. Philips, CFA Francis M. Kinniry Jr., CFA Scott J. Donaldson, CFA, CFP ®
Transcript
Connect with Vanguard > vanguard.com
Executive summary. Diversification is a common objective for global investors. But even though there is general agreement on the importance of exposure to a variety of asset classes (dependent, of course, on investor-specific factors), there is less agreement on the role of foreign securities in a domestic portfolio. Investors display a persistent and significant home bias, regardless of domicile, which often conflicts with the tenets of broad global diversification. It is interesting that this bias is often conscious and intentional, with investors actively overweighting domestic holdings at the expense of foreign securities.
This paper asks the question, “In a world in which a portfolio’s diversification benefits from broad allocations to global securities, how much home bias is reasonable?” We explore home bias in four developed markets: the United States, the United Kingdom, Australia, and Canada.1 To address our governing question, we outline a decision framework that
Vanguard research June 2012
Note: We thank James D. Martielli in Vanguard’s Portfolio Review Department for insight and perspective with the initial framework and articulation of this research. We also thank Daniel Piquet for assistance with data and analysis.
1 We selected these countries primarily because they represent nations where Vanguard has established domestic operations.
The role of home bias in global asset allocation decisions
2 See notes to Figure 2 for the source of these allocations. Also, Figure 1’s analysis begins with 1988 to coincide with the inception of the MSCI All Country World Index. Although our evaluation period covers 24 years, the results are still dependent on the particular period selected. Alternative starting and ending dates can alter the outcome in favor of either foreign or domestic investment, depending on the market environment over the selected period. For example, while Figure 1 shows the minimum-variance portfolio for U.S. equities at an allocation of 80% U.S./20% foreign, similar research by Philips (2012) showed that since 1970, the minimum variance allocation between U.S. and foreign stocks has been 70% domestic/30% foreign.
It’s also important to note that when including additional asset classes, the assumed returns, variances, and covariances among the assets can lead to allocation decisions that may differ from those based on a single asset-class analysis such as that in Figure 1. For example, in Philips (2012), variance for a 60% U.S. stock/40% U.S. bond portfolio would have been minimized by adding 40% foreign stocks to the equity allocation.
considers both quantitative and qualitative criteria. Based on these criteria, we conclude that, in general, U.S. investors may have some justification for marginal home bias, but investors in Australia and Canada might consider increasing their allocations to foreign securities. The results for U.K. investors are mixed, with less overall concentration in domestic securities but still room to diversify. Of course, because each investor’s objectives and constraints are unique, no single answer is correct for all countries and investors. Accordingly, readers can customize this framework to fit their circumstances.
For many investors, foreign securities play an important diversification role. Vanguard research by Philips (2012) showed that by adding foreign equities to portfolios comprising U.S. equities and fixed income, average volatility could be reduced. A similar analysis (with similar results) was performed on foreign fixed income in Philips et al. (2012). It’s important to note that such a diversification benefit has not been unique to U.S. investors. For example, Figure 1 demonstrates that for each country shown, both an investor’s domestic equity market and the overall foreign equity market (relative to each investor) have historically been more volatile than a combination of the two in a globally diversified portfolio.
Such analysis provides one perspective of how investors might think about global asset allocation. On the other hand, financial theory suggests that investors should construct their asset classes in line with global-market capitalizations, which differ from the allocations shown in Figure 1. For example, as of December 31, 2011, U.K. equities accounted for 8.6% of the global equity market. According to the theory, then, U.K. investors should hold 8.6% of their equity portfolio in U.K. stocks—as should U.S. investors, Australian investors, and, indeed, all other equity investors globally. Of course, we know from industry data that few investors actually adhere to either of these approaches. For example, instead of holding 8.6% of their equity allocation in U.K. stocks per global market weightings, or 80% in U.K. stocks per the minimum-volatility portfolio in Figure 1, U.K. investors collectively held 72% in 2001 and 50% in 2010.2
3
Examining home-country bias
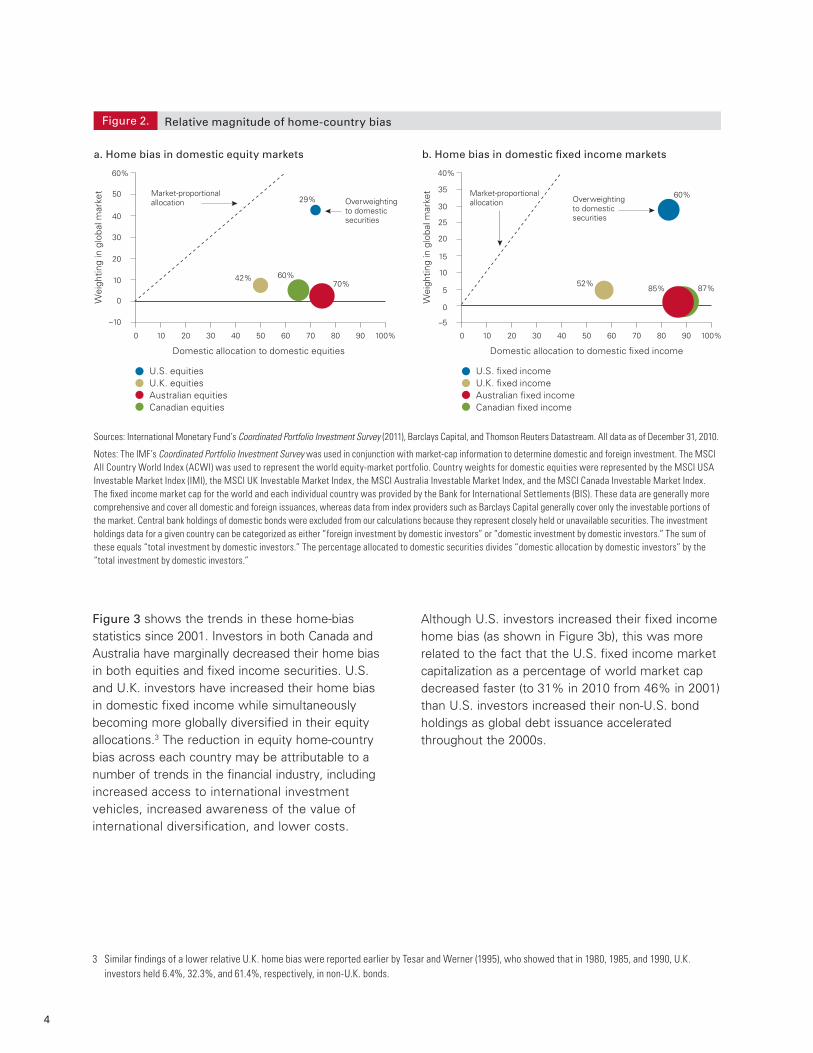
Despite market-cap theory and the recognized diversification benefits of global portfolios, home bias was strong across each of the markets we examined. Figure 2, on page 4, approximates a country’s aggregate home bias as of December 31, 2010 (the latest available holdings data from the International Monetary Fund [IMF] at the time of our study) by comparing the total investment by domestic investors in domestic securities to the percentage weighting of each domestic market in the global market. The size of the bubbles shows the
aggregate percentage by which the investments were overweighted in domestic securities. For example, Figure 2a shows that U.S. investors, on average, held approximately 29 percentage points more U.S. stocks than the U.S. market capitalization, which, as of December 31, 2010, was 43% (seen along the y-axis). So in 2010, U.S. investors allocated 72% of their equity holdings to U.S. equities (seen along the x-axis). If investors had held domestic securities at their market weighting, they would have fallen on the dashed black line.
Notes on risk: All investments are subject to risk. Diversification does not ensure a profit or protect against a loss in a declining market. Foreign investing involves additional risks, including currency fluctuations and political uncertainty. Past performance is not a guarantee of future results. The performance of an index is not an exact representation of any particular investment, as you cannot invest directly in an index.
Figure 1.
United StatesUnited KingdomAustraliaCanada
Risk and returns for various equity portfolios: 1988–2011
Sources: Vanguard calculations, using data from Thomson Reuters Datastream.
Notes: Domestic returns are represented by the MSCI USA Index, MSCI U.K. Index, MSCI Australia Index, and MSCI Canada Index. Foreign ex domestic returns are represented by MSCI All Country World ex country indexes for the United States, U.K., and Australia. Because a comprehensive index for global equities ex Canada is not available from Thomson Reuters, we spliced the MSCI EAFE Index with the MSCI Emerging Markets Index and the MSCI USA Index (all indexes in $Canadian). All returns denominated in the domestic country’s currency. Black point in each series represents the portfolio with the lowest average volatility from 1988 through 2011.
Ave
rage
ann
ual r
etur
n
Average annual standard deviation
100% Australia
100% World ex Canada
100% Canada
100% United States
100% United Kingdom
100% World ex United Kingdom
100% World ex Australia 100% World ex United States
10 11 12 13 14 15 16 17 18 19%4%
5%
6%
7%
8%
9%
10%�
�
��
�
�
�
�
�
�
�
��
��
��
�
��
�
�
�
�
�
�
�
�
�
�
�
�
�
��� � �
��
�
���
4
Figure 3 shows the trends in these home-bias statistics since 2001. Investors in both Canada and Australia have marginally decreased their home bias in both equities and fixed income securities. U.S. and U.K. investors have increased their home bias in domestic fixed income while simultaneously becoming more globally diversified in their equity allocations.3 The reduction in equity home-country bias across each country may be attributable to a number of trends in the financial industry, including increased access to international investment vehicles, increased awareness of the value of international diversification, and lower costs.
Although U.S. investors increased their fixed income home bias (as shown in Figure 3b), this was more related to the fact that the U.S. fixed income market capitalization as a percentage of world market cap decreased faster (to 31% in 2010 from 46% in 2001) than U.S. investors increased their non-U.S. bond holdings as global debt issuance accelerated throughout the 2000s.
3 Similar findings of a lower relative U.K. home bias were reported earlier by Tesar and Werner (1995), who showed that in 1980, 1985, and 1990, U.K. investors held 6.4%, 32.3%, and 61.4%, respectively, in non-U.K. bonds.
Figure 2.
a. Home bias in domestic equity markets
Relative magnitude of home-country bias
Sources: International Monetary Fund’s Coordinated Portfolio Investment Survey (2011), Barclays Capital, and Thomson Reuters Datastream. All data as of December 31, 2010.
Notes: The IMF’s Coordinated Portfolio Investment Survey was used in conjunction with market-cap information to determine domestic and foreign investment. The MSCI All Country World Index (ACWI) was used to represent the world equity-market portfolio. Country weights for domestic equities were represented by the MSCI USA Investable Market Index (IMI), the MSCI UK Investable Market Index, the MSCI Australia Investable Market Index, and the MSCI Canada Investable Market Index. The �xed income market cap for the world and each individual country was provided by the Bank for International Settlements (BIS). These data are generally more comprehensive and cover all domestic and foreign issuances, whereas data from index providers such as Barclays Capital generally cover only the investable portions of the market. Central bank holdings of domestic bonds were excluded from our calculations because they represent closely held or unavailable securities. The investment holdings data for a given country can be categorized as either “foreign investment by domestic investors” or “domestic investment by domestic investors.” The sum of these equals “total investment by domestic investors.” The percentage allocated to domestic securities divides “domestic allocation by domestic investors” by the “total investment by domestic investors.”
Wei
ghtin
g in
glo
bal m
arke
t
Domestic allocation to domestic equities
0 10 20 30 40 50 60 70 80 90 100%
–10
0
10
20
30
40
50
60%
Market-proportional allocation
Market-proportional allocationOverweighting
to domestic securities
Overweighting to domestic securities
42% 60%
29%
70% 52%
60%
85% 87%
b. Home bias in domestic �xed income markets
Wei
ghtin
g in
glo
bal m
arke
t
Domestic allocation to domestic �xed income
0 10 20 30 40 50 60 70 80 90 100%
–5
0
5
10
15
20
25
30
35
40%
U.S. equitiesU.K. equitiesAustralian equitiesCanadian equities
U.S. �xed incomeU.K. �xed incomeAustralian �xed incomeCanadian �xed income
5
Finally, it is important to note that home bias for fixed income investors has generally been greater than for equity investors. While this might be construed as a negative, the reasoning behind it may actually be rational. For example, Fidora, Fratzscher, and Thimann (2006) found that home bias was influenced by real exchange-rate volatility and, as a result, was
generally greater for assets with low local currency return volatility (i.e., fixed income). They further showed that a reduction in real exchange-rate volatility reduced fixed income home bias to a greater extent than it reduced equity home bias. In addition, Craft (2006) discussed the advantages of home bias for defined benefit pension funds.
Figure 3.
a. Evolution of equity home bias
b. Evolution of �xed income home bias
Trends in home bias
Sources: International Monetary Fund’s Coordinated Portfolio Investment Survey (2011), Barclays Capital, and Thomson Reuters Datastream.
Wei
ghts
(%)
U.S.2001
34%
54%
88%
U.S.2005
U.S.2010
U.K.2001
U.K.2005
U.K.2010
31%29% 62%
47%42%
79% 72%
48%43%
72% 57% 50%
10%
10%
49%
46%
94%
53% 60%
49%51% 52%
92% 91%
39%31%
53% 56% 57%
Domestic allocationDomestic market as percentage of world marketOverweighting to domestic
Wei
ghts
(%)
U.S.2001
U.S.2005
U.S.2010
U.K.2001
U.K.2005
U.K.2010
8%
4% 5% 5%
93%89%
87%
95% 91% 89%
Canada2001
Canada2005
Canada2010
2% 2% 2%
93%87% 85%
94% 88% 87%
Australia2001
Australia2005
Australia2010
1% 1% 2%
Canada2001
Canada2005
Canada2010
64%60% 60%
66% 63% 65%
2% 3% 5%
Australia2001
Australia2005
Australia2010
81%75%
70%
83% 77% 74%
1% 2% 3%
6
Factors contributing to home bias
To simplify the analysis, the remainder of this paper focuses on equity investors. Comparable data for global fixed income markets are not as readily available, depending on the market analyzed, so qualitative judgments about market conditions may be necessary. Home-country bias in global equity investing has been studied extensively, resulting in a large body of published research. Despite general recognition that the bias exists, there is much less agreement on its potential causes. Major reasons cited for home bias are:
• Expectations. In one of the earliest studies on the topic, French and Poterba (1991) identified investors’ expectations about future returns in their home market as a key driver.
• A preference for the familiar. Investors generally feel more comfortable with their home market and allocate investments accordingly, even if it results in a poorer risk–return trade-off for their portfolio. For example, Strong and Xu (2003) showed that investors tend to be more optimistic about their domestic economies than foreign investors.
• Corporate governance. Dahlquist et al. (2002) suggested that corporate governance practices have a major impact. High costs to access foreign securities may also encourage greater domestic investment.
• Liability hedging. The need to hedge certain liabilities may lead to a home-country bias, especially in fixed income, but also perhaps in equities. This is because the ability to fund clearly defined liabilities is increased when using assets
that move in tandem with those liabilities. Similarly, domestic investor spending is often influenced more by domestic inflation and interest rates. In these instances, the diversification benefits attained through adding foreign assets may actually decrease the portfolio’s ability to meet its objective.
• Multinational companies. Investors may feel that through investment in multinational companies, they will attain as much global diversification as they will need. But as global economies become more interconnected, it’s important to consider the extent to which investment in domestic companies provides exposure to foreign markets. Historical evidence suggests that a company’s performance has been more highly correlated to its domestic market, regardless of where business operations are conducted (Philips, 2012). LaBarge (2008) examined the impact of global sectors and countries on the returns of multinational firms and found that diversification across both country and sector remained relevant.
• Currency. Many investors perceive foreign investments as inherently more risky than domestic holdings. For example, it is not uncommon to see foreign equities listed among the riskiest assets on investment providers’ websites or literature, despite the well-documented diversification benefits of including foreign securities in a diversified portfolio. Much of the volatility in foreign investing can be attributed to exchange-rate fluctuations, and the desire to avoid the influence of such movements could be an additional reason why investors allocate greater percentages of their portfolios to local securities.4
4 The role of currency in allocations to foreign assets is generally beyond the scope of this paper. We acknowledge that exposure to foreign exchange-rate movements does affect both the returns and the volatility of a given investment. However, because the direction and magnitude of such movements are difficult to predict, we do not focus on currency as a metric within our proposed framework. Nevertheless, investors often must make a decision on whether to hedge the currency exposure of their foreign securities. The hedging decision is a complex and lengthy one, and we refer investors to two prior Vanguard papers on these topics: Currency Management: Considerations for the Equity Hedging Decision (LaBarge, 2010) and Global Fixed Income: Considerations for U.S. Investors (Philips et al., 2012).
7
A framework for addressing home-country bias
To select an appropriate balance between domestic and foreign securities, investors often evaluate various factors and settle on a mixture that is appropriate for them. Certain investors may have predefined limitations on how much foreign exposure is permitted in their portfolio, set perhaps by regulation, policy statements, or to maintain competitiveness within a peer group.5 In such scenarios, additional global diversification may be great in theory but not applicable in practice. Similarly, global diversification may be impractical for investors with a clearly defined domestic liability target.
Often a holistic evaluation of various factors can help point to a reasonable balance between diversification, rational home-country bias, and awareness of the global opportunity set. Figure 4 provides such a framework for this evaluation. The rest of our analysis walks through the framework, concluding with an example of how it could apply to a hypothetical investor in Australia. Each factor may move the investor toward a larger allocation to either foreign or domestic securities. The degree of impact will depend on the investor and the importance placed on each factor. As a result, we view this framework as highly flexible and customizable to an investor’s specific needs. That said, the objective for all investors should be to consider a wide range of factors and determine a mixture that fits their needs and constraints.
5 Regulatory factors have the potential to heavily influence portfolio construction by setting limits on allocations to foreign securities. Typically, the limits apply to larger investors such as pension plans. The extent of the rules’ impact will vary by the type and domicile of the investor. Regulations do not significantly affect individual investors in the countries used in our study. However, an advisor constructing a portfolio’s asset allocation may be constrained by an investment policy statement that sets specific limits on international allocation in the same manner as regulatory limits. Investors might also experience difficulty accessing certain countries or markets because of foreign regulations such as capital controls, limits to foreign investment, etc.
Validate Reduce home-bias decision home bias
Figure 4. Factors affecting the decision to invest in foreign assets
Source: Vanguard.
Risk and return impact of adding foreign securities Limited bene�ts Signi�cant bene�ts
Other domestic market-risk factors No impact Signi�cant risks
Additional considerations: regulatory limits and liability-matching systems Impact unique to each investor
8
Historical returns are only one factorFigure 1 made clear that holding some foreign stocks would have made sense for investors in each country if the objective were to reduce portfolio volatility. However, there are limits to the usefulness of historical data when determining allocation.6 Most important, risk-and-return attributes can change significantly over time, and historical results may not hold going forward for a specific country. For these reasons, we suggest using a historical analysis as either a starting point or as only one of many considerations when making an allocation decision.
Sector variation from world market Investment in a domestic market that is diversified across multiple sectors (e.g., the U.S. market) may benefit less from foreign diversification. On the other hand, in a domestic market concentrated in one or a few sectors, greater benefit from global diversification could result, as the relative impact of those sectors might be mitigated. This is especially important in light of Vanguard research by LaBarge (2008), who concluded that sector influences are
important considerations and that investors are best served by diversifying across both country and sector.
Figure 5 provides an overview of sector concentration by country versus the MSCI All Country World Index (ACWI). Each row displays the difference between a sector’s domestic weighting and its representation in the MSCI ACWI. The last row shows the sum of absolute deviations, which can be interpreted as a measure of the total magnitude of each country’s deviations from the market portfolio. Sector weightings in the United States and the United Kingdom are most similar to those of the MSCI ACWI (not surprising for the United States because of its large weighting in the global index), and investors in these countries may see only marginal sector diversification benefits by adding foreign stocks. Australia and Canada, however, display very unbalanced sector weightings in a few key sectors that lead to very high-sum scores. Therefore, investors in these countries might consider increasing their international exposure to decrease sector concentration.
6 For further discussion of the challenges in evaluating international equity allocation, see the Vanguard research paper Considerations for Investing in Non-U.S. Equities (Philips, 2012).
Sector differences versus ACWI IMI
Sectors MSCI USA IMI MSCI UK IMI MSCI Australia IMI MSCI Canada IMI
Consumer discretionary 0.9% –3.5% –7.5% –6.4%
Consumer staples 0.3 5.5 –1.7 –7.4
Energy 0.1 9.0 –4.5 14.3
Financials –4.1 –2.1 22.2 14.2
Health care 2.6 –0.6 –5.6 –8.4
Industrials –0.3 –3.9 –4.4 –5.0
Information technology 6.4 –10.6 –11.6 –10.7
Materials –4.3 3.2 18.0 14.1
Telecommunication services –1.6 2.6 –2.6 –1.9
Utilities 0.0 0.3 –2.1 –2.7
Sum of absolute deviations 20.6 41.3 80.2 85.1
Sector concentration by country, as of December 31, 2011Figure 5.
Notes: Yellow shading denotes deviations of between 5% and 9.99%; red shading denotes deviations of 10% or greater. ACWI = All Country World Index; IMI = Investable Market Index.
Sources: Vanguard calculations, based on FactSet Research Systems data as of December 31, 2011.
9
Issuer concentration Certain markets (especially smaller ones) can be heavily concentrated in just a few securities. The 2010 Gulf of Mexico oil spill provides an excellent illustration of the consequences this can have for investors. The impact of the incident on British pensioners made headlines because of how widely British Petroleum’s (BP) stock was held within pension funds.7 BP is a multinational company with its largest market-cap concentration in the United Kingdom. A U.K. investor holding a purely domestic allocation would have been significantly affected by just the one security simply because of its weighting in the U.K. market.
Figure 6 shows the number of securities in each market, the percentage of each index’s market cap represented by the top-ten stocks, and the
percentage weightings of the top-five stocks in each index as measures of concentration. The United States represents the least-concentrated portfolio because of both the number of securities and the percentage of these in the top ten, but the MSCI ACWI would still provide better diversification than the broad U.S. equity market. In the United Kingdom, and especially in Australia, broad-market index returns are dominated by the largest firms. Investors in these markets might consider increasing their international allocation in order to reduce concentrated portfolio risk. Using our BP example, an allocation that included a significant weighting in foreign stocks would have lessened the effect of the oil spill by diffusing the impact of one stock on the portfolio.
7 See Adam (2010).
Measures of concentration
MSCI USA IMI MSCI UK IMI MSCI Australia IMI MSCI Canada IMI MSCI ACWI IMI
Security concentration by countryFigure 6.
Sources: Vanguard calculations, based on FactSet Research Systems data as of December 31, 2011.
Top-5 stocks
ExxonMobil 2.97%
Apple Inc. 2.71%
IBM Corp. 1.58%
Chevron Corp. 1.54%
Microsoft 1.41%
Vodafone Group 5.73%
HSBC Holdings 5.52%
BP 5.50%
Royal Dutch Shell 5.41%
GlaxoSmithKline 4.71%
BHP Billiton 12.06%
Commonwelath Bank of Australia 8.37%
Westpac Banking Corp. 6.61%
Australia and New Zealand Banking Group 5.89%
National Australia Bank 5.61%
Royal Bank of Canada 5.33%
TD Bank 4.84%
Bank of Nova Scotia 3.94%
Suncor Energy 3.30%
Barrick Gold 3.29%
ExxonMobil 1.39%
Apple Inc. 1.27%
IBM Corp. 0.74%
Chevron Corp. 0.72%
Microsoft 0.66%
Number of securities
2,540 378 272 348 8,900
Percentage in top 10
17 43 53 34 8
10
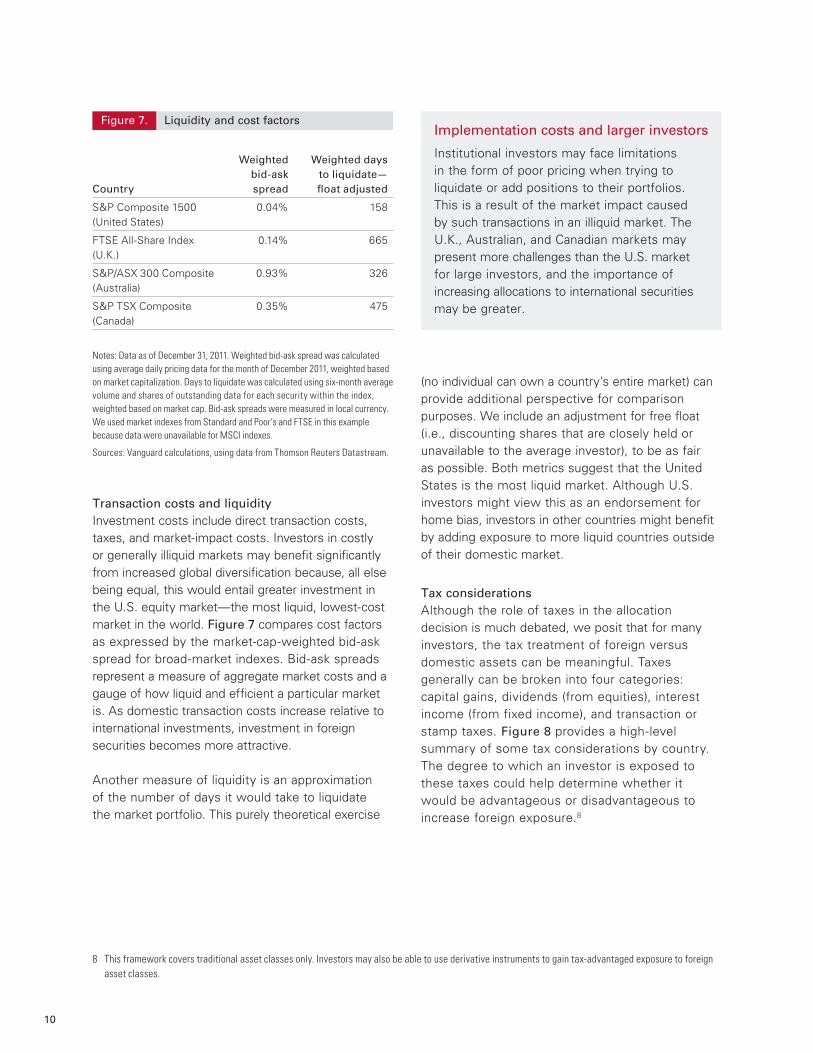
Transaction costs and liquidity Investment costs include direct transaction costs, taxes, and market-impact costs. Investors in costly or generally illiquid markets may benefit significantly from increased global diversification because, all else being equal, this would entail greater investment in the U.S. equity market—the most liquid, lowest-cost market in the world. Figure 7 compares cost factors as expressed by the market-cap-weighted bid-ask spread for broad-market indexes. Bid-ask spreads represent a measure of aggregate market costs and a gauge of how liquid and efficient a particular market is. As domestic transaction costs increase relative to international investments, investment in foreign securities becomes more attractive.
Another measure of liquidity is an approximation of the number of days it would take to liquidate the market portfolio. This purely theoretical exercise
(no individual can own a country’s entire market) can provide additional perspective for comparison purposes. We include an adjustment for free float (i.e., discounting shares that are closely held or unavailable to the average investor), to be as fair as possible. Both metrics suggest that the United States is the most liquid market. Although U.S. investors might view this as an endorsement for home bias, investors in other countries might benefit by adding exposure to more liquid countries outside of their domestic market.
Tax considerations Although the role of taxes in the allocation decision is much debated, we posit that for many investors, the tax treatment of foreign versus domestic assets can be meaningful. Taxes generally can be broken into four categories: capital gains, dividends (from equities), interest income (from fixed income), and transaction or stamp taxes. Figure 8 provides a high-level summary of some tax considerations by country. The degree to which an investor is exposed to these taxes could help determine whether it would be advantageous or disadvantageous to increase foreign exposure.8
8 This framework covers traditional asset classes only. Investors may also be able to use derivative instruments to gain tax-advantaged exposure to foreign asset classes.
Country
Weighted bid-ask spread
Weighted days to liquidate—float adjusted
S&P Composite 1500 (United States)
0.04% 158
FTSE All-Share Index (U.K.)
0.14% 665
S&P/ASX 300 Composite (Australia)
0.93% 326
S&P TSX Composite (Canada)
0.35% 475
Notes: Data as of December 31, 2011. Weighted bid-ask spread was calculated using average daily pricing data for the month of December 2011, weighted based on market capitalization. Days to liquidate was calculated using six-month average volume and shares of outstanding data for each security within the index, weighted based on market cap. Bid-ask spreads were measured in local currency. We used market indexes from Standard and Poor’s and FTSE in this example because data were unavailable for MSCI indexes.
Sources: Vanguard calculations, using data from Thomson Reuters Datastream.
Liquidity and cost factorsFigure 7.Implementation costs and larger investors
Institutional investors may face limitations in the form of poor pricing when trying to liquidate or add positions to their portfolios. This is a result of the market impact caused by such transactions in an illiquid market. The U.K., Australian, and Canadian markets may present more challenges than the U.S. market for large investors, and the importance of increasing allocations to international securities may be greater.
11
United States United Kingdom Australia Canada
Capital gains Limited impact. Capital gains on foreign securities taxed at U.S. rates.
Limited impact. Capital gains on foreign securities taxed at U.K. rates.
Limited impact. Complex system, but capital gains on foreign securities taxed at Australian rates.
Limited impact. Capital gains on foreign securities taxed at Canadian rates.
Dividends Limited impact. Tax treaties with many countries allow foreign dividends to be taxed at U.S. rates, but taxes to be withheld at foreign tax rate.
Low impact. Domestic dividends taxed under a dividend imputation system. Investors receive credit for taxes paid by the domestic company on profits; investors only pay the difference (if any) between their personal rate and the corporate tax rate. For foreign dividends, tax treaties with many countries prevent double taxation, but domestic personal tax rate applies.
Low impact. Imputation system similar to the U.K. Investors can receive “franking credits” for the amount of tax paid by the domestic company and can receive a refund if the corporate tax exceeds the personal rate. For foreign dividends, tax treaties with many countries prevent double taxation, but domestic personal tax rate applies.
Low impact. Domestic dividends receive favorable tax treatment through a tax credit up to a limited annual amount of dividend income. Foreign dividends taxed at domestic personal tax rates.
Transaction/ stamp tax on securities
No. Yes—0.5% on securities purchased domestically. Favors international assets, depending on frequency of transactions.
No. No.
Overall impact Neutral. Depends on amount of dividend income (favors domestic assets with higher dividend income) and frequency of transactions (favors international assets with higher number of transactions).
Favors domestic assets, depending on amount of dividend income and marginal income tax rate.
Favors domestic assets, depending on amount of dividend income.
Summary of equity tax implications by countryFigure 8.
Source: Vanguard.
12
Other market-risk factorsCountry-specific systematic risk factors such as political risk or poor corporate governance practices in the investor’s home market are also important considerations. They can be difficult to quantify, but because they have the potential to add significant risk to a portfolio with a high exposure to domestic securities, they should be incorporated into the decision process. Although they are not of great concern in the four countries we have focused on, these risk factors could affect the decisions of investors domiciled or investing elsewhere.
Detailed analyses of a country’s political, regulatory, or structural risks can often be obtained from specialized consulting firms or global organizations. The World Bank and the International Finance Corporation (2011), for example, publish a ranking of the ease of doing business in more than 150 different countries. The survey ranks countries based on a number of factors, including investor protection. We used investor protection rankings as a proxy for corporate governance in our analysis, and the results in Figure 9 reveal strong investor protections in the United States, Canada, and the United Kingdom and a weaker rating for Australia. Investors in the U.K., the United States, and Canada might consider such ratings as additional justification for a home bias, whereas Australian investors might see them as
further reason to be more globally diversified. Of course, we have used this rating as just one example; an investor may consider many other possible country-specific risk factors and easily incorporate them into this framework.
Putting it all together in an asset allocation decision
In general, the quantitative factors we have included in our framework suggest that a U.S. investor may somewhat rationally decide to overweight domestic securities. Similarly, investors in the United Kingdom, Canada, and Australia might consider increasing their foreign allocations. Figure 10 provides a generalized summary of how each country looks within the framework. Investors should carefully weigh the importance of each factor to their unique circumstances to arrive at a final allocation.
Figure 11, on page 14, presents a hypothetical example of how an investor might adapt the framework we have provided to his or her unique circumstances. Our example profiles an individual Australian national who starts with an allocation to foreign stocks equivalent to the aggregate home bias. In other words, the investor represents the “average” Australian equity investor, with about a 25% allocation to international equities.
Economy Protecting investors ranking
United States 5th
United Kingdom 10th
Australia 65th
Canada 5th (tie with United States)
Source: Rankings from Doing Business 2012: Doing Business in a More Transparent World (World Bank and International Finance Corporation, 2011).
World Bank ranking on the ease of doing businessFigure 9.
13
A first step for many investors is to evaluate the quantitative impact of adding additional foreign equities. Based on our historical mean variance analysis, this could motivate the investor to increase his or her foreign exposure up to 50% of the equity allocation. Sector concentration, security concentration, and liquidity all would suggest that our investor incrementally increase his or her foreign exposure. These factors could either provide additional justification for moving to the 50/50 split or push the investor closer to a market-proportional allocation.
Our example assumes the investor is in a marginal tax bracket in which holding domestic, dividend-paying stocks results in a tax credit benefit. While
major regulatory constraints do not apply in the countries we have highlighted, they do represent a significant challenge in some countries, where investors would have to reduce their foreign allocation accordingly. Other unique risk factors could lead to additional diversification or to a scaling back of the more quantitative metrics.
The net result of this process could result in a portfolio that is more globally diversified—or, equally, it could provide reasonable justification for home bias. In practice, each investor’s allocation likely lies somewhere between a “biased” 100% domestic portfolio and a market-cap-weighted global portfolio, with no universally right answer.
United States United Kingdom Canada Australia
Historical minimum-variance allocation to foreign equity (using the 1988–2011 period)
20% 20% 70% 50%
Domestic-sector concentration
Domestic-issuer concentration
Domestic transaction costs
Domestic liquidity
Domestic taxes
Other domestic market-risk factors
Summary of quantitative factors affecting asset allocationFigure 10.
Note: Results might vary if another time period were used.
Source: Vanguard.
Low potential impact
Potential impact on asset allocation
Moderate potential impactHigh potential impact
14
Conclusion
Financial theory suggests that investors should hold greater allocations to foreign securities than they do. This home bias is common across asset classes and domiciles. Although there may be many rational reasons for home bias, we present certain metrics that investors can use to help determine an appropriate allocation to foreign securities. Generally speaking, our framework suggests that U.S. investors
may have some quantitative justification for a home bias, and investors in other countries might consider increasing their global diversification. We provide an example of how our framework can be used; however, it or any systematic evaluation process must also be individualized. This approach can help investors objectively and completely analyze the factors involved and arrive at an allocation solution that meets their unique needs.
Figure 11. A hypothetical Australian individual investor conducts a home-bias analysis
0 10 20 30 40 50 60 70 80 90 100%
Foreign allocation
Ending allocation
Startingallocation
Historical risk–return allocation Allocation of historical minimum- variance portfolio.
Domestic-sector variation Sector variation and issuer concentrations relative to world market indicate domestic risk; investor increases international allocation as a result.
Domestic-issuer concentration Sector variation and issuer concentrations relative to world market indicate domestic risk; investor increases international allocation as a result.
Domestic transaction costs Domestic transaction costs slightly higher than international; increase international as a result.
Domestic liquidity “Smaller” investor is unconcerned with domestic liquidity situation.
Other domestic market risk factors Weaker domestic investor protections increase international allocation.
Required international holding limits or impact of liability matching Individual investor not subject to regulatory limits and has no desire to liability match.
Market-proportional
No impact
No impact
Source: Vanguard.
15
References
Adam, Karla, 2010. BP’s Deepwater Oil Spill Hurts British Pensioners, Investors. Washington Post, June 4; available at http://www.washingtonpost.com/wp-dyn/content/article/2010/06/03/AR2010060303805.html.
Craft, Timothy M., 2006. Home Bias Makes Sense for U.S. Pension Plans. Journal of Portfolio Management (Spring): 26–32
Dahlquist, Magnus, Lee Pikowitz, Rene M. Stulz, and Rohan Williamson, 2002. Corporate Governance, Investor Protection, and the Home Bias. Tuck-JQFA Contemporary Corporate Governance Issues II Conference; available at http://ssrn.com/abstract=320222 or http://doi:10.2139/ssrn.320222.
Fidora, Michael, Marcel Fratzscher, and Christian Thimann, 2006. Home Bias in Global Bond and Equity Markets: The Role of Real Exchange Rate Volatility. Working Paper Series No. 685. Frankfurt am Main: European Central Bank.
French, Kenneth R., and James M. Poterba, 1991. Investor Diversification and International Equity Markets. NBER Working Paper No. 3609. Cambridge, Mass.: National Bureau of Economic Research.
Jacob, Marcus, and Martin Jacob, 2011. Taxation, Dividends, and Share Repurchases: Taking Evidence Global. Working Paper; available at http://papers.ssrn.com/sol3/papers.cfm?abstract_id=1532674.
LaBarge, Karin Peterson, 2008. Diversification by Country and Global Sector: Considerations for Portfolio Construction. Valley Forge, Pa.: The Vanguard Group.
LaBarge, Karin Peterson, 2010. Currency Management: Considerations for the Equity Hedging Decision. Valley Forge, Pa.: The Vanguard Group.
Philips, Christopher B., 2012. Considerations for Investing in Non-U.S. Equities. Valley Forge, Pa.: The Vanguard Group.
Philips, Christopher B., Francis M. Kinniry Jr., and Yan Zilbering, 2010. Are Investors Truly Embracing International Diversification? Valley Forge, Pa.: The Vanguard Group.
Philips, Christopher B., Joseph Davis, Andrew J. Patterson, and Charles J. Thomas, 2012. Global Fixed Income: Considerations for U.S. Investors. Valley Forge, Pa.: The Vanguard Group.
Rydqvist, Kristian, Joshua Spizman, and Ilya Strebulaev, 2010. The Evolution of Aggregate Stock Ownership: A Unified Explanation. Working Paper; available at http://ssrn.com/sol3/paperscfm?abstract_id=1461985.
Speidell, Lawrence S., and Hongyu Xing, 2004. One World—The Case for Global Portfolios. Journal of Investing (Spring): 5–13.
Strong, Norman, and Xinzhong Xu, 2003. Understanding the Equity Home Bias: Evidence from Survey Data. Review of Economics and Statistics 85: 307–12.
Tesar, Linda L., and Ingrid Werner, 1995. Home Bias and High Turnover. Journal of International Money and Finance 14(4): 467–492.
World Bank and International Finance Corporation, 2011. Doing Business 2012: Doing Business in a More Transparent World. Washington, D.C.: World Bank and IFC.
For Financial Advisers only. Not to be given to retail investors.Vanguard Investments Australia Ltd (ABN 72 072 881 086/ AFS Licence 227263) is the product issuer. We have not taken your or your clients’ circumstances into account when preparing this publication so it may not be applicable to the particular situation you are considering. You should consider your and your clients’ circumstances, as well as our Product Disclosure Statement (PDS), before making any investment decision or recommendation. You can access our PDS at vanguard. com.au or by calling 1300 655 102. This publication was prepared in good faith and we accept no liability for any errors or omissions. Past performance is not an indication of future performance. Not all articles are prepared by Vanguard so they may not represent our views.