THE ROLE OF INSULIN IN ADVANCED PROSTATE CANCER Dr Ian McKenzie BMedSci, MBBS (Hons) Submitted in fulfilment of the requirements for the degree of Masters of Applied Science (Research) Faculty of Science and Technology Queensland University of Technology Australian Prostate Cancer Research Centre - Queensland February 2011
Transcript
THE ROLE OF INSULIN IN ADVANCED PROSTATE CANCER
Dr Ian McKenzie BMedSci, MBBS (Hons)
Submitted in fulfilment of the requirements for the degree of
Masters of Applied Science (Research)
Faculty of Science and Technology
Queensland University of Technology
Australian Prostate Cancer Research Centre - Queensland
February 2011
i
The Role of Insulin in Advanced Prostate Cancer i
Keywords
Advanced Prostate Cancer
Androgen Deprivation Therapy
Castrate Resistant Prostate Cancer
Hormone Therapy
Insulin
Insulin-like Growth Factor (IGF)
Metabolic Syndrome
ii
ii The Role of Insulin in Advanced Prostate Cancer
Abstract
Advanced prostate cancer is a common and generally incurable disease.
Androgen deprivation therapy is used to treat advanced prostate cancer with good
benefits to quality of life and regression of disease. Prostate cancer invariably
progresses however despite ongoing treatment, to a castrate resistant state. Androgen
deprivation is associated with a form of metabolic syndrome, which includes insulin
resistance and hyperinsulinaemia. The mitogenic and anti-apoptotic properties of
insulin acting through the insulin and hybrid insulin/IGF-1 receptors seem to have
positive effects on prostate tumour growth. This pilot study was designed to assess
any correlation between elevated insulin levels and progression to castrate resistant
prostate cancer.
Methods: 36 men receiving ADT for advanced prostate cancer were recruited,
at various stages of their treatment, along with 47 controls, men with localised
prostate cancer pre-treatment. Serum measurements of C-peptide (used as a surrogate
marker for insulin production) were performed and compared between groups.
Correlation between serum C-peptide level and time to progression to castrate
resistant disease was assessed.
Results: There was a significant elevation of C-peptide levels in the ADT
group (mean = 1639pmol/L)) compared to the control group (mean = 1169pmol/L),
with a p-value of 0.025. In 17 men with good initial response to androgen
deprivation, a small negative trend towards earlier progression to castrate resistance
with increasing C-peptide level was seen in the ADT group (r = -0.050), however
this did not reach statistical significance (p>0.1).
Conclusions: This pilot study confirms an increase in serum C-peptide levels in
men receiving ADT for advance prostate cancer. A non-significant, but negative
trend towards earlier progression to castrate resistance with increasing C-peptide
suggests the need for a formal prospective study assessing this hypothesis.
iii
The Role of Insulin in Advanced Prostate Cancer iii
Table of Contents
Keywords.................................................................................................................................................. iAbstract ................................................................................................................................................... iiTable of Contents ................................................................................................................................... iiiList of Figures ......................................................................................................................................... vList of Tables.......................................................................................................................................... viList of Abbreviations............................................................................................................................. viiCHAPTER 1: INTRODUCTION........................................................................................................ 11.1 Background.................................................................................................................................... 11.2 Context........................................................................................................................................... 31.4 Hypothesis ..................................................................................................................................... 41.5 Purposes......................................................................................................................................... 51.6 Thesis Outline................................................................................................................................ 6CHAPTER 2:SCIENTIFIC BACKGROUND.................................................................................. 92.1 The Prostate ................................................................................................................................... 92.2 Prostate Cancer ............................................................................................................................ 10
2.2.1 Localised Prostate Cancer............................................................................................... 112.2.2 Advanced Prostate Cancer .............................................................................................. 14
2.3 Androgen Deprivation Therapy................................................................................................... 152.4 The Metabolic Syndrome ............................................................................................................ 192.5 Insulin and Insulin-Like Growth Factor ...................................................................................... 20CHAPTER 3:LITERATURE REVIEW ......................................................................................... 253.1 Historical Background ................................................................................................................. 253.2 Metabolic Syndrome and Androgen Deprivation Therapy ......................................................... 263.3 Insulin and Cancer ....................................................................................................................... 313.4 Insulin and Prostate cancer .......................................................................................................... 353.5 The Role of Androgen in Castrate Resistant Prostate Cancer ..................................................... 413.6 Discussion and Future ................................................................................................................. 44CHAPTER 4:RESEARCH DESIGN ............................................................................................... 474.1 Methodology and Research Design ............................................................................................. 47
4.1.1 Methodology................................................................................................................... 474.1.2 Research Design ............................................................................................................. 47
iv The Role of Insulin in Advanced Prostate Cancer
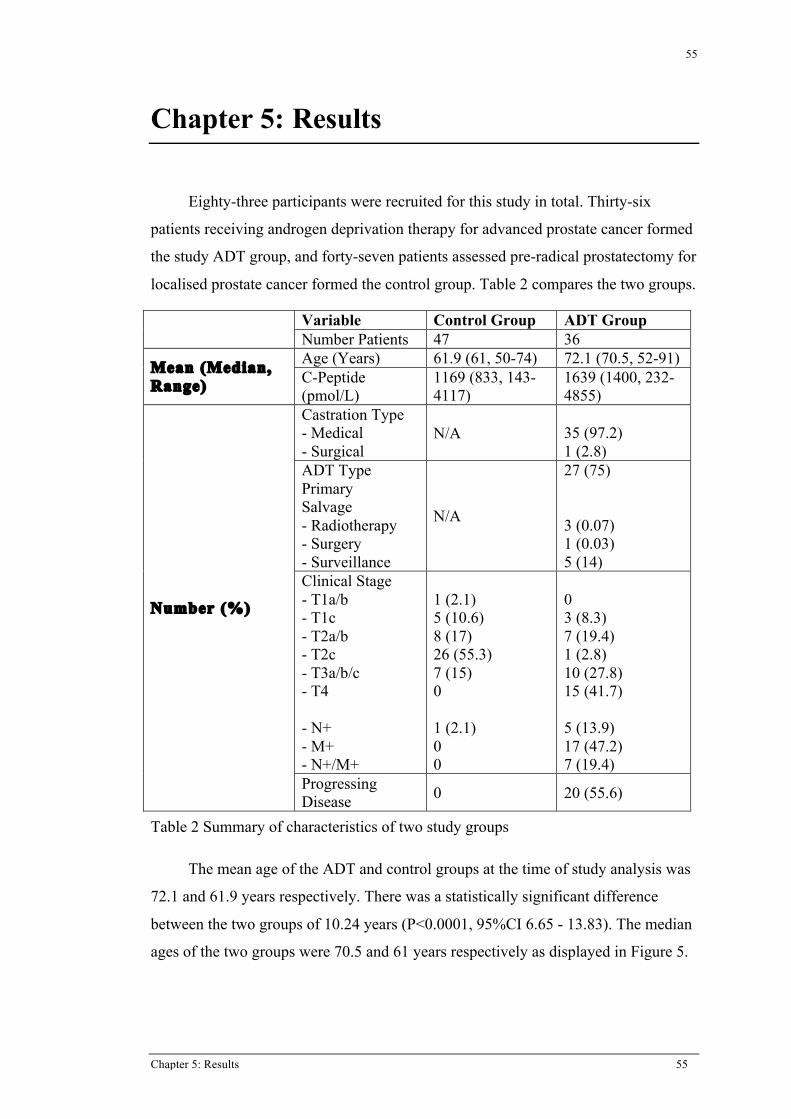
CHAPTER 5:RESULTS ................................................................................................................... 555.1 Androgen Deprivation Therapy and C-Peptide ........................................................................... 575.2 C-Peptide and Progression of Prostate Cancer ............................................................................ 60CHAPTER 6:ANALYSIS ................................................................................................................. 676.1 Androgen Deprivation Therapy and C-Peptide ........................................................................... 676.2 C-Peptide and Progression of Prostate Cancer ............................................................................ 72CHAPTER 7:CONCLUSIONS ........................................................................................................ 777.1 Summary of Findings and Future Plans ...................................................................................... 77BIBLIOGRAPHY ............................................................................................................................... 81 ACKNOWLEDGEMENTS …………………………………………………………………………86
v
The Role of Insulin in Advanced Prostate Cancer v
List of Figures
Figure 1 Insulin, IGF-I and IGF-II signalling through IGF-I receptor5 .................................................. 4Figure 2 Insulin Receptor and its downstream pathways17 ................................................................... 21Figure 3 Schematic diagram of different ligand and receptor subtypes of the Insulin/IGF
system in physiological and pathological conditions (HR – Hybrid Receptor). IR-A and HR-A present in tumour and poorly differentiated tissues19 ......................................... 23
Figure 4 Representative staining of benign and malignant prostate tissue showing expression of IGF-1 and insulin receptors49 ............................................................................................... 41
Figure 5 Box Plot demonstrating Age (in years) range between control and ADT groups .................. 56Figure 6 Box Plot comparing age at time of prostate cancer diagnosis between control and
ADT groups .......................................................................................................................... 56Figure 7 Box Plot comparing age at time of onset of ADT with control group.................................... 57Figure 8 Box plot comparing serum C-peptide levels between control and ADT groups .................... 58Figure 9 Scatter plot comparing age to C-peptide level for the total study population......................... 59Figure 10 Scatter plot comparing age to C-peptide level for the control group only............................ 59Figure 11 Scatter plot comparing duration of ADT to serum C-peptide level...................................... 60Figure 12 Scatter plot comparing time to castrate resistant prostate cancer with serum C-
peptide .................................................................................................................................. 61Figure 13 Scatter plot comparing time to castrate resistance excluding PSA non-responders ............. 62Figure 14 Scatter plot of time to castrate resistance excluding diabetics and PSA non-
responders............................................................................................................................. 63Figure 15 PSA kinetics of ADT group patients with PSA<100 at time of onset ADT grouped
by serum C-peptide .............................................................................................................. 65
vi
vi The Role of Insulin in Advanced Prostate Cancer
List of Tables
Table 1 Adaptation of risk stratification for localised prostate cancer8 ................................................ 11Table 2 Summary of characteristics of two study groups ..................................................................... 55
vii
The Role of Insulin in Advanced Prostate Cancer vii
List of Abbreviations
ADT – Androgen Deprivation Therapy BMI – Body Mass Index – equal to mass/ (height in metres) 2 CRPC - Castrate Resistant Prostate Cancer DES - Diethylstilboestrol DHT – Dihydrotestosterone GnRH – Gonadotrophin Releasing Hormone HDL – High Density Lipoprotein IGF-1 and IGF-2 – Insulin-like Growth Factor types 1 and 2 IGF-1R – Insulin-like Growth Factor type 1 Receptor IR – Insulin Receptor IRS – Insulin Receptor Substrate LDL – Low Density Lipoprotein LH – Luteinizing Hormone LHRH – Luteinizing Hormone Releasing Hormone MAPK – Mitogen-associated Protein Kinase PI3K – Phosphatidylinositol 3 Kinase PSA – Prostate Specific Antigen SHBG – Sex-hormone Binding Globulin SREBP – Sterol Response Element Binding Protein
viii
viii The Role of Insulin in Advanced Prostate Cancer
Statement of Original Authorship
The work contained in this thesis has not been previously submitted to meet
requirements for an award at this or any other higher education institution. To the
best of my knowledge and belief, the thesis contains no material previously
published or written by another person except where due reference is made.
Signature: _________________________
Date: _________________________
Chapter 1: Introduction 1
1
Chapter 1: Introduction
This chapter outlines the background (section 1.1) and context (section 1.2) of
this research. It describes the purposes (section 1.3) of the research project as well as
the scope and significance (section 1.4) of the issues identified. Section 1.5 will
outline the remaining chapters of this thesis.
1.1 BACKGROUND
Prostate cancer is the most commonly diagnosed cancer in Australia. The most
recently published data by the Australian Institute of Health and Welfare showed that
in 2006, prostate cancer constituted 29.5% of all cancers diagnosed in Australian
men. It was the second leading cause of cancer-related mortality in Australian males
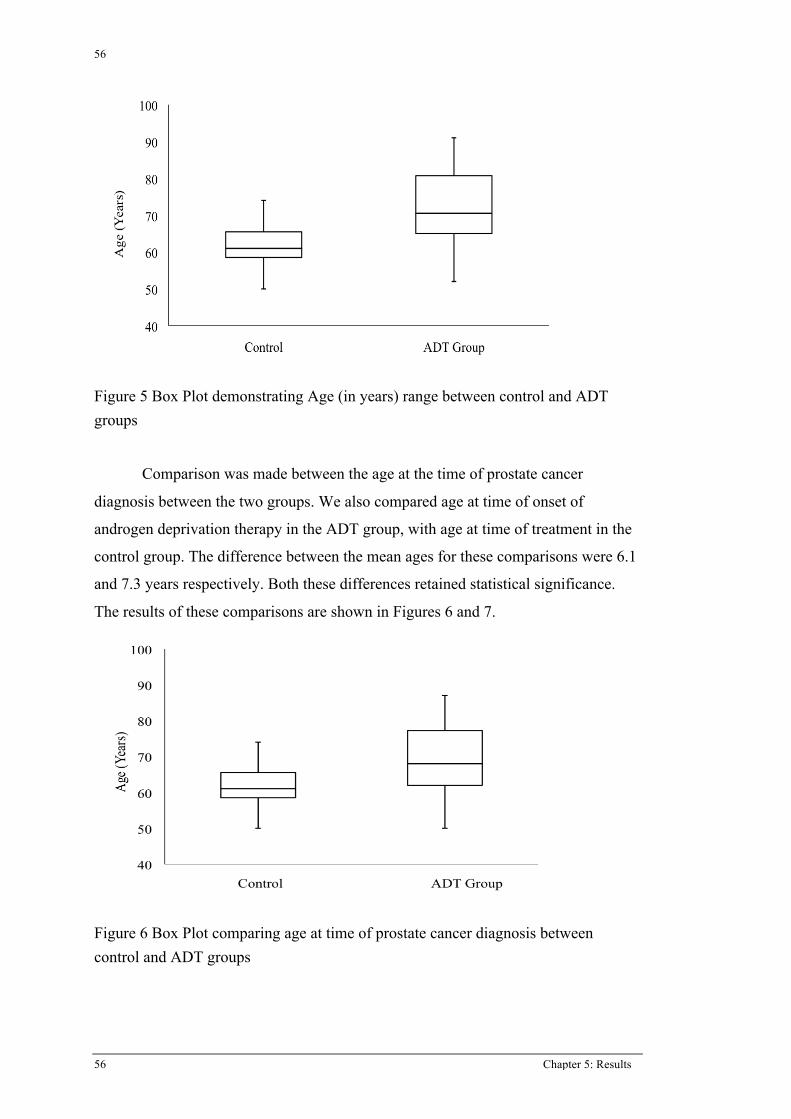
behind lung cancer1.
Prostate cancer is a disease unique to men (the prostate gland being present
only in men) and increases in incidence with increasing age. Peak incidence occurs
between the ages of 70-74 years of age with the disease exceedingly rare below the
age of 40 years. In prostate cancer cases, greater than 85% are diagnosed in men over
the age of 65 years. The incidence of prostate cancer is increasing. Each year of the
decade from 1997 to 2006, the number of cases of prostate cancer diagnosed per year
increased steadily. The Age Standardised incidence for prostate cancer in men for
2006 was 170 cases per 100,000 people. An Australian man had a 1 in 7 risk of being
diagnosed with prostate cancer to the age of 75 years old, with a 1 in 89 chance of
dying of prostate cancer from the latest available data in 20061.
There are two possible explanations for this increase. The first is that more
people are developing prostate cancer. The alternative to this is that diagnostic
practices are changing, leading to an increase in detection of the unchanged,
previously undiagnosed volume of prostate cancer in the community. Prostate
Specific Antigen (PSA), a protein secreted uniquely by the prostate has been used to
varying degrees to screen for prostate cancer. Whilst the test is not specific for
prostate cancer, it has been promoted, and its use significantly increased, as a means
of early detection of prostate cancer. Testing for PSA became widely available in
Australia during the late 1980s. Since that time the rates of prostate cancer diagnosis
2
2 Chapter 1: Introduction
have steadily increased1. It is likely that with the introduction of PSA testing,
prostate cancers are now being diagnosed, that prior to PSA testing in the community
would have remained clinically asymptomatic and therefore undiagnosed. There is
significant controversy surrounding this issue with debate over the appropriateness of
widespread PSA screening. The risk of early detection of prostate cancer that would
otherwise have remained indolent is that of overtreatment. Treatment modalities for
localised prostate cancer carry significant morbidity and low but defined risk of
mortality. The early detection of low-grade prostate cancers via PSA screening has
likely subjected a number of patients to unnecessary intervention and morbidity for
otherwise indolent disease. PSA testing is more widely used as a means of
monitoring for prostate cancer progression after diagnosis whether or not the patient
receives treatment for their prostate cancer, a use for which it is proven to be of great
value.
Regardless of the reason for the increasing incidence of prostate cancer, it
remains a significant public health problem with a significant associated morbidity
and mortality.
The demographics of the Australian population are changing also. Australia's
population, like that of most developed countries, is ageing as a result of sustained
low fertility and increasing life expectancy. During the period 30 June 1990 to 30
June 2010, the median age (the age at which fifty percent of the population is older
and fifty percent younger) of the Australian population has increased by 4.8 years,
from 32.1 to 36.9 years. Over the same period, the proportion of the Australian
population aged over 65 years increased from 11.1% to 13.5%. The total number of
elderly people increased by 170.6% compared with a total population growth of
30.9% over the same period2. Over the next several decades, population ageing is
expected to have significant implications for Australia in many areas including
health, labour force participation, housing and demand for skilled labour3. Given that
prostate cancer is a disease of the older population, one would therefore expect its
incidence to increase, making its management an increasing health burden for
society.
3
Chapter 1: Introduction 3
1.2 CONTEXT
Prostate cancer that is localized can be successfully treated with either surgery
or radiotherapy with each giving a good chance of cure. Once prostate cancer has
spread outside the prostate, either locally into adjacent structures or to distant sites,
most commonly lymph nodes or bone, the management is less successful. In these
cases, the most common treatment is androgen deprivation therapy (ADT). This
entails use of medication or surgical removal of the testes to lower serum androgen
levels and therefore deprive prostate cancer cells of testosterone. This causes
apoptosis in androgen-dependent prostate cancer cells and in most cases, clinical
regression of disease. This is clinically best measured as a decline in serum PSA.
Advanced prostate cancer is defined to include the following patient groups:
1. Clinically locally advanced prostate cancer. This is clinical stage T3
(extending outside the prostatic capsule) or T4 disease (invading
outside the prostate into adjacent structures e.g. the bladder).
2. Prostate cancer that has metastasized to any site distant from the
prostate. This most commonly involves the lymph nodes or bones,
though it can spread to other organs as well.
3. Patients with a biochemical recurrence of prostate cancer. This is
defined as a rising PSA after previous definitive therapy for prostate
cancer (usually in the form of surgery or radiotherapy).
In these patient groups, when ADT is used it achieves a good response in the
majority of cases with a decline in PSA, clinical improvement in extent of disease,
and often symptomatic relief.
Unfortunately, the response to ADT is not a durable one. Almost universally,
men on ADT will eventually progress, often initially signalled by a rise in PSA
despite castrate serum testosterone levels. The median time to progression for men
with metastatic disease is 14-20 months post initiation of ADT4. This phase of
disease is known as Castrate Resistant Prostate Cancer (CRPC) and is almost
universally fatal. To date, despite many theories as to why and how CRPC develops,
there is no clear consensus. Clearly, understanding the mechanism behind CRPC
development is the key to developing new therapies and improving the outlook for
men with advanced prostate cancer. It is with this cohort of patients in mind that this
4
4 Chapter 1: Introduction
research project has been developed, attempting to assist in the understanding of the
development of CRPC to help direct future development of possible therapeutic
agents for this poorly understood phase of prostate cancer.
1.4 HYPOTHESIS
There is a large amount of published and ongoing research, examining the
effects of insulin and the insulin-like growth factors 1 and 2 (IGF-1 and IGF-II) on
cancer, including prostate cancer as will be outlined later in the literature review
(Chapter 3). The insulin and IGF-1 receptors are tyrosine kinase receptors, sharing
common downstream pathways; exhibiting both mitogenic and anti-apoptotic
properties (see Figure 1). Because these effects are ideal for cancer cell growth, it has
sparked significant interest in what role, if any, they may play in cancer, and
specifically prostate cancer progression.
Figure 1 Insulin, IGF-I and IGF-II signalling through IGF-I receptor5
There is significant epidemiological evidence suggesting a link between
elevated serum insulin levels and development and progression of multiple types of
cancers, including prostate cancer. The association of elevated serum insulin levels
and faster progression of prostate cancer have been demonstrated by in vitro studies
5
Chapter 1: Introduction 5
of prostate cancer cell lines and in vivo mouse models of prostate cancer. This
evidence is described in detail in Chapter 3.
ADT has numerous side effects. The most common of these include hot
flashes, anaemia, loss of bone mineral density and osteoporosis, loss of libido and
erectile dysfunction. ADT also induces weight gain with increases in percentage
body fat mass and loss of lean body mass. More recently, the extent of the metabolic
side effects associated with ADT has become apparent. ADT induces insulin
resistance, with associated elevation of serum insulin levels, altered serum lipid
levels, and an increased risk of developing both diabetes mellitus and cardiovascular
disease. The details of these changes are further discussed in chapter 3.
Combining this information, we identified four key points:
ADT whilst initially causing regression of prostate cancer invariably
progresses despite ongoing therapy with castrate serum testosterone levels
(castrate resistant prostate cancer)
Serum insulin increases with androgen deprivation therapy in advanced
prostate cancer
Elevated serum insulin is associated with the development and progression of
cancers including prostate cancer
In vitro experiments demonstrate more rapid prostate cancer progression with
elevated serum insulin levels
This led to the development of the following hypothesis upon which this
project is based:
Serum insulin increases due to Androgen Deprivation Therapy for
prostate cancer, and this hyperinsulinaemia is directly correlated to prostate
cancer progression to Castrate Resistant Prostate Cancer.
1.5 PURPOSES
New studies are being developed looking at altering the insulin axis and
assessing how this affects prostate cancer growth and progression. Areas of
particular interest focus on affecting the availability of ligand available to bind to the
insulin receptor, or altering the insulin receptor and its actions with either anti-insulin
receptor antibodies or tyrosine kinase inhibitors. This work is based on the
6
6 Chapter 1: Introduction
assumption that insulin is positively affecting prostate cancer growth and
progression. In the available literature however, there are no investigations in the
human prostate cancer patient population correlating elevated serum insulin levels
with progression of disease in men with advanced prostate cancer receiving androgen
deprivation therapy. This significant gap in the literature is what this project is
aiming to address.
This project was designed as a pilot study to assess serum insulin levels,
using serum C-peptide, a surrogate marker for endogenous insulin production, in
men receiving ADT for their advanced prostate cancer. The main objectives of the
study were as follows:
To confirm the literature findings that men who are receiving ADT have
elevated serum C-peptide levels compared to men not receiving ADT.
To correlate elevated C-peptide levels with ADT with the progression of
advanced prostate cancer to the castrate resistant phase. In accordance with
our hypothesis, we believe that men with a higher serum C-peptide level, will
progress to castrate resistance at a more rapid rate than those with lower
serum C-peptide level. This pilot study aims to identify a correlation to justify
the design of a formal trial to further investigate this correlation.
1.6 THESIS OUTLINE
This thesis takes the following structure. Chapter 2 describes the scientific
background to the problem under consideration. It describes prostate cancer
pathology, pathogenesis, diagnosis and treatment. It describes the physiology of
androgen deprivation therapy as well as its side effects. It discusses the metabolic
syndrome, its definition and its consequences. Finally, chapter 2 outlines the
structure and function of insulin, the insulin receptor and its signalling.
Chapter 3 encompasses the literature review. Section 3.1 outlines the
evidence linking the metabolic syndrome and androgen deprivation therapy. Section
3.2 describes the association between insulin and cancer and section 3.3 between
insulin and prostate cancer. The combined literature forms the grounding for the
hypothesis under investigation in this thesis.
7
Chapter 1: Introduction 7
Chapter 4 describes the materials and methods of this study. It explains
participant features and methods of patient recruitment, techniques for measurement
of serum C-peptide and the methods of statistical analysis performed.
Chapter 5 presents the results of this study.
Chapter 6 synthesises the relevant results and discusses them in relation to the
study hypothesis.
Chapter 7 summarises our findings and presents a plan for future investigation
of this topic.
8
8 Chapter 1: Introduction
Chapter 2: Scientific Background 9
9
Chapter 2: Scientific Background
This chapter outlines the basic scientific context of this project. Section 2.1
outlines the anatomy and physiology of the prostate gland. Section 2.2 discusses the
pathophysiology of prostate cancer, its diagnosis and staging, and its management.
Section 2.3 discusses androgen deprivation therapy, its uses and mechanisms, and
discusses its side effects. Section 2.4 discusses the metabolic syndrome, its definition
and its consequences.
2.1 THE PROSTATE
The prostate is a male sex accessory organ. It is retroperitoneal in location
lying beneath the bladder in the pelvis, above the urogenital diaphragm, and
immediately anterior to the rectum. It is penetrated throughout its length by the
proximal urethra. It is a glandular organ and provides approximately 30% of the
volume of the seminal fluid. It is made up of glandular acini embedded in a fibro-
muscular stroma. It can be divided into 4 zones, differing on histology. The anterior
or fibro-muscular zone consists of smooth muscle, with little to no glandular
elements. The central and transitional zones surround the urethra and contain
approximately 25% of the prostate glandular elements. Finally the peripheral zone
makes up 75% of the glandular component of the prostate6.
The prostate is supported in its growth, maintenance and secretion by various
hormones, the foremost being testosterone. This hormone is converted in the prostate
to its more active constituent dihydrotestosterone (DHT). The primary source of
testosterone is from the testes. Testosterone is produced de novo in the Leydig cells
of the testes under the influence of luteinizing hormone (LH), and is secreted into the
circulation where it is mostly bound to sex-hormone binding globulin (SHBG). LH is
produced by the pituitary gland in response to Luteinizing Hormone Releasing
Hormone (LHRH) from the hypothalamus. These three hormones work in a feedback
loop such that when testosterone is low, it stimulates the hypothalamus to produce
more LHRH, which in turn stimulates the pituitary to produce LH, leading to
increased testosterone production from the testes. Alternatively, when serum
testosterone is elevated, LHRH production by the hypothalamus decreases, leading to
10
10 Chapter 2: Scientific Background
decreased LH secretion from the pituitary gland and subsequently decreased
testosterone production from the testes. This is known as the hypothalamic-pituitary-
testicular axis.
In addition to testosterone, androgen is produced from the adrenal gland in the
form of androstenedione. This is a weak androgen, which can be converted
peripherally to testosterone. This likely only contributes approximately 5% of serum
testosterone concentration. The contribution of adrenal androgen to prostatic growth
and function appears to be minimal7.
2.2 PROSTATE CANCER
Prostate cancer, in the majority of cases is an adenocarcinoma with well-
defined, readily demonstrable glandular patterns. Approximately 70% of cases
involve the lateral or peripheral zone of the prostate. Adenocarcinoma of the prostate
is multifocal in more than 85% of cases8. Because of this classically posterior
location for cancer, tumours may be palpable by clinical digital rectal examination.
Prostate cancer is graded according to the histological appearance of the
prostate tissue. The tissue is allocated a numerical grade, from 1 to 5, based on
glandular patterns and the degree of differentiation. Grade 1 is well differentiated,
down to grade 5, which is very poorly or undifferentiated. Tissue usually contains
more than one pattern of grade so the predominant pattern is assigned a primary
grade, and the subdominant pattern assigned a secondary grade. The two grades are
added to give an overall score known as the Gleason score. This is known as the
Gleason system of grading. Tissue grading is important in prostate cancer, as it has
been shown, along with the stage of disease and PSA to accurately predict
prognosis9.
Like the benign prostate, prostate cancer is heavily dependent on testosterone
for both its development and progression. The anabolic effects resulting from
activation of the androgen receptor play a critical role in the growth of prostate
cancer cells. This becomes extremely important when considering possible treatment
options for prostate cancer patients. It is this dependence that forms the underlying
basis for androgen deprivation therapy.
Staging of prostate cancer is routinely via the TNM system. This is the
Tumour, Node and Metastasis system of staging. T1 represents cancer found
11
Chapter 2: Scientific Background 11
incidentally on trans-urethral resection for benign hypertrophy symptoms (T1a or
T1b depending on the volume of disease found) or T1c for disease, found on needle
biopsy performed for investigation of an elevated PSA, which is not clinically
palpable on digital rectal examination. T2 is cancer palpable on digital rectal
examination that is still organ confined. T3a and T3b tumours extend outside the
prostatic capsule without and with seminal vesicle involvement respectively. T4
disease directly invades adjacent organs. Any spread to lymph nodes is recorded as
either present or absent, regardless of extent (N1 or N0 respectively). Any metastatic
spread, whether to bones or soft tissue is denoted as M1 disease (M0 allocated if no
metastases). Each individual tumour is allocated a T, N and M rating based on its
individual characteristics, and this is the clinical stage of disease10.
D’Amico and colleagues designed a category description (low, intermediate or
high) based on clinical prostate cancer stage, prostate biopsy Gleason grade, and
PSA level at the time of diagnosis of prostate cancer. This category was designed to
reflect the risk of prostate cancer recurrence following attempted curative therapy for
localized prostate cancer. This classification has been shown to reflect clinical
behaviour and prognosis for prostate cancer11.
Level of Risk Low Intermediate High
PSA level (ng/mL) <10 10-20 >20
Biopsy Gleason Score <6 7 8-10
Clinical T stage T1, T2a T2b T2c
Table 1 Adaptation of risk stratification for localised prostate cancer11
2.2.1 LOCALISED PROSTATE CANCER
Localized prostate cancer is defined as tumour that remains localized to the
prostate gland (i.e. clinical T1 or T2 disease). Within this group of tumours, there is
wide variation in natural history of the disease based on the level of differentiation
measured via Gleason grade, and serum PSA, both of which help to determine
prognosis for an individual’s disease. Localized prostate cancer can be managed in
multiple ways. These include active surveillance, surgery and radiotherapy. The
choice of appropriate treatment depends on both tumour and patient related factors.
These include the individual tumour characteristics such as Gleason grade, serum
12
12 Chapter 2: Scientific Background
PSA and clinical stage. The patient’s age, other medical co-morbidities and projected
survival from non-cancer causes, as well as the personal choice of the patient and the
treating physician also play a significant role in the decision for any treatment.
Active surveillance is a method of closely monitoring a patient with low risk,
localized prostate cancer with the aim of instituting active management should there
be concerning changes in PSA or on a repeat prostate biopsy. One rationale for this
management is the belief that PSA screening is detecting a population of prostate
cancers that, without screening would never have been detected in the patient’s
lifetime and wouldn’t have caused significant disability or death. Because of the
possible significant side effects of treatment for prostate cancer, there may be a
population of patients in whom the risks of side effects of curative treatment are
deemed to be more significant than the risk of progression of cancer. To date
however there is no consensus as to which patients are suitable for this form of
management and at what point active treatment should be instigated. Delayed
treatment has usually been reserved for men with less than 10 years life expectancy
and low grade localized disease. There is however a push to define a group of
younger men with low risk, small volume, low grade disease who may be suitable for
active surveillance7. There is however more research required to properly define this
group and to validate outcomes over a prolonged period before this can be routinely
recommended for younger men12.
Clinical T1 or T2 disease, and in a small number of cases, favourable T3
disease, can be treated with surgery in the form of a radical prostatectomy. This
operation removes the entire prostate gland including the seminal vesicles, but
sparing the external urinary sphincter mechanism. The bladder neck is reconstituted,
and anastomosed to the proximal urethra. The operation may be accompanied by a
pelvic lymph node dissection, which gives additional pathological staging
information. There is ongoing debate as to whether lymph node dissection provides
any additional benefit with regards to local control of prostate cancer7. Currently in
Australia, pelvic lymph node dissection is not routinely performed during a radical
prostatectomy. It is considered in high-risk localized disease for its pathological
staging information. This operation gives a good chance of cure of localized disease,
although progression rates, either biochemical recurrence or metastases, as well as
survival rates vary, depending on the individual pathological characteristics of the
13
Chapter 2: Scientific Background 13
tumour13. Adverse prognostic features following radical prostatectomy include non–
organ-confined disease, perineural, lymphatic or vascular space invasion, extra
capsular tumour extension, positive surgical margins, seminal vesicle invasion, and
lymph node metastases. In men with pathologically organ-confined disease, the 10-
year cancer progression-free survival approaches 90% following radical
prostatectomy13.
External beam radiotherapy uses beams of gamma radiation directed at the
prostate and surrounding tissues. Modern 3-dimensional conformal therapy allows
more accurate focusing of the radiation dose to the prostate. This allows higher doses
to be given which has been shown to improve cancer outcomes, also minimizing
radiation damage to adjacent structures such as the bladder and rectum, which were
significant limitations with older forms of radiation therapy to the prostate. In spite
of these improvements the main side effects of radiation therapy remain bladder and
rectal toxicity, as well as damage to the sphincter muscle and urethra, with associated
urinary incontinence. There is also risk of erectile dysfunction due to damage to the
vasculature of the cavernous nerves and corpora cavernosa involved in penile
erection. Radical prostatectomy is still considered the gold standard treatment for
men with localized prostate cancer. Therefore, the majority of radiotherapy is given
to older men, or men who would not tolerate surgery with localized disease, or men
with high risk localized disease or locally advanced disease7. Research has shown
that better outcomes in all parameters are achieved from radiotherapy for prostate
cancer, if adjuvant long-term androgen deprivation therapy is given to men with
locally advanced or high-risk localized disease, or short-term (6 months) ADT for
men with intermediate risk localized disease14. 10-year cancer cure rates for localized
disease with standard external beam radiotherapy are about 50%. With newer 3D
conformal radiotherapy allowing radiation dose escalation and adjuvant androgen
deprivation, better outcomes are reported with 5-year progression-free probabilities
for localized tumours reported between 70-85%. At this time there is little data on
long-term durability of response in younger patients with these newer treatment
regimens. There are no randomized controlled trials comparing results of
radiotherapy with radical prostatectomy for low risk disease7.
14
14 Chapter 2: Scientific Background
2.2.2 ADVANCED PROSTATE CANCER
Advanced prostate cancer has been defined in multiple ways. Current consensus
includes any of the following groups of patients:
Locally advanced prostate cancer. This includes clinical stage T3 or T4
disease.
Biochemical recurrence following previous curative therapy. This can be due
to residual local tumour, metastatic tumour deposits, or both. The rising PSA
usually occurs well before any clinical parameters or imaging modalities can
detect recurrence of disease. Biochemical recurrence is defined as a rise in
PSA after reaching a post-treatment nadir (the lowest point PSA reaches after
treatment).
Metastatic prostate cancer, whether to lymph nodes, bone or soft tissue. The
most common sites for metastases from prostate cancer are lymph nodes and
bone15.
There are different definitions for what should be considered a recurrence
following either radical prostatectomy or radiotherapy. Following radical
prostatectomy, PSA should become undetectable in blood, due to the removal of all
viable prostate tissue. Multiple definitions have been used however a consensus
definition of biochemical failure post radical prostatectomy published by the Prostate
Cancer Working Group, defined it as a PSA of 0.4ng/mL or higher, greater than 8
weeks post surgery, and that continues to rise on a subsequent measurement16.
Following radiotherapy, the prostate is still in situ, therefore benign prostate tissue
may still survive, producing PSA without there being any viable tumour remaining.
Therefore the definition of biochemical recurrence following radiotherapy is not so
clear. The American Society for Therapeutic Radiology and Oncology (ASTRO)
produced guidelines on this issue, defining recurrence as three consecutive PSA rises
after reaching nadir PSA level, measured at least 3 months apart, with the date of
failure taken as the mid-point between nadir PSA and the date of the first rise in
PSA17. This definition however has been widely criticized for underestimating the
incidence of true cancer recurrence and perhaps missing the opportunity for further
curative treatment in some patients. Other definitions have been proposed based on
various absolute PSA values however these are undergoing validation7.
15
Chapter 2: Scientific Background 15
In advanced cases, while a proportion will be considered for radiotherapy,
and a smaller proportion of favourable cases, for radical prostatectomy, the mainstay
of treatment, particularly for metastatic disease and biochemical recurrence, will be
androgen deprivation therapy. By blocking the production of androgen, or inhibiting
androgen receptor binding, the androgen-dependent prostate cells are deprived of
androgen, which induces apoptosis in these cells, with shrinking of the prostate (if
still in situ) and extra-prostatic tumour deposits18. This is clinically seen as a decline
in serum PSA (due to apoptosis of PSA-producing prostate cells), and symptomatic
improvement such as decreased bone pain and improvement in urinary symptoms7.
2.3 ANDROGEN DEPRIVATION THERAPY
It has been known for almost 150 years that prostatic epithelium is
exquisitely sensitive to androgens and will atrophy with castration. In their series of
papers published in the 1940s, Huggins and Hodges presented a small study of 21
men with metastatic prostate cancer who were treated with surgical castration. They
documented a decrease in serum acid phosphatase levels, improvements in X-Ray
appearance of bony metastases as well as an improvement in symptoms in all but 3
cases19. This work was based on the initial findings that acid phosphatase levels were
elevated in both benign and malignant prostate tissue (both primary and secondary)
and increased in response to androgen with the realization that they were
biochemically analogous.
Since those original findings, multiple methods of altering the androgen axis
have been developed. All forms of Androgen Deprivation Therapy function by
decreasing the ability of androgen to activate the Androgen Receptor (AR). This can
be achieved by either decreasing the amount of available androgen, or via blocking
androgen binding to the androgen receptor.
The earliest forms of ADT were via bilateral orchidectomy (surgical removal
of the testes). By removing the testosterone producing Leydig cells of the testes, the
major contributor to serum androgen levels is removed. This procedure leads to a
greater than 90% decrease in serum androgen levels within 24 hours. A small amount
of androgen is produced by the adrenal glands, in the form of androstenedione, and
16
16 Chapter 2: Scientific Background
from peripheral conversion of oestrogen, but these sources provide insignificant
amounts to the overall serum levels of available androgen7.
Androgen supply is controlled centrally via the Hypothalamic-pituitary-
testicular axis. Luteinizing Hormone Releasing Hormone (LHRH) is released from
the hypothalamus to activate the anterior pituitary to produce Luteinizing Hormone
(LH), which acts on the Leydig cells of the testes to stimulate testosterone
production. Serum androgen levels provide a negative feedback loop to the
hypothalamus to regulate LHRH release. The first drugs used to manipulate this
central control of androgen production, was the administration of exogenous
oestrogens, mostly in the form of Diethylstilboestrol (DES). Oestrogens are very
potent inhibitors of LH secretion, therefore causing dramatic decreases in serum
testosterone. DES has been widely studied in advanced prostate cancer, but its use is
limited by an unacceptable cardiovascular toxicity.
The more modern manipulator of central control of androgen production is
the class of LHRH agonists such as Goserelin acetate. After causing an initial surge
in LH secretion, the loss of physiological phasic pituitary stimulation causes
dramatic decreases in LH production, and subsequent castrate testosterone levels.
These are the most common current form of ADT, administered via subcutaneous
depot injection in 1, 3 or 6 monthly preparations. The initial surge in LH, and
therefore testosterone can cause an initial worsening of symptoms, so they are often
administered initially in combination with androgen receptor antagonists in men with
metastatic disease. These preparations are the most common form of ADT currently
in use, with or without androgen receptor antagonists. LHRH antagonists are also
available and do not cause the initial LH and testosterone surge, though their use is
much less common than the agonist preparation7.
Moving from central androgen regulation, there are a wide variety of
androgen receptor antagonists available. All these preparations inhibit androgen
action by competitive binding to the androgen receptor. These come in two classes,
steroidal and non-steroidal forms. The steroidal anti-androgens (e.g. cyproterone
acetate) block androgen receptor binding, but also have progestational effects
causing suppression of central LH release. These drugs therefore work at the cellular
level, as well as decreasing circulating testosterone levels. The non-steroidal anti-
androgens have no anti-gonadotrophic effects and simply block androgen receptor
17
Chapter 2: Scientific Background 17
binding, both at the prostate, and centrally. This has the effect of blocking serum
testosterone’s inhibitory feedback on the hypothalamus, causing a paradoxical
increase in LH and testosterone levels. The advantage of this is that it can minimize
the effect on erection function, one of the major side effects of any androgen
deprivation therapy.
Less commonly used now, some drugs act to inhibit non-testicular androgen
supply. Ketoconazole acts to inhibit adrenal steroid synthesis and also inhibits
testicular Leydig cell testosterone synthesis. Whilst it rapidly induces castrate
testosterone levels, its response is not durable long-term, with testosterone levels
returning to near normal within 5 weeks of continuous therapy. It is now more
commonly used as second line therapy in castrate resistant prostate cancer.
Aminoglutethimide inhibits peripheral conversion of cholesterol to pregnenolone, an
early step in steroid synthesis. Whilst it inhibits testosterone synthesis, it also inhibits
cortisol and aldosterone synthesis. Because of these effects, patients must take long-
term steroid replacement and the medication is associated with significant side
effects. It is now rarely used in practice7.
Androgen deprivation therapy gives a very good, reproducible and durable
response in advanced prostate cancer. The significant majority of patients will show
evidence of clinical response, most commonly in the form of a decline in serum PSA
level. For patients with significant symptoms from their prostate cancer, the initiation
of ADT is very effective in providing relief, as left untreated, these symptoms can
cause significant decline in quality of life. Sharifi et al published a systematic review
of Randomised Controlled Trials examining the efficacy of ADT in 2005. This
demonstrated clear benefit from ADT in terms of quality of life in the setting of
advanced prostate cancer. There were clear reductions in bone pain, pathological
fractures, spinal cord compression and ureteric obstruction. They concluded that any
benefit in terms of survival is as yet unclear4.
Unfortunately, the effect of ADT on prostate cancer almost invariably
diminishes over time. This is most commonly signaled by a rise in PSA after
reaching a nadir level. This phenomenon is known as Castrate Resistant Prostate
Cancer. It is believed that this occurs due to the growth of a subset of cells requiring
minimal androgen to support growth. The exact mechanisms causing this are as yet
unclear and it is the topic of extensive research, including this study. The average
18
18 Chapter 2: Scientific Background
time to development of CRPC in men with metastatic disease is 14-20 months post
onset of androgen deprivation therapy4. CRPC onset signals a slow decline with
eventual radiographic and clinical progression of disease, and is the fatal form of
prostate cancer.
Unfortunately androgen deprivation, while a very effective treatment for
advanced prostate cancer, does come with significant side effects. These common
side effects have been well documented and much published.
The most common side effects are documented below:
Hot flashes - a subjective perception of sudden increase in temperature,
specifically a feeling of warmth in the face, neck, upper chest and back.
These symptoms may be accompanied by a reddening of the skin, as well as
perspiration. This troublesome effect has been documented to occur in up to
80% of men undergoing treatment with an LHRH agonist20.
Loss of libido and sexual function – Testosterone is very important in the
male sexual response. Decreasing serum testosterone levels with ADT have
been shown to negatively impact upon both of sexual desire and libido, as
well as erectile function. Assessment of the SEER database of Prostate
Cancer Outcomes, examining quality of life outcomes in 431 men treated
with ADT, showed complete loss of erectile function in up to 78% of men,
and loss of sexual desire in up to 63%. Both effects were significant after
adjusting for baseline function20.
Anaemia – Up to 90% of men receiving ADT will have at least a 10% decline
in haemoglobin level. It is believed to be in part due to the effects of
testosterone on erythropoietin levels, a hormone required for new
haemoglobin synthesis. A recent prospective study of 83 men receiving ADT
however demonstrated a decline in haemoglobin but maintenance of
erythropoietin levels. It seems that the relation between haematopoiesis and
androgens needs to be defined further21.
Osteoporosis – Studies have shown that bone mineral density decreases
significantly with ADT. It is normal for men to lose bone mineral density
with age; however ADT seems to accelerate this process. The rate of
development of osteoporosis is between 1.4 and 2.6% per year. Associated
19
Chapter 2: Scientific Background 19
with this accelerated loss of bone mineral density is an increase in the risk of
fractures. Most significantly is fracture of the neck of femur, which is
associated with significant morbidity and mortality in the elderly population.
The SEER database revealed an increased risk of fracture over the normal
population after 1year of ADT and this risk increased with increased number
of doses of GnRH agonist20.
Cognitive function – Whilst there is some conflict in the literature, a decline
in attention and memory has been reported for men undergoing ADT. In
addition, impairment in concentration and verbal skills has been reported.
Likewise, reports of increased incidence of depression have been linked to
ADT.
These side effects range from being bothersome, to those impacting significantly on
the physical and mental health of patients.
More recent research has focused on the metabolic side effects of ADT.
These metabolic changes include decreased insulin sensitivity and associated
increased serum insulin, sarcopenic obesity and serum lipid profile changes. These
side effects are similar to the classic metabolic syndrome. These are gaining more
interest as the increased risk of diabetes mellitus and cardiovascular disease
associated with ADT becomes apparent. A large population based cohort study
published in 2004 demonstrated that cardiovascular disease was the leading non-
cancer cause of mortality in prostate cancer patients22. This has focused attention on
what effect ADT has on cardiovascular risk, and how these effects can be modified.
These significant metabolic side effects will be discussed in more detail in chapter 3.
2.4 THE METABOLIC SYNDROME
The Metabolic Syndrome is a name given to a collection of metabolic
disturbances associated with an increased risk of developing cardiovascular disease
and diabetes mellitus. Unfortunately this cluster of changes is becoming increasingly
common in modern society as the Western lifestyle of high calorie and fat intake, and
increased sedentary lifestyle becomes more common, with increasing weight gain
and obesity. The most recent health statistics from the Australian Bureau of Statistics
shows that in the 2007/08 Australian National Health Survey, 25% of adults over 18
years old were obese (BMI>30) and 37% overweight (BMI 25-30) based on body
20
20 Chapter 2: Scientific Background
mass index (BMI). This consisted of 68% of adult males and 55% of adult females.
This had increased from the 1995 National Nutrition Survey with 19% of adults were
obese and 38% overweight23.
There are numerous definitions of the metabolic syndrome, mostly differing
in their emphasis on components, and how to define each criterion. The most
commonly accepted definitions all include a combination of:
Central obesity - measured in various ways depending on classification, either
as elevated BMI >30kg/m2, elevated waist circumference, or elevated waist:
hip ratio
Dyslipidaemia – elevated triglycerides and decreased High Density
Lipoprotein (HDL)
Elevated blood pressure
Impaired glucose tolerance – depending on definition, this includes measured
insulin resistance, elevated fasting glucose, or previously diagnosed diabetes
mellitus
The most accepted criteria in recent times are those defined by the World Health
Organization, the National Cholesterol Education Program and the International
Diabetes Federation. The WHO definition places particular focus on insulin
resistance as a necessary component, whereas that of NCEP places equal emphasis
on each factor with at least 3 required for the diagnosis. The IDF definition places
emphasis on central obesity as defined by waist circumference24. Regardless of the
definition, the metabolic alterations of this syndrome are all individually risk factors
for the development of atherosclerotic vascular disease. There is now debate in the
literature as to whether combining these components has any added diagnostic or
prognostic value over each in isolation, however the term persists25.
2.5 INSULIN AND INSULIN-LIKE GROWTH FACTOR
Insulin is a hormone secreted by the beta cells of the pancreas, primarily in
response to an increase in circulating nutrient levels. It interacts with its receptor, the
insulin receptor on insulin sensitive cells. In general, the insulin receptor is
expressed at high levels only in adipose tissue, muscle and in the liver. These tissues
21
Chapter 2: Scientific Background 21
express one of the two IR isoforms, IR-B. The second isoform, IR-A, primarily
considered a foetal isoform, is present in these tissues at low levels.
The insulin receptor is a tyrosine kinase receptor. Activation by insulin
binding increases transcription of Sterol Response Element Binding Protein
(SREBP), and phosphorylation of tyrosine residues on the Insulin Receptor Substrate
(IRS) family of proteins. Phosphorylation triggers interaction with key signalling
molecules, activating a variety of signalling pathways, most importantly
Phosphatidylinositol 3 Kinase (PI3K)/Akt, Mitogen-activated Protein Kinase
(MAPK), and the Cbl/CAP complex. Insulin’s primary role is in glucose
homeostasis, stimulating cells to transport glucose from the bloodstream into the
cells via glucose transporters. Insulin functions to promote storage of energy in the
body. Activation of these pathways acts in a co-ordinated manner to stimulate uptake
of glucose, fatty acids and amino acids into liver, adipose tissue and muscle and
promote the storage of these nutrients in the form of glycogen, lipids and protein
respectively. At the same time, it inhibits glycogenolysis and gluconeogenesis,
protein degradation and lipolysis (See Figure 2). As well as these metabolic
functions, activation of the insulin receptor also has effects on cell survival with
activation of the MAPK cascade leading to mitogenic responses26.
Figure 2 Insulin Receptor and its downstream pathways26
22
22 Chapter 2: Scientific Background
The IGF-1 Receptor is structurally highly homologous to the insulin receptor,
and is a tyrosine kinase receptor, activating similar downstream pathways to the
insulin receptor. It is activated by either of its ligands, IGF-1 and IGF-2. Liver
production of IGF-1 accounts for the majority of IGF-1 in circulation. Regulation of
IGF-1 production is complex, but is primarily regulated by Growth Hormone.
Circulating IGF-1 acts on target tissues in an endocrine fashion, however IGF-1 is
also synthesised by other organs having both autocrine and paracrine effects. IGF-2
is also produced by the liver and other tissues but is not closely regulated by growth
hormone27. The bioavailability of IGF-1 and -2 is tightly regulated by binding to a
family of IGF Binding Proteins (IGFBPs). IGF-2 is also bound by the IGF-2
receptor, however this receptor has no known signalling activity and may act only to
sequester IGF-2 preventing its binding to IGF-1 or insulin receptors. While the
insulin receptor is primarily involved in metabolism and energy storage, the IGF-1
receptor is expressed on virtually all tissues of the body and plays more of a role in
growth regulation of the body stimulating cell proliferation and inhibiting
apoptosis27,28 (see Figure 1).
Both the IGF-1 and insulin receptors are tetramer structures comprising two
hemi-dimers, each containing an intra and an extracellular subunit. As mentioned
above there are two types of insulin receptor, subtypes IR-A and IR-B. The IR-A
receptor subtype is primarily expressed in foetal tissues. It is also expressed in tissues
of different malignancies. This subtype primarily stimulates mitogenic responses,
while the IR-B subtype is primarily involved in metabolic effects. Cells that express
both IGF-1R and IR, because of their high degree of homology, can form hybrid
IGF-1/insulin receptors. These can be formed from a hemi-dimer of each of IGF-1
and IR29. Whilst IGF-2 has minimal affinity for the IR-B subtype, it can bind and
activate the IR-A subtype and therefore the IGF-1/IR-A hybrid receptor. Therefore,
in the presence of each of IGF-1, insulin and hybrid receptors, IGF-1 can bind to the
IGF-1R or either of the hybrid receptors, IGF-2 can bind the IGF-1R or the IGF1/IR-
A hybrid receptor, and insulin can activate any of the IR subtypes and to a lesser
extent the IGF-1R, but has minimal affinity for hybrid receptors28. This is outlined in
Figure 3 below. The net result is that each of the three ligands, IGF-1, IGF-2 and
23
Chapter 2: Scientific Background 23
insulin are able to activate the growth promoting and anti-apoptotic effects on a wide
range of tissues, depending on the individual receptor expression within each tissue.
Figure 3 Schematic diagram of different ligand and receptor subtypes of the Insulin/IGF system in physiological and pathological conditions (HR – Hybrid Receptor). IR-A and HR-A present in tumour and poorly differentiated tissues28
24
24 Chapter 2: Scientific Background
Chapter 3: Literature Review 25
25
Chapter 3: Literature Review
This chapter gives a historical background (section 3.1) and reviews literature
on the following topics: Androgen Deprivation and the Metabolic Syndrome (section
3.2); the role of insulin in cancer in general (section 3.3); the role of insulin in
prostate cancer (section 3.4); and the role of androgen in castrate resistant prostate
cancer (Section 3.5). Section 3.6 will synthesise, summarise the conclusions from the
literature, and establish the gap in knowledge that this study is investigating.
3.1 HISTORICAL BACKGROUND
The common side effects of Androgen Deprivation Therapy have been much
studied and are well documented as discussed in Chapter 2. The first papers
published by Huggins and Hodges in the 1940’s on the use of castration as a form of
treatment for prostate cancer noted a marked increase in appetite and subsequent
weight gain in the vast majority of their patient cohort post castration30.
In 1990, Tayek et al published a small study of 10 patients with advanced
prostate cancer undergoing 12 months of GnRH agonist therapy. This study
confirmed a significant increase in body weight and body fat percentage after 12
months of treatment. They also documented an increase in total cholesterol up to
17% by 2 months of treatment, which was maintained throughout the study.
Interestingly 60% of their patients were malnourished prior to commencing this
study, and with no control group it was uncertain what effect this may have had on
the results31.
After a period of little literature published on the metabolic side effects of
ADT, the new millennium saw a renewed interest in the topic. The last decade has
seen a renewed interest in the changes in body mass and associated metabolic
changes of androgen deprivation and these initial findings have been confirmed and
clarified in multiple studies.
26
26 Chapter 3: Literature Review
3.2 METABOLIC SYNDROME AND ANDROGEN DEPRIVATION THERAPY
A metabolic syndrome occurs with androgen deprivation therapy. This is the
conclusion of multiple studies investigating the metabolic side effects of ADT. Initial
findings on the role of androgens in glucose and lipid metabolism were made during
observation of elderly men, in which the prevalence of hypogonadism is
significant32. One study found the prevalence of hypogonadism in men over the age
of 45 years was 36.3%. This prevalence increased with increasing age33. Multiple
studies on the correlation between testosterone and control of metabolism have been
published assessing the effect of the natural decline of serum testosterone with aging.
In the published literature, two main author groups have dominated this topic.
Basaria et al, based at Johns Hopkins University in Baltimore, Maryland, USA, have
published multiple papers examining the metabolic side effects of ADT. These
papers were all based on cross-sectional studies of similar design. They matched
patients receiving ADT for more than 12 months against two control groups, men
with prostate cancer of similar stage and grade not receiving ADT, and age-matched
eugonadal men without prostate cancer. The first control group was designed to
account for changes associated with prostate cancer alone, and the second control
group to account for age-related changes. These studies were unanimous in their
findings of an increase in body mass index (BMI), and an increase in percentage fat
mass in the ADT group compared to both control groups. They also assessed lipid
changes, finding an increase in total cholesterol and LDL cholesterol levels,
remaining after accounting for BMI. The main issue with these studies were their
cross-sectional design and their very small numbers (n=20 for ADT group in the
largest study34). Despite this they, chose good control groups and their findings are
consistent with those of the prospective studies in the published literature.
Importantly also, their study group were men who had been on ADT for at least 12
months with an average of 45 months duration, putting them in the significant
minority of studies that examine longer term effects of ADT35,36.
The second author group responsible for a large amount of the published
literature on this topic is that of Smith et al, based in Boston, Massachusetts, USA.
Their studies were prospective assessments of the changes in body composition,
insulin sensitivity and lipid profile during ADT. Whilst these studies benefitted from
27
Chapter 3: Literature Review 27
prospective assessment, they had small numbers of patients (n=25 and 26
respectively) and lacked any control groups. Their initial work suffered also from a
very short follow-up of only 3 months37,38, however subsequent prospective data
gathered over 12 months was published in 200839. Given the long natural history of
advanced prostate cancer however, and the generally long period of time that patients
remain on ADT, this would still seem to be a short duration over which to assess
outcomes from this type of therapy.
These studies demonstrated that after 3 months of ADT, insulin sensitivity had
decreased by 12.9% and serum insulin increased by 25.9%. Patients had increased
percentage fat mass and decreased lean body mass by 4.3% and 1.4% respectively by
3 months of treatment, and by 12 months this had increased to 11.2% and 3.6%
respectively38,39. These figures are very similar to another prospective study of 79
patients on ADT trialling Zoledronic acid for management of bone metastases
published by the same group. This likewise showed increased fat mass of 11% and
decreased lean body mass of 3.8% after 12 months of treatment40. They have also
reported serum lipid changes with a statistically significant increase in each of total
cholesterol, LDL and HDL cholesterol and triglycerides by 3 months37.
Outside of these two research groups, multiple other papers have been
published on this topic. These have tended to each focus on different aspects of the
metabolic syndrome and which, if any of these occur with ADT. These will be
discussed by type of metabolic alteration.
Insulin
The most consistent changes associated with ADT reported in the literature are
changes to serum insulin and insulin sensitivity. Insulin resistance is a state of
reduced sensitivity of normally insulin-responsive tissues to insulin. This results in
an impaired ability of insulin to suppress hepatic glucose production and stimulate
peripheral glucose uptake. Insulin production is the prime regulator of circulating
glucose levels. Insulin resistance would therefore be expected to result in an increase
in circulating glucose levels, however, if pancreatic beta cell (insulin secreting cells)
function is normal, increased amounts of insulin are secreted to overcome insulin
resistance and thereby normalize glucose levels. This hyperinsulinaemia is a
hallmark of insulin resistance41.
28
28 Chapter 3: Literature Review
Consistent with the findings reported above, Smith et al performed a
prospective study of 22 patients receiving ADT for three months. The patients were
assessed pre-treatment, at one, three and six months. At three months, half the
patients ceased treatment to assess reversibility of changes. They confirmed an
increase in fat mass and a decreased lean body mass, and found that serum insulin
levels were significantly increased at all 3 time points of treatment, although fasting
glucose remained normal. Whilst this was a small study, it was particularly
significant in its finding that metabolic changes were occurring at such an early point
in treatment (within 4 weeks) 42. The elevated blood insulin but normal glucose
implies impaired insulin sensitivity, but increased insulin production sufficient to
maintain normal glucose levels.
Persistent elevation of serum insulin and insulin resistance was confirmed in a
larger prospective study of 139 patients. This study divided patients into either
continuous or intermittent androgen deprivation, then further divided each treatment
group according to BMI into two groups, those with BMI<24 and BMI>24. The
average duration of ADT in the intermittent group was 7.2 months such that patients
received ADT for the majority of the twelve months duration of the study. They
found that insulin and insulin resistance were significantly elevated in all four groups
at six months. Of interest, those receiving intermittent therapy, (those that ceased
ADT part way through the study), showed insulin levels returning almost to baseline
by 12 months. This demonstrated reversibility with cessation of treatment. This is
important as it strengthens the conclusion that the metabolic changes are a true
treatment effect. This study is one of the largest prospective studies published on this
topic. One issue identified however is that it was performed on a Chinese population,
such that extrapolating results to a Western population may be unreliable43.
Insulin resistance is a key feature of type 2 diabetes mellitus. Increased insulin
is produced to maintain serum glucose levels, but eventually is insufficient and frank
diabetes occurs with elevated fasting serum glucose levels. Three retrospective
studies have assessed the incidence of new onset diabetes mellitus in prostate cancer
patients receiving ADT. The prominent feature of these studies is the significant
sample size of each. This has been possible by the use of patient databases with
retrospective assessment of their prospectively collected data. This is an important
difference as the prospective studies have all suffered from small patient numbers
29
Chapter 3: Literature Review 29
limiting the power of their findings. The largest study was of 73,196 men with loco-
regional prostate cancer from the SEER (Surveillance, Epidemiology and End
Results) American Medicare database. They assessed the incidence of new onset
diabetes, cardiovascular disease, myocardial infarction and sudden cardiac death in
prostate cancer patients receiving ADT (both GnRH agonist and surgical
orchidectomy were included), with prostate cancer patients not on ADT. The
incidence of all outcomes was significantly higher in the ADT group versus the no
androgen deprivation group. The adjusted risk for developing diabetes mellitus was
significantly increased with any form of ADT (either medical or surgical castration)
however for all other outcomes the adjusted risk was only significantly elevated for
GnRH agonist therapy. Most notably in this study, this increased risk of diabetes was
present from as early as 1 to 4 months of treatment and remained high with ongoing
therapy44.
Two smaller retrospective database reviews had similar findings of increased
risk of developing diabetes with ADT45,46. The review of Derweesh et al showed a
worsening of fasting blood glucose in patients who were known to have diabetes
prior to onset of ADT. Data analysed retrospectively from a database is not as
reliable as that obtained prospectively, particularly as database information may miss
significant details, particularly those that rely solely on diagnosis codes from patient
records, which can be extremely unreliable.
Lipids
There is some debate in the literature regarding the extent of lipid alterations
associated with ADT. The classical metabolic syndrome is characterised by an
increase in triglycerides and a decrease in HDL cholesterol. Along with these
changes, increased LDL cholesterol has been shown to increase a patient’s risk of
developing cardiovascular disease. The majority of the literature published on this
subject, are small prospective studies. The findings from all of these studies are
consistent, finding a significant increase in total cholesterol within the first 12
months of ADT. The data however is mixed on changes to triglycerides, LDL and
HDL cholesterol. Three separate prospective studies by Smith et al demonstrated
significant increases in each of total cholesterol (range 9-9.4%), LDL cholesterol
(7.3-9.9%), HDL cholesterol (8.7-11.3%) and triglycerides (23-26.5%). Whilst these
studies each used small cohorts, diminishing their statistical power, the findings
30
30 Chapter 3: Literature Review
between studies were very consistent37,39,47. These studies also suffer from the lack of
a control group for comparison. Interestingly, one of these studies was of short
duration at 12 weeks (the other studies lasted 12 months) yet still demonstrated
significant changes, indicating an early effect of therapy37.
A cross-sectional, small study of 16 men on long-term ADT agreed with the
significant increase in total cholesterol found by Smith et al. They only found
significant increases in other lipid parameters however, compared against age-
matched controls, after adjusting for BMI. There was no significant difference
comparing these lipid parameters between ADT and non-ADT prostate cancer
groups48.
Pooled data from three prospective phase 3 trials comparing LHRH agonists
against LHRH antagonists, assessed lipid changes over six months of therapy, but
most significantly assessed changes in men receiving cholesterol lowering agents in
the form of the statin class of medications. This study demonstrated a significant
increase in both total cholesterol and HDL cholesterol regardless of statin therapy,
occurring within twelve weeks of therapy. Importantly it must be noted however that
a therapeutic effect of statin drugs is an elevation of HDL cholesterol. The findings
for LDL and triglycerides was mixed however with an increase in LDL cholesterol in
the non-statin group only and both increased and decreased triglycerides depending
on which type of ADT was received49. This does confuse the overall conclusions
somewhat; however the strength of an elevation in total cholesterol despite lipid-
lowering therapy suggests that this effect of ADT is significant.
Summary
The available literature clearly demonstrates that ADT induces a form of
metabolic syndrome. The classical metabolic syndrome includes a combination of
central obesity, dyslipidaemia, elevated blood pressure and impaired glucose
tolerance, although there are multiple definitions with slightly different requirements
within each group of changes. The available literature agrees that ADT causes
sarcopenic obesity that is a gain in percentage fat mass with a loss of lean muscle
mass, regardless of change to overall weight. Insulin sensitivity decreases, with an
associated increase in serum insulin, also a worsening of diabetic control in diabetic
patients that are commenced on ADT. There is an increase in total cholesterol levels,
and perhaps an increase in LDL cholesterol and triglycerides, though these changes
31
Chapter 3: Literature Review 31
need further study to draw a firm conclusion. The data on changes to HDL
cholesterol are inconsistent, but there appears to be a trend towards increased serum
levels. ADT does not cause any change in blood pressure. From this evidence, the
metabolic syndrome induced by ADT is different to the classical type39.
The result of the metabolic changes caused by ADT is a trend towards an
increased risk of developing diabetes mellitus and cardiovascular disease. Prostate
cancer has its highest incidence between 60-70 years of age. This coincides with the
peak incidence of cardiovascular disease, mostly due to an increase in the incidence
of risk factors for cardiovascular disease such as hypertension,
hypercholesterolaemia and type 2 diabetes mellitus occurring at a similar age. It is
clear that androgen deprivation therapy induces a form of metabolic syndrome, and
given the age of patients in which it is commonly used, this will likely increase the
risk of developing cardiovascular disease with its resulting morbidity and mortality.
Lu Yao et al demonstrated that indeed cardiovascular disease is the leading cause of
mortality in prostate cancer patients other than prostate cancer specific mortality22.
This is believed to be because of the age group of prostate cancer patients and the
incidence of cardiovascular disease in this age group in the general population. The
findings of the metabolic syndrome shown to occur with ADT may well be
contributing to this statistic.
3.3 INSULIN AND CANCER
The role of insulin in neoplasia is a topic that continues to receive significant
interest. Insulin and the closely related Insulin-like Growth Factors 1 and 2 are able
to interact with multiple receptors. These are either of the insulin or IGF-1 receptors,
and the insulin/IGF receptor hybrid. The insulin and IGF-1 receptors are both
tyrosine kinase receptors with mitogenic and anti-apoptotic effects, to varying
degrees as outlined in Chapter 2. There is significant homology between the two
types of receptor, with both activating similar downstream pathways, in particular
those of PI3K and Ras/MAPK (see Figure 1). Their roles in neoplasia seem to be
intrinsically linked, with evidence implicating all three in the development and
progression of various cancers. Whilst their actions in vivo differ, blood levels of
each are linked, varying with nutritional state, and high levels of insulin directly
increasing IGF-1 production by the liver50. Their role in cancer has been
hypothesised to occur via insulin, IGF-1, or IGF-2 binding to and activating any of
32
32 Chapter 3: Literature Review
the insulin, IGF-1 or hybrid insulin/IGF-1 receptors51. The general underlying
principle is that deregulation of insulin and IGF-I signaling, associated with
increased activation of IR and IGF-IR, might occur in tumors, with subsequent
increases in signaling through the PI3K and MAPK pathways, leading to unregulated
protein synthesis, cell cycle progression and cell growth, as well as prevention of
apoptosis5.
The evidence, whilst circumstantial, suggests an association between serum
insulin and IGF-1 levels, and the development and progression of malignancy. Two
well-designed meta-analyses have been published on this topic.
The first, by Pisani et al focussed on epidemiological studies of circulating
insulin, and its relation to the risk of developing cancer. They pooled data from case-
control and prospective studies, looking particularly at colorectal, breast, endometrial
and pancreatic cancer. With respect to colorectal cancer, they demonstrated a pooled
relative risk of cancer development of 1.35 (95% CI 1.13-1.61) for patients with the
upper categories of blood insulin or C-peptide levels. This analysis included data
from 10 prospective studies and demonstrated the strongest association, with the
least heterogeneity between studies. In breast cancer, a pooled relative risk for cancer
development of 1.26 (95% CI 1.06-1.48) likewise suggested an association with
elevated insulin levels. In this case, however, the positive associations were only
seen with retrospective studies, while the four prospective studies didn’t reach
statistical significance individually. The data was mixed on both endometrial and
pancreatic cancer; however an association was suggested, though not statistically
significant. The main issue identified in this area of research is the significant
heterogeneity between studies in terms of design of the studies, the type of assays
performed, and whether patients were fasted or non-fasted which can significantly
alter the results. In addition, adjusting for confounding variables such as sex
hormone and other growth factor exposure was rarely done making a true
quantitative analysis almost impossible52. This review also suffers from a relatively
narrow literature search only using articles available through Pub med, and excluding
those not written in the English language. This may have resulted in significant
studies being missed. However, the overall qualitative indication from this review,
bearing these factors in mind, is that there is an increased risk of developing certain
types of malignancy with elevated levels of insulin.
33
Chapter 3: Literature Review 33
The second review, a systematic review and meta-analysis focussed on
patient exposure to elevated levels of IGF-1 and its binding protein IGFBP-3. This
review was of better design than that of Pisani et al, with a much broader search of
the literature, and a clearly described method of analysis. They concluded that
elevated circulating IGF-1 levels were associated with an increased risk of colorectal,
prostate and pre-menopausal breast cancer. This association remained after
multivariate analysis. For prostate and pre-menopausal breast cancer, this was
demonstrated to have a direct dose-response relationship53. Again, this review
suffered from heterogeneity between study design, but with its more rigorous
approach to systematic review, it concludes that the associations found, while
modest, are significant. The findings of these meta-analyses have been supported by
multiple rigorous reviews published over the last few years affirming the positive
correlation between elevated blood insulin and IGF-1 levels, and development of
cancer41,54.
A large proportion of the work in this area has been performed on patients
with type II diabetes mellitus. This disease is characterised by insulin resistance,
elevated serum insulin levels and hyperglycaemia. Being so prevalent in modern
society, it provides a large cohort of patients from which to gather epidemiological
data. This evidence suggests that elevated serum insulin levels increase the risk of
developing various malignancies. The strongest evidence relates to colorectal, breast,
and pancreatic cancer, and to a lesser extent endometrial cancer.
The various treatments for type II diabetes have generated considerable
interest. The biguanide drug metformin acts to decrease circulating glucose and
insulin levels. This occurs by activation of the AMP-activated Protein Kinase
(AMPK)/LKB1 pathway, situated downstream of both the insulin and IGF-1 receptor
pathways, acting to inhibit mammalian Target of Rapamycin (mTOR) and therefore
the downstream effects of IR/IGF-1R activation (see Figure 1). The result of this in
the liver is decreased gluconeogenesis and hepatic glucose output. This consequently
leads to a decrease in circulating insulin levels54. The sulfonylurea class of drugs act
to increase pancreatic insulin production and therefore increase circulating insulin
levels. These drugs are also commonly used in type 2 diabetes. Exogenous insulin is
also administered in more advanced cases.
34
34 Chapter 3: Literature Review
A retrospective cohort study by Libby et al, assessed diabetic patients
commencing on metformin, and compared them against matched diabetic patients
not receiving metformin, with the primary outcome measure being new cancer
diagnosis. They showed that the metformin group had a significantly decreased risk
of cancer diagnosis with an adjusted hazard ratio of 0.63 (95% CI 0.53-0.75)
compared to non-metformin control. The metformin group also demonstrated a
decreased cancer-related mortality, as well as a prolonged median time to cancer
diagnosis55. These results were supported by a further observational study of 11,876
diabetic patients demonstrating a 33% decreased risk of developing cancer with
metformin treatment compared to other treatments56.
Similar results were also obtained in a retrospective cohort study by Bowker
et al. Prospectively obtained data on 10,309 newly treated diabetic patients over 5
years of treatment was analysed. This demonstrated that those receiving exogenous
insulin therapy had an increased rate of cancer-related mortality compared to non-
insulin treated diabetic patients, with an adjusted hazard ratio of 1.9. An increased
risk was also seen with patients receiving the sulfonylurea class of drug (a
medication that increases serum insulin) compared with those receiving metformin, a
biguanide drug that lowers serum insulin levels. This was interpreted as a negative
effect of circulating insulin on cancer behaviour57. A caveat with this study however
is the relatively small number of deaths (407 in total) in a large population, so the
power of these findings can be questioned.
The main issue with all these studies is that, being retrospective in design, it
is difficult to control for confounders such as body weight and glycaemic control,
which were not recorded in the data. In addition, circulating insulin levels were not
measured, only inferred by treatment type. These factors may all be adversely
affecting the results. With no diabetic, non-medicated control group, one is unable to
comment on whether this effect was due to deleterious effects of insulin or
sulfonylurea’s, or perhaps a protective effect of metformin, as opposed to any direct
effect of insulin levels on cancer development and behaviour.
Over the last few years however, several good quality, rigorous reviews have
been published. They have examined the evidence around the association between
blood insulin levels and cancer risk. They found that as well as the population based,
35
Chapter 3: Literature Review 35
epidemiological evidence there is also both experimental and clinical evidence
supporting this association.
Experimental evidence is from a combination of human cell and animal
studies. Early studies showed that physiological concentrations of insulin, applied to
breast cancer cells in vitro, was able to stimulate cell DNA synthesis54. In animal
models of colorectal cancer, development of mouse aberrant colonic crypt foci, a
precancerous change, was positively correlated with insulin administration, while
caloric restriction, known to improve insulin sensitivity and decrease circulating
insulin levels showed a negative correlation with development. Similarly, an
increased non-fasting insulin level correlated with increased size and number of
aberrant foci41. As well as elevated circulating ligand, examination of human tumour
tissue has demonstrated over-expression of the insulin receptor in both breast28 and
prostate58 cancer tissue when compared to their benign counterparts (see Figure 4).
Summary
The combined evidence demonstrates a positive association between elevated
blood insulin and IGF-1 levels and an increased risk of the development of various
cancers in humans. The strongest correlation seems to be with colorectal, post-
menopausal breast and pancreatic cancers. Whilst the majority of evidence is
circumstantial, derived from retrospective, observational, population based studies
with their inherent drawbacks, the overall weight of evidence lies in support of this
assertion.
3.4 INSULIN AND PROSTATE CANCER
Similar to the relationship between insulin, IGF and cancer in general,
significant interest surrounds their role in the development and progression of
prostate cancer. This association again derives from a combination of experimental,
population based data and clinical evidence.
There is mixed evidence regarding the overall risk of prostate cancer in
patients with hyperinsulinaemia. A well-designed systematic review performed by
Hsing et al concluded that the currently available evidence was insufficient to prove
any increased risk59. They also found that long-term diabetes actually decreased the
risk of development of prostate cancer. While type II diabetes demonstrates insulin
resistance and hyperinsulinaemia in its early stages, in long-term diabetes, insulin
36
36 Chapter 3: Literature Review
levels eventually decline despite ongoing hyperglycaemia. Testosterone and IGF-1
levels also decline to low levels. Given prostate cancer’s reliance on androgen for
growth, it is possible that this, and possibly eventual low insulin and IGF levels
which can explain this finding59,60.
Epidemiological studies have however suggested a direct correlation between
insulin levels and prostate cancer mortality, and the risk of developing high-grade
prostate cancer61-63. A paper by Ma et al assessed the effect of pre-diagnosis body
mass index (BMI) and C-peptide (a surrogate marker for endogenous insulin
production) on prostate cancer specific mortality. They found that as baseline BMI
increased so too did the risk of prostate cancer specific mortality. In keeping with
this finding, obese men (BMI>30) were more likely to have extra prostatic or
metastatic prostate cancer or a higher Gleason grade of cancer at the time of
diagnosis than men with BMI <30 Obesity is associated with insulin resistance and
an increased risk of type II diabetes. They also demonstrated that patients with C-
peptide in the highest quartile had an increased prostate-cancer specific mortality
compared to those in the lowest quartile. They concluded from this that at least part
of the effect of increased BMI on mortality was related to insulin levels61. This study
was a retrospective assessment of prospectively accrued data from the Physicians
health study, a large study assessing the effects of aspirin and beta-carotene on men
without a history of heart disease, cancer or chronic illness. The best aspect of this
study was the numbers of patients accrued (2546 men diagnosed with prostate
cancer) and followed over a long period (24 years with median follow up of 7 years
between diagnosis and death or end of follow-up), which is important when assessing
prostate cancer with a long time course of progression.
Similarly, a nested case-control trial within the Prostate Cancer Prevention
Trial found similar results. While increasing C-peptide level was only weakly
associated with cancer risk, there was a strong association with the development of
high-grade prostate cancer of Gleason grade 7 or greater. For every unit increase in
log (C-peptide), there was a 39% increased risk of high-grade prostate cancer. This
association remained after adjusting for BMI and adiposity62.
Hammarsten et al prospectively assessed baseline insulin levels at time of
prostate cancer diagnosis and compared them between men who died from prostate
cancer during 5 years of follow-up, and men who survived. Statistically significant
37
Chapter 3: Literature Review 37
risk factors identified for lethal prostate cancer included both Type 2 diabetes and
hyperinsulinaemia. Hyperinsulinaemia remained significant even after adjusting for
stage and grade of prostate cancer, factors known to affect prognosis. They
concluded that hyperinsulinaemia is a promoter of clinical prostate cancer63.
The hyperinsulinaemia of ADT has been shown to begin early in the course
of treatment. Some studies have documented a significant rise in serum insulin
within 1 month of onset of therapy with increased insulin resistance persisting
through to at least 12 months of therapy42. This shows that patients receiving ADT
undergo chronic exposure to elevated serum insulin from very early in their
treatment, and this is sustained as treatment progresses. Therefore, it is important to
consider what effects long-term exposure to elevated insulin levels have on prostate
cancer growth.
Experimental examination of the effects of insulin and IGF-1 on prostate
cancer is from both in vitro and in vivo experiments. Multiple prostate cancer cell
lines have been derived from both primary prostate cancer tissue and metastatic
tissue and have been used for many years to assess how prostate cancer cells respond
with manipulations of their growth environment. The effects of many important
treatments currently in use for prostate cancer have originally derived from work on
tissue cell lines. Each cell line has slightly different features in terms of receptor
expression, among others, providing very valuable first line indications of factors
affecting prostate cancer growth.
Cancer cell lines can be examined either growing in medium in a laboratory
dish or they can be implanted into animals, most commonly mice, to attempt to
mimic tumour growth in humans. Cell line experiments using multiple different
prostate cancer cell lines have shown a positive correlation between both insulin and
IGF-1 levels and prostate cancer cell growth. Mouse models containing either
LAPC-4 or LNCaP cell line xenografts have been assessed for their response to
manipulation of the insulin axis by dietary modification64-66. Xenograft mice were
grown and then separated into groups receiving different combinations of low and
high fat, and low or high carbohydrate diets. Freedland et al assessed LAPC-4
xenograft mice and found that those receiving the high fat, high carbohydrate diet
(termed the “Western” diet in this study) developed a 3 fold higher insulin level, and
a 26% higher IGF-1 level than their no carbohydrate, and low carbohydrate high fat
38
38 Chapter 3: Literature Review
diet counterparts. The non-Western diet mice had smaller tumour size and longer
survival than the Western diet mice64. Ngo et al showed similar results, again
investigating LAPC4 xenograft mice. Mice on a low fat diet had significantly lower
insulin levels. Analysis revealed that serum insulin levels positively correlated with
each of PSA level, tumour volume and rate of tumour growth65. Mice xenografted
with LNCaP cells by Venkateswaran et al, and fed a high fat, high carbohydrate diet
developed elevated serum insulin and IGF-1 levels. Tumour cells displayed increased
insulin receptor expression and increased activation of Akt, situated downstream
from the insulin receptor. Elevated serum insulin was associated with significantly
increased size of the prostate tumour66. Each of these studies, though slightly
different in design, gives strong evidence for an in vivo relationship between serum
insulin levels and prostate cancer growth. The strength of these studies in
combination is that this association is demonstrated in two separate prostate cancer
cell lines.
Moving from laboratory studies, various studies have attempted to assess this
relationship in human patients. Snyder et al assessed the effect of pre-diagnosis
diabetes mellitus on prostate cancer prognosis. They performed a systematic review
and meta-analysis and found that the overall mortality rate for diabetic patients was
higher than that of non-diabetics with a pooled HR of 1.57 (95% CI 1.12-2.2).
However there was insufficient evidence to assess the effect of diabetes on prostate
cancer specific mortality67. Given the known increased risk of cardiovascular disease
with diabetes, it may be that the overall mortality increase was unrelated to prostate
cancer effects. This systematic review, whilst well designed does suffer from the lack
of available evidence on this topic and significant heterogeneity between included
studies. In addition, because of the lack of studies considered adequate for inclusion,
there is no distinction between type 1 (typified by low insulin levels) and type II
diabetes; therefore, it is impossible to extrapolate what effect serum insulin levels
may be having on prostate cancer growth.
Patel et al performed a retrospective analysis of prospectively collected data
on patients undergoing radical prostatectomy at their institution. They compared
outcome between diabetic patients, and non-diabetic control group matched for
prognosis based on age and prostate cancer pathology. They also divided the diabetic
group into those receiving, and those not receiving metformin. They found that
39
Chapter 3: Literature Review 39
diabetes was associated with a statistically significant increased risk of biochemical
recurrence of prostate cancer with an overall hazard ratio of 1.55 (95% CI 1.03-2.33).
The 5-year biochemical recurrence free survival was 75% for non-diabetics, but only
59% for diabetic patients not receiving metformin. Interestingly metformin users
biochemical recurrence free survival was 66%, suggesting a protective effect of
metformin on univariate analysis, but this was not borne out on multivariate
analysis68. Unfortunately, serum insulin was not measured in these patients, and
again there was no differentiation between type1 and type 2 diabetics. Therefore
extrapolating these results to suggest a detrimental effect of exposure to elevated
insulin levels could only be done with extreme caution.
Attempting to clarify this issue, Lehrer et al actually assessed serum insulin
levels in patients of 3 different stages of prostate cancer undergoing either
brachytherapy or external beam radiotherapy in their institution. These patient groups
were divided into low, intermediate and high risk groups in line with the D’Amico
classification discussed in chapter 2 (see Table 1) with slight modification in PSA
levels between intermediate and high risk groups. They found that serum insulin
increased with increasing risk group. The high-risk group had significantly higher
serum insulin compared to the intermediate or low risk groups. There was no
significant difference between intermediate and low risk groups although the overall
numbers in the intermediate risk group were small such that insufficient numbers
may have been present to display any true difference. There is a major criticism of
this study, which may have significant bearing on our ability to interpret these
results. As part of the protocol, both the intermediate and high-risk groups received 3
months of neo-adjuvant androgen deprivation therapy. There is no statement
describing at what time serum insulin levels were measured. With the knowledge that
androgen deprivation therapy significantly elevates serum insulin within a short
duration of therapy, if serum insulin was measured post-treatment than the results of
this study bear no reflection on prostate cancer association with insulin, instead likely
only reflecting the effect of ADT used on their patient groups. This is a significant
flaw and one that would need to be clarified before putting any weight on the
findings of this study. The implication of the study is that measurements were
performed pre-treatment. If this is the case, this study demonstrates a significant
40
40 Chapter 3: Literature Review
direct correlation between serum insulin and grade and stage of localized prostate
cancer69.
Whilst not specifically assessing insulin level, a recently published paper by
Flanagan et al, assessed men receiving ADT, and divided the group into men who fit
criteria for diagnosis of metabolic syndrome at the time of onset of ADT versus men
who did not. They used a modification of the ATP-III criteria for metabolic
syndrome. These required 3 or more of elevated triglycerides, obesity
(BMI>30Kg/m2), hypertension, low High Density Lipoprotein level and fasting
hyperglycaemia. They demonstrated a statistically significant decrease in time to
development of castrate resistance for men with metabolic syndrome. They also
performed a multivariate analysis demonstrating that each of the five criteria for
diagnosis of metabolic syndrome was individually associated with a decreased time
to castrate resistance, except for elevated triglyceride level70. This study was a
retrospective chart review; however they appear to have had good data medical data
available for their analysis. The study also suffers in its definition of castrate
resistance, using a non-consensus definition of time to reach 50% elevation of PSA
above nadir level. This may have inaccurately skewed their results. However, the
results of this study do loosely support our hypothesis in that the features of
metabolic syndrome, which have shown to be aggravated by ADT, negatively
affected time to castrate resistance. This support is tempered by the fact that insulin
was not analysed specifically in this study, nor was an elevated insulin level a
requirement for diagnosis of metabolic syndrome.
While all these studies give circumstantial evidence of insulin positively
affecting prostate cancer growth, the ability of prostate cancer to respond to insulin
via an appropriate receptor was further assessed in a key study by Cox et al. They
examined prostate cancer tissue expression of insulin receptors and insulin and IGF-1
receptor mRNA expression. Immunohistochemical staining of both benign and
malignant prostate tissue demonstrated significant increased expression of insulin
receptor, by two fold in malignant prostate tissue compared to benign prostate tissue.
Insulin receptor expression increased with increasing Gleason grade of cancer,
except for grade 5, which was not significantly different to grade 3. They
demonstrated that there was no difference in IGF-1 receptor expression between
benign and malignant prostate tissue (See Figure 4). Expression of insulin and IGF-1
41
Chapter 3: Literature Review 41
receptor mRNA was significantly increased in prostate cancer specimens. The other
major conclusion was that prostate cancer tissue expresses a mixture of insulin, IGF-
1 and hybrid receptors. Whilst this study does not demonstrate insulin signalling, the
increased expression of insulin receptors on cancer tissue suggests an increased
sensitivity to insulin58.
Figure 4 Representative staining of benign and malignant prostate tissue showing expression of IGF-1 and insulin receptors58
3.5 THE ROLE OF ANDROGEN IN CASTRATE RESISTANT PROSTATE CANCER
There is growing evidence for an ongoing role of androgens in stimulating
prostate cancer growth despite androgen deprivation therapy, and in the presence of
castrate serum testosterone levels. The exact mechanism behind the development of
castrate resistant prostate cancer, at this time is not entirely clear. There is ongoing
debate regarding the exact definition of castrate resistant disease, however it is
generally accepted as a consistent rise in PSA after levels have reached a nadir or
lowest point following the institution of androgen deprivation therapy (medical or
surgical castration), occurring in the presence of castrate serum testosterone levels
with or without metastatic disease71. PSA (properly known as human kallikrein 3) is
42
42 Chapter 3: Literature Review
an androgen-regulated gene. The recurrent expression of this gene following the
initial switching off with androgen deprivation therapy implies that the androgen
receptor resumes activation during progression to castrate resistance. Similarly the
fact that up to 30% of patients respond to secondary androgen axis manipulation
during castrate resistance implies an ongoing dependence on the androgen receptor
pathway in these patients72.
There are five main hypotheses surrounding the ongoing activation of the
androgen receptor after castration.
1. Mutation or amplification of the androgen receptor – Either mutations in the
androgen receptor, or increased expression of the androgen receptor can
render the prostate cells more sensitive to androgen such that they may be
activated by much lower concentrations of androgen73-76. Titus et al assayed
both castrate resistant prostate cancer and benign prostate tissue for
testosterone and dihydrotestosterone (DHT) levels. They found that castrate
resistant prostate cancer tissue had median DHT levels 90% lower than that
of benign tissue; however these levels were still sufficient to activate the
androgen receptor. Tissue testosterone levels were similar in both groups77.
These findings were further analysed by Locke et al. They demonstrated a
dramatic decline in tissue testosterone and DHT levels from castration to the
time of nadir PSA level; however levels increased again to reach
approximately 20% of pre-castrate levels by the time of castrate resistance78.
Leon et al demonstrated an increase in androgen receptor levels in an LNCaP
xenograft mouse model during progression from nadir PSA to castrate
resistance79. Visakorpi et al demonstrated this same phenomenon in humans
via in situ hybridisation, with up to 30% of prostate cancers examined having
amplification of the androgen receptor gene with increased expression of the
androgen receptor in the castrate resistant phase80.
2. Promiscuous Androgen Receptor – Missense mutations in the androgen
receptor gene can lead to decreased specificity of ligand binding, leading to
inappropriate activation of the receptor by non-androgen steroids and
androgen antagonists. Examples include adrenal androgens and some of the
androgen receptor antagonists. This mechanism is proposed to explain the
phenomenon of anti-androgen withdrawal effect. This is a phenomenon
43
Chapter 3: Literature Review 43
occasionally seen in men with advanced prostate cancer where addition of an
androgen receptor antagonist, most commonly flutamide, results in worsening
of their disease, then cessation of the drug leads to a counter-intuitive decline
in PSA level74-76.
3. Outlaw Receptor – a term to describe steroid hormone receptors that can be
activated to a lesser, but still significant extent by ligand-independent
mechanisms81. The androgen receptor can be activated by certain growth
factors in the absence of androgen, including IGF-1, Epidermal Growth
Factor (EGF) and Keratinocyte Growth Factor (KGF). IGF-1 is the most
potent of these and has been shown to induce a five increase in PSA
expression in LNCaP cells82.
4. Bypass Pathway – describes alternative pathways that can be invoked that
enable bypassing of the androgen receptor entirely. With treatment targeting
critical survival pathways such as the androgen-dependent growth of prostate
cancer, there may be mutations that are selected out for a pathway allowing
growth stimulation and suppression of apoptosis. One example is expression
of the anti-apoptotic gene Bcl-2, not normally expressed in prostate tissue,
whose presence has been documented in castrate resistant prostate cancer in
both xenograft mouse models and human tissue73,74.
5. Lurker Cell Pathway – Describes the stimulated growth of cells not
dependent on androgen for survival, such as prostate epithelial basal cells,
caused by selection pressure after the androgen deprivation induced ablation
of androgen-sensitive prostate cancer cells.
All of these mechanisms have been proposed as a means of describing the
phenomenon of castrate resistant growth of prostate cancer. Each mechanism, which
can be supported by scattered evidence, are also contradicted by other findings such
that, to date, none have been shown to be able to adequately explain this
phenomenon and a combination, or perhaps another mechanism altogether may be
occurring83.
Another hypothesis to attempt to explain castrate resistant prostate growth is
the local production of androgens within the prostate sufficient to activate the
androgen receptor. This mechanism would explain the re-activation of the androgen-
dependent PSA gene despite castrate serum levels of testosterone. Locke et al
44
44 Chapter 3: Literature Review
published a paper in Cancer Research assessing this topic. They assessed prostate
cancer tissue samples from an LNCaP mouse model pre-castration, at nadir PSA and
then at the time of castrate resistance. They demonstrated that tissue testosterone and
dihydrotestosterone levels dramatically decrease with castration to the time of nadir
PSA. However, levels increase again as the tumour progresses to castrate resistance,
reaching up to 20% of pre-castrate levels78. Similar to the findings of Titus et al in
human prostate tissue, these levels are indeed sufficient to activate the androgen
receptor77. Equally significant was the finding that the mRNA and protein of
enzymes required for synthesis of dihydrotestosterone from cholesterol were
expressed at all stages of disease and increased with progression to castrate
resistance. The other conclusions from this study was that castrate resistant tumours
are capable of conversion of acetic acid to dihydrotestosterone, and that they use
progesterone to synthesise DHT via both the classical pathway and a backdoor
pathway of steroid synthesis78(See Fig 3 – steroid pathways).
Following on from this work, our laboratory has shown, in soon to be
published data, that insulin treatment of LNCaP cells up-regulates key enzymes in
this steroid genesis pathway. There is also evidence that insulin treatment of LNCaP
Table 2 Summary of characteristics of two study groups
The mean age of the ADT and control groups at the time of study analysis was
72.1 and 61.9 years respectively. There was a statistically significant difference
between the two groups of 10.24 years (P<0.0001, 95%CI 6.65 - 13.83). The median
ages of the two groups were 70.5 and 61 years respectively as displayed in Figure 5.
56
56 Chapter 5: Results
Figure 5 Box Plot demonstrating Age (in years) range between control and ADT groups
Comparison was made between the age at the time of prostate cancer
diagnosis between the two groups. We also compared age at time of onset of
androgen deprivation therapy in the ADT group, with age at time of treatment in the
control group. The difference between the mean ages for these comparisons were 6.1
and 7.3 years respectively. Both these differences retained statistical significance.
The results of these comparisons are shown in Figures 6 and 7.
Figure 6 Box Plot comparing age at time of prostate cancer diagnosis between control and ADT groups
57
Chapter 5: Results 57
Figure 7 Box Plot comparing age at time of onset of ADT with control group As would be expected, the ADT group had more advanced stage disease than the control group. In the ADT group, the majority were receiving ADT as a primary therapy (75%), with only a small number receiving ADT for progression or relapse of their disease. The vast majority of patients were receiving medical castration in the form of an LHRH agonist (97.2%). Follow-up PSA data was available for 15 of the 47 control group patients. Of these 15 patients, none had evidence of disease relapse or progression following their radical prostatectomy at the time of analysis, with a median follow-up of 12 months. In the ADT group, 20 of the 36 patients had reached castrate resistant phase according to our definition.
5.1 ANDROGEN DEPRIVATION THERAPY AND C-PEPTIDE
The first aim of this project was to confirm the literature findings of elevated
serum insulin occurring with ADT treatment. Serum samples were analysed for C-
peptide levels (a surrogate marker for insulin production). Analysis of serum C-
peptide revealed a significantly elevated level in the study ADT group compared to
the control group. The mean C-peptide was 1639pM for the ADT group compared to
1169pM for the control group. The difference between the groups was 470.6pM.
This difference reached statistical significance with a P-value of 0.025 (95% CI 61.4
– 879.8). The distribution in each group was not symmetrical however, and a clearer
indication of the difference between groups appears when assessing the median
values of the two groups. The median value in the control group was 833pM,
compared to an ADT group median of 1399pM. The data in each group is positively
58
58 Chapter 5: Results
skewed with the mean value being higher than the median value due to high outlier
values. This effect is more marked in the control group. This is well demonstrated in
the box plot below (Figure 8).
Figure 8 Box plot comparing serum C-peptide levels between control and ADT groups
These results seem to concur with the literature findings of increased insulin
resistance, and therefore serum insulin levels occurring with ADT.
We also examined other factors to assess for any other possible correlation to
C-peptide levels. Firstly we compared age with C-peptide amongst the two groups,
separately and then combined. Comparing both the ADT group and the total study
population with C-peptide level produced a statistically significant correlation (r(34)
= 0.422, P<0.01 for the ADT group, and r(81) = 0.400, P<0.01 for the total study
group (Figure 9)). When the control group was analysed alone however, the
correlation was much weaker and no longer reached statistical significance (r(45) =
0.208, P>0.1 (Figure 10)). This is important as it excludes the patients receiving
ADT, which the literature, and our preliminary findings above suggest positively
alters C-peptide level. Therefore including these patients in the analysis of age and
C-peptide may be suggesting a correlation that does not truly exist, which would be
in keeping with our findings of the analysis of the control group alone. Alternatively,
the ADT group is significantly older than the control group, therefore this may only
strengthen the correlation between increasing age and C-peptide level.
59
Chapter 5: Results 59
Figure 9 Scatter plot comparing age to C-peptide level for the total study population
Figure 10 Scatter plot comparing age to C-peptide level for the control group only Comparing PSA level to C-peptide for the entire group, no significant
correlation was found (r(81) = 0.157, P>0.1). Again, ADT alters C-peptide levels,
but it also alters PSA levels by virtue of its apoptotic effect on PSA producing,
androgen dependent prostate cancer cells. Therefore, we analysed the control group
alone, patients with as yet untreated, but diagnosed prostate cancer. Again, no
significant correlation was found (r(45) = -0.164 (P>0.1)) between the two variables.
60
60 Chapter 5: Results
Finally, we compared duration of ADT to C-peptide level. No significant
correlation could be drawn from this comparison (r(34) = -0.091 (P>0.1)). Indeed,
the trend, while small was toward a decreasing C-peptide level with longer duration
of ADT (Figure 11).
Figure 11: Scatter plot comparing duration of ADT to serum C-peptide level. C-peptide values for the control group are shown at time 0 (have not received ADT) in red for comparison. The normal range for serum C-peptide is shown between the blue lines (range 300-150pmol/L) An important determinant of body insulin status is adiposity. Increased body fat mass is a known contributor to insulin resistance and serum insulin levels. This can be measured in the form of body weight or body mass index (BMI). Unfortunately, this data was not available for the majority of patients. Of particular importance is the change in body weight or BMI from the time of onset of ADT through to the time of analysis. Due to the cross-sectional nature of this study, data on body weight from the time of onset of treatment was not available. Likewise for the control group, this data was not recorded as part of the recruitment questionnaire. This is a confounding factor that will be discussed further in Chapter 6.
5.2 C-PEPTIDE AND PROGRESSION OF PROSTATE CANCER
The second aim of this study was to assess how serum C-peptide levels
correlated, if at all, with progression of advanced prostate cancer to the castrate
resistant phase. Serial patient PSA data was obtained from time of onset of ADT
through to time of recruitment for this study, and beyond where available. For the
61
Chapter 5: Results 61
purposes of this study, castrate resistance was defined as 2 consecutive elevations of
PSA, post attaining a nadir level after onset of ADT, in the setting of a castrate
testosterone level of less than or equal to 0.7nmol/L. The elevated PSA value has to
be greater than 2ng/mL. Castrate resistance was also deemed to have occurred if any
form of salvage therapy was instituted, or if there was radiological or clinical
evidence of disease progression. This definition is taken from the Prostate Cancer
Working Group consensus criteria 200884. Of the 36 cases in the ADT group, 20
patients had reached castrate resistance by this definition.
Time to development of castrate resistance was measured in months from the
date of onset of ADT. Figure 12 shows a scatter plot of time to castrate resistance in
months against serum C-peptide in pmol/L. A linear trend line shows no change with
increasing C-peptide level (Figure 12). The correlation co-efficient, as expected, was
not statistically significant (R (18) = 0.023 P>0.1).
Figure 12 Scatter plot comparing time to castrate resistant prostate cancer with serum C-peptide
Of this group of patients, 3 patients reached castrate resistance in less than 10
months. Analysis of these patients showed that none of them had a PSA response to
ADT, that is, their PSA continued to rise despite commencing ADT. This lack of
response suggests a prostate cancer phenotype that is not androgen sensitive, for
example a neuroendocrine tumour. These 3 patients were removed from the analysis
as their data is likely to skew the results, particularly in such a small population. This
62
62 Chapter 5: Results
produced a correlation co-efficient of r = -0.050. Whilst this was not statistically
significant (P>0.1), it suggests a trend towards earlier progression to castrate
resistance with increasing C-peptide as shown in Figure 13.
Figure 13 Scatter plot comparing time to castrate resistance excluding PSA non-responders
Type 2 diabetes mellitus is associated with insulin resistance. Typically, in the
early stages of the disease, insulin resistance, and therefore serum insulin levels are
elevated in an attempt to maintain blood glucose levels. Many of the treatments used
for type 2 diabetes alter insulin levels and insulin sensitivity. As diabetes progresses
however, the ability of the pancreas to produce insulin fails and these patients require
administration of exogenous insulin to maintain blood glucose levels. These
fluctuations in serum insulin throughout the course of type 2 diabetes, as well as the
manipulations of diabetic medications may have affected our results. Therefore, we
assessed the effect of serum C-peptide on time to progression to castrate resistance
excluding those patients with diagnosed diabetes mellitus (whether they were
receiving treatment for diabetes or not), as well as excluding the PSA non-
responders. 5 diabetic patients in total were identified, 2 of whom had already been
excluded as PSA non-responders, therefore bringing the total number of patients for
analysis to 14. The correlation between C-peptide and time to castrate resistance
remained negative but also remained non-significant (r(12) = 0.049, P>0.1).
63
Chapter 5: Results 63
Figure 14 Scatter plot of time to castrate resistance excluding diabetics and PSA non-responders
A second way of assessing the effect of C-peptide on progression of prostate
cancer is by monitoring the kinetics of PSA progression (change of PSA value with
time). Fig 15 shows this in graphical form. The ADT group was divided into two by
level of C-peptide, either less than (19 patients) or greater than 1500pmol/L (17
patients). Plotting time since diagnosis against PSA level we noted a large proportion
of patients commencing ADT with a very high PSA level (greater than 100ng/mL).
Such a high PSA suggests very active and/or extensive disease so these people were
removed from the analysis as they would be expected to recur more quickly given
their pre-treatment disease burden. This left two groups of 11 patients for analysis.
We plotted these patients in their respective groups based on level of C-peptide and
performed subgroup analysis on patients with diabetes (Fig 15a), patient age at time
of recruitment greater or less than 70 years (Fig 15b), and patients with significant
medical co-morbidities including any of ischaemic heart disease, cerebrovascular
disease or other malignancy (Fig 15c). Each line represents the PSA kinetics of an
individual patient, the solid, heavy line indicating patients with the feature under
study.
64
64 Chapter 5: Results
A i
Aii
B i
Bii
65
Chapter 5: Results 65
C i
Cii
Figure 15 PSA kinetics of the ADT patient group, with PSA<100, at time of onset of ADT. Figures grouped by serum C-peptide <1500pmol/L (i) or >1500pmol/L (ii). Patient kinetics in heavy black include: patients with diabetes (Fig 15A); age greater than 70 years (Fig 15B i) or less than 70 years (Fig 15B ii); and patients with significant medical co-morbidities (Fig 15C).
Chapter 5: Results 66
66
67
Chapter 6: Analysis 67
Chapter 6: Analysis
This chapter will analyse the results of this study in the context of current
evidence in the literature. It will assess the gap in knowledge that we identified and
discuss to what extent this gap has been addressed. This will be done using the two
aims of this research project. Chapter 6.1 will discuss the effect of androgen
deprivation therapy on insulin levels. Chapter 6.2 will discuss the effect of insulin
levels on advanced prostate cancer according to our results.
6.1 ANDROGEN DEPRIVATION THERAPY AND C-PEPTIDE
There is strong evidence, consistent throughout the literature that insulin
resistance and serum insulin increase with ADT. It has been shown to occur from
early in the course of treatment and is maintained long-term. This leads to an overall
increased risk in this population group of developing clinical type 2 Diabetes
Mellitus87.
The first aim of this pilot study was to confirm these findings by comparing
two cohorts of patients, 36 men receiving ADT for advanced prostate cancer (ADT
Group), and 47 men with localised prostate cancer who were not receiving ADT
(Control Group). Primary analysis of the two groups showed a significant elevation
of mean insulin level (measured in this study as serum C-peptide) in the ADT group
compared to the control group. This was a pilot study conducted with small numbers
of patients (n=36 in ADT group) yet the difference between the groups still attained
statistical significance (P=0.025). Comparing the median values of each group gives
a more pronounced picture of the difference between the two groups. While both
groups are positively skewed (the mean value is higher than the median value,
indicating a non-symmetrical distribution of values within the groups) by high outlier
values for C-peptide, this is more pronounced in the control group. It is possible that
a more significant difference actually exists between the groups, which are being
masked by these outlier results. Closer analysis of the two groups shows that, in the
control group, of the thirteen men with an elevated C-peptide over 1500pmol/L, nine
of these men are being treated for either of hypertension, hypercholesterolaemia, or
both. It may be that these men have, or are developing, an undiagnosed metabolic
68
68 Chapter 6: Analysis
syndrome and insulin resistance, which may account for these high C-peptide values.
This may be positively skewing the control C-peptide data and masking a more
significant difference between the two groups.
Type 2 diabetes mellitus, and the treatment of diabetes, alters the serum insulin
profiles of patients depending on how advanced their diabetes is. In early disease, the
pancreas increases insulin production to overcome target cell insulin resistance. As
the disease progresses over time however, the pancreas is unable to maintain insulin
production and serum levels decline with worsening blood glucose control. It is at
this time that patients require administration of exogenous insulin to maintain blood
glucose levels. It is uncertain at what stage in their disease the diabetic patients in
this study are at, however their serum insulin levels are likely to be altered due to
diabetes, and the drugs used to treat it. After removing all diabetic patients from the
analysis, the mean difference between the two groups decreased but remained
significant (P=0.043). The difference between median values for each group however
became more pronounced, with the median control value decreasing to 740pM, and
the median value for the ADT group increasing to 1424pM (original values were
833pM and 1400pM respectively). Taken alone, these findings would seem to concur
with the published literature that ADT does indeed induce insulin resistance and
hyperinsulinaemia.
One deficiency in this study is the lack if data regarding patient body weight
and BMI. Increased body weight, mostly reflecting increased adiposity is a well-
documented risk factor for development of insulin resistance and hyperinsulinaemia.
Whether there was any difference in BMI between the study and control groups prior
to the study group patients commencing ADT is unknown. It is possible that the
study group had increased body weight, adiposity and possibly insulin resistance
prior to commencing ADT. Clearly if this were the case, it would significantly alter
our interpretation of the studies findings that the ADT group have significantly
higher serum C-peptide levels than the control group. Caution must therefore be
taken in interpreting our data as significant given this confounding variable that
cannot be accounted for. Any future studies should acquire this data, something that
would be possible with a prospectively designed study.
An important finding from this study is that there were significantly elevated
C-peptide levels in both groups, though more significant in the ADT group. Using a
69
Chapter 6: Analysis 69
normal range for non-fasting serum C-peptide of 300-1500pmol/L, in the ADT group
17 of the 36 patients (47%) had C-peptide values greater than the upper limit of
normal; while in the control group this number was 13 of 47 patients (28%). The rate
of obesity, diabetes and the metabolic syndrome are all increasing in modern western
society88. Certainly, of the patients in this study, a significant number were found to
have elevated C-peptide levels, perhaps suggesting an underlying insulin resistance
syndrome. Left unmonitored, and without appropriate intervention, this proportion of
patients may progress to frank diabetes. This may be an important public health
finding given the significant impact that diabetes can have on morbidity and
mortality, and its associated cost to the community. This perhaps suggests a need for
more widespread screening of the general population for insulin and glucose levels to
identify these patients at an early stage. Certainly, in men, receiving ADT, with a
documented increase in insulin resistance, screening for its development, and
intervention with exercise and medication at an early stage may have significant
health benefits.
We further analysed these groups in terms of their age. There was a significant
difference between the two groups with the ADT group being older than the control
group, even after accounting for age at the time of diagnosis of prostate cancer, and
the time of onset of treatment with ADT. In prostate cancer, because of its generally
long time course of progression, the patient’s age at diagnosis, as well as medical co-
morbidities plays a considerable role in the choice of treatment. For localised disease
(disease within the prostate and no evidence of metastases), the vast majority of men
over the age of 70 years, with disease that may be suitable for surgical treatment via
radical prostatectomy, are much more likely to receive radiotherapy or androgen
deprivation therapy to avoid the risks associated with surgical treatment in older
patients. This is also due to the long-term good outcomes that can be achieved with
radiation therapy. As a broad generalisation, with advancing age, men are more
likely to die of other causes than prostate cancer, making the risk-benefit analysis of
radical surgery that is discussed with patients by their urologist, favour treatments
other than surgery. This is particularly the case with significant medical co-
morbidities at the time of diagnosis of prostate cancer, which is more common with
increasing age. As a result, there is a natural bias in treatment choice for localised
70
70 Chapter 6: Analysis
prostate cancer, meaning that men receiving surgery are generally younger than men
receiving ADT.
In our study however, to be included in the ADT group for analysis, men had
to be diagnosed with advanced prostate cancer. Indeed 29 of the 36 men in the ADT
group had metastatic disease (either lymph node or distant bone or solid organ
metastases), which would largely preclude them from surgical treatment as the
chance of cure would be low. The remaining seven men all had locally advanced,
either clinical stage T3 or T4 disease, usually considered not suitable for surgical
resection (See Table 2 for comparison of stage between groups). Indeed, in this
study, 75% of patients in the ADT group were commenced on ADT as a primary
therapy, rather than as salvage following recurrence after previous curative therapy,
reflecting the advanced stage of cancer in this group. Therefore, whilst the ADT
group were indeed significantly older, this would not appear to be due to treatment
choice based on age criteria. These men are receiving ADT because of their
advanced prostate cancer. This means that the significant difference in age between
our two study groups is not due to treatment bias.
We analysed the effect of age on serum C-peptide level. This demonstrated a
statistically significant correlation between increasing age and increasing C-peptide
levels across the entire study population, as well as the ADT group when analysed
alone. This comparison only lost statistical significance when the control group was
analysed alone. The ADT group was receiving ADT, known to elevate serum insulin.
The loss of significant correlation in the non-ADT control group suggests that a
correlation with age may have been coincidental, given the older age of the ADT
group as well as their use of ADT. This explanation is reassuring however the result
makes the attribution of elevated C-peptide levels to ADT alone more difficult.
Direct correlations with serum insulin are difficult as levels can be influenced
by many factors including body weight and fat mass, physical activity and
medications such as thiazide diuretics and beta-adrenergic antagonists89. Therefore,
any interpretation of correlation must be taken with caution. A further possible
explanation for this result may lie in the fact that the incidence of hypertension,
hypercholesterolaemia, coronary heart disease and diabetes mellitus all increase with
increasing age88. It may be that an increase in serum insulin and insulin resistance in
older patients may reflect an underlying undiagnosed metabolic syndrome with
71
Chapter 6: Analysis 71
increasing age, regardless of use of ADT. This is supported by a suggestion in the
literature that indeed serum insulin does increase with advancing age89.
This result is likely to be a problem that would recur in any future study as; in
general, patient groups receiving ADT will always tend to be of more advanced age.
We would suggest that a method of accounting for this possible confounding factor
in future studies would be to compare serum C-peptide between men receiving ADT,
and a cohort of age-matched, eugonadal control patients. Indeed, the studies that
have used age-matched controls to compare serum insulin against men receiving
ADT have found that there still remains a significant elevation of insulin in patients
on ADT that is not seen in the age-matched control group35.
PSA level and duration of ADT may have also contributed to elevation of C-
peptide in our study. Calculation of correlation co-efficient for each of these
variables demonstrated no statistically significant correlation with C-peptide level.
Interestingly the analysis of duration of ADT with C-peptide level suggested a
negative correlation with serum C-peptide decreasing with longer duration of ADT.
It is possible that men on long-term ADT with its induced insulin resistance and
hyperinsulinaemia may, like long-term diabetic patients, begin to lose pancreatic
production of insulin producing decreasing serum levels that have been observed in
this study. This phenomenon should be further investigated.
We also analysed, via PSA kinetics, the effect of diabetes, age, and medical co-
morbidities on PSA progression. This was achieved dividing the ADT group into two
according to C-peptide level. The first group was patients with C-peptide values
below the upper limit of the normal range of values (<1500pmol/L); the second
group those with values above the normal range. No correlations were obvious after
analysing these different trends.
Serum C-peptide is a surrogate marker for insulin production. It should ideally
be collected in the fasting state, which due to the outpatient nature of this study was
not possible. The non-fasting nature of collection in this study has been adjusted for
in the normal reference range. In any future studies serum samples should be
collected in the fasting state. Another possible confounder in this study is that of a
normal range for C-peptide. Normal ranges are usually acquired from analysis of a
young, healthy group of patients. Whether C-peptide levels in the young population
are an accurate reflection of what is ‘normal’ in the elderly population of this study
72
72 Chapter 6: Analysis
has not been assessed in the literature. This is unlikely to be answered with future
studies and the literature documented normal ranges should be used.
6.2 C-PEPTIDE AND PROGRESSION OF PROSTATE CANCER
The hypothesis of this study was that the hyperinsulinaemia of ADT was
correlated to the progression of advanced prostate cancer to castrate resistance.
Published literature has identified four key points regarding the role of insulin in
prostate cancer:
ADT, whilst initially causing regression of prostate cancer, invariably
progresses despite ongoing therapy with castrate serum testosterone levels
(castrate resistant prostate cancer)
Serum insulin increases with Androgen Deprivation Therapy in advanced
prostate cancer
Elevated serum insulin is associated with the development and progression of
cancers including prostate cancer
In vitro experiments demonstrate more rapid prostate cancer progression with
elevated serum insulin levels
Clinical research has now moved towards trials manipulating the insulin/IGF
axis in an attempt to slow the progression of advanced prostate cancer while
receiving ADT. For example, a trial is currently in the recruitment phase, based at
Massachusetts General Hospital in USA, to assess the response to treatment of
castrate resistant prostate cancer with metformin; a biguanide drug used commonly
in type 2 diabetes to improve insulin resistance. (www.clinicaltrials.gov)
The gap in literature that we identified was a correlation between serum insulin
levels and progression of advanced prostate cancer in human patients while
undergoing ADT. A recently published paper in the Annals of Oncology,
demonstrated that in men receiving ADT, the presence of metabolic syndrome at the
time of onset of treatment, decreased the time to progression of prostate cancer to the
castrate resistant phase. This paper did not however specifically assess insulin levels,
nor was hyperinsulinaemia required for the diagnosis of metabolic syndrome70.
Therefore, while their findings somewhat support our hypothesis, the question
remains unaddressed.
73
Chapter 6: Analysis 73
We assessed men at various stages of advanced disease, receiving ADT for
varying durations. The time between onset of ADT and the progression to castrate
resistance was calculated and compared to serum C-peptide levels (as a surrogate
marker for insulin production). The overall findings of this comparison, was that
there was no significant correlation between the two variables. Analysis was repeated
after removing men who had no PSA response to ADT. This correlation remained
statistically non-significant however a trend towards more rapid progression to
castrate resistance with increasing level of C-peptide was seen. A similar, non-
significant trend was seen after removing diabetic patients from this analysis. This
result was not sufficient to reject the null hypothesis of this study, that there is no
correlation between C-peptide and time to castrate resistance. Given the small
numbers recruited for this pilot study, it was unlikely that significance would be
reached for any correlation found. The trend that was identified however suggests
that this question certainly warrants further investigation, ideally in the form of a
prospective analysis. This achieves one of the main aims of this study.
One confounding variable identified in our study was the frequency of
measurement of PSA. Commonly men, after onset of ADT, received PSA testing at
sporadic, seemingly random periods, often with periods of over 12 months between
measurements. This inconsistency in measurement, both within individual kinetics,
and between different individuals, made an accurate assessment of the time of
progression of disease very difficult. The benefit of a prospectively designed trial is
that this inconsistency can be removed with a regular testing interval scheduled in the
study protocol. This would make for a much more accurate assessment of effect.
A further confounding variable is the patient’s body weight and BMI
measurements. This data was not available for the majority of study group patients,
and for any of the control group. As was discussed above, there is an increased risk
of insulin resistance with increased adiposity. As this data was not available at the
time of onset of ADT, any possible difference between the groups at that stage
cannot be analysed. The effect of ADT on body weight from the time of onset of
ADT to time of castrate resistance is also not known. This confounding variable
could be eliminated by a prospective study accruing this data from the time of onset
of treatment.
74
74 Chapter 6: Analysis
An interesting fact from the results of this trial was the significantly elevated
PSA levels at which patients were being diagnosed with advanced prostate cancer. In
many cases, the PSA at the time of onset of therapy was well in excess of 100ng/mL.
In some cases, this was after serial PSA monitoring of significantly elevated PSA
levels. This suggests that a significant proportion of men are presenting with very
advanced disease, and that in some cases, this is despite PSA monitoring by their
physician, which is concerning. We analysed this subgroup to assess for reasons that
may explain this phenomenon.
This study was performed in Queensland, Australia. Queensland is an
extremely large state with a land area of 1,730,648 sq km. Of this, 66% of the
population lives in the South-East corner around the capital, Brisbane, as at June 30,
200990. Parts of the state are extremely isolated, situated very large distances from
tertiary medical, and more specifically Urological care. The Mater and Princess
Alexandra Hospitals, Brisbane, from where patients were recruited for this study,
provide Urology care for a large proportion of the state of Queensland via an
outreach service. We therefore assessed the geographical location of the patients with
PSA values greater than 100ng/mL at time of onset of treatment. Of the 12 patients
who commenced ADT at a PSA greater than 100ng/mL, 7 lived outside the Greater
Brisbane regional area. 3 of the 12 patients either declined initial investigation of an
elevated PSA or declined treatment after diagnosis, 2 of these patients living within
the Brisbane area. This leaves 6 of 9 patients who were diagnosed at a very advanced
stage of their disease deriving from a regional area of Queensland. This is a
concerning statistic from a public health point of view. It highlights the need for
more education in these regional areas about prostate cancer and its diagnosis,
screening and treatment. This is something that should be further examined.
A significant factor in the design and analysis of this study was the definition
of castrate resistance. Castrate resistant prostate cancer presents a spectrum of
disease ranging from patients without metastases or symptoms, with rising PSA
levels despite ADT, to patients with metastases and significant debilitation due to
cancer symptoms91. The literature contains numerous different definitions of this
disease state, and in clinical practice, significant differences in definition exist. There
appears to be consensus that radiological or clinical progression of disease, in the
setting of castrate testosterone levels defines a subset of these patients. There are a
75
Chapter 6: Analysis 75
large number of patients however, for whom the only sign of disease progression is a
rising PSA despite ongoing ADT. Multiple definitions exist for this disease state.
After reaching a nadir level of PSA with ADT, the time of progression has
previously been defined in varying studies. This can be any of: the time of the first
confirmed rise in PSA, the time of two consecutive increases in PSA, the midpoint
between the time of first confirmed rise and nadir level, the time at which PSA
reaches 50% of baseline (pre-treatment) value, or the time at which PSA reaches a
level 50% above nadir. Each of these different definitions gives a different duration
of response to treatment, and in a clinical trial setting, can significantly alter the
results, either positively or negatively depending on the desired outcome for the
study. For this study, we chose a definition published by the Prostate Cancer
Working Group. This group of US specialist prostate cancer clinicians combined to
produce a consensus paper to guide future research outcomes reporting in prostate
cancer research. Two consensus papers have been published on this topic by this
group, and our definition derives from the most recent paper, published in 200884.
Whilst this definition does not give our results the most favourable outcome in
comparison to other definitions, it is the closest to an international consensus
definition available at this time, which we feel is an appropriate way to present our
results.
A good study to investigate any correlation between insulin levels and
progression of advanced prostate cancer in a formal trial setting would be a
prospective cohort study. A possible design for such a study could be as follows.
Patients are recruited with informed consent at the time of decision to commence
androgen deprivation therapy for their advanced prostate cancer, as was defined in
this study. The decision on when to commence treatment would be made by the
patient’s usual treating physician. Prior to onset of treatment with ADT, a fasting
blood sample should be collected and analysed for C-peptide and glucose. Data on
medical co-morbidities, medications and body weight and BMI should also be
collected. This information should then be updated at each 3 month interval. After 3
months of treatment, a repeat fasting blood sample should be collected and analysed
again for C-peptide, glucose and PSA. These men can then be followed out with
serial PSA measurements every 3 months up to the time of diagnosis of castrate
resistant prostate cancer. If our hypothesis is correct, and there is a positive
76
76 Chapter 6: Analysis
correlation between serum C-peptide level and time to progression to castrate
resistant disease, we would expect to see the men with the higher levels of C-peptide
progressing more rapidly. Patient samples should be compared with those of age-
matched, eugonadal control subjects to account for any possible association of age
with serum C-peptide level. Weight and BMI can also be compared to exclude this
possible confounding factor as affecting insulin sensitivity. This study would take a
period of some years to properly recruit and follow-up adequately, to achieve
appropriate power for statistical significance of any correlation.
Chapter 7: Conclusions 77
77
Chapter 7: Conclusions
This chapter discusses our conclusions from this project. It addresses the
limitations of our findings. Finally, it provides a plan for future research in this area
that may address the limitations identified from this project.
7.1 SUMMARY OF FINDINGS AND FUTURE PLANS
This study had two main aims:
To confirm the literature findings that men who are receiving ADT have
elevated serum C-peptide levels compared to men not receiving ADT. This
will be achieved by comparing serum C-peptide levels in the ADT group to
those in the control group of men with localised prostate cancer who are not
receiving ADT.
To correlate elevated C-peptide levels with ADT with the progression of
advanced prostate cancer to the castrate resistant phase. In accordance with
our hypothesis, we believe that men with a higher serum C-peptide level, will
progress to castrate resistance at a more rapid rate than those with lower
serum C-peptide level. This pilot study aims to identify a correlation to justify
the design of a formal trial to further investigate this correlation.
In addressing the first aim, we did indeed demonstrate that the group of men
receiving ADT had a statistically significantly higher serum C-peptide level than
those not receiving ADT. The range of values between groups did however have
significant overlap. With such small numbers in this study caution must be used in
interpreting the significance of this finding. These findings were also tempered
somewhat by the confounding increased age of our ADT group compared to control
which may play a part in the insulin resistance seen with ADT as; in general, men
receiving ADT for advanced prostate cancer will tend to be of more advanced age. In
future studies on this topic, this confounder can be removed by comparison with an
age-matched, eugonadal, non-prostate cancer control group.
78
78 Chapter 7: Conclusions
Our second aim was partly achieved. In our final analysis, there was a slight,
though non-significant trend towards more rapid development of castrate resistance
with elevated C-peptide level. This result was not sufficient to reject the null
hypothesis that there is no correlation between the two variables. However, this study
was designed as a pilot study, with very small numbers of patients and varying
lengths of follow-up of our patients with only 20 of the 36 ADT group patients
having reached castrate resistance at the time of analysis. The slight trend that we
identified, in our opinion, justifies further investigation in the form of a prospective
pilot study, the design of which we have suggested at the end of chapter 6 aiming to
account for the confounding factors that limit the interpretation of this study’s
findings.
There were some difficulties encountered in this project. There are numerous
definitions for castrate resistant prostate cancer used in the literature. Of these, we
selected the Prostate Cancer Working Group definition. This is as close to a
consensus definition as was available and we feel this definition should be used in
future studies to enable accurate interpretation of findings between studies.
Being largely retrospective in nature, our results were confounded by the
inconsistencies in PSA data available on a number of our patient cohort. In many of
the patients, there were long periods without PSA monitoring once patients
commenced on ADT. This makes definitions of disease based purely on PSA criteria
very difficult to interpret accurately. This problem can be removed in a prospectively
designed study with uniform timing of serial PSA measurements between patients.
Similarly, the retrospective, cross-sectional nature of this study meant that
important data such as body weight and BMI of all patients, both at time of onset of
treatment and at time of analysis was not known. This adds confounding variables
that limit the interpretation of our results in such a small study. A prospectively
accrued data set in future studies would address this issue.
Importantly, despite our small data set, we identified some features within our
population group that we feel deserve further investigation. Firstly, the large number
of patients, in both the ADT and the control group with significantly elevated C-
peptide levels suggesting a possible underlying insulin resistance. This may reflect a
significant distribution of early metabolic syndrome within not only those patients on
ADT, but also the wider community. We feel that the results of this study, suggesting
79
Chapter 7: Conclusions 79
a higher incidence of hyperinsulinaemia in those patients on ADT than in the control
group, in accordance with the published literature, are important. Regardless of the
effect of hyperinsulinaemia on prostate cancer progression, a hypothesis, which we
feel warrants further investigation as outlined above, long-term hyperinsulinaemia
has significant effects on the risk of long-term diabetes mellitus and its associated
morbidities, as well as long-term cardiovascular risk. We feel it is therefore very
important for medical practitioners to monitor their patients receiving ADT, as early
detection and management of developing insulin resistance could have potentially
great benefits for the patient’s long-term health, and may have yet to be determined
effects on their long-term prostate cancer progression.
With this in mind, there is currently a randomised trial underway in Australia,
investigating the use of metformin, used to manage insulin resistance, and its effects
on serum insulin in patients receiving ADT for advanced prostate cancer. We eagerly
await the results of this trial with hopes that it will strengthen and support some of
the findings of this study and perhaps offer evidence for early intervention and
management of insulin resistance in this patient population.
Secondly, a significant number of patients in our study were diagnosed with
very advanced prostate cancer and extremely high PSA values. More importantly in
this is the fact that a number were monitored for significant periods of time with no
investigation or treatment at these high PSA levels. Of these patients a large
proportion derive from rural and remote areas of our state, Queensland, Australia.
This may suggest a need for greater education on prostate cancer detection and
management for both the community and medical staff in these regions.
The issues that we have identified may have significant public health
ramifications in terms of morbidity, mortality and financial cost to the community.
We anticipate these important findings stimulating further study and improvement to
the general healthcare of the Queensland, and Australian population in future.
80
80 Chapter 7: Conclusions
Bibliography 81
81
Bibliography
1 ACIM (Australian Cancer Incidence and Mortality) Books. (Australian Institute of Health and Welfare (AIHW), 2010).
2 Feature Article 1: Population by Age and Sex, Australian States and Territories. (Australian Bureau of Statistics, 2010).
3 Productivity Commission, C. Economic Implications of an Ageing Australia. Research Report (2005).
4 Sharifi, N., Gulley, J. L. & Dahut, W. L. Androgen deprivation therapy for prostate cancer. JAMA 294, 238-244, (2005).
5 Gallagher, E. J. & Leroith, D. The proliferating role of insulin and insulin-like growth factors in cancer. Trends Endocrinol Metab, (2010).
7 Wein. Campbell-Walsh Urology. 9th edn, Vol. 3 (2007). 8 Byar, D. P. & Mostofi, F. K. Veterans Administration Cooperative Urologic
Research Groups: Carcinoma of the prostate; prognostic evaluation of certain pathologic features in 208 radical prostatectomies. Cancer 30, 5-13 (1972).
9 Gleason, D. F. & Mellinger, G. T. Prediction of prognosis for prostatic adenocarcinoma by combined histological grading and clinical staging. J Urol 111, 58-64 (1974).
10 AJCC Cancer Staging Manual: Prostate. 7th edn, 457-68 (Springer, 2010). 11 D'Amico, A. V. et al. Biochemical outcome after radical prostatectomy,
external beam radiation therapy, or interstitial radiation therapy for clinically localized prostate cancer. JAMA 280, 969-974, (1998).
12 Carter, C. A., Donahue, T. & Sun, L. Temporarily deferred therapy (watchful waiting) for men younger than 70 years and with low-risk localized prostate cancer in the prostate-specific antigen era. J Clin Oncol 21, 4001-4008 (2003).
13 Pound, C. R., Partin, A. W. & Eisenberger, M. A. Natural history of progression after PSA elevation following radical prostatectomy. JAMA 281, 1591-1597 (1999).
14 Bolla, M., van Poppel, H. & Collette, L. Long-term results with immediate androgen suppression and external irradiation in patients with locally advanced prostate cancer (an EORTC study): A phase III randomised trial. Lancet 360, 103-106 (2002).
15 Moul, J. W. The evolving definition of advanced prostate cancer. Rev Urol 6 Suppl 8, S10-17 (2004).
16 Scher, H. I. et al. Eligibility and outcomes reporting guidelines for clinical trials for patients in the state of a rising prostate-specific antigen: recommendations from the Prostate-Specific Antigen Working Group. J Clin Oncol 22, 537-556, (2004).
17 1997, C. S. Consensus statement: Guidelines for PSA following radiation therapy. Int J Radiat Oncol Biol Phys 37, 1035-1041 (1997).
18 Namiki, M., Kitagawa, Y., Mizokami, A. & Koh, E. Primary combined androgen blockade in localized disease and its mechanism. Best Pract Res Clin Endocrinol Metab 22, 303-315, (2008).
82
82 Bibliography
19 Huggins, C. & Hodges, C. V. Studies on prostatic cancer. I. The effect of castration, of estrogen and of androgen injection on serum phosphatases in metastatic carcinoma of the prostate. Cancer Res 1, 293-297 (1941).
20 Sprenkle, P. C. & Fisch, H. Pathologic effects of testosterone deprivation. Curr Opin Urol 17, 424-430, (2007).
21 Hara, N. et al. Decline of the red blood cell count in patients receiving androgen deprivation therapy for localized prostate cancer: impact of ADT on insulin-like growth factor-1 and erythropoiesis. Urology 75, 1441-1445, (2010).
22 Lu-Yao, G., Stukel, T. A. & Yao, S. L. Changing patterns in competing causes of death in men with prostate cancer: a population based study. J Urol 171, 2285-2290, (2004).
23 National Health Survey: Summary of Results. (Australian Bureau of Statistics, 2007-2008).
24 The IDF consensus worldwide definition of the metabolic syndrome. (International Diabetes Federation, 2006).
25 Simmons, R. K. et al. The metabolic syndrome: useful concept or clinical tool? Report of a WHO Expert Consultation. Diabetologia 53, 600-605, (2010).
26 Hooper, C. Insulin Signaling Pathways: Defects in this hormone pathway and type-2 diabetes. Abcam (2010). http://www.abcam.com/index.html?pageconfig=resource&rid=10602&pid=7.
27 Pollak, M. N., Schernhammer, E. S. & Hankinson, S. E. Insulin-like growth factors and neoplasia. Nat Rev Cancer 4, 505-518, (2004).
28 Frasca, F. et al. The role of insulin receptors and IGF-I receptors in cancer and other diseases. Arch Physiol Biochem 114, 23-37, (2008).
29 Pandini, G. et al. Insulin and insulin-like growth factor-I (IGF-I) receptor overexpression in breast cancers leads to insulin/IGF-I hybrid receptor overexpression: evidence for a second mechanism of IGF-I signaling. Clin Cancer Res 5, 1935-1944 (1999).
30 Huggins, C., Stevens, R. E. J. & Hodges, C. V. Studies on Prostatic Cancer II. The Effects of Castration On Advanced Carcinoma of the Prostate Gland. Arch Surg 43, 209-223 (1941).
31 Tayek, J. A. et al. Nutritional and metabolic effects of gonadotropin-releasing hormone agonist treatment for prostate cancer. Metabolism 39, 1314-1319 (1990).
32 Haffner, S. M. & Valdez, R. A. Endogenous sex hormones: impact on lipids, lipoproteins, and insulin. Am J Med 98, 40S-47S (1995).
33 Mulligan, T., Frick, M. F., Zuraw, Q. C., Stemhagen, A. & McWhirter, C. Prevalence of Hypogonadism in Males Aged At Least 45 Years: The HIM Study. Int J Clin Pract 60, 762-769, (2006).
34 Basaria, S. et al. Long-term effects of androgen deprivation therapy in prostate cancer patients. Clin Endocrinol (Oxf) 56, 779-786, (2002).
35 Basaria, S., Muller, D. C., Carducci, M. A., Egan, J. & Dobs, A. S. Hyperglycemia and insulin resistance in men with prostate carcinoma who receive androgen-deprivation therapy. Cancer 106, 581-588, (2006).
36 Basaria, S. Androgen deprivation therapy, insulin resistance, and cardiovascular mortality: an inconvenient truth. J Androl 29, 534-539, (2008).
83
Bibliography 83
37 Smith, M. R., Lee, H. & Nathan, D. M. Insulin sensitivity during combined androgen blockade for prostate cancer. J Clin Endocrinol Metab 91, 1305-1308, (2006).
38 Smith, M. R., Lee, H., Fallon, M. A. & Nathan, D. M. Adipocytokines, obesity, and insulin resistance during combined androgen blockade for prostate cancer. Urology 71, 318-322, (2008).
39 Smith, M. R. et al. Metabolic changes during gonadotropin-releasing hormone agonist therapy for prostate cancer: differences from the classic metabolic syndrome. Cancer 112, 2188-2194, (2008).
40 Smith, M. R. Changes in fat and lean body mass during androgen-deprivation therapy for prostate cancer. Urology 63, 742-745, doi:10.1016/j.urology.2003. (2004).
41 Godsland, I. F. Insulin resistance and hyperinsulinaemia in the development and progression of cancer. Clin Sci (Lond) 118, 315-332, (2010).
42 Smith, J. C. et al. The effects of induced hypogonadism on arterial stiffness, body composition, and metabolic parameters in males with prostate cancer. J Clin Endocrinol Metab 86, 4261-4267 (2001).
43 Chen, W. et al. Insulin resistance in patients with advanced prostate cancer undergoing intermittent or continuous androgen blockade. Chin J Cancer 28, 150-153, (2009).
44 Keating, N. L., O'Malley, A. J. & Smith, M. R. Diabetes and cardiovascular disease during androgen deprivation therapy for prostate cancer. J Clin Oncol 24, 4448-4456, (2006).
45 Lage, M. J., Barber, B. L. & Markus, R. A. Association between androgen-deprivation therapy and incidence of diabetes among males with prostate cancer. Urology 70, 1104-1108, (2007).
46 Derweesh, I. H. et al. Risk of new-onset diabetes mellitus and worsening glycaemic variables for established diabetes in men undergoing androgen-deprivation therapy for prostate cancer. BJU Int 100, 1060-1065, (2007).
47 Smith, M. R. et al. Changes in body composition during androgen deprivation therapy for prostate cancer. J Clin Endocrinol Metab 87, 599-603 (2002).
48 Braga-Basaria, M., Muller, D. C., Carducci, M. A., Dobs, A. S. & Basaria, S. Lipoprotein profile in men with prostate cancer undergoing androgen deprivation therapy. Int J Impot Res 18, 494-498, (2006).
49 Yannucci, J., Manola, J., Garnick, M. B., Bhat, G. & Bubley, G. J. The effect of androgen deprivation therapy on fasting serum lipid and glucose parameters. J Urol 176, 520-525, (2006).
50 Hursting, S. D. & Berger, N. A. Energy Balance, Host-Related Factors, and Cancer Progression. J Clin Oncol, (2010).
51 Becker, S., Dossus, L. & Kaaks, R. Obesity related hyperinsulinaemia and hyperglycaemia and cancer development. Arch Physiol Biochem 115, 86-96, (2009).
52 Pisani, P. Hyper-insulinaemia and cancer, meta-analyses of epidemiological studies. Arch Physiol Biochem 114, 63-70, (2008).
53 Renehan, A. G. et al. Insulin-like growth factor (IGF)-I, IGF binding protein-3, and cancer risk: systematic review and meta-regression analysis. Lancet 363, 1346-1353, (2004).
54 Pollak, M. Insulin and insulin-like growth factor signalling in neoplasia. Nat Rev Cancer 8, 915-928, (2008).
84
84 Bibliography
55 Libby, G. et al. New users of metformin are at low risk of incident cancer: a cohort study among people with type 2 diabetes. Diabetes Care 32, 1620-1625, (2009).
56 Evans, J. M., Donnelly, L. A., Emslie-Smith, A. M., Alessi, D. R. & Morris, A. D. Metformin and reduced risk of cancer in diabetic patients. BMJ 330, 1304-1305, (2005).
57 Bowker, S. L., Majumdar, S. R., Veugelers, P. & Johnson, J. A. Increased cancer-related mortality for patients with type 2 diabetes who use sulfonylureas or insulin. Diabetes Care 29, 254-258, (2006).
58 Cox, M. E. et al. Insulin receptor expression by human prostate cancers. Prostate 69, 33-40, (2009).
59 Hsing, A. W., Sakoda, L. C. & Chua, S., Jr. Obesity, metabolic syndrome, and prostate cancer. Am J Clin Nutr 86, s843-857 (2007).
60 Lima, G. A., Correa, L. L., Gabrich, R., Miranda, L. C. & Gadelha, M. R. IGF-I, insulin and prostate cancer. Arq Bras Endocrinol Metabol 53, 969-975, (2009).
61 Ma, J. et al. Prediagnostic body-mass index, plasma C-peptide concentration, and prostate cancer-specific mortality in men with prostate cancer: a long-term survival analysis. Lancet Oncol 9, 1039-1047, (2008).
62 Neuhouser, M. L. et al. Finasteride modifies the relation between serum C-peptide and prostate cancer risk: results from the Prostate Cancer Prevention Trial. Cancer Prev Res (Phila Pa) 3, 279-289, (2010).
63 Hammarsten, J. & Hogstedt, B. Hyperinsulinaemia: a prospective risk factor for lethal clinical prostate cancer. Eur J Cancer 41, 2887-2895, (2005).
64 Freedland, S. J. et al. Carbohydrate restriction, prostate cancer growth, and the insulin-like growth factor axis. Prostate 68, 11-19, (2008).
65 Ngo, T. H. et al. Effect of isocaloric low-fat diet on human LAPC-4 prostate cancer xenografts in severe combined immunodeficient mice and the insulin-like growth factor axis. Clin Cancer Res 9, 2734-2743 (2003).
66 Venkateswaran, V. et al. Association of diet-induced hyperinsulinemia with accelerated growth of prostate cancer (LNCaP) xenografts. J Natl Cancer Inst 99, 1793-1800, (2007).
67 Snyder, C. F. et al. Does pre-existing diabetes affect prostate cancer prognosis? A systematic review. Prostate Cancer Prostatic Dis 13, 58-64, (2010).
68 Patel, T., Hruby, G., Badani, K., Abate-Shen, C. & McKiernan, J. M. Clinical Outcomes After Radical Prostatectomy in Diabetic Patients Treated With Metformin. Urology, (2010).
69 Lehrer, S., Diamond, E. J., Stagger, S., Stone, N. N. & Stock, R. G. Increased serum insulin associated with increased risk of prostate cancer recurrence. Prostate 50, 1-3, (2002).
70 Flanagan, J. et al. Presence of the metabolic syndrome is associated with shorter time to castration-resistant prostate cancer. Ann Oncol, (2010).
71 Bianco, F. J., Jr. Paradigms in androgen/castrate resistant states of prostate cancer in a biomarker era. Urol Oncol 26, 408-414, (2008).
72 Montgomery, R. B. et al. Maintenance of intratumoral androgens in metastatic prostate cancer: a mechanism for castration-resistant tumor growth. Cancer Res 68, 4447-4454, (2008).
73 Debes, J. D. & Tindall, D. J. Mechanisms of androgen-refractory prostate cancer. N Engl J Med 351, 1488-1490, (2004).
85
Bibliography 85
74 Feldman, B. J. & Feldman, D. The development of androgen-independent prostate cancer. Nat Rev Cancer 1, 34-45, (2001).
75 Grossmann, M. E., Huang, H. & Tindall, D. J. Androgen receptor signaling in androgen-refractory prostate cancer. J Natl Cancer Inst 93, 1687-1697 (2001).
76 So, A., Gleave, M., Hurtado-Col, A. & Nelson, C. Mechanisms of the development of androgen independence in prostate cancer. World J Urol 23, 1-9, (2005).
77 Titus, M. A., Schell, M. J., Lih, F. B., Tomer, K. B. & Mohler, J. L. Testosterone and dihydrotestosterone tissue levels in recurrent prostate cancer. Clin Cancer Res 11, 4653-4657, (2005).
78 Locke, J. A. et al. Androgen levels increase by intratumoral de novo steroidogenesis during progression of castration-resistant prostate cancer. Cancer Res 68, 6407-6415, (2008).
79 Leon, C. G. et al. Alterations in cholesterol regulation contribute to the production of intratumoral androgens during progression to castration-resistant prostate cancer in a mouse xenograft model. Prostate, (2009).
80 Visakorpi, T. et al. In vivo amplification of the androgen receptor gene and progression of human prostate cancer. Nat Genet 9, 401-406, (1995).
81 Pienta, K. J. & Bradley, D. Mechanisms underlying the development of androgen-independent prostate cancer. Clin Cancer Res 12, 1665-1671, (2006).
82 Culig, Z. et al. Androgen receptor activation in prostatic tumor cell lines by insulin-like growth factor-I, keratinocyte growth factor, and epidermal growth factor. Cancer Res 54, 5474-5478 (1994).
83 Chen, C. D. et al. Molecular determinants of resistance to antiandrogen therapy. Nat Med 10, 33-39, (2004).
84 Scher, H. I. et al. Design and end points of clinical trials for patients with progressive prostate cancer and castrate levels of testosterone: recommendations of the Prostate Cancer Clinical Trials Working Group. J Clin Oncol 26, 1148-1159, (2008).
85 Ashby, J. P. & Frier, B. M. Circulating C peptide: measurement and clinical application. Ann Clin Biochem 18, 125-130 (1981).
86 Krause, U., von Erdmann, B., Atzpodien, W. & Beyer, J. C-peptide-measurement: a simple method for the improvement of specificity. J Immunoassay 2, 33-44 (1981).
87 Kintzel, P. E., Chase, S. L., Schultz, L. M. & O'Rourke, T. J. Increased risk of metabolic syndrome, diabetes mellitus, and cardiovascular disease in men receiving androgen deprivation therapy for prostate cancer. Pharmacotherapy 28, 1511-1522, (2008).
88 Wilson, P. W. & Kannel, W. B. Obesity, diabetes, and risk of cardiovascular disease in the elderly. Am J Geriatr Cardiol 11, 119-123,125 (2002).
89 Lindberg, O., Tilvis, R. S. & Strandberg, T. E. Does fasting plasma insulin increase by age in the general elderly population? Aging (Milano) 9, 277-280 (1997).
90 Statistics, A. B. o. Article - Regional Population Growth, Australia, 2008-09 - Queensland. (2010).
91 Saad, F. & Hotte, S. J. Guidelines for the management of castrate-resistant prostate cancer. Can Urol Assoc J 4, 380-384 (2010).
86
86 Bibliography
Acknowledgements
Principal Supervisors
Prof Colleen Nelson BSc, PhD
Director of Australian Prostate Cancer Research Centre – QLD, Australia
Professor and Chair of Prostate Cancer Research, Institute of Health and Biomedical
Innovation, Queensland University of Technology, Australia
Dr Peter Swindle, MBBS, FRACS, MS
Consultant Urologist, Mater Adult Hospital, Brisbane, QLD, Australia
Senior Lecturer, University of Queensland School of Medicine, Australia
Associate Supervisors
Prof Adrian Herington, BSc (Hons), PhD
Deputy Executive Dean, Faculty of Science and Technology, Queensland University
of Technology, Australia
Assistance From
Dr Jennifer Gunter, BAppSc (Hons), PhD
Post-doctoral research fellow, Australian Prostate Cancer Research Centre – QLD,
Australia
Ms Amy Lubik, BSc (Hons)
PhD student, Australian Prostate Cancer Research Centre – QLD, Australia