Pecvnia, núm. 19 (julio-diciembre 2014), pp. 131-155 THE ROLE OF LIFE CYCLE ON THE FIRM’S CAPITAL STRUCTURE 1 Paula Castro 2 [email protected]María T. Tascón [email protected]Borja Amor-Tapia [email protected]University of León fecha de recepción: 20/10/2015 fecha de aceptación: 05/11/2015 Resumen En este trabajo, adoptamos un punto de vista dinámico para contribuir al debate sobre cómo y por qué eligen las empresas su estructura de capital. Utilizamos el modelo de Dickinson (2011) sobre etapas del ciclo de vida de las empresas, basado en la distinción entre flujos de efectivo operativos, de inversión y financieros, para analizar las diferencias de comportamiento en las distintas etapas de las variables que tradicionalmente se han encontrado significativas para explicar la estructura de capital. Sobre una amplia muestra de empresas cotizadas de Alemania, España, Francia y el Reino Unido, encontramos que los factores explicativos de la estructura de capital evolucionan a lo largo de las etapas del ciclo de vida, de manera que va cambiando la prevalencia de las teorías estáticas en competencia, equilibrio, jerarquía y oportunidad de mercado. Palabras clave: Fases del ciclo de vida; Estructura de capital; Apalancamiento. 1 Previous versions of this work were contributed to the following scientific meetings: XIV Seminario Luso-Español de Economía Empresarial (Salamanca, 2012); and 36 th Annual Congress of the European Accounting Association (Paris, 2013). 2 Departamento de Dirección y Economía de la Empresa, Área de Economía Financiera y Contabilidad (Finanzas), Facultad de Ciencias Económicas y Empresariales, Campus de Vegazana s/n, 24071 León.
Transcript
Pecvnia, núm. 19 (julio-diciembre 2014), pp. 131-155
THE ROLE OF LIFE CYCLE ON THE FIRM’S CAPITAL STRUCTURE1
fecha de recepc ión: 20/10/2015 fecha de aceptac ión : 05/11/2015
Resumen En este trabajo, adoptamos un punto de vista dinámico para contribuir al debate sobre cómo y por qué eligen las empresas su estructura de capital. Utilizamos el modelo de Dickinson (2011) sobre etapas del ciclo de vida de las empresas, basado en la distinción entre flujos de efectivo operativos, de inversión y financieros, para analizar las diferencias de comportamiento en las distintas etapas de las variables que tradicionalmente se han encontrado significativas para explicar la estructura de capital. Sobre una amplia muestra de empresas cotizadas de Alemania, España, Francia y el Reino Unido, encontramos que los factores explicativos de la estructura de capital evolucionan a lo largo de las etapas del ciclo de vida, de manera que va cambiando la prevalencia de las teorías estáticas en competencia, equilibrio, jerarquía y oportunidad de mercado. Palabras clave: Fases del ciclo de vida; Estructura de capital; Apalancamiento.
1 Previous versions of this work were contributed to the following scientific meetings: XIV
Seminario Luso-Español de Economía Empresarial (Salamanca, 2012); and 36th Annual Congress of the European Accounting Association (Paris, 2013).
2 Departamento de Dirección y Economía de la Empresa, Área de Economía Financiera y Contabilidad (Finanzas), Facultad de Ciencias Económicas y Empresariales, Campus de Vegazana s/n, 24071 León.
Pecvnia, núm. 19 (julio-diciembre 2014), 131-155
P. Castro, M.T. Tascón and B. Amor-Tapia
132
Abstract In this work we adopt a dynamic standpoint to contribute to the debate on how and why firms choose their capital structure. Using the Dickinson’s (2011) life cycle stages of firms, based on the distinction between operating, investing and financing cash flow types, we examine the different behavior of the traditionally found explanatory variables across the stages. Taking a wide sample of public companies form UK, Germany, France and Spain, we find that the capital structure explanatory factors evolve across the life cycle stages, changing or rebalancing the prevalence of the static models in play, i.e. trade-off, pecking order, or market timing. Keywords: Life cycle stages; Capital structure; Leverage. 1. Introduction The theory on why firms choose differing combinations of debt and equity to finance their operations is one of the most contentious issues in finance, but research on capital structure has not proved conclusive. The main theories in play have identified some general factors to explain the level of equity or debt, even though their predictions for some of the factors are the opposite. In fact, empirical evidence has generally converged in very scarce relations, such as the negative effect of profitability or liquidity on leverage. Frequently, when empirical analyses are performed, results find weak or no support concerning the economic effect of specific variables or the resulting effect may be different from previous evidence. Graham and Leary (2011) point to ‘capital structure dynamics not adequately considered’ as one of the empirical shortcomings in this area. Frank and Goyal (2009) suggest that different theories of capital structure apply to firms under different circumstances and each factor could be dominant for some firms or in some circumstances, yet unimportant elsewhere. On the other hand, in the last years a theory on the firm’s life cycle is being developed in finance, to explain the changing economic and financial behavior of the firm along its life (Strebulaev, 2007), even though the life cycle theory has traditionally been developed in strategic management. Our work starts from the idea of a dynamic evolution of the firm: across the stages, investment/disinvestment needs, profitability, cash flow generation or risk change; consequently, financing needs and motivations are different, as well as the firm’s debt capacity with banks or in financial markets. Our objective is to integrate a conventional capital structure study into the strategic dynamics of the firm. The question is if the combination of factors explaining each life stage is behind non lineal relations of leverage with firm characteristics. A comprehensive analysis of the relevant factors explaining the firm’s capital structure in the classical theories, that is, the tradeoff and the pecking order, offers size, age, tangible assets, growth, profitability, risk,
133
The role of life cycle on the firm’s capital structure
R&D as the main elements. And, precisely, investment/disinvestment, growth, profitability, together with a parsimonious increase in age and size, are key factors to distinguish the life cycle stages of the firm. Therefore, a high grade of coincidence among variables are found significant by empirical works in approximating both life cycle and leverage. A difficulty in raising this conceptually simple test is the empirical definition of life cycle stages. Previous literature has not agreed on the number of stages, their names and conditions. To cope with this problem, we have followed the novel work of Dickinson (2011) in which life cycle stages are built starting from accounting information on operating, investing, and financing cash flows, as the author carefully explores the relation with life cycle fundamentals. Using an international sample (UK, Germany, France and Spain), extracted from the Worldscope database, for the period 1980-2011 we perform Fama-MacBeth regressions as well as GMM to test our hypotheses about the role of the life cycle stages on the firms’ leverage. Our results confirm the relevant role of the factor and provide information on the differential effect of variables across stages. This constitutes our main contribution: why firms choose different levels of debt in different stages of their life-cycles. Unlike the previous study by La Rocca, La Rocca and Cariola (2011) in which age is the criterion to distinguish between three life cycle stages, we use a measure that considers the ability of generating cash flows at the different business levels of the firm (operating, investing, and financing). And this criterion allows us to identify five stages. Even though age is a good proxy of the life cycle stage in many cases, some operating, investing and financing events induce the change from one stage to another independently of the age of the firm, what gives a higher discriminant potential to the variable we use. Besides, our work is applied to quoted firms while in La Rocca et al. (2011) only small and medium-sized firms are considered. Therefore, we contribute to two main research lines (capital structure and business life cycle), by adding a dynamic factor to explain the choice of leverage by managers. Our results support fundamental theories of capital structure, namely tradeoff, pecking order, and market timing, but in addition we show how the prevalence of the theories changes as the firm evolves. The paper is structured as follows: Section 2 reviews the related literature on life cycle theory and capital structure, and develops our hypotheses. Section 3 explains the life cycle stages measurement, poses the model, and introduces the selected variables starting from previous evidence. Section 4 discusses the sample and descriptive statistics. Section 5 shows the results, and Section 6 presents the conclusions. 2. Theoretical background and hypotheses We synthesize related insights from two distant academic fields, strategic management and corporate finance. As for the organizational life stage of firms, we focus on the changing role of some features of the firm along the life cycle, with more interest in those related to leverage. Concerning the capital structure, we make a brief review of the
Pecvnia, núm. 19 (julio-diciembre 2014), 131-155
P. Castro, M.T. Tascón and B. Amor-Tapia
134
main theories and the empirical results obtained on firms’ leverage choices in order to identify which economic forces are found more explanatory in different stages of the firms. 2.1. Leverage in the life cycle theory The firms’ life cycle has been widely treated since the 1970s within the area of organization. But the notion of life stage seems to be elusive, and empirical literature has used a varied number of classifications, ranging from two (Bulan and Yan, 2010) or three stages to as many as ten (Adizes, 1999). This varied number of stages is the first reason for some lack of consistence in results across studies. The second, and more relevant, reason is the different criteria in classifying the stages. Thus, for two classifying models a firm may be placed in close but non-equivalent stages. A good work of reference in the search of common stages in the early literature is Miller and Friesen (1984). They find convergence in five life stages: birth, growth, maturity, revival, and decline. Fundamentals changes in key internal and/or external factors distinguish and identify each firm life cycle stage. This conceptual model is followed by Dickinson (2011) who empirically demonstrates that, consistent with theory, profitability and growth vary, cross-sectionally and over time, as the firm progresses through life stages. Most part of the varied proxies for life cycle indicate changes in specific factors of the operating activities of the firms, such as investment (Wernerfelt, 1985), or product efficiency (Spence, 1977). Concerning the changes in the financial activities of the firms, retained earnings has been used by DeAngelo, DeAngelo and Stulz (2006) or Kim and Suh (2009). But Miller and Friesen (1984) find that inter-stage differences come from the interaction among the strategy, the structure, the environment, and the decision-making style, what suggests that several factors should be considered jointly in defining stages. That is why we use as reference the comprehensive model by Dickinson (2011). Concerning the relation with leverage, there is very little theory to explain the differences in financing across the stages of the firms’ life cycles, as Fluck (1999) points out. The empirical evidence is nowadays incipient, being still scarce even in grey literature. Factors such as size, age, profitability, tangible assets, retained earnings (all of them used by Bulan and Yan, 2010), or dividends (DeAngelo et al., 2006), show different leverage patterns when firms are mature, as the maturity effect is related to debt capacity or affordability. Bulan and Yan (2010) identify firms in two stages, growth and maturity, finding that the pecking order theory (based on the information asymmetry between investors and firm managers) better describes the financing behavior of mature rather than growing firms. Using a different life stage model, both Frielinghaus, Mostert and Firer (2005) and Teixeira and Coutinho (2005) find results consistent with the pecking order theory and confirm that firms tend to adopt specific financing strategies as they progress along their lives. And analyzing why small firms have different capital structure from large firms, in a theoretical model of optimal financial contracting, Fluck (1999) points to the stage-dependency of the control rights of claimholders.
135
The role of life cycle on the firm’s capital structure
Unlike the little (and mostly implicit) reference given to different life stages in previous theoretical and empirical literature on capital structure, the non-linear behavior of the explanatory variables, frequently pointed out, let us pose our first hypothesis. H1: The life cycle stages of the firm, measured from the accounting cash flow, is a relevant explanatory factor in the change of the capital structure of the firm, proxied by its leverage. 2.2. Leverage in certain life stages according to the static capital structure theories There are two traditional theories on capital structure choice, namely the pecking order theory and the trade-off theory, generally considered mutually exclusive. A more recent third theory, called market timing, is applied as complementary to any of the two. The trade-off theory postulates that firms choose leverage by balancing benefits and costs of using debt, being taxation and bankruptcy costs the key features. Some of previous empirical results on the trade-off theory are implicitly related to life stages. They suggest that firms in pre-mature (introduction and growth) stages cannot afford debt as their bankruptcy costs are high, their earnings are too low to use the tax benefit of increasing interest payments, and earnings are not stable yet3. At the end of firms’ life cycle, when they are likely to suffer a decrease in earnings (and consequently a decrease in the tax shield benefit from using debt) Frielinghaus et al. (2005) derive a lower use of debt. Hence, the static trade-off theory would suggest a low-high-low pattern across the life cycle stages of the firm. According to the pecking order theory, the firm has no optimal capital structure. The theory upholds a financing hierarchy of retained earnings, debt, and then equity, in order to minimize adverse selection costs of security issuance. This is the result of the existence of asymmetric information. Some previous empirical results on the pecking order theory are also implicitly related to life stages. The inverse relation between leverage and profitability (Fama and French, 2002) supports the view that debt is only issued when retained income is insufficient to finance investment. Helwege and Liang (1996) find that the least risky firms are the most likely to issue public bonds, but those firms that issue equity are not riskier than firms that obtain bank debt. Frank and Goyal (2003) and Lemmon and Zender (2010) confirm that the greatest support for the pecking order is found among larger and mature firms4, while frequent issues by small high-growth firms are consistent with debt capacity concerns. Fama and French (2005) find that in listed US
3 Graham (2000) finds that those firms with unique products, low asset collateral or large
future growth opportunities –presumably at introduction or growth stages– tend to show lower levels of leverage. Besides, the group of larger, more liquid, and more profitable firms with fewer expected distress costs use debt conservatively. Opler and Titman (1994) find that more leveraged firms engaged in R&D –presumably in pre-mature stages– suffer economically distressed periods in a more intense way. Bradley et al. (1984) identify volatility of firm earnings as a relevant, inverse determinant of firm leverage, which points out to lower leverage in less stable firms (likely, younger firms).
4 It has to be highlighted that the original theory was geared towards mature low growth-option firms.
Pecvnia, núm. 19 (julio-diciembre 2014), 131-155
P. Castro, M.T. Tascón and B. Amor-Tapia
136
firms, net issuers of equity are less profitable and grow faster, while low-growth firms with positive profitability do not issue or retire much equity, though large fractions of firms of all types seem to make equity decisions inconsistent with the pecking order. In short, the pecking order theory suggests a high-low-high pattern of debt ratio across stages (in contrast to the static trade-off theory). As for the equity market timing, two different ways have been put forward to supply conditions affecting the equity issuance (Graham and Leary, 2011). On the one hand, managers can exploit deviations of market prices from fundamental value (Baker, Stein, and Wurgler, 2003). On the other, the issue costs would be lower when prices are higher, if adverse selection costs are negatively correlated with market returns (Bayless and Chaplinsky, 1996). Previous literature findings may be useful in our subsequent life cycle analysis, such as the positive correlation between equity issuance and market returns (Hovakimian, Opler and Titman, 2001) or the fact that issuance decisions are much more sensitive to estimated risk premium (Huang and Ritter, 2009). Therefore, different but economically sound theories explain the firm’s relation among explanatory factors and capital structure giving often rise to contrary signs (for samples differing in aspects such as period, geographical zone, industry, size, age, etc.). The coincidence of those changes in variables related to the life cycle of the firm with those other changes in the capital structure of the firm, let us pose our second and third hypotheses. H2: The prevalence of the traditional capital structure theories changes as the firm evolves through its life cycle. H3: The tradeoff / pecking order / market timing theory is better (less) able to explain the determinants of firm leverage in each of the five life cycle stages identified by the accounting cash flows. 3. Research design To distinguish among the different life cycle stages the firms go through, we follow the Dickinson’s (2011) approach, which is explained in section 3.1. Then, we proceed to propose our model and to explain the variables in it. 3.1. Measure of life cycle stages Based on previous classifications of life cycle stages of the company, Dickinson (2011) establishes five stages of life. The first stage is called introduction. In it the firm produces an innovation. In the second stage, called growth, the firm rises rapidly, as a lot of figures, such as assets, equity, or sales, indicate. During the third stage, maturity, the company reaches its maximum number of producers. In the fourth stage, shake-out, the firm loses part of its producers. And, finally, during the fifth stage, decline, the company shows virtually no entries.
137
The role of life cycle on the firm’s capital structure
But the model used to discriminate among the life cycles is innovative. Dickinson (2011) uses accounting information extracted from the Cash Flow Statement. The three net cash flow activities (operating, investing, and financing) can take a positive or negative sign, resulting in eight possible combinations, which are regrouped by the author into the five stages previously selected in accordance with literature giving rise to the model showed in Table 1. Table 1. Life cycle stage model
Cash flow type Introduction Growth Mature Shake-out Decline
Operating - + + +/- - Investing - - - +/- +
Financing + + - +/- +/- As Dickinson (2011) states, the combination of those cash flow patterns represents the firm’s resource allocation and operational capabilities interacted with the firms’ choice in strategy. One of the most appealing aspects of this model is that the author’s predictions about each cash flow component as a proxy for life cycle are challenged to be consistent with economic theory. That is, the author confirms that economic characteristics vary with life stages as determined by cash flow patterns, but also by a previous classification of reference (Anthony and Ramesh, 1992). 3.2. Model on capital structure across life cycle stages Our model starts from the conventional empirical analysis, in which leverage is regressed on several explanatory factors. In our case, the selected factors are: profitability (denoted Prof), market to book (denoted MtoB), liquidity, size, non-debt tax shields (denoted NDTS), tangible assets (denoted Acttan), and Age. In addition, the equation includes a new factor, life cycle stage (denoted LCSR).
α β β β β ββ β β ε
= + + + + ++ + + +
1 2 3 4 5
6 7 8
it it it it it it
it it it it
TDA LCSR Prof MtoB Liquidity SizeNDTS Acttan Age
(1)
Where TDAit is the leverage of firm i in year t, α0 is the independent term and β are the coefficients of the variables taken as explanatory factors. LCSR ranges from 1 to 5 indicating the stage of the life cycle, according to Dickinson (2011): introduction (1), maturity (2), growth (3), shake-out (4), and decline (5). The variables included in our model have been selected after considering the factors that the traditional capital structure theories have posed as explanatory variables of leverage, and the factors that determine the firms’ stages according to the life cycle theory. In this section we examine the previous behavior of those factors when used in capital structure models even if they were proxied by similar but not the same variables.
Pecvnia, núm. 19 (julio-diciembre 2014), 131-155
P. Castro, M.T. Tascón and B. Amor-Tapia
138
Financial leverage is our proxy for capital structure and works as the dependent variable in our model. We have selected book leverage, computed as the ratio of total debt over total assets. Profitability and growth are key factors of the financing deficit (Fama and French, 2005). Profitability is computed as the ratio of earnings before interest, taxes, depreciation, depletion, and amortization over total assets. As seen in section 2, profitability plays a role in determining the firm’s leverage in both models, tradeoff and pecking order. Given that profitable firms face lower expected bankruptcy costs and are in better conditions to take advantage of interest tax shields, the tradeoff theory predicts the use of more debt. Also, as profitable firms could face free cash flow problems (Jensen, 1986), they will appreciate the discipline provided by debt, from the agency cost perspective. But, after examining the reasoning developed by authors incorporating the life cycle dynamic point of view, a low-high-low pattern is expected across the stages. That is, the prediction of the static tradeoff theory should work mainly in mature firms. Notwithstanding, the empirical evidence shows a pervasive regularity in the inverse relation between leverage and profitability (Myers, 1993), consistent with the pecking order idea that higher profitability enables firms to use less debt (considering investment fixed). The inverse relation has also been confirmed by the recently applied dynamic models of optimal structure (Strebulaev, 2007). We proxy expected growth by using market to book, computed as market value of equity plus debt in current liabilities plus long-term debt plus preferred stocks, minus deferred taxes and investment tax credit over total assets. For the tradeoff theory, growth means higher bankruptcy costs, lower free cash flow problems, and exacerbated debt agency problems, that imply less debt (Frank and Goyal, 2009). Consistently, empirical evidence has found lower debt in firms with future growth opportunities (Rajan and Zingales, 1995; Bauer, 2004) and more volatility in earnings (Bradley, Jarrell and Kim, 1984). On the contrary, the pecking order theory would predict more debt when firms expect to grow, as new investments require additional funds, holding profitability fixed. This variable is the most reliable as proxy for growth opportunities (Adam and Goyal, 2008), although it can be biased by stock mispricing. Considering the third capital structure theory in play, market timing, with higher values of the market-to-book ratio, firms would issue more equity in order to exploit the favorable market conditions, what would mean less debt proportion. Liquidity is computed as the ratio of current assets to current liabilities. The reasoning behind the relation between liquidity and leverage is twofold. On the one hand, more liquidity reduces the need to take on debt. Also, Ozkan (2001) puts down this negative relationship to the potential conflicts between shareholders and bondholders, as liquidity of the firm's assets may proxy the opportunistic behavior by shareholders at the expense of debtholders. On the other, liquidity can induce more debt, as a positive sign for lenders on the debt capacity of the firm. Previous empirical results point out to a negative relation as prevalent.
Size is computed as the logarithm of total assets. Considering the lower bankruptcy costs due to higher diversification in larger firms, the tradeoff theory predicts relatively more debt, though the issue costs decrease with firm size, both for equity and bonds (Lemmon and Zender, 2010). In addition, size is a sign of the firms’ strength for lenders, since assets are considered as collateral (Fama and French, 2002). On the contrary, the pecking order theory predicts an inverse relation to leverage, as the adverse selection problems
139
The role of life cycle on the firm’s capital structure
considerably decrease in large firms (Frank and Goyal, 2003). Most empirical evidence has supported the positive relation between size and leverage though others do not find this relation significant (Teker, Tasseven and Tukel, 2009).
Non-debt tax shield is computed as the ratio of depreciation, depletion and amortization to total assets. Some authors (DeAngelo and Masulis, 1980; Ramlall, 2009) suggest that the non-debt tax shields are a substitute for the tax benefits of debt financing. Thus, for the tradeoff theory a negative relation to leverage is predicted. An alternative explanation can be posed from the pecking order theory. In it, a positive relation with leverage would be predicted since non-debt tax shields work as a proxy for the firms’ assets, indicating affordability or debt capacity of the firm. Several empirical works (Bradley et al., 1984) identify a direct relation between firm leverage and the relative amount of non-debt tax shields, while others find a negative relation (for example Ozkan, 2001).
Tangibility is computed as the ratio of property, plant and equipment to total assets. The tradeoff theory predicts a positive relation between tangible assets and leverage, considering the lower expected costs of distress and fewer debt-related agency problems. On the contrary, the pecking order theory points to low information asymmetry associated with tangible assets as a cause of less costly equity issuances. The lower proportion of debt would imply a negative relation to leverage. Rajan and Zingales (1995) take into consideration that tangibility increases adverse selection (about assets in place) which would result in higher debt. This way tangibility would be a form of secured collateral. Frank and Goyal (2009) attribute the ambiguity under the pecking order theory to the fact that tangibility can act as a proxy for different economic forces. In this line, Faulkender and Petersen (2006) reason out that the firms with higher tangibility ratios are more likely to have a bond rating, what would induce higher leverage. Empirical works find evidence of the positive relation between tangible assets and leverage (Rajan and Zingales, 1995), however, others find a negative relation (Weill, 2004). Age is computed as the logarithm of the difference between the year t and the year in which the firm was founded. In the tradeoff theory, age is considered to reflect a stronger firm’s market base. The firm better manages its cash flows, requiring less debt (Ramlall, 2009). Concerning the pecking order, age is considered as a proxy for the informational transparency of the firm, the lower risk, and also for the predictability of its cash flow, being the three indicators of debt capacity (Bolton and Freixas, 2000). Previous empirical evidence is not conclusive about the relation between the firm’s age and its leverage. Perhaps, the reason behind is that capital structure may be a non-linear function of the firm’s age, as found in Brewer, Genay, Jackson and Worthington (1996). 4. Sample and descriptive statistics 4.1. Sample We take from Worldscope database all the non-financial firms from UK, Germany, France and Spain from 1980 to 2011 (57,195 firm-year observations). As life cycle is proxied using the information extracted from the Cash Flow Statements, and these data are not
Pecvnia, núm. 19 (julio-diciembre 2014), 131-155
P. Castro, M.T. Tascón and B. Amor-Tapia
140
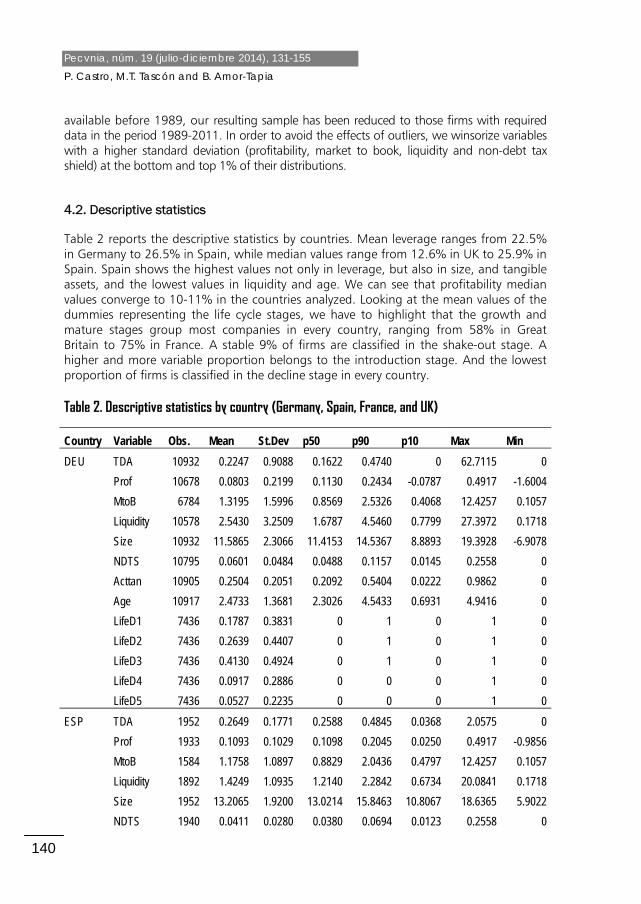
available before 1989, our resulting sample has been reduced to those firms with required data in the period 1989-2011. In order to avoid the effects of outliers, we winsorize variables with a higher standard deviation (profitability, market to book, liquidity and non-debt tax shield) at the bottom and top 1% of their distributions. 4.2. Descriptive statistics Table 2 reports the descriptive statistics by countries. Mean leverage ranges from 22.5% in Germany to 26.5% in Spain, while median values range from 12.6% in UK to 25.9% in Spain. Spain shows the highest values not only in leverage, but also in size, and tangible assets, and the lowest values in liquidity and age. We can see that profitability median values converge to 10-11% in the countries analyzed. Looking at the mean values of the dummies representing the life cycle stages, we have to highlight that the growth and mature stages group most companies in every country, ranging from 58% in Great Britain to 75% in France. A stable 9% of firms are classified in the shake-out stage. A higher and more variable proportion belongs to the introduction stage. And the lowest proportion of firms is classified in the decline stage in every country. Table 2. Descriptive statistics by country (Germany, Spain, France, and UK)
Country Variable Obs. Mean St.Dev p50 p90 p10 Max Min
DEU TDA 10932 0.2247 0.9088 0.1622 0.4740 0 62.7115 0
Age 46027 2.5577 1.2516 2.5649 4.3307 0.6931 4.9416 0
LifeD1 31410 0.2004 0.4003 0 1 0 1 0
LifeD2 31410 0.2555 0.4361 0 1 0 1 0
LifeD3 31410 0.3929 0.4884 0 1 0 1 0
LifeD4 31410 0.0949 0.2931 0 0 0 1 0
LifeD5 31410 0.0563 0.2305 0 0 0 1 0
Notes: TDA is book leverage (total debt / total assets); Prof is profitability (EBITDA / total assets); MtoB is market to book (market value of equity + debt in current liabilities + long-term debt + preferred stocks - deferred taxes and investment tax credit to total assets); Liquidity is current assets to current liabilities; Size is the logarithm of total assets; NDTS is non-debt tax shield (depreciation, depletion and amortization to total assets); Acttan is tangibility (property, plant and equipment / assets); Age is the logarithm of the years after the firm foundation; LifeD1-5 are dummy variables indicating the stage of the life cycle, according to Dickinson (2011): introduction (1), maturity (2), growth (3), shake-out (4), decline (5). LifeD1-5 takes the value 1 if the firm is in the stage and 0 otherwise. Table 3 provides the correlations between variables for the whole sample. None of the variables are strongly correlated. We can appreciate that profitability appears as the most influential factor on leverage, with a negative relation; and market to book is the second influential factor with positive relation. Also, the variables most influential in certain life stages are age, profitability, market to book, and size. Table 3. Correlation analysis Panel A. Comprehensive correlation analysis
Age 0.0523 0.1630* -0.0971* -0.1930* 0.1429* -0.0959* 0.1838* 1
* Indicates significance at the 0.05 level.
Notes: TDA is book leverage (total debt / total assets); Prof is profitability (EBITDA / total assets); MtoB is market to book (market value of equity + debt in current liabilities + long-term debt + preferred stocks - deferred taxes and investment tax credit to total assets); Liquidity is current assets to current liabilities; Size is the logarithm of total assets; NDTS is non-debt tax shield (depreciation, depletion and amortization to total assets); Acttan is tangibility (property, plant and equipment / assets); Age is the logarithm of the years after the firm foundation.
Significant correlations point to interesting linkings. Size and age correlate positively in every stage. However the correlation with leverage shows different patterns (more leveraged firms seem to be smaller but nothing can be stated about their age), indicating that a deeper analysis is needed. When we go through correlations across the life cycle stages of the firm, a non-lineal relation of size and age with leverage is suggested. And even more interesting, size and age do not behave similarly across stages. Smaller firms
145
The role of life cycle on the firm’s capital structure
are more leveraged just in the introduction and decline stages while younger firms are more leveraged just in maturity. Contrary to logical expectations, profitability and expected growth are negatively correlated. But this is not a stable relation across stages. During growth and maturity, profitable firms are expected to grow, as market prices reflect. The more profitability, the more liquidity is expected; and the more liquidity the firm gets, the less indebtedness needed. Though this commonly accepted idea is supported in general by data, the by-stage analysis shows some relevant nuances:
- During the growth stage, the relation between profitability and liquidity is not significant, suggesting that those resources obtained with profitability are being used mostly in the growing process. Therefore, in this certain stage, more profitability (value creation) does not mean more spare money (affordability).
- During the shake-out stage, the profitability-liquidity relation is negative, but in this case these variables show an opposite-sign relation with leverage. More profitability does not mean more liquidity, indicating that the shake-out process is only developed when the firm is profitable.
The tangible assets variable shows a consistent positive relation with size, age, profitability, and non-debt tax shield, while negative with market-to-book and liquidity across stages. As for the relation with leverage, more tangible assets imply more debt except for the decline stage, where the firm is expected to reduce its tangible assets. Concerning market-to-book, consistently, more ability to grow is showed by companies with fewer tangible assets or less size and age. The relation with liquidity is positive, except in the decline. There is also a positive relation with debt (in general) except in growth and maturity in which companies need less debt. And it is precisely in these stages when market-to-book shows a negative relation with leverage. Descriptive statistics suggest that as a general standpoint the market expectation of growth allows the company to get more debt. But during growth and maturity, the higher profitability makes the company able to finance new investments by its own, not requiring additional leverage. Finally, non-debt tax shield shows a stable negative relation across stages with size, age, and liquidity, and a positive relation with tangible assets. This is consistent with more depreciation of assets every year: when the company gets older and bigger the proportion between tangible assets and liquidity changes, proportionally reducing depreciation items. 5. Results In this section, we document the role played in the evolution of leverage by the life cycle stages of the firm. Fama-MacBeth regressions are used to study the effects of commonly
Pecvnia, núm. 19 (julio-diciembre 2014), 131-155
P. Castro, M.T. Tascón and B. Amor-Tapia
146
found relevant factors on the leverage of firms. Then, we perform a second group of regressions using the comprehensive model by life stage. Table 4 shows that adding the life cycle stage variable to the rest of selected factors makes a contribution in the explanatory ability of the model (column 2). Unlike univariate analysis, in which all the variables but age showed a significant relation with leverage, using the Fama-MacBeth multivariate analysis, significance is different: size, non-debt tax shield, and tangible assets seem to exert no relevant influence on leverage, while age is significant at 10%. When we run regressions by stage (columns 3 to 7) we observe that all the variables play a role in explaining leverage, consistently with previous literature on capital structure, though the role is different depending on the stage. As expected, non-linear relations can explain the lack of significance of some relevant factors, when general regressions are performed. By stage (columns 3-7), the higher R2 indicates a considerable improvement in the model specification in respect to the general model (column 1), even in respect of that general model including the life cycle stage variable as explanatory variable (column 2). This way, we confirm our first hypothesis. Thus, if we examine by-stage coefficients in detail we can better analyze the effect of explanatory factors on profitability. General regressions leave those relations with non-linear patterns across stages partially unexplained (in the best case). Consistent with previous evidence, profitability shows a strong inverse relation with leverage in the general regression (Table 4, column 1). By stages, we find that the inverse relation is significant during growth and maturity, but not during introduction, shake-out, or decline. Also, the relation is more intense during maturity, against the low-high-low pattern hypothesized in section 3.2 according to tradeoff. Therefore, our results support the pecking order theory of less debt with higher profitability, for firms in growth and maturity. During the introduction, shake-out, and decline stages, the effect of profitability is not relevant, perhaps due to the offset of contrary-signs effects: a group of firms would take advantage of less bankruptcy cost and interest tax shields, and/or avoid free cash flow problems, to take more debt following the trade off, while others would decrease debt due to higher profitability. With more growth opportunities (MtoB), our results show higher leverage during introduction, shake out and decline. This can be framed into the pecking order, meaning more debt required by additional investments. As seen in the correlation analysis, during growth and maturity firms with growth opportunities are profitable and generate liquidity, what would make additional debt unnecessary. This is also consistent with growth and mature firms taking advantage of higher market prices to issue new shares, reducing the proportion of leverage, as predicted by the market timing theory. Liquidity is perhaps the factor that showed a more regular tendency in its negative relation with leverage, in the correlation analysis. In Table 5, the regressions show that this negative relation is less significant during the decline stage. As indicated in the
147
The role of life cycle on the firm’s capital structure
correlation analysis, during decline, we can appreciate that the profitability coefficient has considerably increased (column 7) while the correlation between liquidity and profitability is the highest among stages. It suggests that during decline, liquidity is adding less explanatory ability once profitability is included in the model. Size shows a significant positive effect over leverage during growth, maturity, and shake-out. In these phases, in which the firm has access to diverse sources of funds, the less costs and higher debt affordability can explain the choice of more debt, as predicted by the tradeoff theory. In both introduction and decline, opposite influences in place would make the coefficient non-significant. For instance, new entrants in financial markets can issue equity as they grow, but they have the opportunity to issue bonds instead, and they can also obtain bank debt in good conditions. Our non-significant coefficient for size during introduction is consistent with Helwege and Liang’s (1996) results for IPO firms. Our results for non-debt tax shield during introduction, maturity and shake-out support the pecking order prediction that considers this variable as a proxy for debt capacity or affordability. However, during growth, correlation coefficients suggest that a subtle effect of market valuation (of non-debt tax shield) offsets the positive relation to make it non-significant. During decline, results suggest again that the inclusion of this variable is unnecessary once another one (MtoB) has been included. The coefficient for MtoB considerably increases in decline compare to the other stages preempting the effect of NDTS on leverage. Results on the influence of tangible assets over leverage are the same as in our previous correlation analysis. The positive relation found for introduction5, growth, maturity, and shake-out supports tradeoff when this theory links tangibility with lower costs of distress or fewer debt related agency problems. In addition, our results support the pecking order reasoning about tangible assets as a form of secured collateral. During decline, tangible assets are expected to decrease at the same time that profitability and size do. In these conditions tangibility is not an explanatory factor of leverage. Age shows a clear non-linear pattern across stages. During the introduction stage, more age explains higher leverage. By contrast, during maturity and shake-out younger firms are more leveraged. The fact that, according to the correlation analysis, this factor appeared as significant during growth, and that the relation during shake-out was opposite, suggests that a more in-depth analysis is needed.
5 Tangible assets exert the same effect as size on the firms’ leverage, except during the
introduction stage. Our results suggest that firms tend to finance tangible assets with debt also during the introduction stage, though other increases of size in this stage may be financed by debt or equity, but none of them prevails over the other.
Pecvnia, núm. 19 (julio-diciembre 2014), 131-155
P. Castro, M.T. Tascón and B. Amor-Tapia
148
Table 4. By-Stage determinants of leverage. Fama-MacBeth regressions
Standard errors in brackets. *** p<0.01, ** p<0.05, * p<0.1.
Notes: TDA is book leverage (total debt / total assets); Prof is profitability (EBITDA / total assets); MtoB is market to book (market value of equity + debt in current liabilities + long-term debt + preferred stocks - deferred taxes and investment tax credit to total assets); Liquidity is current assets to current liabilities; Size is the logarithm of total assets; NDTS is non-debt tax shield (depreciation, depletion and amortization to total assets); Acttan is tangibility (property, plant and equipment / assets); Age is the logarithm of the years after the firm foundation; LifeD1-5 are dummy variables indicating the life cycle stages, according with Dickinson (2011): introduction (1), maturity (2), growth (3), shake-out (4), and decline (5). LifeD1-5 takes the value 1 if the firm is in the stage and 0 otherwise.
149
The role of life cycle on the firm’s capital structure
6. Robustness analyses We evaluate the robustness of our results looking to cross-sectional and time series dependence, and using the generalized-method-of-moments (GMM). 6.1. Cross-sectional and time series dependence
Using Fama-MacBeth (1973) regressions, standard errors are unbiased to time effect but can be biased downward to firm effect. The reason is that the variance formula assumes independent yearly estimates of coefficients of the independent variables, what is not true in the presence of a firm effect (Petersen, 2009). The bias increases as the correlation is higher and disappears in large samples. The problem is that smaller standard errors lead to higher t-statistics rising statistical significance, even if it should not exist. As Petersen (2009) indicates, much of the empirical work in the accounting literature focuses exclusively on cross-sectional dependence and does not examine the issues originated by the presence of both cross-sectional and time-series dependence. To correct both cross-sectional and time-series dependence, a number of methods have been proposed. According to empirical results (Petersen, 2009), the two-way cluster-robust standard errors method (CL-2) has shown to be robust to both time and firm effects. In untabulated results, we check if our results can be attributable to biases induced by residual dependence. We have repeated all regressions with CL-2, using the Stata routine proposed by Petersen (2009), and in general the results remain the same for all the variables considered6, showing some distortion only in the decline stage.
6.2. Endogeneity issues Finally, we apply the generalized-method-of-moments (GMM) estimators developed by Arellano and Bond (1991) for panel data models. This methodology is designed to cope with three specific econometric problems: the existence of unobserved firm-specific effects, avoided by taking first differences of variables; the autoregressive process in the leverage data; and the presence of endogeneity in the explanatory variables. We control for potential endogeneity of the variables Prof, LCSR, MtoB, Liquidity, Size, NDTS, Acttan, and Age in the GMM estimations by using the same variables as instruments in almost all regressions. The country and the interest rate growth variables are considered exogenous initially. To obtain the results displayed in Table 4-bis, we use different options for each regression. In the regression without the life cycle variable, we can consider the efficiency of the leverage model, taking into consideration only the 1% significance, because we need non-significance in Hansen and m2 tests. This regression uses independent variables as instruments, and country and interest rate growth as exogenous variables. 6 When size is not included, age coefficient is significant, but only at the 5% level.
Pecvnia, núm. 19 (julio-diciembre 2014), 131-155
P. Castro, M.T. Tascón and B. Amor-Tapia
150
Table 4-bis. By-Stage determinants of leverage. GMM procedure
Number of firms 2,124 2,047 1,066 1,331 1,836 784 466
F test 24076 259.2 2.570e+07 36.34 9.350e+08 133.3 2.030e+11
Hansen test 390.6 164.8 804.8 177.4 1476 204.7 449.3
Sig. 0.0494 1 0.853 1 0.838 0.999 1
m2 0.12 -0.5 -1.19 1.14 2.23 -1.46 -0.86
Sig. 0.904 0.619 0.235 0.253 0.025 0.144 0.391
Standard errors in brackets. *** p<0.01, ** p<0.05, * p<0.1.
Notes: TDA is book leverage (total debt / total assets); Prof is profitability (EBITDA / total assets); MtoB is market to book (market value of equity + debt in current liabilities + long-term debt + preferred stocks - deferred taxes and investment tax credit to total assets); Liquidity is current assets to current liabilities; Size is the logarithm of total assets; NDTS is non-debt tax shield (depreciation, depletion and amortization to total assets); Acttan is tangibility (property, plant and equipment / assets); Age is the logarithm of the years after the firm foundation; LifeD1-5 are dummy variables indicating the life cycle stages, according with Dickinson (2011): introduction (1), maturity (2), growth (3), shake-out (4), and decline (5). LifeD1-5 takes the value 1 if the firm is in the stage and 0 otherwise.
151
The role of life cycle on the firm’s capital structure
In our general regression with life cycle, both tests show that the model is well specified. The Hansen test confirms the joint validity of the instruments in the GMM estimation. The model is also well specified for the introduction, the growth, the shake-out and the decline stages with independent variables as instruments, and country and interest rate growth as exogenous variables. It is different in the case of the maturity stage because we can accept the model only at the 1% level of significance, due to the autocorrelation coefficient. The instruments are the independent variables plus LCSR, interest rate, GDP growth, and insiders, and a year dummy is the exogenous variable. 7. Conclusions For an international sample (UK, Germany, France and Spain) over the 1980-2011 period, we provide empirical evidence on the introduction of the business life cycle as explanatory factor of the firms’ capital structure. Using the innovative model of Dickinson (2011) to distinguish among the life cycle stages of the firm, we have run several groups of Fama and MacBeth regressions. The life cycle stage factor is included either as an indicator of stage in the general model, or performing regressions in a by-stage analysis. Robustness tests are performed on the cross-sectional and time series dependence. Furthermore, all the regressions have been re-run by using GMM, finding no significant changes in results concerning the hypotheses tests. Our results document a remarkable improvement of models when life cycle stages are considered. The explanatory ability of the general model increases when the variable is included; and the improvement is much higher when the general model containing all the explanatory variables selected is performed by stage. Consistent with the tradeoff theory, we identify: a positive relation with size during growth, maturity, and shake-out; a parallel positive relation with tangible assets during the same stages but also during the introduction; a positive relation with age during the introduction but a negative one during maturity and shake-out. Therefore, during the introduction tangible assets would imply lower costs of distress or fewer debt related agency problems, while age would be a sign of a stronger market base, inducing higher debt. During growth, maturity, and shake-out, bigger firms would get more debt taking advantage of their lower bankruptcy costs due to higher diversification, and the sign of strength that size sends to lenders; and firms with more tangible assets would obtain more debt for the same reasons as in the introduction. However, during maturity and shake-out, the negative relation between age and leverage poses a puzzle difficult to solve by both trade-off and pecking order. Consistent with the pecking order theory, we identify: an inverse relation of leverage with profitability, during growth and maturity; a positive relation with growth opportunities (proxied by market-to-book), during introduction, shake-out and decline; a negative relation with liquidity, during all the stages; a positive relation with non-debt tax shield, during introduction, maturity, and shake-out; a positive relation with tangible assets during introduction, growth, maturity, and shake-out; and a negative relation with age during maturity and shake-out. Therefore, during the introduction stage, more growth
Pecvnia, núm. 19 (julio-diciembre 2014), 131-155
P. Castro, M.T. Tascón and B. Amor-Tapia
152
opportunities would imply new investments, less liquidity would increase the necessity to take on debt, higher non-debt tax shield, more tangible assets and age would act as a sign of debt capacity, giving rise to more debt. During growth, profitability would let the firm to take less debt, but more tangible assets would increase debt. Mature firms seem to get more debt when they are less profitable and less liquid, while non-debt tax shield and tangible assets would act as a sign of debt capacity. During shake-out, less liquidity and more growth opportunities would imply higher debt necessities, while non-debt tax shield and tangible assets would act as a sign of debt capacity. During decline, growth opportunities seem to be the only relevant factor in pushing the firm to increase leverage. In line with the market timing theory, we identify: higher market to book values positively related to leverage, during introduction, shake-out and decline. It indicates that exploiting favorable market conditions can be a prevailing reason in capital structure choices. As we connect two main strands of literature, we make contributions to both of them. To the line of research on capital structure, our work adds a dynamic explanatory factor, the business life cycle, which contributes with more precise knowledge on the choice of leverage, disentangling a portion of those non lineal relations identified between leverage and firm characteristics. Our study provides support for several reasonings from both tradeoff and pecking order theories. Furthermore, the main contribution of this work is identifying what part of the theories explains leverage in each specific life cycle stage. As hypothesized, the prevalence of the theories changes as the firms do. To the line of research on the business life cycle, we provide new international evidence of a very recent model designed to distinguish among the life cycle stages. Our results confirm that Dickinson’s (2011) model is consistent with the life cycle theory by applying it to a new theoretical framework, the evolution of debt within the widely studied static theories on capital structure. Our results have important implications for business managers, as capital structure is the prime financial decision to be taken by firms, and show that the life cycle stage is a discriminant element of this decision. Also, our findings may help business assessors, financial analysts or investors to better understand different behavior patterns concerning firms financing. References
Adam, T.R. and Goyal, V.K. (2008). The investment opportunity set and its proxy variables. Journal of Financial Research, 31(1), 41-63.
Adizes, I. (1999). Managing corporate life cycles. Englewood Cliffs, NJ: Prentice-Hall.
Anthony, J. and Ramesh, K. (1992). Association between accounting performance measures and stock prices. Journal of Accounting and Economics, 15(2-3), 203-227.
153
The role of life cycle on the firm’s capital structure
Arellano, M. and Bond, S. (1991). Some tests of specification for panel data: Monte Carlo evidence and an application to employment equations. The Review of Economic Studies, 58(2), 277-297.
Baker, M., Stein, J.C. and Wurgler, J. (2003). When does the market matter? Stock prices and the investment of equity-dependent firms. The Quarterly Journal of Economics, 118(3), 969-1005.
Bauer, P. (2004). Determinants of capital structure - Empirical evidence from the Czech Republic. Czech Journal of Economics and Finance, 54, 2-21.
Bayless, M. and Chaplinsky, S. (1996). Is there a window of opportunity for seasoned equity issuance? The Journal of Finance, 51(1), 253-278.
Bolton, P. and Freixas, X. (2000). Equity, bonds, and bank debt: Capital structure and financial market equilibrium under asymmetric information. Journal of Political Economy, 108(2), 324-351.
Bradley, M., Jarrell, G.A. and Kim, E.H. (1984). On the existence of an optimal capital structure: Theory and evidence. The Journal of Finance, 39(3), 857-878.
Brewer, E., Genay, H., Jackson, W.E. and Worthington, P.R. (1996). How are small firms financed? Evidence from small business investment companies. Economic Perspectives, 20(6), 1-18.
Bulan, T. and Yan, Z. (2010). Firm maturity and the pecking order theory. International Journal of Business and Economics, 9(3), 179-200.
DeAngelo, H., DeAngelo, L. and Stulz, R.M. (2006). Dividend policy and the earned/contributed capital mix: A test of the life-cycle theory. Journal of Financial Economics, 81(2), August, 227-254.
DeAngelo, H. and Masulis, R. (1980). Optimal capital structure under corporate and personal taxation. Journal of Financial Economics, 8(1), 3-29.
Dickinson, V. (2011). Cash flow patterns as a proxy for firm life cycle. The Accounting Review, 86(6), 1969-1994. Available at SSRN: http://ssrn.com/abstract=755804.
Fama, E.F. and French, K.R. (2002). Testing trade-off and pecking order predictions, about dividends and debt. Review of Financial Studies, 15(1), 1-33.
Fama, E.F., and French, K.R. (2005). Financing decisions: Who issues stock? Journal of Financial Economics, 76(3), 549-582.
Fama, E.F. and MacBeth, J.D. (1973). Risk, return, and equilibrium: empirical tests. Journal of Political Economy, 81(3), 607-636.
Faulkender, M. and Petersen, M.A. (2006). Does the source of capital affect capital structure? Review of Financial Studies, 19(1), 45-79.
Fluck, Z. (1999). Capital structure decisions in small and large firms: a life-cycle theory of financing. NYU Working Paper No. FIN-99-069, October. Available at SSRN: http://ssrn.com/ abstract=1298862.
Frank, M.Z. and Goyal, V.K. (2003). Testing the pecking order theory of capital structure. Journal of Financial Economics, 67(2), 217-248.
Frank, M.Z. and Goyal, V.K. (2009). Capital structure decisions: Which factors are reliably important? Financial Management, 38(1), 1-37.
Pecvnia, núm. 19 (julio-diciembre 2014), 131-155
P. Castro, M.T. Tascón and B. Amor-Tapia
154
Frielinghaus, A., Mostert, B. and Firer, C. (2005). Capital structure and the firm’s life stage. South African Journal of Business Management, 36(4), 9-18.
Graham, J.R. (2000). How big are the tax benefits of debt? The Journal of Finance, 55(5), 1901-1942.
Graham, J.R. and Leary, M.T. (2011). A Review of empirical capital structure research and directions for the future. Annual Review of Financial Economics, 3. Available at SSRN: http://ssrn.com/abstract=1729388
Helwege, J. and Liang, N. (1996). Is there a pecking order? Evidence from a panel of IPO firms. Journal of Financial Economics, 40(3), 429-458.
Hovakimian, A., Opler, T. and Titman, S. (2001). The debt-equity choice. Journal of Financial and Quantitative Analysis, 36(1), 1-24.
Huang, R. and Ritter, J.R. (2009). Testing theories of capital structure and estimating the speed of adjustment. Journal of Financial and Quantitative Analysis, 44(2), 237-271.
Jensen, M. (1986). Agency cost of free cash flow, corporate finance and takeovers. American Economic Review Papers and Proceedings, 76(2), 323-329.
Kim, B. and Suh, J. (2009). Financial life cycle and capital structure. Working Paper, August. Available at: http://www.finance.nsysu.edu.tw/SFM/17thSFM/program/FullPaper/056-1202481925.pdf.
La Rocca, M., La Rocca, T., and Cariola, A. (2011). Capital structure decisions during a firms’s life cycle. Small Business Economics, 37(1), 107-130.
Lemmon, M.L. and Zender, J.F. (2010). Debt capacity and tests of capital structure theories. Journal of Financial and Quantitative Analysis, 45(5), 1161-1187.
Miller, D. and Friesen, P.H. (1984). A longitudinal study of the corporate life cycle. Management Science, 30(10), 1161-1183.
Myers, S.C. (1993). Still searching for optimal capital structure. Journal of Applied Corporate Finance, 6(1), 4-14.
Opler, T.C. and Titman, S. (1994). Financial distress and corporate performance. The Journal of Finance, 49(3), 1015-1040.
Ozkan, A. (2001). Determinants of capital structure and adjustment to long run target: Evidence from UK company panel data. Journal of Business Finance and Accounting, 28(1-2), 175-198.
Petersen, M.A. (2009). Estimating standard errors in finance panel data sets: Comparing approaches. Review of Financial Studies, 22(1), 435-480.
Rajan, R.G. and Zingales, L. (1995). What do we know about capital structure? Some evidence from international data. Journal of Finance, 50(5), 1421-1460.
Ramlall, I. (2009). Determinants of capital structure among non-quoted Mauritian firms under specificity of leverage: Looking for a modified pecking order theory. International Research Journal of Finance and Economics, 31, 83-92.
Spence, M. (1977). Entry, capacity, investment, and oligopolistic pricing. Bell Journal of Economics, 8(2), 534-544.
155
The role of life cycle on the firm’s capital structure
Strebulaev, I.A. (2007). Do tests of capital structure theory mean what they say? Journal of Finance, 62(4), 1747-1787.
Teixeira, G. and Coutinho Dos Santos, M.J. (2005). Do firms have financing preferences along their life cycle? Working paper. Available at SSRN: http://ssrn.com/ abstract=676869.
Teker, D., Tasseven, O. and Tukel, A. (2009). Determinants of capital structure for Turkish firms: A panel data analysis. International Research Journal of Finance and Economics, (29), 179-187.
Wernerfelt, B. (1985). The dynamics of prices and market shares over the product life cycle. Management Science, 31(8), 928-939.
Weill, L. (2004). What determines leverage in transition countries? Finance a úvěr - Czech Journal of Economics and Finance, 54(5-6), 234-242.