Entitled: The Role of Management Incentives in the Choice of Stock Repurchase
Methods
and submitted in partial fulfillment of the requirements for the degree of
Master of Science in Administration (Finance Option)
complies with the regulations of the University and meets the accepted standards with respect to
originality and quality.
Sign by the final Examining Committee:
Dr. Tasha Wallace Chair
Dr. Rahul Ravi Examiner
Dr. Sandra Betton Examiner
Dr. Thomas Walker Supervisor
Approved by Dr. H. Bhabra, Graduate Program Director
Dr. S. Harvey, Dean, John Molson School of Business
Date February 19th, 2015
iii
ABSTRACT
The Role of Management Incentives in the Choice of Stock Repurchase Methods
Ata Torabi
This study employs conditional event study methodology to analyze how managers’ personal
motives affect the method by which firms repurchase their shares. To address this question, we
examine insider trading activities around the announcement date of a stock repurchase. We find
that firms are more likely to choose tender offers rather than an open market repurchases when
the respective announcements are followed by heightened net insider sales. The results are most
significant in the two months subsequent to the announcement. Our findings remain robust when
examining the relationship between net insiders sales and stock repurchase methods in a sample
that includes matched firms. We do not find any significant correlation between pre-
announcement insider trading and the type of repurchase method a firm employs. Similarly, there
are no differences between the long-term accounting or stock price returns of our sample firms
when comparing the two repurchase methods. Our findings support Fried (2000) who proposes
that tender offer repurchases are used by insiders to directly or indirectly transfer value among
shareholders with insiders emerging ahead of the average public shareholder. As such, they
should be of interest to investors and policymakers involved in the regulation of insider financial
transactions.
iv
ACKNOWLEDGEMENTS
I am extremely grateful to Dr. Thomas Walker for his continuous guidance, immense knowledge, and
enthusiasm. I would also like to thank my thesis committee members and external readers Dr. Betton,
Dr. Ravi, and Dr. Barabanov for their rich expertise and insightful comments.
My deepest and most sincere gratitude to my family for their continuous and unparalleled love, help
and support. I am forever indebted to my parents Hossein and Akram for giving me the opportunities
and experiences that have made me who I am. Finally, to my girlfriend Tian whose continued support
helped me conquer my first goal, homestretch.
v
TABLE OF CONTENTS
List of Tables ........................................................................................................................................ vi
List of Figures ....................................................................................................................................... vi
1. Introduction and Hypotheses Development ..................................................................................... 1
2. Sample and Data Description ............................................................................................................ 4
Comment, R., and Jarrell, G., 1991, The relative signaling power of Dutch-auction and fixed-price tender
offers and open-market share repurchases, Journal of Finance 46, 1243-1271.
Core, J., and Guay, W., 2001, Stock option plans for non-executive employees, Journal of Financial
Economics 61, 253-287.
Dann, L., 1981, Common stock repurchases: An analysis of returns to bondholders and stockholders,
Journal of Financial Economics 9, 113-138.
Dittmar, A., 2000, Why do firms repurchase stock? Journal of Business 73, 331-355.
Fried, J. M., 2000, Insider signaling and insider trading with repurchase tender offers. University of
Chicago Law Review 67, 421-477.
Gosnell, T., Keown, A., and Pinkerton, J., 1992, Bankruptcy and insider trading: Differences between
exchange-listed and OTC firms, Journal of Finance 47, 349-362.
Ikenberry, D., Lakonishok, J., and Vermaelen, T., 1995, Market under-reaction to open market share
repurchases, Journal of Financial Economics 39, 181-208.
Jensen, M. C., 1986, Agency costs of free cash flow, corporate finance, and takeovers, American
Economic Review 76, 323-329.
Jensen, M. C., and Murphy, K., 1990, Performance pay and top-management incentives, Journal of
Political Economy 98, 225-264.
Jenter, D., 2005, Market timing and managerial portfolio decisions, Journal of Finance 60, 1903-1949.
Jin, L., 2002, CEO compensation, diversification and incentives, Journal of Financial Economics 66, 29-
63.
20
John, T., and John, K., 1993, Top management compensation and capital structure, Journal of Finance 48,
949-974.
Jolls, C., 1998, Stock repurchases and incentive compensation, NBER Working Paper 6467, National
Bureau of Economic Research.
Kahle K.M., and Walkling R.A., 1996, The Journal of Financial and Quantitative Analysis 31, 309-335.
Karpoff, J., and Lee, D., 1991, Insider trading before new issue announcements, Financial Management
20, 18–26.
Lie, E., and McConnell, J., 1998, Earnings signals in fixed-price and Dutch auction tender offers, Journal
of Financial Economics 49, 161-186.
Meulbroek, L. K., 2000, Does risk matter? Corporate insider transactions in Internet-based firms,
Working paper, Harvard Business School.
Mitchell, J., and Dharmawan, G., 2007, Incentives for on-market buy-backs: Evidence from a transparent
buy-back regime, Journal of Corporate Finance 13, 146-169.
Niehaus, G., and Roth, G., 1999, Insider trading, equity issues, and CEO turnover in firms subject to
securities class action, Financial Management 28, 52-72.
Seyhun, H. N., 1986, Insiders’ profits, costs of trading, and market efficiency. Journal of Financial
Economics, 16, 189-212.
Stephens, C., and Weisbach, M., 1998, Actual share reacquisition in open-market repurchase programs,
Journal of Finance 53, 313-333.
Yermack, D., 1995, Do corporations award CEO stock options effectively? Journal of Financial
Economics 39, 237-269.
21
Table I
Summary characteristics of U.S. stock repurchases
This table provides summary statistics for stock repurchases by publicly traded U.S. firms between January 1, 1996 and December 31, 2007. Panel A provides summary statistics for all stock repurchase announcements. Panel B reproduces the summary statistics presented in A by year. Panel C provides summary statistics for our sample of 1,006 stock repurchases for which insider trading took place within thirteen months prior to or after the announcement. This panel also excludes any repurchase announcements with missing data. Stock repurchase announcements is the number of all unique repurchase announcements. Stock repurchase programs completed is the percentage of stock repurchases that are completed within each repurchase category. The size of repurchase announcement is calculated as the average of the number of shares announced to be repurchased divided by the total number of shares outstanding. The book to market ratio, net income per share, and market capitalization are computed at the firm's fiscal year end prior to the stock repurchase announcement. t value represents the test-statistic of a Satterthwaite t- test of the null hypothesis that the means of two populations are equal. Median Z reports the Mood's median two-sample test statistic for the null hypothesis that the medians are identical. *, **, and *** indicate significance at the 10%, 5%, and 1% level, respectively. Panel A: Number of stock repurchase announcements, stock repurchase size and completion rate
2007 51 434 11.20% 7.61% 68.63% 27.42% Panel C: Stock repurchase announcements with insider trading within thirteen months prior to or following the
announcement
Fixed Price Open-
Market t value Fixed Price
Open-Market
Median Z
Stock repurchase announcements
76 930 N/A 76 930 N/A
Stock repurchase programs completed
88.61% 39.67% -12.47*** N/A N/A N/A
Size of repurchase announcement
18.95% 6.76% -3.80*** 13.33% 5.32% 8.30***
Book to market ratio
0.53 0.45 -2.42*** 0.51 0.42 1.75*
Net income on assets
0.05 0.06 0.88 0.04 0.05 -2.14**
Market capitalization
$ 6,840 m $ 9,742 m 0.88 $ 623 m $ 1,236 m -1.75*
Leverage 2.93 6.07 1.99** 1.95 2.33 -3.34***
Cash on assets 0.1716 0.1548 -0.75 0.10 0.08 1.67*
23
Table 2 Abnormal return statistics for multiple event windows
This table reports the abnormal returns for multiple event windows surrounding the stock repurchase announcement. The mean cumulative abnormal returns are calculated using equally weighted market adjusted returns with an estimation period of 365 trading days ending 365 days before the stock repurchase announcement. A Patell Z test is performed to test the hypothesis that the mean cumulative abnormal return is statistically different from 0. In addition, we perform a Generalized Sign Z test to test for the significance of the difference between positive and negative returns during the even window. *, **, and *** indicate significance at the 10%, 5%, and 1% level, respectively.
Tender Offer Repurchases n=76
Event Window
Mean Cumulative Abnormal Return Patell Z Positive/Negative Generalized Sign Z
(-60,-1) 1.71% 0.881 45:32 2.041*
(-30,-1) 0.78% 0.631 44:33 1.812*
(-10,-1) 0.46% 0.755 40:37 0.899
(-5,-1) 0.57% 1.108 44:33 1.812*
(-2,-1) 0.47% 1.574$ 37:40 0.214
(-1,0) 4.61% 14.772*** 59:18 5.238***
(-1,+1) 6.42% 17.148*** 69:8 7.522***
(0,+1) 6.26% 20.386*** 72:5 8.207***
(0,+2) 6.01% 15.907*** 69:8 7.522***
(0,+5) 6.05% 11.269*** 64:13 6.380***
(0,+30) 5.28% 4.152*** 58:19 5.010***
(0,+60) 5.03% 2.210* 45:32 2.041*
Open Market Repurchases n=930
Event Window
Mean Cumulative Abnormal Return Patell Z Positive/Negative Generalized Sign Z
(-60,-1) -5.01% -9.404*** 338:605 -7.353***
(-30,-1) -3.03% -7.691*** 366:577 -5.528***
(-10,-1) -1.11% -4.844*** 417:526 -2.203*
(-5,-1) -0.31% -1.601$ 461:482 0.666
(-2,-1) -0.01% 0.614 477:466 1.709*
(-1,0) 0.52% 6.091*** 535:408 5.490***
(-1,+1) 1.13% 10.880*** 584:359 8.684***
(0,+1) 1.12% 13.025*** 602:341 9.858***
(0,+2) 1.14% 11.069*** 589:354 9.010***
(0,+5) 1.21% 8.727*** 585:358 8.750***
(0,+30) 1.29% 3.813*** 522:421 4.642***
(0,+60) 1.47% 2.901** 513:430 4.056***
24
Table 3 Variable definitions
This table provides an overview of the variables used in our logistic regression, the effect that the variable aims to capture, and the definition of the variable.
Effect Variable Definition
Signaling Hypothesis
Long-term stock returns Four year buy-and-hold abnormal returns (BHAR) following the announcement
Long-term earnings Average improvement in net income as a percentage of total assets for the four fiscal year ends following the repurchase announcement
Management Incentives
Net sales (dollars) Net dollar amount sold by insiders in the months surrounding the stock repurchase announcement
Net sales (units) Net units sold by insiders in the months surrounding the stock repurchase announcement
Largest sales Dummy variable, equal to one if insider sales for the firm are among the largest among our sample firms (top decile)
Control Variables Cash on assets Cash and short-term investments as a percentage of total assets of the firm at the fiscal year end prior to the stock repurchase announcement
Leverage Total debt to shareholder's equity at the fiscal year end prior to the stock repurchase announcement
Book to market ratio Book to market ratio of the firm at the fiscal year end prior to the stock repurchase announcement
Size of firm Log of the market capitalization of the firm at the fiscal year end prior to the stock repurchase announcement
Completed Dummy variable, equal to one if the stock repurchase is completed partially or with the full number of shares announced
Size of repurchase Percentage of total shares outstanding announced to be repurchased
25
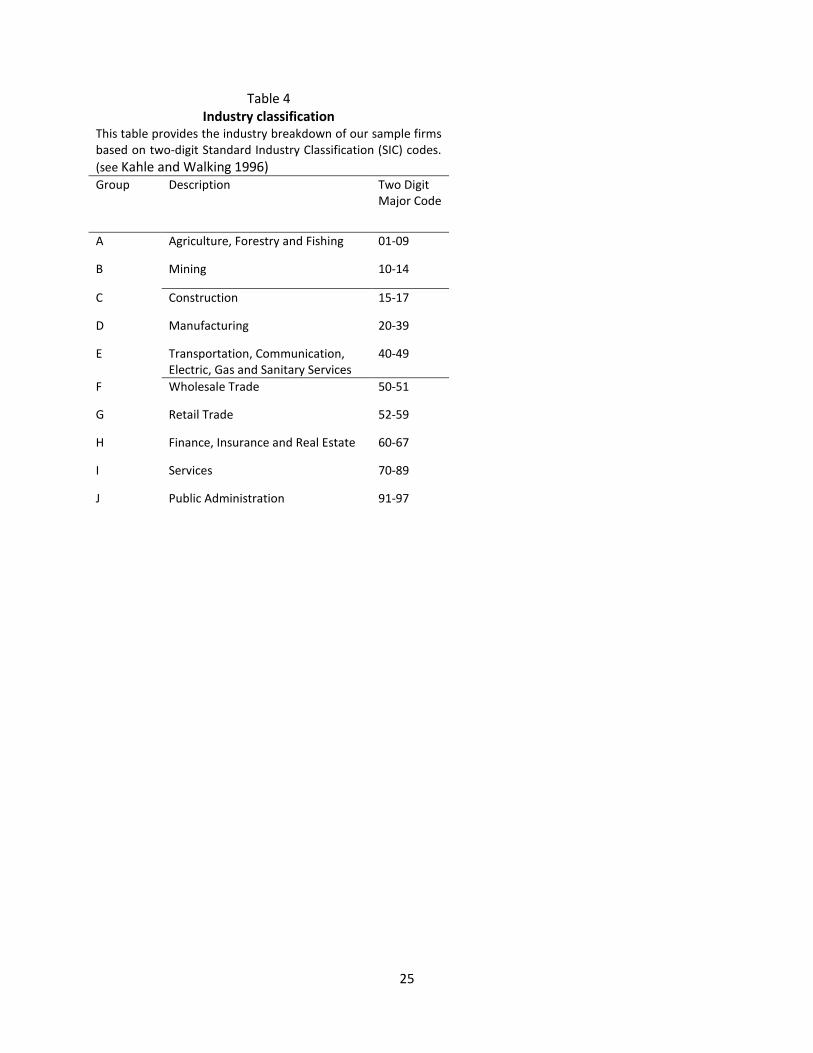
Table 4 Industry classification
This table provides the industry breakdown of our sample firms based on two-digit Standard Industry Classification (SIC) codes.
(see Kahle and Walking 1996) Group Description Two Digit
Major Code
A Agriculture, Forestry and Fishing 01-09
B Mining 10-14
C Construction 15-17
D Manufacturing 20-39
E Transportation, Communication, Electric, Gas and Sanitary Services
40-49
F Wholesale Trade 50-51
G Retail Trade 52-59
H Finance, Insurance and Real Estate 60-67
I Services 70-89
J Public Administration 91-97
26
Table 5
Logistic regression of tender offer repurchase likelihood (390 days insider trading window)
This table presents the results of six logistic regressions that explain the likelihood of a tender offer repurchase over an open market repurchase announcement. The dependent variable is a binomial variable that equals one if the firm announced a tender offer repurchase and zero if the firm announced an open market repurchase. Net sales ($ - Prior) is the net amount of insider sales as a percentage of the market capitalization of the firm in the 390 days prior to the announcement. Net sales ($ - Following) is the net amount of insider trading as a percentage of the market capitalization of the firm in the 390 days following the announcement. Net sales (Units - Prior) is the net number of units sold by insiders as a percentage of the total number of common shares outstanding of the firm in the 390 days prior to the announcement. Net sales (Units - Following) is the net number of units sold by insider as a percentage of the total number of common shares outstanding of the firm in the 390 days following the announcement. Largest sales is a dummy variable equal to one if insider unit sales for the firm following the repurchase announcement are among the largest among the sample firms (top decile). The four year abnormal return is calculated as the four year BHAR using the Fama-French three factor model. Change in net income is calculated as the average change in income as a percentage of total assets for the four fiscal year ends following the announcement. Cash and investments, book to market ratios and the size of the firm are computed at the fiscal year end prior to the stock repurchase announcement. The size of repurchase measures the proportion of shares to be repurchased relative to total shares outstanding. Completed is a dummy variable that equals to one if the stock repurchase is completed partially or with the full number of shares announced. P-values are listed in parentheses below the regression coefficients. * indicates significance at the 10% level, ** indicates significance at the 5% level, and *** indicates significance at the 1% level.
Model 1 Model 2
Model 3
Model 4 Model 5
Intercept -2.4925***
-26.4812
-26.1750
-26.4735
-25.9511
(<.0001)
(0.9360)
(0.9374)
0.9356
0.9394 Net sales ($ - Prior) 0.00952
0.0198
0.0185 0.0212
(0.7014)
(0.5084)
(0.5407) (0.3439)
Net sales ($ - Following) 0.0440
0.0608
0.0638
(0.3072)
(0.1851)
(0.2647)
Net sales (Units - Prior)
0.0210
(0.3467)
Net sales (Units - Following)
0.0492
(0.4386)
Largest sales
0.2770
(0.5581)
Four year abnormal return 0.0181 0.0434 0.0435
0.0434 (0.3950)
(0.1851)
(0.1856)
(0.1846)
27
Change in net income
-0.0633
(0.3053)
Cash on assets -0.9149 -0.8715 -1.0486 -0.8692
(0.4165) (0.4421) (0.3394) (0.4372)
Leverage
-0.0531
-0.0559
-0.0559
-0.0584
(0.2438)
(0.2186)
(0.2426)
(0.1980)
Book to market decile
0.1258*
0.1243*
0.1253*
0.1214*
(0.0575)
(0.0589)
(0.0572)
(0.0635)
Size of firm
-0.1808*
-0.1837*
-0.1497
-0.1844*
(0.0664)
(0.0617)
(0.1285)
(0.0599)
Completed
2.9784***
2.9674***
2.9667***
2.9690
(<.0001)
(<.0001)
(<.0001)
(<.0001) Size of repurchase
0.1491***
0.1493***
0.1482***
0.1504
(<.0001)
(<.0001)
(<.0001)
(<.0001) Observations 1006
1006
1006
1006
1006
Likelihood Ratio Chi-Square 3.3041 195.0534***
194.9778***
193.0272***
194.7222*** (0.3471)
(<.0001)
(<.0001)
(<.0001)
(<.0001)
Score Chi-Square 1.4603
200.5253***
200.6900***
201.3391***
200.1492*** (0.6915)
(<.0001)
(<.0001)
(<.0001)
(<.0001)
Wald Chi-Square 1.9256
98.7789***
98.8164***
99.5521***
98.7933*** (0.5880)
(<.0001)
(<.0001)
(<.0001)
(<.0001)
Max-rescaled R-Square 0.0079
0.4283
0.4281
0.4242
0.4276
R-Square 0.0033
0.1764
0.1763
0.1747
0.1761
28
Table 6
Logistic regression of tender offer repurchase likelihood (180 days insider trading window)
This table presents the results of six logistic regressions that explain the likelihood of a tender offer repurchase over an open market repurchase announcement. The dependent variable is a binomial variable that equals one if the firm announced a tender offer repurchase and zero if the firm announced an open market repurchase. Net sales ($ - Prior) is the net amount of insider sales as a percentage of the market capitalization of the firm in the 180 days prior to the announcement. Net sales ($ - Following) is the net amount of net insider sales as a percentage of the market capitalization of the firm in the 180 days following the announcement. Net sales (Units - Prior) is the net number of units sold by insiders as a percentage of the total number of common shares outstanding of the firm in the 180 days prior to the announcement. Net sales (Units - Following) is the net number of units sold by insider as a percentage of the total number of common shares outstanding of the firm in the 180 days following the announcement. Largest sales is a dummy variable equal to one if insider unit sales for the firm following the repurchase announcement are among the largest among the sample firms (top decile). The four year abnormal return is calculated as the four year BHAR using the Fama-French three factor model. Change in net income is calculated as the average change in income as a percentage of total assets for the four fiscal year ends following the announcement. Cash and investments, book to market ratios and the size of the firm are computed at the fiscal year end prior to the stock repurchase announcement. The size of repurchase measures the proportion of shares to be repurchased relative to total shares outstanding. Completed is a dummy variable that equals to one if the stock repurchase is completed partially or with the full number of shares announced. P-values are listed in parentheses below the regression coefficients. * indicates significance at the 10% level, ** indicates significance at the 5% level, and *** indicates significance at the 1% level.
Model 1 Model 2
Model 3
Model 4 Model 5
Intercept -2.5667
-26.1961
-26.2293
-26.1975
-26.5350
(0.9405)
(0.9399)
(0.9403)
(0.9363) Net sales ($ - Prior) -0.2593**
-0.0650
-0.0754
0.0259
(0.0120)
(0.5185)
(0.4529)
(0.5143) Net sales ($ - Following) 0.2255***
0.1266**
0.1297**
(<.0001)
(0.0198)
(0.0157)
Net sales (Units - Prior)
-0.0193
(0.7940)
Net sales (Units - Following)
0.1525**
(0.0164)
Largest sales
0.8992
(0.0268)**
Four year abnormal return 0.0221
0.0447
0.0439
0.0458 (0.3523)
(0.1624)
(0.1682)
(0.1690)
29
Change in net income
-0.0686
(0.2745)
Cash on assets
-0.5390
-0.4712
-0.6869
-0.8490
(0.6302)
(0.6762
(0.5291)
(0.4470)
Leverage
-0.0565
-0.0565
-0.0613
-0.0518
(0.2385)
(0.2376)
(0.2193)
(0.2575)
Book to market decile
0.1276*
0.1364**
0.1278*
0.1340
(0.0593)
(0.0435)
(0.0558)
(0.0455)**
Size of firm
-0.1601
-0.1559
-0.1267
-0.1551
(0.1064)
(0.1159)
(0.2011)
(0.1130)
Completed
2.9324***
2.9102***
2.9210***
2.9941***
(<.0001)
(<.0001)
(<.0001)
(<.0001)
Size of repurchase
0.1471***
0.1474***
0.1457***
0.1504***
(<.0001)
(<.0001)
(<.0001)
(<.0001)
Observations 1006
1006
1006
1006
1006
Likelihood Ratio Chi-Square 24.6753***
202.2553***
202.6853***
200.3713***
198.9550*** (<.0001)
(<.0001)
(<.0001)
(<.0001)
(<.0001)
Score Chi-Square 32.9108***
218.1972***
220.5313***
219.1942***
206.0226*** (<.0001)
(<.0001)
(<.0001)
(<.0001)
(<.0001)
Wald Chi-Square 23.4333***
103.6045***
103.9343***
104.3592***
100.1259*** (0.0018)
(<.0001)
(<.0001)
(<.0001)
(<.0001)
Max-rescaled R-Square 0.0584
0.4425
0.4434
0.4388
0.4360
R-Square 0.0242
0.1823
0.1826
0.1808
0.1796
30
Table 7
Logistic regression of tender offer repurchase likelihood (60 days insider trading window)
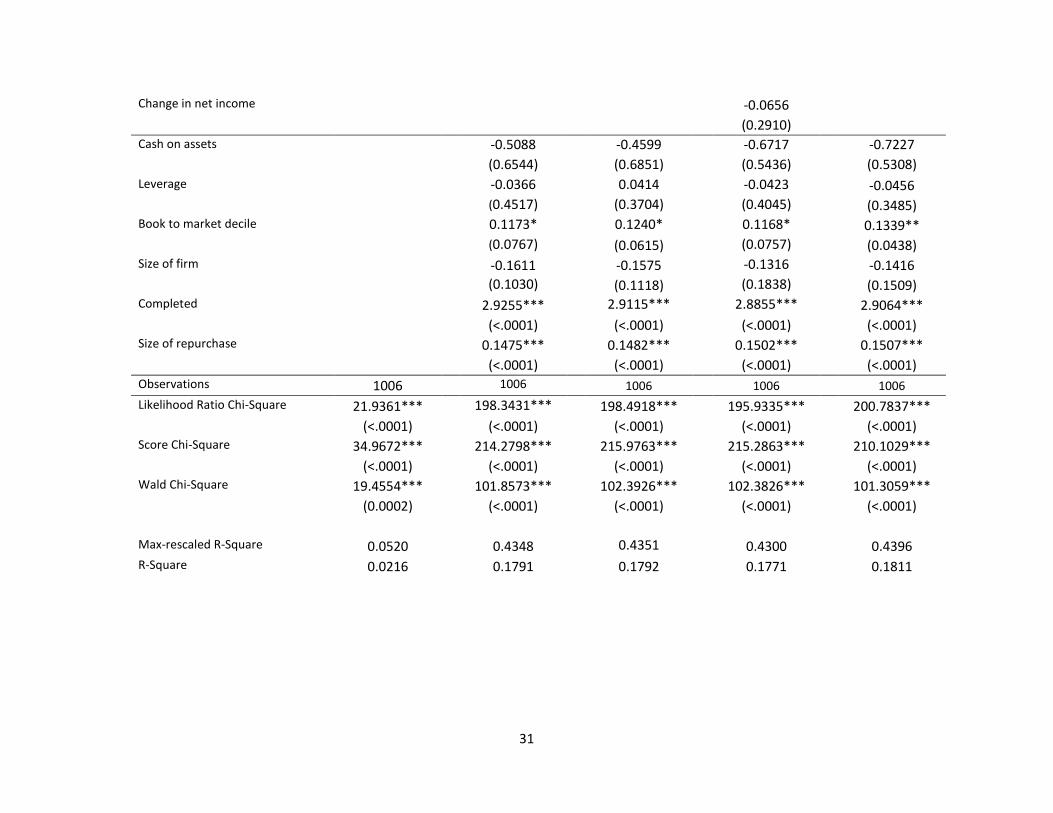
This table presents the results of six logistic regressions that explain the likelihood of a tender offer repurchase over an open market repurchase announcement. The dependent variable is a binomial variable that equals one if the firm announced a tender offer repurchase and zero if the firm announced an open market repurchase. Net sales ($ - Prior) is the net amount of insider sales as a percentage of the market capitalization of the firm in the 60 days prior to the announcement. Net sales ($ - Following) is the net amount of insider trading as a percentage of the market capitalization of the firm in the 60 days following the announcement. Net sales (Units - Prior) is the net number of units sold by insiders as a percentage of the total number of common shares outstanding of the firm in the 60 days prior to the announcement. Net sales (Units - Following) is the net number of units sold by insider as a percentage of the total number of common shares outstanding of the firm in the 60 days following the announcement. Largest sales is a dummy variable equal to one if insider unit sales for the firm following the repurchase announcement are among the largest among the sample firms (top decile). The four year abnormal return is calculated as the four year BHAR using the Fama-French three factor model. Change in net income is calculated as the average change in income as a percentage of total assets for the four fiscal year ends following the announcement. Cash and investments, book to market ratios and the size of the firm are computed at the fiscal year end prior to the stock repurchase announcement. The size of repurchase measures the proportion of shares to be repurchased relative to total shares outstanding. Completed is a dummy variable that equals to one if the stock repurchase is completed partially or with the full number of shares announced. P-values are listed in parentheses below the regression coefficients. * indicates significance at the 10% level, ** indicates significance at the 5% level, and *** indicates significance at the 1% level. Model 1 Model 2
This table presents the results of three logistic regressions that explain the likelihood of a tender offer repurchase over an open market repurchase announcement. The dependent variable is a binomial variable that equals one if the firm announced a tender offer repurchase and zero if the firm announced an open market repurchase. Net sales (period) is the net amount of insider sales as a percentage of the market capitalization of the firm in the days surrounding the announcement. The four year abnormal return is calculated as the four year BHAR using the Fama-French three factor model. Change in net income is calculated as the average change in income as a percentage of total assets for the four fiscal year ends following the announcement. Cash and investments, book to market ratio and the size of the firm are computed at the fiscal year end prior to the stock repurchase announcement. The size of repurchase measures the proportion of shares to be repurchased relative to total shares outstanding. Completed is a dummy variable that equals to one if the stock repurchase is completed partially or with the full number of shares announced. P-values are listed in parentheses below the regression coefficients. * indicates significance at the 10% level, ** indicates significance at the 5% level, and *** indicates significance at the 1% level.
This table presents the results of a series of logistic regressions that explain the likelihood of a tender offer repurchase over an open market repurchase announcement for two subgroups of stock repurchases based on the size of the repurchase program. The dependent variable is a dummy variable that equals one if the firm announced a tender offer repurchase and zero if the firm announced an open market repurchase. Net sales ($ - Prior) is the net amount of insider trading as a percentage of the market capitalization of the firm in the days prior to the announcement. Net sales ($ - Following) is the net amount of insider trading as a percentage of the market capitalization of the firm in the days following the announcement. Four year abnormal return is calculated as the four year BHAR using the Fama-French three factor model. Change in net income is calculated as the average change in income as a percentage of total assets for the four fiscal year ends following the announcement. Cash and investments, book to market ratio and the size of the firm are computed at the fiscal year end prior to the stock repurchase announcement. The size of repurchase measures the proportion of shares to be repurchased relative to total shares outstanding. Completed is a dummy variable that equals to one if the stock repurchase is completed partially or with the full number of shares announced. P-values are listed in parentheses below the regression coefficients. * indicates significance at the 10% level, ** indicates significance at the 5% level, and *** indicates significance at the 1% level.
Panel A: Stock repurchases with less than 10 percent of total shares outstanding to be repurchased
60 days
180 days
390 days
Estimate P-value
Estimate P-value
Estimate P-value
Intercept -19.6223 (0.9145)
-21.7358 (0.9435)
-20.3595 (0.9369)
Net sales ($ - Prior) -0.0978 (0.7815)
-0.0491 (0.7349)
0.0363 (0.2239)
Net sales ($ - Following) 0.2412** (0.0196)
0.2218** (0.0156)
0.0271 (0.8043)
Four year abnormal return 0.0543 (0.4185)
0.0467 (0.4496)
0.0450 (0.4720)
Cash on assets -1.2199 (0.5176)
(-0.9711) (0.6119)
-2.2163 (0.2403)
Leverage -0.0266 (0.6273)
(-0.0569) (0.3291)
-0.0644 (0.2124)
Book to market decile 0.0186 (0.8613)
(0.0657) (0.5527)
0.0287 (0.7877)
Size of firm -0.0987 (0.5133)
-0.0760 (0.6214)
-0.1522 (0.3059)
Completed 2.0758*** (0.0004)
2.3262*** (0.0008)
2.0851*** (0.0004)
Observations 787
787
787
Likelihood Ratio Chi-Square
48.8985*** (0.0013)
53.8930*** (0.0003)
34.0027*** (0.0055)
Max-rescaled R-Square 0.2596
0.2852
0.2335
R-Square 0.0602
0.0662
0.0542
35
Panel B: Stock repurchases with larger than 10 percent of total shares outstanding announced to be repurchased
60 days
180 days
390 days
Estimate P-value
Estimate P-value
Estimate P-value
Intercept -13.6458 (0.9523)
-11.0315 (0.9393)
-9.5482 (0.9487)
Net sales ($ - Prior) -1.0237 (0.4496)
-0.2368 (0.3569)
-1.1000* (0.0902)
Net sales ($ - Following) 0.3942 (0.1309)
0.1872 (0.1463)
0.00833 (0.8985)
Four year abnormal return
0.0326 (0.4177)
0.0290 (0.4438)
0.0333 (0.3706)
Cash on assets -0.5428 (0.7710)
-0.7013 (0.7129)
0.2515 (0.8975)
Leverage 0.00683 (0.9419)
0.0159 (0.8626)
-0.00180 (0.9842)
Book to market decile 0.0484 (0.6182)
0.0486 (0.6190)
0.0538 (0.5819)
Size of firm -0.3430** (0.0372)
-0.3608** (0.0258)
-0.3392** (0.0343)
Complete 3.1703*** (<.0001)
3.2388*** (<.0001)
3.0063*** (<.0001)
Observations 219
219
219
Likelihood Ratio Chi-Square
92.6105*** (<.0001)
91.4325*** (<.0001)
92.6499*** (<.0001)
Max-rescaled R-Square 0.5191
0.5138
0.5193
R-Square 0.3461
0.3426
0.3462
36
Table 10
Regression of insider sales
This table provides coefficient estimates for a series of ordinary least squares regressions in which we regress net insider sales during different trading windows on a series of explanatory variables. The explanatory variables include net insider sales in the period prior to the trading window, the cumulative abnormal return during a period of days -5 to +5 days around the announcement, a tender offer dummy variable that equals one if the repurchase method is fixed price or Dutch auction. The book to market ratio and the size of the firm are computed at the fiscal year end prior to the stock repurchase announcement. The size of the repurchase measures the proportion of shares to be repurchased relative to total shares outstanding. Completed is a dummy variable that equals to one if the stock repurchase is completed partially or with the full number of shares announced. R&D to sales is calculated as R&D expenses divided by sales for the fiscal year ending prior to the announcement. Standard deviation is calculated as the standard deviation of stock returns for the period from 310 to 186 days before the announcement date. Change in standard deviation is calculated as the difference between the standard deviation of stock returns for the period from 185 to 60 days before and the period from 310 to 186 days before the announcement date. P-values are listed in parentheses below the regression coefficients. * indicates significance at the 10% level, ** indicates significance at the 5% level, and *** indicates significance at the 1% level.
Model 1 Model 2
Model 3
Model 4 Model 5
Dependent Variable Window
(0, 60)
(61, 180)
(61, 180)
(181, 390)
(181, 390)
Intercept 0.61569
0.62656
0.49515
0.93167
1.03557
(0.3591)
(0.5629)
(0.6449)
(0.4927)
(0.4281) Net sales (-390, -1) 0.01193**
0.08461***
0.08206***
0.01027
-0.01418
(0.0366)
(<.0001)
(<.0001)
(0.3265)
(0.1748) Net sales (0, 60)
0.21343***
(<.0001)
Net sales (0, 180)
0.25099***
(<.0001) CAR (-5, 5) 0.60653**
-0.11746
-0.24691
-0.20967
-0.31689
(0.0604)
(0.8215)
(0.6332)
(0.7234)
(0.5791) Tender offer 0.60007***
0.80128***
0.67321***
0.23322
-0.11953
(<.0001)
(0.0011)
(0.0061)
(0.4030)
(0.6601) Completed 0.06552
-0.00276
-0.01674
-0.01585
-0.04311
(0.3999)
(0.9825)
(0.8931)
(0.9116)
(0.7545)
37
Size of repurchase 0.00433
-0.00264
-0.00357
0.00700
0.00681 (0.2455)
(0.6606)
(0.5503)
(0.3066)
(0.3035)
Size of firm -0.05141**
-0.03649
-0.02552
-0.09059**
-0.06904 (0.0428)
(0.3725)
(0.5302)
(0.0446)
(0.1120)
Book to market decile -0.01293
-0.05079*
-0.04803*
-0.06579**
-0.04980 (0.4506)
(0.0664)
(0.0801)
(0.0367)
(0.1007)
R&D to sales -0.07622
-0.15683
-0.14056
-0.19042
-0.13733 (0.7318)
(0.6621)
(0.6929)
(0.6425)
(0.7279)
Standard deviation 0.29756
-5.15106
-5.21456
-2.04178
-0.99790 (0.9586)
(0.5774)
(0.5695)
(0.4868)
(0.9127)
Change in standard deviation
-1.61625
3.95156
4.29651
5.62321
4.52873
(0.8120)
(0.7186)
(0.6928)
(0.5392)
(0.6073)
Observations 1006
1006
1006
1006
1006
Adjusted R-Squared 0.0700
0.1061
0.1218
0.0346
0.1070 F-Test (p-value) <.0001
<.0001
<.0001
0.0705
<.0001
38
Table 11
Tests of the relationship between net insiders sales and stock repurchase method
This table provides the results for a test of the relationship between insider trades and method of repurchase. Means represent the net amount of insider sales as a percentage of the market capitalization of
the firm in the 60 days prior to or following the announcement. The control group consists of firms with an open market repurchase. Firms are linked on the basis of industry and firm size. Two-digit SIC codes are used to match by industry. The log market capitalization of each firm is calculated at the first fiscal year end prior to the repurchase announcement and is used as a proxy for size. Firms from the tender offer sample are removed from the analysis if we are unable to find a matching firm in terms of two-digit SIC code or decile of market capitalization in the open market repurchase sample group. When multiple control firms exist within the same two-digit SIC code and size decile, we select the control firm with the smallest size difference. Panel B and C add more stringent restrictions based on the difference between the tender offer and the corresponding open market repurchase announcement. * indicates significance at the 10% level, ** indicates significance at the 5% level, and *** indicates significance at the 1% level.
Tender Offer Sample
(51 firms)
Open Market Sample -Control
(51 firms)
p-Value
Panel A: Stock repurchase announcements =<365 days apart
Mean - (Net Sales - $ - Following) 0.59 0.13
0.0870*
Std Dev (1.68)
(0.91)
Mean - (Net Sales - $ - Prior) 0.04
1.91
0.1759
Std Dev (0.10)
(9.75)
Panel B: Stock repurchase announcements =<90 days apart
Tender Offer Sample (34 firms)
Open Market Sample -Control
(34 firms)
p-Value
Mean - (Net Sales - $ - Following) 0.4958
0.0548
0.0741*
Std Dev (1.3721)
(0.2649)
Mean - (Net Sales - $ - Prior) 0.0341
0.0326
0.9726
Std Dev (0.0924)
(0.2303)
Panel C: Stock repurchase announcements =<30 days apart
Tender Offer Sample (19 firms)
Open Market Sample -Control
(19 firms)
p-Value
Mean - (Net Sales - $ - Following) 0.3464
0.0758
0.2464 Std Dev (0.9735)
(0.1570)
Mean - (Net Sales - $ - Prior) 0.0136
0.00548
0.6680
Std Dev (0.0564)
(0.0598)
39
Table 12
Logistic regression of tender offer repurchase likelihood (Abnormal insider trading - 60 days window)
This table presents the results of three logistic regressions that explain the likelihood of a tender offer repurchase over an open market repurchase announcement using abnormal insider trading volumes. The dependent variable is a binomial variable that equals one if the firm announced a tender offer repurchase and zero if the firm announced an open market repurchase. Net sales ($ - Prior) is the net amount of abnormal insider sales as a percentage of the market capitalization of the firm in the 60 days prior to the announcement. Net sales ($ - Following) is the net amount of abnormal insider trading as a percentage of the market capitalization of the firm in the 60 days following the announcement. The four year abnormal return is calculated as the four year BHAR using the Fama-French three factor model. Change in net income is calculated as the average change in income as a percentage of total assets for the four fiscal year ends following the announcement. Cash and investments, book to market ratios and the size of the firm are computed at the fiscal year end prior to the stock repurchase announcement. The size of repurchase measures the proportion of shares to be repurchased relative to total shares outstanding. Completed is a dummy variable that equals to one if the stock repurchase is completed partially or with the full number of shares announced. P-values are in parenthesis under the regression estimate coefficients. * indicates significance at the 10% level, ** indicates significance at the 5% level, and *** indicates significance at the 1% level.
This table presents the results of three logistic regressions that explain the likelihood of a tender offer repurchase over an open market repurchase announcement using abnormal insider trading volumes. The dependent variable is a binomial variable that equals one if the firm announced a tender offer repurchase and zero if the firm announced an open market repurchase. sales (period) is the net amount of abnormal insider sales as a percentage of the market capitalization of the firm in the days surrounding the announcement. The four year abnormal return is calculated as the four year BHAR using the Fama-French three factor model. Change in net income is calculated as the average change in income as a percentage of total assets for the four fiscal year ends following the announcement. Cash and investments, book to market ratios and the size of the firm are computed at the fiscal year end prior to the stock repurchase announcement. The size of repurchase measures the proportion of shares to be repurchased relative to total shares outstanding. Completed is a dummy variable that equals to one if the stock repurchase is completed partially or with the full number of shares announced. P-values are in parenthesis under the regression estimate coefficients. * indicates significance at the 10% level, ** indicates significance at the 5% level, and *** indicates significance at the 1% level.
Model 1 Model 2
Model 3
Intercept -2.5167*** -21.8765
-21.8292
(<.0001)
(0.9274)
(0.9279) Net sales (-390, -181) -0.0415
-0.0695
-0.0630
(0.6409)
(0.4753)
(0.5144) Net sales (-180, -61) -0.1774
-0.0770
-0.1044
(0.2863)
(0.6012)
(0.4969) Net sales (-60, -1) -0.1681
-0.2863
-0.3242
(0.6404)
(0.4810)
(0.4081)
Net sales (0, 60) 0.2691***
0.1511*
0.1384*
(<.0001)
(0.0756)
(0.0907)
Net sales (61, 180) 0.0957
0.0885
0.0931*
(0.1234)
(0.1033)
(0.0931)
Net sales (181, 390) -0.0130
-0.0136
0.0589
(0.8108)
0.8196
(0.3991)
Four year abnormal return 0.0245 0.0454
(0.3324)
(0.1657)
Change in net income
-0.0720
(0.2582) Cash on assets -0.6081
-0.7821
(0.5929)
(0.4807)
Leverage -0.0591
-0.0665
(0.2407)
(0.1993)
Book to market decile 0.1168*
0.1164*
(0.0986)
(0.0938
Size of firm
-0.1565
-0.1261
(0.1162)
(0.2082)
42
Completed
2.9255***
2.9256***
(<.0001)
(<.0001) Size of repurchase
0.1466***
0.1447***
(<.0001)
(<.0001) Observations 981
981
981
Likelihood Ratio Chi-Square 25.4738***
202.4158***
200.7747*** (0.0006)
(<.0001)
(<.0001)
Score Chi-Square 38.0230***
217.6848***
218.5601*** (<.0001)
(<.0001)
(<.0001)
Wald Chi-Square 21.4019***
103.4193***
104.2271*** (0.0032)
(<.0001)
(<.0001)
Max-rescaled R-Square 0.0610
0.4470
0.4437 R-Square 0.0256
0.1866
0.1852
43
Figure 1: Insider trading activity around stock repurchase program announcements
Figure 1.a isolates the insider trading data for firms that perform a stock repurchase and plots the net insider sales for the eight weeks prior and following the stock repurchase announcement date for both types of repurchase methods. The net dollar amount sold by insiders is calculated as the sum of insider sales for the specified period. The announcement date is included in week one.
-500
0
500
1000
1500
2000
2500
-8 -7 -6 -5 -4 -3 -2 -1 1 2 3 4 5 6 7 8
Ne
t d
olla
r am
ou
nt
sold
by
insi
de
rs (
in m
illio
ns)
Weeks relative to stock repurcahse annoucement
Open Market
Tender Offer
44
Figure 1.b isolates the insider trading data for firms that perform a stock repurchase and plots the net insider sales for the eight weeks prior and following the stock repurchase announcement date for both types of repurchase methods. The net number of units sold by insiders is calculated as the sum of insider sales for the specified period. The announcement date is included in week one.
-20
-10
0
10
20
30
40
50
60
70
-8 -7 -6 -5 -4 -3 -2 -1 1 2 3 4 5 6 7 8Ne
t n
um
be
r o
f sh
are
s so
ld b
y in
sid
ers
(in
mill
ion
s)
Weeks relative to stock repurcahse annoucement
Open Market
Tender Offer
45
Figure 2: Cumulative insider trading from day 0 to day 61
Figure 2 plots the cumulative net insider sales following a stock repurchase announcement dates.


![Rationing Through Choice: A New Approach to Cost ...ilj.law.indiana.edu/articles/72/72_4_Rai.pdf1997] HEALTH CARE CHOICE 1017 "gatekeeper" physicians financial incentives to reduce](https://static.documents.pub/doc/80x56/5f3f97f24bdfdc27c046cdbd/rationing-through-choice-a-new-approach-to-cost-iljlaw-1997-health-care-choice.jpg)


