+ All Categories
Home > Documents > The Role of Metabolic Dysfunction in Heart Failure 2013 Cardiac Physiome Workshop, Bar Harbor, ME...

The Role of Metabolic Dysfunction in Heart Failure 2013 Cardiac Physiome Workshop, Bar Harbor, ME...

Date post: 14-Dec-2015
Category:
Upload: angel-hambelton
View: 213 times
Download: 0 times
Share this document with a friend
Popular Tags:
27
The Role of Metabolic Dysfunction in Heart Failure 2013 Cardiac Physiome Workshop, Bar Harbor, ME October 17, 2013 Scott M. Bugenhagen MD/PhD student Department of Physiology Medical College of Wisconsin
Transcript

The Role of Metabolic Dysfunction in Heart Failure

2013 Cardiac Physiome Workshop, Bar Harbor, ME October 17, 2013

Scott M. BugenhagenMD/PhD studentDepartment of PhysiologyMedical College of Wisconsin

What is heart failure?

“heart failure: inability of the heart to maintain cardiac output sufficient to meet the body's needs” -Dorland’s Medical Dictionary, 2007

Dx involves various algorithms (Framingham, European Society of Cardiology, others) based on criteria from medical history, physical examination, laboratory tests, response to therapy, etc.

image from wikipedia.org

___ __ ___ ____ __ _________ _______ __ _____ _______ What causes heart failure?

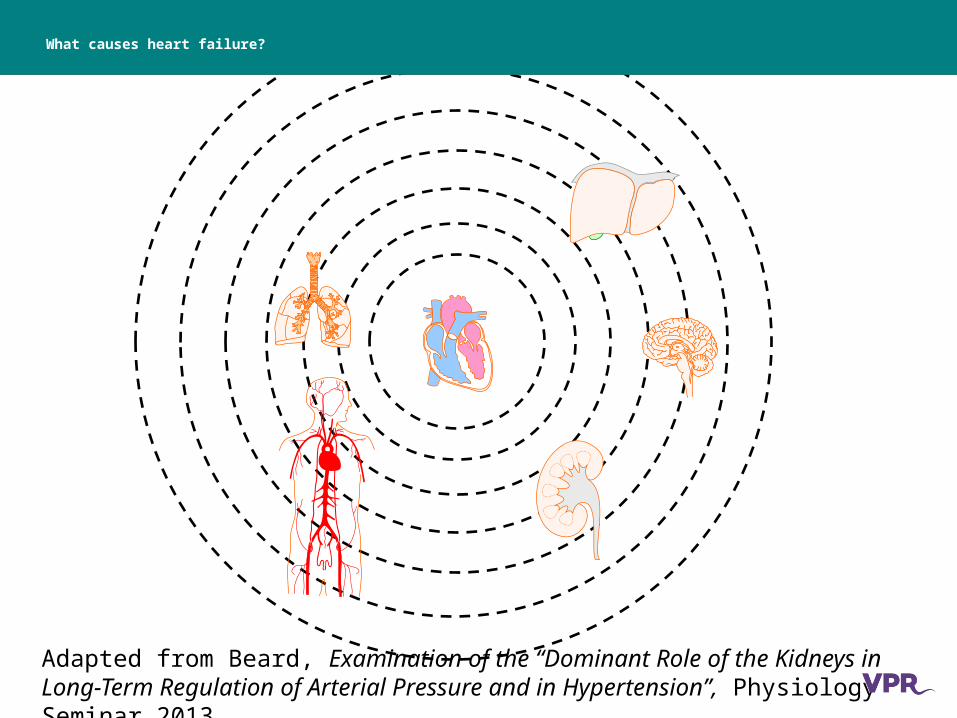
Adapted from Beard, Examination of the “Dominant Role of the Kidneys in Long-Term Regulation of Arterial Pressure and in Hypertension”, Physiology Seminar 2013

What causes heart failure?

Adapted from McKinsey, T.A. and Olson, E.N. (2005) J Clin Invest 115, 538-46.

???

A Primer on Cardiac Energy Metabolism

Physiological control:

In vitro (purified mitochondria) and in vivo data are consistent with the hypothesis that cardiac energy metabolism is primarily regulated through feedback of substrates for oxidative phosphorylation.

EDP < 15 mmHg

EDP > 15 mmHg

In heart failure:

Changes in metabolite pools lead to diminished ATP hydrolysis potential.

Wu et al. (2009) PNAS USA 106:7143-7148.

A Primer on Cardiac Energy Metabolism

MitochondriaSacroplasmicreticulum

Cytoplasm Myofilaments

PXBAM1

XBPreRAM2

NXB

MgATP

MgADPPi

ATP ADP Pi+

Ca2+ Na+

Ca2+ Na+

K+

Na+

Ca2+

Ca2+

Ca2+

Ca2+

Ca2+

Na+ K+

ATP

Ca2+

ATP

K+

Na+

Ca2+

ATP

Ca2+

Subspace

GLUTGlc

FATPFFA

Glycolysis

FACS

Pyr

FACoA

H+

Na+ Cl-

HCO3- OH-

Cl-

HCO3-Na+

MAS

NAD

NADH

oMgATP MgATP

2+

SERCA 2+

uptake MgATP SERCA

uptake

MgADP Pi Hln ,

MgATP

Ca2 ln ,

Ca

0 if 0, else

0

sr

i

G G RT

G RT

J G G

J

Can energy failure cause heart failure?

Goal: To develop a mathematical model linking cardiac energy metabolism with cell- and organ-level cardiac mechanics and whole-body cardiovascular dynamics in order to test the hypothesis that energy failure alone provides a sufficient explanation for the mechanical changes observed in heart failure.

___ __ ___ ____ __ _________ _______ __ _____ _______ The Grand Vision

image from wikipedia.org

Baroreflex and autonomic control of heart rate

Cardiovascular hemodynamics

from Lumens J, Arts T, et al. Ann Biomed Eng. 2009 Nov;37(11):2234-55

from Smith BW, JG Chase , et al. Medical Engineering & Physics. 2004 Mar;26(2):131-39

Cardiovascular hemodynamics

0 20

50

100

150

200

t (seconds)

Vlv

(m

l)

0 20

50

100

150

t (seconds)

Vrv

(m

l)

0 2900

950

1000

1050

t (seconds)

Vao

(m

l)0 2

3450

3500

3550

3600

t (seconds)

Vvc

(m

l)

0 2220

240

260

280

300

t (seconds)

Vpa

(m

l)

0 23250

3300

3350

3400

t (seconds)

Vpv

(m

l)

0 20

50

100

150

200

t (seconds)

Plv

(m

mH

g)

0 20

20

40

60

t (seconds)

Prv

(m

mH

g)

0 280

100

120

140

160

t (seconds)

Pao

(m

mH

g)

0 27

7.5

8

8.5

t (seconds)

Pvc

(m

mH

g)

0 220

30

40

50

t (seconds)

Ppa

(m

mH

g)

0 218

18.5

19

19.5

t (seconds)

Ppv

(m

mH

g)

0 20

200

400

600

t (seconds)

Qlv

i (m

l/s)

0 20

200

400

600

800

t (seconds)

Qlv

o (m

l/s)

0 250

100

150

200

t (seconds)

Qsy

s (m

l/s)

0 20

200

400

600

800

t (seconds)

Qrv

i (m

l/s)

0 20

200

400

600

800

t (seconds)

Qrv

o (m

l/s)

0 20

100

200

300

t (seconds)

Qpu

l (m

l/s)

-0.2 0 0.20

20

40

60

80

epsflw (unitless)

sigm

aflw

(kP

a)

-0.2 0 0.20

20

40

60

epsfsw (unitless)

sigm

afsw

(kP

a)

-0.5 0 0.50

20

40

60

80

epsfrw (unitless)

sigm

afrw

(kP

a)

0 2-0.35

-0.3

-0.25

-0.2

t (seconds)

Cm

lw (

cm-1

)

0 20.2

0.25

0.3

0.35

0.4

t (seconds)

Cm

sw (

cm-1

)

0 20.2

0.25

0.3

0.35

0.4

t (seconds)

Cm

rw (

cm-1

)

Renal blood-volume control

Renal blood-volume control

___ __ ___ ____ __ _________ _______ __ _____ _______ The Grand Vision

image from wikipedia.org

___ __ ___ ____ __ _________ _______ __ _____ _______ Cardiac energy metabolism

From Wu et al. (2007) JBC 282:24525-24537

___ __ ___ ____ __ _________ _______ __ _____ _______ Cardiac energy metabolism

ADP

ATP

AMP

PI

MAL

PYR

AKG

SUC

ASP

GLU

CIT

PYR-

H+

GLU-

H+

MAL2-

HCIT2-

AKG2-

MAL2-

PI2-

MAL2-

ASP-

HGLU0

ACCOA CIT

COAS

ICIT

AKG

SCOA

SUC

FUM

MAL

OAA

CO2 NADH

NAD

NADH

NAD

CO2 QH2

Q

NADH

NAD

2 3

4

5

6 7

8

9

COAS

GDP + PI

GTP

11

COAS ASP

GLU

1

PYR

COAS

NADH

NAD

CO2

10 ATP

ADP

SUC2-

MAL2-

K+

H+

H+

K+

H+

H+

COQ QH2

COQ

NADH NAD+

C(ox)3+ C(red)2+

H+ H+

C(ox)3+

H+

ADP3-

+ PI2-ATP4-

ATP4- ADP3-

ADP3-

AN

T

Fo F

1

CIV

CIII

CI

H+

PIH

t

H+ H2PO4-

COQ QH2

COQ

NADH NAD+

C(ox)3+ C(red)2+

H+ H+

C(ox)3+

H+

ADP3-

+ PI2-ATP4-

ATP4- ADP3-

ADP3-

AN

T

Fo F

1

CIV

CIII

CI

H+

PIH

t

H+ H2PO4-

2 4 6 8 10 120 2 4 6 8 10 120 2 4 6 8 10 120

2

4

6

8

10

12

0

0.02

0.04

0.06

0.08

0.10

0.12

0

2

4

6

8

10

12

0

___ __ ___ ____ __ _________ _______ __ _____ _______ Cardiac cell mechanics

Mitochondria

Sacroplasmicreticulum

Cytoplasm Myofilaments

PXBAM1

XBPreRAM2

NXB

MgATP

MgADPPi

ATP ADP Pi+

Ca2+ Na+

Ca2+ Na+

K+

Na+

Ca2+

Ca2+

Ca2+

Ca2+

Na+ K+

ATP

Ca2+

ATP

K+

Na+

Ca2+

ATP

Ca2+

Diad space

GLUTGlc

FATPFFA

Glycolysis

FACS

Pyr

FACoA

H+

Na+ Cl-

HCO3- OH-

Cl-

HCO3-Na+

MAS

NAD

NADH

Sympathetic nerve

Ca2+

Components

1. Electrophysiology

2. Calcium handling

3. Signaling (CaMKII, β-AR, others)

4. Cross-bridge Norepinephrine

CaMKII

___ __ ___ ____ __ _________ _______ __ _____ _______ Cardiac cell mechanics

Cytoplasm

slow buffer

Na+

Ca2+

Ca2+

Ca2+

Ca2+

ATP

Ca2+

Ca2+

ATP

Ca2+

Ca2+

fast buffer

Sacroplasmicreticulum

Diad space

Ca2+

CaMKII

Sympathetic nerve

Norepinephrine

Components

1. Electrophysiology

2. Calcium handling

3. Signaling (CaMKII, β-AR, others)

4. Cross-bridge

Myofilaments

___ __ ___ ____ __ _________ _______ __ _____ _______ Cardiac cell mechanics

___ __ ___ ____ __ _________ _______ __ _____ _______ Electrophysiology

control

w/ 30nM isoprenaline

0 0.05 0.1-100

-80

-60

-40

-20

0

20

40

t (seconds)

Em

(m

V)

0 0.05 0.1-100

-80

-60

-40

-20

0

20

40

t (seconds)

Em

(m

V)

___ __ ___ ____ __ _________ _______ __ _____ _______ Calcium handling

___ __ ___ ____ __ _________ _______ __ _____ _______ Cross-bridge

___ __ ___ ____ __ _________ _______ __ _____ _______ Cross-bridge

___ __ ___ ____ __ _________ _______ __ _____ _______ Integrated HF model version 1.0 – Lumens/Smith/Wu/Tran

0 0.5 1 1.5 2 2.5 30

1

2x 10

-3

[Ca

] i (m

M)

0 0.5 1 1.5 2 2.5 30

50

100

150

P (

mm

Hg

)

0 0.5 1 1.5 2 2.5 30

10

20

t (seconds)

P (

mm

Hg

)

Healthy resting conditions:MVO2 ≈ 3.5 μmol O2 min-1 (g tissue)-1

[MgATP] ≈ 8 mM [MgADP] ≈ 0.08 mM[Pi] ≈ 0.2 mM

0 0.5 1 1.5 2 2.5 30

1

2x 10

-3

[Ca

] i (m

M)

0 0.5 1 1.5 2 2.5 30

50

100

150

P (

mm

Hg

)

0 0.5 1 1.5 2 2.5 30

10

20

P (

mm

Hg

)

t (seconds)

HF resting conditions:MVO2 ≈ 3.5 μmol O2 min-1 (g tissue)-1

[MgATP] ≈ 1.5 mM [MgADP] ≈ 0.01 mM[Pi] ≈ 0.8 mM

___ __ ___ ____ __ _________ _______ __ _____ _______ Integrated HF model version 1.0 – Lumens/Smith/Wu/Tran

0 0.5 1 1.5 2 2.5 30

1

2x 10

-3

[Ca

] i (m

M)

0 0.5 1 1.5 2 2.5 30

50

100

150

P (

mm

Hg

)

0 0.5 1 1.5 2 2.5 30

10

20

t (seconds)

P (

mm

Hg

)

Healthy resting conditions:MVO2 ≈ 3.5 μmol O2 min-1 (g tissue)-1

[MgATP] ≈ 8 mM [MgADP] ≈ 0.08 mM[Pi] ≈ 0.2 mM

HF resting conditions:w/ Volume adjusted to 0.61 x controlMVO2 ≈ 3.5 μmol O2 min-1 (g tissue)-1

[MgATP] ≈ 1.5 mM [MgADP] ≈ 0.01 mM[Pi] ≈ 0.8 mM

0 0.5 1 1.5 2 2.5 30

1

2x 10

-3

[Ca

] i (m

M)

0 0.5 1 1.5 2 2.5 30

50

100

150

P (

mm

Hg

)

0 0.5 1 1.5 2 2.5 30

10

20

P (

mm

Hg

)

t (seconds)

___ __ ___ ____ __ _________ _______ __ _____ _______ Integrated HF model version 1.0 – Lumens/Smith/Wu/Tran

Healthy exercise conditions:w/ Resistance adjusted to 0.33 x controlMVO2 ≈ 10.5 μmol O2 min-1 (g tissue)-1

[MgATP] ≈ 8 mM [MgADP] ≈ 0.1 mM[Pi] ≈ 2.5 mM

HF exercise conditions:w/ Resistance adjusted to 0.25 x controlw/ Volume adjusted to 0.61 x controlMVO2 ≈ 10.5 μmol O2 min-1 (g tissue)-1

[MgATP] ≈ 1.5 mM [MgADP] ≈ 0.04 mM[Pi] ≈ 10 mM

0 0.2 0.4 0.6 0.8 1 1.2 1.40

2

4x 10

-3

[Ca

] i (m

M)

0 0.2 0.4 0.6 0.8 1 1.2 1.40

50

100

150

P (

mm

Hg

)

0 0.2 0.4 0.6 0.8 1 1.2 1.40

10

20

P (

mm

Hg

)

t (seconds)

0 0.2 0.4 0.6 0.8 1 1.2 1.40

2

4x 10

-3

[Ca

] i (m

M)

0 0.2 0.4 0.6 0.8 1 1.2 1.40

50

100

150

P (

mm

Hg

)

0 0.2 0.4 0.6 0.8 1 1.2 1.40

10

20

P (

mm

Hg

)

t (seconds)

___ __ ___ ____ __ _________ _______ __ _____ _______ Acknowledgements

Dissertation CommitteeDaniel Beard (Advisor)Brian CarlsonPaul GoldspinkAndrew GreeneMichael WidlanskyJeff Saucerman

FundingVPR - National Institute of Health Grant No. P50-GM094503

ProgramsDepartment of Physiology Graduate ProgramMedical Scientist Training Program


Recommended