ORIGINAL RESEARCH ARTICLE published: 27 February 2012 doi: 10.3389/fpsyg.2012.00050 The role of risk aversion in non-conscious decision making Shuo Wang 1 , Ian Krajbich 2,3 , Ralph Adolphs 1,2 and Naotsugu Tsuchiya 2,4,5,6,7 * 1 Computation and Neural Systems, California Institute ofTechnology, Pasadena, CA, USA 2 Humanities and Social Sciences, California Institute ofTechnology, Pasadena, CA, USA 3 Department of Economics, University of Zurich, Zurich, Switzerland 4 Brain Science Institute, RIKEN, Saitama-ken, Japan 5 AdvancedTelecommunication Research, Kyoto-fu, Japan 6 Japan Science andTechnology,Tokyo-to, Japan 7 School of Psychology and Psychiatry, Faculty of Medicine, Nursing, and Health Sciences, Monash University, Clayton,VIC, Australia Edited by: EldadYechiam,Technion – Israel Institute ofTechnology, Israel Reviewed by: ChristophT. Weidemann, Swansea University, UK Stephen M. Fleming, NewYork University, USA Eyal Ert, The Hebrew University of Jerusalem, Israel Navindra Persaud, St Michael’s Hospital, Canada *Correspondence: Naotsugu Tsuchiya, School of Psychology and Psychiatry, Faculty of Medicine, Nursing, and Health Sciences, Monash University, Building 17, Clayton Campus, Clayton 3800, VIC, Australia. e-mail: [email protected]To what extent can people choose advantageously without knowing why they are mak- ing those choices?This hotly debated question has capitalized on the Iowa GamblingTask (IGT), in which people often learn to choose advantageously without appearing to know why. However, because the IGT is unconstrained in many respects, this finding remains debated and other interpretations are possible (e.g., risk aversion, ambiguity aversion, lim- its of working memory, or insensitivity to reward/punishment can explain the finding of the IGT). Here we devised an improved variant of the IGT in which the deck-payoff contingency switches after subjects repeatedly choose from a good deck, offering the statistical power of repeated within-subject measures based on learning the reward contingencies associ- ated with each deck.We found that participants exhibited low confidence in their choices, as probed with post-decision wagering, despite high accuracy in selecting advantageous decks in the task, which is putative evidence for non-conscious decision making. However, such a behavioral dissociation could also be explained by risk aversion, a tendency to avoid risky decisions under uncertainty. By explicitly measuring risk aversion for each individual, we predicted subjects’ post-decision wagering using Bayesian modeling. We found that risk aversion indeed does play a role, but that it did not explain the entire effect. More- over, independently measured risk aversion was uncorrelated with risk aversion exhibited during our version of the IGT, raising the possibility that the latter risk aversion may be non- conscious. Our findings support the idea that people can make optimal choices without being fully aware of the basis of their decision. We suggest that non-conscious decision making may be mediated by emotional feelings of risk that are based on mechanisms distinct from those that support cognitive assessment of risk. Keywords: decision making, consciousness, risk aversion, post-decision wagering, confidence INTRODUCTION Decision making refers to a process of forming preferences, select- ing and executing an action from alternatives, and evaluating and predicting rewarding or aversive outcomes. Whether we can make accurate and optimal decisions without full conscious awareness of the basis for the decision remains controversial, while evidence for non-conscious processing itself has been established in the per- ceptual domain [e.g., implicit memory and priming (Kouider and Dehaene, 2007)]. Some evidence suggests that neuropsychological patients with damage to primary visual cortex lack visual phenom- enal awareness, yet can successfully make many visually guided decisions (Stoerig et al., 2002; Persaud et al., 2007). Under cer- tain circumstances, neurologically healthy subjects seem to make advantageous decisions without knowing why, for instance when they face a situation where the number of relevant parameters exceeds the limits of conscious working memory (Dijksterhuis et al., 2006). Another possible instance of non-conscious decision making is reported in a number of studies using the Iowa Gambling Task (IGT). In the past decade, the IGT has been extensively used as a probe for decision making in situations that feature uncertainty, reward, and punishment, mimicking aspects of real life (Dama- sio, 1994; Bechara et al., 1997, 1999, 2000; Anderson et al., 1999; Fellows, 2004; Oya et al., 2005; Dunn et al., 2006). In the IGT, participants are faced with four decks of cards. In each trial, they choose one deck and draw a card from it. Each card is associ- ated with a variable amount of monetary gain. In some trials, it is followed by a large amount of loss. In the long run, par- ticipants lose money on some decks, but win money on others. Yet the complexity of payoffs in the IGT prevents subjects from calculating the expected value associated with each deck, and sub- jects typically feel as though they are guessing when making their choices, especially early on in the task. Past studies of the IGT have reported an intriguing phenomenon, which motivated our study: subjects start to make advantageous card selections well before they can verbalize why they selected those decks (Bechara et al., 1997; Persaud et al., 2007). Remarkably, their autonomic response, as measured by skin conductance, also distinguishes good and bad www.frontiersin.org February 2012 |Volume 3 | Article 50 | 1
Transcript
ORIGINAL RESEARCH ARTICLEpublished: 27 February 2012
doi: 10.3389/fpsyg.2012.00050
The role of risk aversion in non-conscious decision makingShuo Wang1, Ian Krajbich2,3, Ralph Adolphs1,2 and NaotsuguTsuchiya2,4,5,6,7*
1 Computation and Neural Systems, California Institute of Technology, Pasadena, CA, USA2 Humanities and Social Sciences, California Institute of Technology, Pasadena, CA, USA3 Department of Economics, University of Zurich, Zurich, Switzerland4 Brain Science Institute, RIKEN, Saitama-ken, Japan5 Advanced Telecommunication Research, Kyoto-fu, Japan6 Japan Science and Technology, Tokyo-to, Japan7 School of Psychology and Psychiatry, Faculty of Medicine, Nursing, and Health Sciences, Monash University, Clayton, VIC, Australia
Edited by:
Eldad Yechiam, Technion – IsraelInstitute of Technology, Israel
Reviewed by:
Christoph T. Weidemann, SwanseaUniversity, UKStephen M. Fleming, New YorkUniversity, USAEyal Ert, The Hebrew University ofJerusalem, IsraelNavindra Persaud, St Michael’sHospital, Canada
*Correspondence:
Naotsugu Tsuchiya, School ofPsychology and Psychiatry, Faculty ofMedicine, Nursing, and HealthSciences, Monash University,Building 17, Clayton Campus, Clayton3800, VIC, Australia.e-mail: [email protected]
To what extent can people choose advantageously without knowing why they are mak-ing those choices? This hotly debated question has capitalized on the Iowa Gambling Task(IGT), in which people often learn to choose advantageously without appearing to knowwhy. However, because the IGT is unconstrained in many respects, this finding remainsdebated and other interpretations are possible (e.g., risk aversion, ambiguity aversion, lim-its of working memory, or insensitivity to reward/punishment can explain the finding of theIGT). Here we devised an improved variant of the IGT in which the deck-payoff contingencyswitches after subjects repeatedly choose from a good deck, offering the statistical powerof repeated within-subject measures based on learning the reward contingencies associ-ated with each deck. We found that participants exhibited low confidence in their choices,as probed with post-decision wagering, despite high accuracy in selecting advantageousdecks in the task, which is putative evidence for non-conscious decision making. However,such a behavioral dissociation could also be explained by risk aversion, a tendency to avoidrisky decisions under uncertainty. By explicitly measuring risk aversion for each individual,we predicted subjects’ post-decision wagering using Bayesian modeling. We found thatrisk aversion indeed does play a role, but that it did not explain the entire effect. More-over, independently measured risk aversion was uncorrelated with risk aversion exhibitedduring our version of the IGT, raising the possibility that the latter risk aversion may be non-conscious. Our findings support the idea that people can make optimal choices withoutbeing fully aware of the basis of their decision. We suggest that non-conscious decisionmaking may be mediated by emotional feelings of risk that are based on mechanismsdistinct from those that support cognitive assessment of risk.
INTRODUCTIONDecision making refers to a process of forming preferences, select-ing and executing an action from alternatives, and evaluating andpredicting rewarding or aversive outcomes. Whether we can makeaccurate and optimal decisions without full conscious awarenessof the basis for the decision remains controversial, while evidencefor non-conscious processing itself has been established in the per-ceptual domain [e.g., implicit memory and priming (Kouider andDehaene, 2007)]. Some evidence suggests that neuropsychologicalpatients with damage to primary visual cortex lack visual phenom-enal awareness, yet can successfully make many visually guideddecisions (Stoerig et al., 2002; Persaud et al., 2007). Under cer-tain circumstances, neurologically healthy subjects seem to makeadvantageous decisions without knowing why, for instance whenthey face a situation where the number of relevant parametersexceeds the limits of conscious working memory (Dijksterhuiset al., 2006).
Another possible instance of non-conscious decision makingis reported in a number of studies using the Iowa Gambling Task
(IGT). In the past decade, the IGT has been extensively used as aprobe for decision making in situations that feature uncertainty,reward, and punishment, mimicking aspects of real life (Dama-sio, 1994; Bechara et al., 1997, 1999, 2000; Anderson et al., 1999;Fellows, 2004; Oya et al., 2005; Dunn et al., 2006). In the IGT,participants are faced with four decks of cards. In each trial, theychoose one deck and draw a card from it. Each card is associ-ated with a variable amount of monetary gain. In some trials,it is followed by a large amount of loss. In the long run, par-ticipants lose money on some decks, but win money on others.Yet the complexity of payoffs in the IGT prevents subjects fromcalculating the expected value associated with each deck, and sub-jects typically feel as though they are guessing when making theirchoices, especially early on in the task. Past studies of the IGT havereported an intriguing phenomenon, which motivated our study:subjects start to make advantageous card selections well beforethey can verbalize why they selected those decks (Bechara et al.,1997; Persaud et al., 2007). Remarkably, their autonomic response,as measured by skin conductance, also distinguishes good and bad
Wang et al. Conscious and non-conscious decision-making
deck selection before the subjects can verbalize the basis of theirdeck selection (Bechara et al., 1997), supporting the theory thatemotional response informs complex decision making (Damasio,1994; Bechara et al., 2000; but also, see Tomb et al., 2002; Dunnet al., 2006). Though an intriguing finding, the claim that decisionmaking occurs in the absence of awareness in the IGT has beencriticized on several grounds. In particular, Maia and McClelland(2004, 2005) have criticized the operational definition of “non-conscious,” arguing that people may be vaguely aware of theirstrategy even though they do not say so with open-ended ques-tions (Bechara et al., 1997). When subjects were probed every 10trials by a set of questionnaires, which involves numerical ratingof the goodness of each deck, direct estimation of the expectedpayoff of each deck, expression of the best strategy for the IGT,and so on, it was found that they started to make optimal choicesat the same time as they started to show some form of consciousawareness (Maia and McClelland, 2004; Persaud et al., 2007).
However, these detailed questionnaires have themselves beencriticized because they force subjects to introspect in an unnaturalway during decision making (Koch and Preuschoff, 2007), thusundermining the methods for identifying implicit knowledge byprompting subjects to become aware when they otherwise wouldnot (Bechara et al., 2005). To address this problem, Persaud et al.(2007) proposed an alternative measure of awareness, which isobjective in that it does not rely on subjective ratings, and alsoindirect and less obtrusive compared to the detailed questionnaireused by Maia and McClelland (2004). In Persaud et al.’s post-decision wagering task, subjects indirectly reveal the confidencethat they have in their decision by wagering high or low on theexpected outcome of their choice. A correct choice followed bya high wager is taken as an index of conscious awareness. Whenprobed with open-ended questions (Bechara et al., 1997), post-decision wagering replicated the original findings: subjects choseadvantageously from the decks before they showed any evidence ofconscious awareness as revealed by post-decision wagering. How-ever, when probed with a more intrusive questionnaire (Maia andMcClelland, 2004), advantageous deck choices and optimal post-decision wagers developed concurrently. These results reconcilethe previous findings and underline the fact that detailed inquiryof conscious awareness can alter the very conscious access oneintends to measure.
The validity of post-decision wagering as a probe of con-sciousness, however, has yet to be fully demonstrated (Koch andPreuschoff, 2007; Clifford et al., 2008a; Schurger and Sher, 2008;Dienes and Seth, 2010; Fleming and Dolan, 2010; Sandberg et al.,2010). The ensuing critiques have argued that there is a distinctionbetween true performance without awareness on the one hand,and simply a reluctance, on the other hand, to gamble with weaksensory evidence despite full awareness (Clifford et al., 2008a). Thissecond possibility is “risk aversion” (Koch and Preuschoff, 2007;Schurger and Sher, 2008), the well-known finding that people willoften make a choice that has a lower expected value than someother option, if it also has less variance in its payoffs. This phenom-enon is accounted for by assuming that people maximize utilityrather than expected value, where utility is a concave functionof value for risk-averse individuals (and convex for risk-seekingindividuals) (Kahneman and Tversky, 1979; Rabin, 2000; Holt and
Laury, 2002). Therefore, risk-averse subjects often turn down gam-bles with positive expected value, simply because the variance (ortheir belief about the variance) in payoffs is sufficiently high thattheir utility for the gamble is lower than an alternative option.In other words, subjects’ wagering strategies may be a reflectionof their attitude toward risk, and so sub-optimal wagering maybe perfectly consistent with their preferences (Schurger and Sher,2008). In fact, Dienes and Seth (2010) found correlation betweenrisk aversion and the degree of non-conscious knowledge inferredfrom wagering. It is therefore critical to understand the role of riskaversion in post-decision wagering in order to fully dissect the roleof non-conscious processes in decision making.
There are additional aspects in the task design of the IGTitself (Fellows, 2004; Dunn et al., 2006; Bossaerts et al., 2008),which preclude an unequivocal interpretation either for or againstnon-conscious decision making. Notably, the IGT has at mostone onset of awareness and is essentially a one-shot experiment,where subjects are not allowed to practice the task and they arenot informed of any critical information about the task structure(e.g., the possible payoff structure for each deck, when the taskends, etc.). In such a situation, people are known to exhibit ambi-guity aversion (Ellsberg, 1963; Camerer and Weber, 1992; Rodeet al., 1999; Hsu et al., 2005), which may or may not be relatedto non-conscious decision making. In the economics literature,ambiguity refers to situations where the probabilities of the dif-ferent outcomes are unknown. Ambiguity aversion then refers tothe fact that most people tend to avoid choosing options wherethe probabilities are unknown. It is important to note that riskaversion and ambiguity aversion are separate phenomena. Riskaversion describes an individual’s aversion to variance in pay-offs while ambiguity aversion describes an individual’s aversion tounknown probabilities (lack of information about the likelihoodof the outcomes).
In addition, due to the IGT’s one-shot nature, subjects cannotice which decks are good at most once during the experiment.This is statistically inefficient, yielding effects that are sometimesunreliable even in healthy normal controls (Dunn et al., 2006).While a previous study (Oya et al., 2005) applied a reinforcementlearning algorithm to the IGT to solve some of these difficulties, itremains unclear how to incorporate risk aversion effects into rein-forcement learning under the unconstrained parameters of theoriginal IGT (Bossaerts et al., 2008).
The goal of our study was to test for non-conscious decisionmaking while ruling out other explanations. Toward that aim, wemodified the IGT in four important ways. First, we incorporatedpost-decision wagering to probe subjects’ awareness indirectly ineach trial (Persaud et al., 2007). Second, to improve statisticalpower, we repeatedly reshuffled deck-payoff contingencies oncesubjects noticed the contingency, resulting in multiple epochs oflearning, and choice within each subject. Third, to eliminate ambi-guity and heterogeneous priors about the task structure, we toldsubjects the structure of the game by detailing the distribution ofpayoffs from the four decks (but without identifying the location ofthe decks). This also allowed us to apply a formal Bayesian modelto subjects’ choices. Fourth, we measured each subject’s risk aver-sion profile with a similar but explicit task where they were askedto wager on various gambles with different expected values and
Frontiers in Psychology | Cognitive Science February 2012 | Volume 3 | Article 50 | 2
Wang et al. Conscious and non-conscious decision-making
levels of risk (shown explicitly). We incorporated this measure ofexplicit risk aversion into the Bayesian model to predict subjects’wagering behaviors.
With our modified version of the IGT, we replicated the findingthat there is a gap between when subjects start to choose optimallyin the IGT and when they start to bet high in the post-decisionwagering task (Persaud et al., 2007). Subjects wagered high muchless often than predicted from the Bayesian model incorporatingtheir risk aversion profiles. Thus, the discrepancy between goodchoice behavior yet poor wagering cannot be fully explained by riskaversion alone. We also found that risk aversion in our modifiedIGT and in the explicit task were uncorrelated. We suggest that riskaversion observed in our version of the IGT may reflect processesthat are distinct from those at work when payoff probabilities areexplicitly known. Such implicit risk aversion may arise from thefeeling of risk (Loewenstein et al., 2001) under complicated reallife situations where no explicit probabilities are available and maybe an instance of a “somatic marker” that helps us navigate choicesand plans in everyday life (Damasio, 1994).
MATERIALS AND METHODSSUBJECTS AND EXPERIMENTAL PROCEDUREWe carried out two experiments, involving separate subject sam-ples. Each experiment consisted of the two phases described below,but their order was counterbalanced.
Experiment 1Sixteen students (six females) from the California Institute ofTechnology (Caltech) gave written informed consent accordingto a protocol approved by the Caltech IRB. The age of subjectsranged from 18 to 24 (mean = 21). Their psychological and eco-nomic background information was collected at the end of theexperiment.
All participants first participated in 100 trials of a computer-ized version of the IGT (Bechara et al., 1994) with post-decisionwagering (Persaud et al., 2007), followed by two versions of ourlearning task (Figure 1A) without knowledge of the task structureor the payoffs. Data from these prior tasks are not analyzed orpresented in the present study, but it is important to note that they
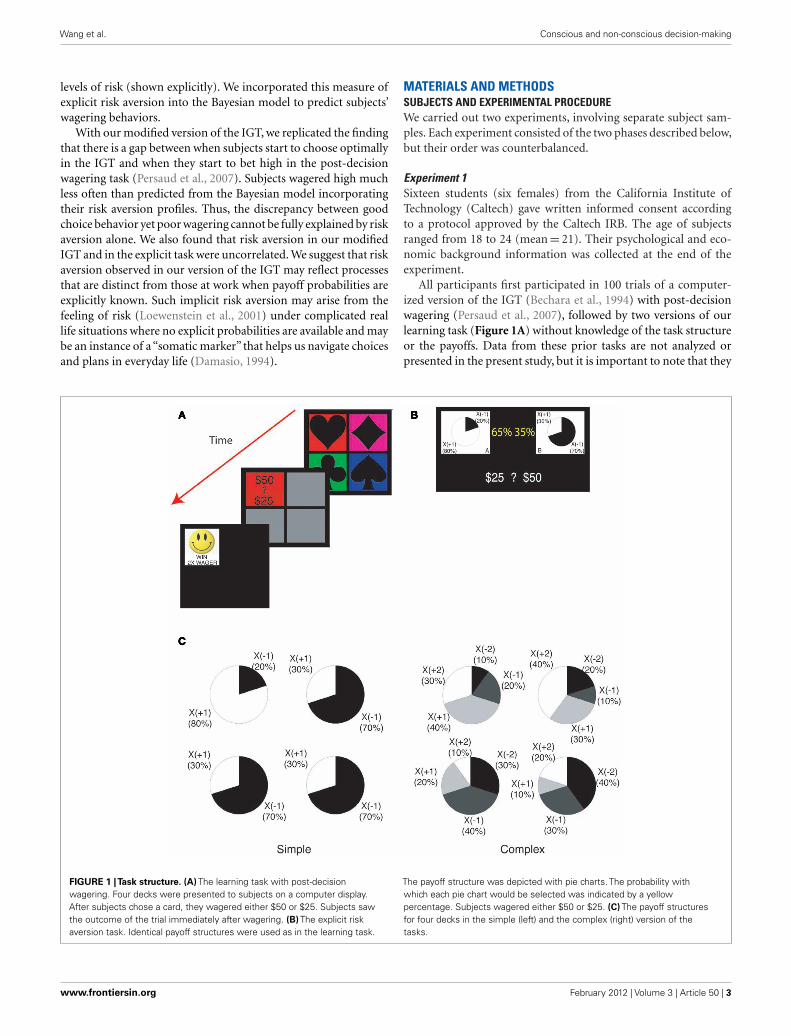
FIGURE 1 |Task structure. (A) The learning task with post-decisionwagering. Four decks were presented to subjects on a computer display.After subjects chose a card, they wagered either $50 or $25. Subjects sawthe outcome of the trial immediately after wagering. (B) The explicit riskaversion task. Identical payoff structures were used as in the learning task.
The payoff structure was depicted with pie charts. The probability withwhich each pie chart would be selected was indicated by a yellowpercentage. Subjects wagered either $50 or $25. (C) The payoff structuresfor four decks in the simple (left) and the complex (right) version of thetasks.
Wang et al. Conscious and non-conscious decision-making
provided all subjects with a substantial and equal amount of priorbackground experience.
Each subject then underwent two phases of the experiment inthe same fixed order:
Phase 1–Two versions of the learning task with post-decisionwagering, after being informed of the payoff distributions fromthe different types of decks, 100 trials each.
Phase 2–Two versions of the explicit risk aversion task(Figure 1B), the first version with 50 trials of the “simple” gambleand the second with 100 trials of the“complex”gamble (Figure 1C,see below for details of different versions of the task).
Subjects were familiarized with the tasks and post-decisionwagering through practice trials (∼20 trials). Within each phase,the order of the two versions of the tasks was randomized acrosssubjects. Questionnaires were given after each phase to make suresubjects understood the tasks.
Subjects were paid a fixed amount for their participation ($5),a fixed amount ($3) for the IGT, as well as a variable amountfor their performance (mean = $5.34) in the learning and explicittasks. For the learning task, subjects were paid the amount theyearned, which was divided by 2000. For the explicit risk aversiontask, subjects were paid at the end of their experiment, based ontheir earnings from one randomly selected trial.
Experiment 2We conducted Experiment 2 with 20 naïve Caltech subjects. Thetasks in Experiment 2 were identical to those in Experiment 1, withfour important differences:
1) Subjects did not receive any prior background tasks (IGT orlearning task), as they had in Experiment 1.
2) The two phases were done in a fixed order (Phase 2 first, thenPhase 1), counterbalancing the order from Experiment 1.
3) Subjects underwent two explicit risk aversion tasks, 100 trialsof the “simple” and 100 trials of the “complex” gamble. UnlikeExperiment 1, here we paid subjects for every trial, in order tomatch the payment scheme with the learning task (see belowfor details).
4) All subjects were tested simultaneously in a social scienceexperimental laboratory with many cubicles with computerterminals for each individual rather than individually as inExperiment 1.
In this experiment, subjects were paid a fixed amount for theirparticipation ($10) in addition to a variable amount based ontheir performance in all four tasks (simple and complex versionsof the explicit and learning tasks). Prior to each phase, subjectswere familiarized with each task through 10 practice trials.
LEARNING TASK WITH POST-DECISION WAGERINGSubjects were given a $2000 loan of play money in the begin-ning and told that their goal was simply to earn as much playmoney as possible. In each trial, four decks with different col-ored symbols were presented on the display (Figure 1A). Subjectsclicked on one of the decks using a mouse. After selecting a card,they wagered either $50 or $25 by clicking on the upper or lowerhalf of the flipped card, respectively. After wagering, the payoff
of the selected card was displayed as a multiplier for the wageredamount (X WAGER). For example, if a subject wagered $50 andgot a X(−2) payoff, they would lose $100 in that trial. Note that thefinal outcome (i.e., loss of $100) was not shown to the subjects.At the time of the payoff, the positive multiplier was associatedwith a happy icon and a positive laughter sound (070-who2.wav1)while the negative multiplier was associated with a sad icon andan obnoxious sound of shattered glass (truckcollide.wav2).
We randomized the spatial positions of the decks in each trial,thus forcing subjects to learn solely about the association betweentheir appearance and their payoff. To encourage quick decisionsrelying on gut feelings, we instructed subjects to respond within1.5 s after the deck presentation. If they did not move the mousewithin this time interval, we randomized the deck positions again(<5% of trials). If they moved the mouse to one of the decks butfailed to click on it, we regarded the deck under the mouse cur-sor as their choice (<5% of trials). We did not impose any timepressure for wagering responses.
We employed two learning tasks differing in complexity. In thesimple version of the task, the payoff was either X(+1) or X(−1;Figure 1C left). The expected payoff was positive (+0.6) for onedeck and negative (−0.4) for the other three decks. In the com-plex version of the task (Figure 1C right), the possible payoffswere X(+2), X(+1), X(−1), and X(−2). The expected payoff waspositive (+0.6) for two decks and negative (−0.6) for the othertwo decks. In the complex version, one positive, and one nega-tive deck had high variance (2.44) and the others had low variance(1.84). We refer to positive (or negative) decks as“good”(or“bad”)decks.
The theoretical expected earnings over 100 trials with randomdeck choice are $-281.25 for the simple version and $0 for thecomplex version. In Experiment 1, subjects earned $781 ± 474(mean ± SD) in the simple version and $747 ± 346 in the complexversion, and in Experiment 2, subjects earned $345 ± 347 in thesimple version and $891 ± 408 in the complex version, confirm-ing that subjects performed well above-chance (p < 10−6 for bothversions in both experiments, one-tailed t -test).
Subjects were told that the optimal strategy is (1) to initiallyexplore the four decks while wagering $25 and (2) to exploitthe good deck while wagering $50 once they notice which deckis most likely to give a positive payoff. 35 out of 36 subjectsdiscovered the good deck and then repeatedly chose from it(Figure 2A)3. After six to eight consecutive choices from a gooddeck, we showed a text message, “Game Restarted,” on the dis-play to notify the subject that the deck-reward contingencies werereassigned and that the subject should explore again (red barsin Figure 2A). The number of consecutive choices required foreach reassignment was randomly chosen from six to eight toreduce subjects’ anticipation for the next reassignment and tohave sufficient trials to observe the evolution of wagering behavior(Figure 2B).
1http://www.moviewavs.com/2http://download848.mediafire.com/3We observed one subject who purposely chose from a bad deck every few trials. Thissubject told us after the experiment that he tried to beat our game by occasionallyselecting a bad deck after selecting the good deck a few times in a row.
Frontiers in Psychology | Cognitive Science February 2012 | Volume 3 | Article 50 | 4
Wang et al. Conscious and non-conscious decision-making
FIGURE 2 | Results from one subject in the complex learning task.
(A) The history of card selection. Initially, the subject sampled from fourdecks, then discovered the good deck and stuck with this deck until thereshuffle (red vertical bars). Small red arrows indicate the trial where thesubject started to choose from the good deck consistently, which wedefine as “the onset of good deck choice.” The red circles indicate the trialswhere the subject received a negative payoff. (B) The history of actualwagering (red) and the predicted probability of a high wager based on theexplicit task results (blue). (C) The Bayesian probability for an objectivelygood deck [the good deck in the upper row in (A)] being a good deck. Asthe evidence accumulates, this probability updates from 0.5 (the Bayesianprior). It increases when this good deck is selected with a positive outcomeor when other decks are selected with a negative outcome. (D) The alignedresults of nine onsets of consecutive good deck selection from this subject.The probability of good deck selection (black) and wagering high (red) arealigned at the onsets (shown as the red arrow). The green line is theBayesian probability of the chosen deck being a good deck.
EXPLICIT RISK AVERSION TASKTo measure each subject’s risk aversion, we employed a standardtechnique from experimental economics. In each trial, we showedtwo or four pie charts for the simple or the complex version of therisk aversion task, respectively (Figure 1B). These pie charts areidentical to the payoff distribution charts from the instructions forthe learning task (Figure 1C). The goal was to mimic the infor-mation structure from the learning task as closely as possible inorder to maximize the predictive power of the risk aversion model
from one task to the other. During the wagering stage, the learningtask can be thought of as being equivalent to the risk aversion task,except that in the learning task the subjects estimate the probabili-ties (indicated explicitly here in yellow in Figure 1B) based on theirprevious card draws. For example, in the simple version of the riskaversion task, if the good and bad decks have explicitly stated prob-abilities of 70% and 30% respectively, this would correspond to asituation in the learning task, where the subject draws a card from adeck they believe to be good and is (subjectively) 70% sure that thechosen deck is good (a good deck is a deck with positive expectedpayoff). In reality, its unlikely that subjects assign explicit proba-bilities to the decks in the learning task. But they may behave“as if”they are tracking the Bayesian probabilities (Hampton et al., 2006).
The probabilities assigned to the pie charts in the explicit taskranged from 0.25 to 0.70 for the simple version and from 0.35to 0.85 for the complex version. There was no time restriction.The order of the simple and complex versions was randomizedacross subjects. In this explicit task, the subjects’ goal was again tomaximize their payoff.
In Experiment 1 and 2, we implemented two ways of payment inthis explicit task. In Experiment 1, we randomly picked one of the150 trials from the explicit tasks (combining simple and complexversions), selected one of the pie charts according to their proba-bilities, then selected one of the possible payoffs from that pie chartaccording to the probabilities in the chart, and finally multipliedthe chosen payoff by the subject’s wager. Subjects were shown thisprocedure on the display animation and understood this proce-dure during practice sessions for both versions of the explicit task.In Experiment 2, we gave subjects a $2000 loan of play money inthe beginning and we told them that the goal was simply to earn asmuch play money as possible. We gave trial-by-trial feedback (withthe same sound and icon as in the learning task), accumulated thetotal amount of play money and paid subjects the amount theyearned which was divided by 2000.
BAYESIAN UPDATING TO ESTIMATE SUBJECTIVE PROBABILITYWe computed the Bayesian probability of the chosen deck beingthe good deck using a Bayesian model (Figure 2C). Briefly, thismodel computes the probability of each deck being the good deck,given the distribution of payoffs from each type of deck (good orbad) and the actual history of positive and negative payoffs to thesubject. The probabilities for all four decks were updated after eachchoice. We describe the details of our Bayesian model and assesshow well our assumptions are justified in the Appendix.
The Bayesian model of learning that we used was chosen forits simplicity and descriptive power in other learning research(Ghahramani, 2001; Daw et al., 2005; Hampton et al., 2006;Brodersen et al., 2008). We compared our Bayesian model with theprevailing cognitive models (Busemeyer and Stout, 2002), includ-ing a variant of reinforcement learning,and showed that our modelis superior in predicting choices and wagers. We describe the detailsof the model comparison in the Appendix.
PREDICTING WAGERING BEHAVIOR IN THE LEARNING TASK AND DATAFITTINGIn the explicit task, the probability of subjects wagering highincreases with the probability for the good deck in a sigmoidal
Wang et al. Conscious and non-conscious decision-making
manner (Figures 3C,D,G,H, blue curves). Combining this psycho-metric function in the explicit task with the Bayesian probabilitiescomputed in each trial, we tried to predict the probability of ahigh wager in the learning trials. If the subjects were learning theprobabilities like Bayesians (even roughly) then their choice char-acteristics in the explicit risk aversion task should help predict theirwagering behavior in the learning task.
We used local regression to obtain smooth psychometric curvesshown in Figures 3C,D,G,H and 4G,H. We used the Locfit pack-age (Loader, 1999) included in the Chronux Toolbox4 (Mitra andBokil, 2008) in MATLAB. We used a Gaussian kernel and a bino-mial local likelihood fitting family. To stabilize the fit, we definedthe probability of a high wager as 0 at a good deck probabilityof 0. For each subject, we optimized the smoothing width usinga cross-validation method by (1) randomly dividing the datasetinto halves, a training and a test data set, (2) obtaining the best fitto the training set for each of the different smoothing widths, and(3) computing the squared difference between the fitted curve andthe actual data from the test set, which was not used during curvefitting. We repeated the above cross-validation procedure 10 timesand chose the smoothing width that minimized the overall errorfor the test set. For Figures 3C,D,G,H, we averaged the derivedsmoothed curves across subjects.
RISK AVERSION INDEX AND RISK-SENSITIVITY INDEXWe defined a risk aversion index (RAI) as the point (x-axis inFigures 3C,D,G,H) where the probability of a high wager (y-axis)reaches 0.5. We derived the RAI from the fitted curve for each sub-ject. We also defined a risk-sensitivity index (RSI) as the steepnessof the fitted curve as follows:
RSI =(Probability of high wager at p = 0.75)
−(Probability of high wager at p = 0.25)
0.75 − 0.25
Due to the nature of the task and noise in the learning task, tra-ditional models of risk aversion (Kahneman and Tversky, 1979;Rabin, 2000; Holt and Laury, 2002) did not fit the data well.Our measures of risk aversion are simple but do a better job ofcharacterizing subjects’ risk aversion, as demonstrated by the highwithin-subject correlations between the simple and complex ver-sions of the explicit tasks as well as those of the learning tasks (seeResults).
RESULTSLEARNING TASK WITH POST-DECISION WAGERINGIn our novel learning task, the deck-payoff contingency switchedafter subjects repeatedly selected cards from a deck with posi-tive expected value (a “good” deck). In each trial, subjects firstselected a card from one of four decks, and then wagered either$50 or $25. Immediately after wagering, subjects saw their pay-off as a multiplier of the wager amount, that is, either X(+2),X(+1), X(−1), or X(−2). The total amount of the payoff (i.e., thewagered amount times the multiplier) was not shown explicitly onthe display (Figure 1A).
4http://chronux.org/
We show a typical subject’s behavior for deck selection andwagering in Figures 2A,B. Initially, the subject sampled from sev-eral decks, then settled on the good deck. He stuck with this deckuntil the reshuffle. As for wagering, he started off wagering low buteventually wagered high after several selections from the good deck(red line). After the reshuffle,he returned to wagering low. Interest-ingly, his actual wagering behavior lagged behind his theoreticallypredicted wagering behavior (blue line), which incorporated hisrisk aversion as measured in the explicit task (see below). Thislag is consistent with non-conscious optimal choice, and we willreturn to this point later.
To analyze when subjects started to wager high, in Figures 2Dand 3A,B,E,F, we aligned card selection and wagering to the onsetof good deck selection. Figure 2D shows that the exemplar subjectnever wagered high (the red line) before he found the good deck.On subsequent draws from the good deck, the subject increasinglywagered high, and by the sixth card the subject was always wager-ing high. Figures 3A,B (Experiment 1, n = 16) and Figures 3E,F(Experiment 2, n = 20) show similar trends at the group levelin both the simple and complex versions of the learning taskin both experiments. Subjects wagered high (the red lines) onless than 100% of the trials even after repeatedly choosing fromthe good deck (up to seven cards after the onset of good deckselection).
This alone does not yet prove that subjects were choosing theadvantageous good deck(s) without conscious awareness; it merelysuggests that subjects needed to build up to a certain level of confi-dence in their selection before making a high wager. We thereforeused a Bayesian model to estimate subjects’ beliefs about whichdecks were the good ones and then used those beliefs to predictthe subjects’ wagering behavior. The model’s prediction was basedon the past history of outcomes for the subjects as well as their riskaversion.
EXPLICITLY MEASURING RISK AVERSIONTo measure risk aversion, we asked subjects to wager $50 or $25in a situation where the probability of the chosen deck beinggood or bad was explicitly available (the explicit risk aversion task,Figure 1B). Note that in the learning task (Figure 1A), subjectsmight never have had an explicit representation of this probabil-ity, even if they computed it implicitly in order to guide choice andwagering.
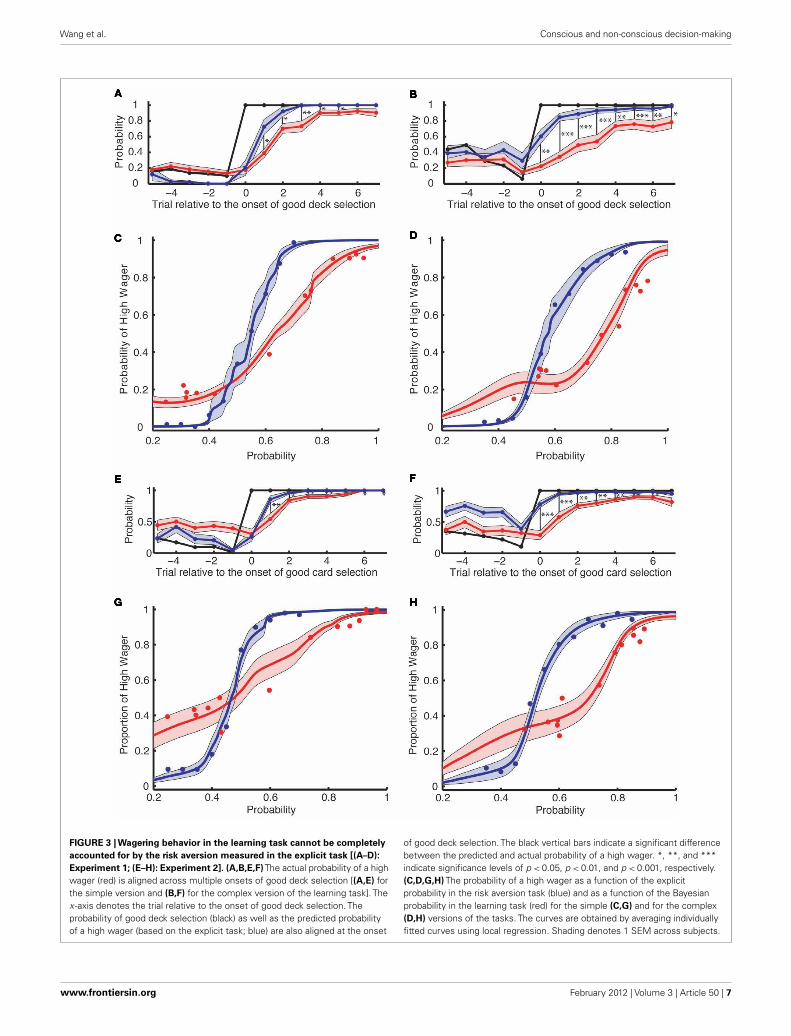
The resulting psychometric curves for high wagers in theexplicit task are shown by the blue curves in Figures 3C,D,G,H. Asan example, for the simple version of the explicit task in Experi-ment1, subjects wagered high more than 90% of the time when theprobability of being a good deck exceeded 0.65. They wagered highonly 50% of the time when the explicit probability of being a gooddeck was 0.55, consistent with published risk aversion results fromexperimental economics (Kahneman and Tversky, 1979; Rabin,2000; Holt and Laury, 2002).
We then analyzed how often subjects wagered high in the learn-ing task as a function of the Bayesian probability of the chosen deckbeing the good one (Figures 3C,D,G,H, red curves). When makingtheir wagering decisions in the learning task, subjects’ psychome-tric curves shifted to the right, suggesting that they became morerisk-averse. Furthermore, the curves became flatter, suggesting that
Frontiers in Psychology | Cognitive Science February 2012 | Volume 3 | Article 50 | 6
Wang et al. Conscious and non-conscious decision-making
FIGURE 3 | Wagering behavior in the learning task cannot be completely
accounted for by the risk aversion measured in the explicit task [(A–D):
Experiment 1; (E–H): Experiment 2]. (A,B,E,F)The actual probability of a highwager (red) is aligned across multiple onsets of good deck selection [(A,E) forthe simple version and (B,F) for the complex version of the learning task]. Thex -axis denotes the trial relative to the onset of good deck selection. Theprobability of good deck selection (black) as well as the predicted probabilityof a high wager (based on the explicit task; blue) are also aligned at the onset
of good deck selection. The black vertical bars indicate a significant differencebetween the predicted and actual probability of a high wager. *, **, and ***indicate significance levels of p < 0.05, p < 0.01, and p < 0.001, respectively.(C,D,G,H) The probability of a high wager as a function of the explicitprobability in the risk aversion task (blue) and as a function of the Bayesianprobability in the learning task (red) for the simple (C,G) and for the complex(D,H) versions of the tasks. The curves are obtained by averaging individuallyfitted curves using local regression. Shading denotes 1 SEM across subjects.
Wang et al. Conscious and non-conscious decision-making
FIGURE 4 | Subject-specific risk aversion indices (RAI) are correlated
between the simple and complex versions of the tasks, but not between
the explicit and learning tasks. (A,B) RAI was highly correlated between thesimple (x -axis) and complex (y -axis) versions within the explicit tasks (A) andwithin the learning tasks (B). (C,D) RAI was uncorrelated across the learning(x -axis) and the explicit task (y -axis) in either the simple (C) or the complex
(D) versions. Blue dots represent subjects from Experiment 1 and green dotsrepresent subjects from Experiment 2. (E–H) The results from two exemplarsubjects indicated by the red arrows in (D). Their behaviors are presented inthe same format as in Figures 3A–D. (E,G) A subject who preferred to wagerhigh in the learning but not in the explicit task. (F,H) A subject who showedextreme risk aversion only in the learning task.
Frontiers in Psychology | Cognitive Science February 2012 | Volume 3 | Article 50 | 8
Wang et al. Conscious and non-conscious decision-making
subjects were less sensitive to the payoffs during the learning task.To quantify these effects, we computed two indices for each sub-ject: a RAI and a RSI. RAI represents the explicit probability ofthe deck being “good” at which subjects wagered high in 50% ofthe trials. RAI approaches 1 if subjects are risk-averse (i.e., thosewho wager high only when they are sure to win). If subjects arerisk-neutral, RAI is 0.45 (due to the negative expected payoffsfor the random choice strategy) for the simple and 0.5 for thecomplex versions of the task. In Experiment 1 (Figures 3C,D),RAI was higher in the learning tasks (RAI = 0.633 for the simpleand 0.775 for the complex) than in the explicit risk aversion tasks(RAI = 0.548 for the simple and 0.576 for the complex, paired t -test, p = 0.007 for the simple, and p = 0.002 for the complex). InExperiment 2 (Figures 3G,H), for the complex version, RAI washigher in the learning tasks (RAI = 0.702) than in the explicit tasks(RAI = 0.520, p = 0.045). For the simple version, RAI in the learn-ing task (0.476) was not different from that in the explicit task(RAI = 0.467, p = 0.15). RSI is the slope of the curve, representingthe sensitivity to the change in probability. In Experiment 1, RSIwas smaller in the learning tasks (RSI = 1.12 for the simple and0.70 for the complex) than in the explicit tasks (RSI = 1.97 for thesimple and 1.78 for the complex, paired t -test, p < 10−5 for boththe simple and the complex versions). In Experiment 2, RSI wasalso smaller in the learning tasks (RAI = 1.06 for the simple and0.949 for the complex) than in the explicit tasks (RAI = 1.87 forthe simple and 1.83 for the complex, p < 10−4 for both the simpleand the complex versions).
Overall, the results from Experiment 1 and 2 were consis-tent although there was some difference in the simple version ofthe task. RAI in both the learning and explicit task was signifi-cantly lower in Experiment 2 than Experiment 1 (unpaired t -test,p = 0.016 for the learning and p < 0.001 for the explicit task; seeDiscussion). The RSI was not significantly different between thetwo experiments.
Looking at Figure 3C more closely, in the explicit task sub-jects wagered high in 100% of the trials where the probability ofchoosing from the good deck was 70%. However, in the learningtask they wagered high in less than 65% of the trials where theBayesian probability was at the same level. Our analysis revealsthat this phenomenon is a combined effect of lower RSI (i.e., flat-ter psychometric curves) indicating an insensitivity to the payoffs,and higher RAI (i.e., rightward shift of the curves) indicating thatsubjects were more risk-averse during the learning task than theexplicit task.
THE DELAYED ONSET OF AWARENESS COMPARED TO THE ONSET OFGOOD CARD CHOICEWe predicted the probability of a high wager for each trial inthe learning task based on the actual payoff history in the learn-ing task and the risk aversion profile in the explicit task (as inFigures 3C,D,G,H). First, we computed the Bayesian probabilityfor each trial based on the history of payoffs (Figure 2C). Then, wederived the probability of a high wager by drawing a vertical linefrom the Bayesian probability (on the x-axis) in the risk aversionsigmoidal curve and finding the corresponding y-value. This wasrepeated for each trial (Figure 2B, blue curve). If there is a periodof non-conscious decision making, we should see a gap between
the actual and the predicted probability of high wagers even aftertaking into account each subject’s risk aversion.
In Figures 3A,B,E,F, the blue curves show the proportion of tri-als in which subjects would have wagered high if they had explicitlybeen shown the Bayesian probability that they were choosing fromthe good deck. We see that subjects wagered high much less fre-quently in the actual gambling task (red) than predicted based onrisk aversion and the Bayesian probabilities (blue). In both experi-ments, the gaps between the two curves were significantly differentat most points: in Experiment 1 for the simple version, p < 0.05for points from +1 to +5, p = 0.055 for +6, and p = 0.088 for +7;for the complex, p < 0.05 for all the points after 0, and in Exper-iment 2 for the simple, p < 0.05 for points from +1 to +7 except+5 (p = 0.069); for the complex, p < 0.05 for all the points from0 to +6, and p = 0.062 for +7; two-tailed paired t -test, correctedfor multiple comparisons for trial 0 to trial +7 with false discoveryrate (FDR) of 0.05 (Benjamini and Hochberg, 1995).
Thus, even when we take into account the effects of riskaversion, we still find that subjects did not wager optimally. Weconclude that we cannot fully explain the gap between choosingoptimally and wagering high (Bechara et al., 1997; Persaud et al.,2007) based solely on risk aversion (Clifford et al., 2008a; Schurgerand Sher, 2008; Dienes and Seth, 2010).
RISK AVERSION IN THE LEARNING TASK IS UNCORRELATED WITH THATMEASURED IN THE EXPLICIT TASKEven if risk aversion does not completely account for behavior inthe learning task, we would expect to see a correlation between riskaversion measures in the two tasks, since it is generally assumedthat risk aversion is an individual personality trait that shouldbe fairly stable across tasks, especially over short periods of time(Harrison et al., 2005; Koch and Preuschoff, 2007). To check thisassumption, we ran a correlation analysis on the risk aversionmeasures.
Within-subject RAIs were highly correlated between two lev-els of payoff complexity within the explicit tasks for Experi-ment 1 (Figure 4A, blue dots, Spearman correlation test:ρ = 0.81,p = 0.00022) and for Experiment 2 (green dots, ρ = 0.58,p = 0.01). This was also true within the learning tasks for Exper-iment 1 (Figure 4B, blue dots, ρ = 0.6, p = 0.024) and Experi-ment 2 (green dots, ρ = 0.5, p = 0.026). When we combined datafrom both Experiment 1 and 2, we found strong correlationswithin the explicit (ρ = 0.72, p = 1.2 × 10⁻⁶) and the learningtasks (ρ = 0.5, p = 0.0028). This reliable correlation is consistentwith the assumption that risk aversion is a fixed factor specific toeach subject. However, within-subject RAIs across the learning andthe explicit tasks were uncorrelated in both levels of task complex-ity. Within the simple version, the correlation coefficient (ρ) was−0.24 (p = 0.39) in Experiment 1, 0.021 (p = 0.93) in Experiment2 and 0.19 (p = 0.28) when we combined the data from Experi-ment 1 and 2 to increase statistical power (see Figure 4C). Withinthe complex version, we again found no correlation betweenthe tasks (ρ = −0.28, p = 0.31 for Experiment 1; ρ = −0.074,p = 0.76 for Experiment 2; ρ = −0.15, p = 0.39 for combined;see Figure 4D). We show exemplar subjects who showed strik-ing inconsistency between the learning and the explicit tasks inFigures 4E–H.
Wang et al. Conscious and non-conscious decision-making
MEAN CHOICE-WAGER GAP IN THE LEARNING TASK ISUNCORRELATED WITH RAI MEASURED IN THE EXPLICIT TASKTo verify that risk aversion is uncorrelated between tasks, wefurther analyzed the correlation between RAI estimated fromthe explicit task (50% crossing points of the blue curves inFigures 3C,D,G,H) and mean choice-wager gap from the learningtask (i.e., the mean difference between black and red curves from0 to +7 in Figure 2D). RAI from the explicit task did not correlatewith the mean choice-wager gap in the simple (ρ = 0.021,p = 0.94)or complex version (ρ = −0.13, p = 0.65) of Experiment 1 norin the simple (ρ = 0.18, p = 0.45) or complex version (ρ = 0.23,p = 0.34) of Experiment 2.
We also analyzed the correlation between RAI and mean choice-wager gap both estimated from the learning task. Within thelearning task, RAI was correlated with the mean choice-wagergap in the simple (ρ = 0.55, p = 0.034) and the complex ver-sion (ρ = 0.83, p = 0.00012) of Experiment 1 as well as in thesimple (ρ = 0.54, p = 0.014) and the complex version (ρ = 0.48,p = 0.033) of Experiment 2.
Taken together, the gap between actual choice and wageringbehavior in the learning task was not correlated with risk aversionestimated from the explicit task, while it was correlated with therisk aversion estimated from the learning task. This is consistentwith the results presented in Figure 4.
COMPARISON BETWEEN THE SIMPLE AND COMPLEX VERSION OF THETASKWe used a simple and a complex version of the task to allow easy ormore difficult conscious access to the contingencies between decksand their expected outcomes (see Figure 1C and Materials andMethods for details). We expected to observe an increased periodof non-conscious decision making in the complex version as thecomplexity of the payoff histories exceeds the capacity of con-scious working memory (Bechara et al., 1997; Dijksterhuis et al.,2006). When we aligned all the variables at the onset of good deckselection (Figures 3A,B,E,F), the difference between the predictedand the actual probability of high wagers (i.e., the gap between theblue and red curves from trial 0 to +7) was larger in the complexversion than in the simple version (p = 0.0075 for Experiment 1and p = 0.0013 for Experiment 2). This is consistent with the ideathat non-conscious decision making is likely to be induced whenthe task is more complex.
DISCUSSIONThe original IGT has been cited as evidence for non-consciousdecision making. However, due to its unconstrained nature, theremay be alternative explanations other than non-conscious decisionmaking. Here we reported evidence that casts doubt on severalof those alternative explanations. To exclude explanations dueto risk aversion and ambiguity aversion (Fellows, 2004; Dunnet al., 2006; Koch and Preuschoff, 2007; Clifford et al., 2008a,b;Schurger and Sher, 2008; Dienes and Seth, 2010; Fleming andDolan, 2010; Sandberg et al., 2010), we modified the originalIGT in several respects. In particular, we showed that risk aver-sion could not explain the entire effect of non-conscious decisionmaking in our task. Furthermore, we found that risk aversionobserved during the learning task was not correlated with risk
aversion elicited during a similar gambling task with explicitprobabilities. We suggest that these two types of risk aversionmay map onto an emotional feeling of risk on the one hand,and an explicitly accessible representation of risk on the otherhand.
In our learning tasks, subjects were able to discover the gooddecks and stick with them. However, as in Persaud et al. (2007),we found that it generally took several choice–outcome experi-ences from a good deck before subjects were willing to placehigh wagers on the outcomes. Interestingly, some subjects con-tinued to wager low even after selecting from the good deck six toeight trials in a row. The reason for this reluctance to wager highcould be that subjects were unaware of the deck-reward contin-gencies and selected cards using non-conscious decision making(Bechara et al., 1997; Persaud et al., 2007). Alternatively, subjectsmay have been risk-averse and not willing to wager high untilthey were confident enough that they were choosing from thegood deck (Clifford et al., 2008a; Schurger and Sher, 2008). Whatwe found partially supports both explanations: subjects showedstrong risk aversion in our modified version of the IGT, that is,they showed RAI values significantly larger than risk-neutral inall the learning tasks except the simple version in Experiment2. However, this did not account for all of the temporal gapbetween the onsets of optimal choice and advantageous wageringin the experiments. We conclude that people can choose advanta-geously without full awareness of why they do so, at least to someextent.
By carrying out two independent experiments on two poolsof naïve subjects (n = 16 and 20), we replicated most of thefindings. With two different experiments, we ruled out some ofthe potential artifacts, including the effects of (1) the extent ofprior practice, (2) the order of the learning and explicit risk aver-sion task, (3) the presence of trial-by-trial feedback and payment,and (4) the testing environment (one-to-one experiment typicalof psychophysics experiments and group experiments typical ofexperimental economics).
While most effects between the two experiments were sim-ilar, we observed two differences in the simple version of thetask. First, in both the learning and the explicit task, the RAIwas lower for Experiment 2 than Experiment 1. The lower lev-els of risk aversion in Experiment 2 would be expected whenpaying subjects for many trials rather than one, but we can-not rule out the possibility that the other experimental changesplayed a role as well. Second, the RAI was not different betweenthe explicit and learning tasks in the simple version in Experi-ment 2 (Figure 3G). This could be because the simple versionof the task itself may not be optimal to induce the effects thatwe were looking for. This interpretation is consistent with paststudies (Bechara et al., 1997; Dijksterhuis et al., 2006), suggestingthat evidence for non-conscious decision making is more evidentin complex tasks where subjects rely less on conscious workingmemory.
NON-CONSCIOUS DECISION MAKING AND POST-DECISION WAGERINGIn this study, we applied post-decision wagering to assess if advan-tageous decision making can occur non-consciously. While ourwagering procedure asked subjects to simply bet high or low,
Frontiers in Psychology | Cognitive Science February 2012 | Volume 3 | Article 50 | 10
Wang et al. Conscious and non-conscious decision-making
we do not believe that subjects’ confidence level is all or noth-ing, as is sometimes assumed in perceptual consciousness. In fact,we believe that confidence is graded and more or less continu-ous on a trial-by-trial basis, which is the basis of our Bayesianmodel.
Over the last decades, convincing evidence for non-consciousprocessing has been established in at least two ways. First,while showing complete lack of detectability/discriminability (e.g.,chance performance or d′ = 0) of stimuli with a direct task thatassesses awareness of the stimuli, robust non-conscious processinghas been shown with indirect measures, such as behavioral primingeffects and neurophysiological signals (for a review, see Hannulaet al., 2005; Kouider and Dehaene, 2007). Second, above-chancebehavioral performance can be considered to be non-consciouslymediated if the level of conscious confidence, reported in a forcedmanner, is completely uncorrelated with performance (Kolb andBraun, 1995; Kunimoto et al., 2001; Persaud et al., 2007). Non-conscious processing in our task has been established via thesecond method with conscious confidence indirectly assessed withpost-decision wagering.
Recently, the nature of post-decision wagering as a way toassess conscious confidence has been intensely debated (Koch andPreuschoff, 2007; Clifford et al., 2008a; Schurger and Sher, 2008;Dienes and Seth, 2010; Fleming and Dolan, 2010; Sandberg et al.,2010). Some emphasize the advantage of post-decision wagering(Koch and Preuschoff, 2007; Persaud et al., 2007). It is highly intu-itive and easy to administer, even for children (Ruffman et al.,2001) or animals (Kornell et al., 2007; Kiani and Shadlen, 2009),compared to confidence ratings. As post-decision wagering indi-rectly assesses conscious confidence, it is less likely to alter taskperformance than direct confidence ratings, which might affectperformance because it forces subjects to introspect in an unnat-ural way (Koch and Preuschoff, 2007). Furthermore, the monetaryincentives ensure that subjects are motivated to reveal all the infor-mation they have for their advantageous decisions (Persaud et al.,2007).
Others have pointed out disadvantages with post-decisionwagering (Clifford et al., 2008a; Schurger and Sher, 2008; Dienesand Seth, 2010; Fleming and Dolan, 2010; Sandberg et al., 2010).Post-decision wagering may be subject to economic context, whichmight influence conscious confidence. For example, risk aversionmay lead to different wagering behavior even when the underlyingconscious confidence is the same. In fact, using backward maskingin sensory psychophysics, Fleming and Dolan (2010) showed thatrisk aversion discouraged high wagers. Furthermore, Sandberget al. (2010) have suggested that other meta-cognitive measuressuch as a perceptual awareness scale could improve our ability todetect weak conscious confidence.
In our study, we chose post-decision wagering for the assess-ment of conscious confidence because we can use the same wager-ing task during both learning and explicit risk aversion tasks andwe can directly examine the role of risk aversion on an individ-ual basis across two very similar tasks. Future work is needed tosee whether non-conscious, advantageous decision making can beconfirmed with other methods, such as allowing subjects to bet ona continuous scale rather than just high or low.
ADVANTAGES OF OUR MODIFIED VERSION OF THE IGTIt has been argued that the task design of the IGT confoundsseveral factors known to play an important role in decisionmaking (Fellows, 2004; Sanfey and Cohen, 2004; Dunn et al.,2006), which undermined previous attempts to demonstrate non-conscious decision making. We sought to avoid these confoundsby modifying the original IGT in several important ways. First, weincorporated post-decision wagering to indirectly measure sub-jects’ conscious awareness of the deck-payoff contingency in everytrial (Persaud et al., 2007). Second, we introduced a reshufflingprocedure to observe multiple episodes of learning and choicewithin a single subject, resulting in greater statistical power. Sucha feature is desirable not only for behavioral studies like ours,but also for neurophysiological experiments (Fukui et al., 2005;Oya et al., 2005). In fact, despite its wide application in behav-ioral studies, the IGT, which can induce at most a single onsetof awareness, has been used only in a few imaging studies ingood part due to this statistical limitation. Third, we addressedthe concern about heterogeneous priors on the task structure byexplicitly telling the subjects the distributions of payoffs from thefour decks and letting them practice the task. This also helpedto eliminate the effects of ambiguity aversion, which have beenshown to cause subjects to avoid gambles with unknown prob-abilities (Ellsberg, 1963; Camerer and Weber, 1992; Rode et al.,1999; Hsu et al., 2005). This improvement was also critical forour Bayesian modeling analysis. If subjects did not know anythingabout the task structure we could still have used a reinforcementlearning algorithm (Oya et al., 2005), but it is unclear how to com-bine such a model with risk aversion (Bossaerts et al., 2008). In fact,the model comparison (see Appendix) suggests that our Bayesianmodel with knowledge of the task structure performs better inpredicting subjects’ behavior than the one without this knowledgeand other related reinforcement learning models (Busemeyer andStout, 2002).
In fairness to alternative explanations, our experiment did notexplicitly measure subjects’ beliefs about the different deck prob-abilities, and so we cannot rule out the possibility that subjects’beliefs were non-Bayesian. Although our novel gambling task elim-inated ambiguity about the task structure, subjects still had to learnand estimate the probabilities of selecting from a good deck andwere thus facing compound lotteries with potentially inaccurateprobabilities. In the learning task, there is the potential for indi-vidual differences in learning rates, in differential memory forpositive versus negative payoffs, in ability to keep the payoff distri-butions described in the instructions in working memory, and inthe discounting of past outcomes, etc. These individual differenceswould have only affected the learning task but not the explicit task,which could account for the divergence in risk aversion betweenthe tasks. We did observe that the psychometric curves relating theprobability of a high wager to the probability of being a good deck(Figures 3C,D,G,H) were flatter in the learning than in the explicittasks. Though we described it as evidence that subjects become lessrisk sensitive, alternative accounts are also possible. In the learningtask, inaccurate estimation of the probabilities could result in anobserved insensitivity to risk. Further experiments will be neededto address these issues.
Wang et al. Conscious and non-conscious decision-making
MULTIPLE MECHANISMS FOR DECISION MAKING UNDER RISKThe behavioral and neural correlates of decision making underrisk have been extensively investigated and it has been shownthat components of risk, such as variance of probability andreward, influence the activity of midbrain dopamine neuronsas well as the activation of ventral prefrontal, insular, and cin-gulate cortices (Bechara et al., 1999; Critchley et al., 2001;Smith et al., 2002; Fiorillo et al., 2003; Tobler et al., 2007;Christopoulos et al., 2009). Interestingly, Huettel et al. (2006)have argued that decision making under risk and under ambi-guity are supported by distinct mechanisms, with risk preferenceencoded in the posterior parietal cortex and ambiguity pref-erence encoded in the lateral prefrontal cortex. In our study,we did not observe significant correlation between risk aver-sion in the learning and explicit tasks. It is even more intriguingbecause the tasks were so similar and they were done in the samesession, with very similar stimuli and identical payoffs. Impor-tantly, the high correlations of risk aversion between the simpleand complex versions of the task within each of the learningand the explicit task ruled out that the non-significant corre-lations were due to subjects’ confusion, or a lack of statisticalpower.
Inconsistency between risk aversion in the learning and theexplicit tasks (Figure 4) suggests the possibility of two separablepsychological processes for the computation of risk: one processmay depend on an explicit and verbally accessible representationof risk (since this is how the risk information was provided inthe first place), while the other process may depend on an emo-tional feeling of risk based on experienced outcomes that need notbe accessible to explicit verbal report (Loewenstein et al., 2001).Our findings suggest a description–experience gap between riskin explicit and implicit tasks. Recently, some studies have demon-strated this description–experience gap. FitzGerald et al. (2010)showed that the risk of learned options is correlated with activityin the anterior cingulate cortex while the risk of described optionsis correlated with activity in the bilateral anterior insula cortices.Erev et al. (2010) found that decisions from description were pre-dicted best by different models than those that predicted decisionsfrom experience.
Distinctive processes for risk computation have been suggestedin recent studies in normal subjects (Hertwig and Erev, 2009),as well as with lesion patients and psychiatric populations. Whennormal subjects learn probabilities from experience, they can showa reversed risk preference compared to when they are notified ofthe risk through description of the probabilities (Hertwig andErev, 2009). Patients with damage to the ventromedial prefrontal
cortex can cognitively assess appropriate behaviors but cannotact accordingly in real life, a dissociation which is in part repli-cated in the IGT (Anderson et al., 1999; Krajbich et al., 2009).Pathological gamblers are obsessed by risky gambles (Holden,2001; Potenza et al., 2001). With some drug treatments, theirrisk aversion can be enhanced to a level higher than in healthycontrols (Brañas-Garza et al., 2007), however, their pathologi-cal behaviors are prone to relapse in real life (Holden, 2001).Interestingly, these clinical populations are capable of comput-ing risks cognitively. However, they fail to choose appropriatelyin everyday life, possibly because of an inability to implementrisk mechanisms based on emotional feelings (Loewenstein et al.,2001).
While Dienes and Seth (2010) found correlation between riskaversion and the degree of non-conscious knowledge inferred fromwagering, we did not get an analogous result. We believe that ourtwo separate risk models described above could explain this dis-cordance. For tasks that do not involve learning and emotionalfeeling of risks, such as those employed by Dienes and Seth, theexplicit risk mechanism is likely at work. Obviously, further studiesare needed to test these ideas.
Taken together with these other results, the present findingssuggest that these two processes for risk computation may besubserved by distinctive neuronal mechanisms within the pre-frontal cortex (Tobler et al., 2007; Christopoulos et al., 2009),posterior cingulate cortex (McCoy and Platt, 2005), and insulaor components of the basal ganglia (Preuschoff et al., 2006).Whether emotional experiences (Damasio, 1994; Bechara et al.,1997, 2000) guide subjects in our learning task in a non-conscious manner is an important open question for futurestudies.
AUTHOR CONTRIBUTIONSShuo Wang, Ian Krajbich, Ralph Adolphs, and Naotsugu Tsuchiyadesigned research; Shuo Wang performed research; Shuo Wang,Ian Krajbich and Naotsugu Tsuchiya analyzed data; and ShuoWang, Ian Krajbich, Ralph Adolphs, and Naotsugu Tsuchiya wrotethe paper.
ACKNOWLEDGMENTSWe thank C. Camerer and four reviewers for valuable comments.This work has been supported by grants from the Gordon andBetty Moore Foundation and the National Science Foundationto Ralph Adolphs. Naotsugu Tsuchiya thanks the Japan Societyfor the Promotion of Science and Japan Science and TechnologyAgency for their support.
REFERENCESAnderson, S. W., Bechara, A., Dama-
sio, H., Tranel, D., and Dama-sio, A. R. (1999). Impairment ofsocial and moral behaviour relatedto early damage in human pre-frontal cortex. Nat. Neurosci. 2,1032–1037.
Bechara, A., Damasio, A. R., Dama-sio, H., and Anderso, S. W. (1994).
Insensitivity to future consequencesfollowing damage to human pre-frontal cortex. Cognition 50, 7–15.
Bechara, A., Damasio, H., and Dama-sio, A. R. (2000). Emotion, decisionmaking and the orbitofrontal cortex.Cereb. Cortex 10, 295–307.
Bechara, A., Damasio, H., Damasio, A.R., and Lee, G. P. (1999). Differentcontributions of the human
amygdala and ventromedial pre-frontal cortex to decision-making. J.Neurosci. 19, 5473–5481.
Bechara, A., Damasio, H., Tranel, D.,and Damasio, A. R. (1997). Decidingadvantageously before knowing theadvantageous strategy. Science 275,1293–1295.
Bechara, A., Damasio, H., Tranel, D.,and Damasio, A. R. (2005). The
Iowa Gambling Task and the somaticmarker hypothesis: some questionsand answers. Trends Cogn. Sci.(Regul. Ed.) 9, 159–162.
Benjamini, Y., and Hochberg, Y. (1995).Controlling the false discovery rate:a practical and powerful approachto multiple testing. J. R. Stat.Soc. Series B Stat. Methodol. 57,289–300.
Frontiers in Psychology | Cognitive Science February 2012 | Volume 3 | Article 50 | 12
Wang et al. Conscious and non-conscious decision-making
Bossaerts, P., Preuschoff, K., and Hsu,M. (2008). “The neurobiologicalfoundations of valuation in humandecision making under uncertainty,”in Neuroeconomics: Decision Makingand the Brain, eds P. W. Glimcher,E. Fehr, A. Rangel, C. Camerer, andR. A. Poldrack (New York: Elsevier),351–364.
Brañas-Garza, P., Georgantzís, N., andGuillen, P. (2007). Direct and indi-rect effects of pathological gamblingon risk attitudes. Judgm. Decis. Mak.2, 126–136.
Brodersen, K. H., Penny, W. D., Har-rison, L. M., Daunizeau, J., Ruff,C. C., Duzel, E., Friston, K. J.,and Stephan, K. E. (2008). Inte-grated Bayesian models of learningand decision making for saccadiceye movements. Neural Netw. 21,1247–1260.
Busemeyer, J. R., and Stout, J. C.(2002). A contribution of cog-nitive decision models to clini-cal assessment: decomposing per-formance on the bechara gam-bling task. Psychol. Assess. 14,253–262.
Camerer, C., and Weber, M. (1992).Recent developments in model-ing preferences: uncertainty andambiguity. J. Risk Uncertain 5,325–370.
Christopoulos, G. I., Tobler, P. N.,Bossaerts, P., Dolan, R. J., andSchultz, W. (2009). Neural corre-lates of value, risk, and risk aver-sion contributing to decision mak-ing under risk. J. Neurosci. 29,12574–12583.
Clifford, C. W. G., Arabzadeh, E.,and Harris, J. A. (2008a). Get-ting technical about awareness.Trends Cogn. Sci. (Regul. Ed.) 12,54–58.
Clifford, C. W. G., Arabzadeh, E.,and Harris, J. A. (2008b). Agood bet to measure awareness?Trends Cogn. Sci. (Regul. Ed.) 12,210–210.
Critchley, H. D., Mathias, C. J., andDolan, R. J. (2001). Neural activ-ity in the human brain relat-ing to uncertainty and arousalduring anticipation. Neuron 29,537–545.
Damasio, A. R. (1994). Descartes’ Error:Emotion, Reason, and the HumanBrain. New York: Grosset/Putnam.
Daw, N. D., Niv, Y., and Dayan, P.(2005). Uncertainty-based compe-tition between prefrontal and dor-solateral striatal systems for behav-ioral control. Nat. Neurosci. 8,1704–1711.
Dienes, Z. N., and Seth, A. (2010).Gambling on the unconscious: a
comparison of wagering and confi-dence ratings as measures of aware-ness in an artificial grammar task.Conscious. Cogn. 19, 674–681.
Dijksterhuis, A., Bos, M. W., Nord-gren, L. F., and van Baaren, R. B.(2006). On making the right choice:the deliberation-without-attentioneffect. Science 311, 1005–1007.
Dunn, B. D., Dalgleish, T., andLawrence, A. D. (2006). The somaticmarker hypothesis: a critical eval-uation. Neurosci. Biobehav. Rev. 30,239–271.
Ellsberg, D. (1963). Risk, ambiguity, andthe savage axioms: reply. Q. J. Econ.77, 336–342.
Erev, I., Ert, E., Roth, A. E., Haruvy,E., Herzog, S. M., Hau, R., Her-twig, R., Stewart, T., West, R.,and Lebiere, C. (2010). A choiceprediction competition: choicesfrom experience and from descrip-tion. J. Behav. Dec. Mak. 23,15–47.
Fellows, L. K. (2004). The cognitive neu-roscience of human decision mak-ing: a review and conceptual frame-work. Behav. Cogn. Neurosci. Rev. 3,159–172.
Fiorillo, C. D., Tobler, P. N., andSchultz, W. (2003). Discrete codingof reward probability and uncer-tainty by dopamine neurons. Science299, 1898–1902.
FitzGerald, T. H. B., Seymour, B.,Bach, D. R., and Dolan, R. J.(2010). Differentiable neural sub-strates for learned and describedvalue and risk. Curr. Biol. 20,1823–1829.
Fleming, S. M., and Dolan, R. J. (2010).Effects of loss aversion on post-decision wagering: implications formeasures of awareness. Conscious.Cogn. 19, 352–363.
Fukui, H., Murai, T., Fukuyama,H., Hayashi, T., and Hanakawa,T. (2005). Functional activityrelated to risk anticipation dur-ing performance of the IowaGambling Task. Neuroimage 24,253–259.
Ghahramani, Z. (2001). An introduc-tion to hidden Markov models andBayesian networks. Intern. J. PatternRecognit. Artif. Intell. 15, 9–42.
Hampton, A. N., Bossaerts, P., andO’Doherty, J. P. (2006) The roleof the ventromedial prefrontal cor-tex in abstract state-based inferenceduring decision making in humans.J. Neurosci. 26, 8360–8367.
Hannula, D. E., Simons, D. J., andCohen, N. J. (2005). Imagingimplicit perception: promise andpitfalls. Nat. Rev. Neurosci. 6,247–255.
Harrison, G. W., Johnson, E., McInnes,M. M., and Rutström, E. E. (2005).Temporal stability of estimates ofrisk aversion. Appl. Financ. Econ.Lett. 1, 31–35.
Hertwig, R., and Erev, I. (2009).The description experience gap inrisky choice. Trends Cogn. Sci. 13,517–523.
Holden, C. (2001). Addiction: ‘behav-ioral’ addictions: do they exist? Sci-ence 294, 980–982.
Holt, C. A., and Laury, S. K. (2002). Riskaversion and incentive effects. Am.Econ. Rev. 92, 1644–1655.
Hsu, M., Bhatt, M., Adolphs, R., Tranel,D., and Camerer, C. F. (2005). Neuralsystems responding to degrees ofuncertainty in human decision-making. Science 310, 1680–1683.
Huettel, S. A., Stowe, C. J., Gordon,E. M., Warner, B. T., and Platt, M.L. (2006). Neural signatures of eco-nomic preferences for risk and ambi-guity. Neuron 49, 765–775.
Kahneman, D., and Tversky, A. (1979).Prospect theory: an analysis ofdecision under risk. Econometrica263–291.
Kiani, R., and Shadlen, M. N. (2009).Representation of confidence asso-ciated with a decision by neuronsin the parietal cortex. Science 324,759–764.
Koch, C., and Preuschoff, K. (2007).Betting the house on consciousness.Nat. Neurosci. 10, 140–141.
Kolb, F. C., and Braun, J. (1995). Blind-sight in normal observers. Nature377, 336–338.
Kornell, N., Son, L. K., and Terrace, H.S. (2007). Transfer of metacognitiveskills and hint seeking in monkeys.Psychol. Sci. 18, 64–71.
Kouider, S., and Dehaene, S. (2007).Levels of processing during non-conscious perception: a criticalreview of visual masking. Philos.Trans. R. Soc. Lond B Biol. Sci. 362,857–875.
Krajbich, I., Adolphs, R., Tranel, D.,Denburg, N. L., and Camerer, C.F. (2009). Economic games quantifydiminished sense of guilt in patientswith damage to the prefrontal cor-tex. J. Neurosci. 29, 2188–2192.
Kunimoto, C., Miller, J., and Pashler,H. (2001). Confidence and accu-racy of near-threshold discrimina-tion responses. Conscious. Cogn. 10,294–340.
Loader, C. (1999). Local Regression andLikelihood. New York: Springer.
Loewenstein, G. F., Weber, E. U., Hsee,C. K., and Welch, N. (2001). Risk asfeelings. Psychol. Bull. 127, 267–286.
Maia, T. V., and McClelland, J. L. (2004).A reexamination of the evidence for
the somatic marker hypothesis: whatparticipants really know in the IowaGambling task. Proc. Natl. Acad. Sci.U.S.A. 101, 16075–16080.
Maia, T. V., and McClelland, J. L.(2005). The somatic marker hypoth-esis: still many questions but noanswers: response to Bechara et al.Trends Cogn. Sci. (Regul. Ed.) 9,162–164.
McCoy, A. N., and Platt, M. L. (2005).Risk-sensitive neurons in macaqueposterior cingulate cortex. Nat. Neu-rosci. 8, 1220–1227.
Mitra, P., and Bokil, H. (2008). ObservedBrain Dynamics. New York: OxfordUniversity Press.
Oya, H., Adolphs, R., Kawasaki, H.,Bechara, A., Damasio, A., andHoward, M. A. III. (2005). Elec-trophysiological correlates of rewardprediction error recorded in thehuman prefrontal cortex. Proc. Natl.Acad. Sci. U.S.A. 102, 8351–8356.
Potenza, M. N., Kosten, T. R., and Roun-saville, B. J. (2001). Pathologicalgambling. JAMA 286, 141–144.
Preuschoff, K., Bossaerts, P., and Quartz,S. R. (2006). Neural differentia-tion of expected reward and risk inhuman subcortical structures. Neu-ron 51, 381–390.
Rabin, M. (2000). Risk aversion andexpected-utility theory: a calibra-tion theorem. Econometrica 68,1281–1292.
Rode, C., Cosmides, L., Hell, W., andTooby, J. (1999). When and whydo people avoid unknown probabil-ities in decisions under uncertainty?Testing some predictions from opti-mal foraging theory. Cognition 72,269–304.
Ruffman, T., Garnham, W., Import, A.,and Connolly, D. (2001). Does eyegaze indicate implicit knowledge offalse belief? charting transitions inknowledge. J. Exp. Child. Psychol. 80,201–224.
Sandberg, K., Timmermans, B., Over-gaard, M., and Cleeremans, A.(2010). Measuring conscious-ness: is one measure better thanthe other? Conscious. Cogn. 19,1069–1078.
Sanfey, A. G., and Cohen, J. D. (2004). Isknowing always feeling? Proc. Natl.Acad. Sci. U.S.A. 101, 16709–16710.
Schurger, A., and Sher, S. (2008). Aware-ness, loss aversion, and post-decisionwagering. Trends Cogn. Sci. (Regul.Ed.) 12, 209–210.
Smith, K., Dickhaut, J., McCabe, K.,and Pardo, J. V. (2002). Neuronal
Wang et al. Conscious and non-conscious decision-making
substrates for choice under ambigu-ity, risk, gains, and losses. Manage.Sci. 48, 711–718.
Stoerig, P., Zontanou, A., and Cowey,A. (2002). Aware or unaware: assess-ment of cortical blindness in fourmen and a monkey. Cereb. Cortex 12,565–574.
Tobler, P. N., O’Doherty, J. P., Dolan, R.J., and Schultz, W. (2007). Rewardvalue coding distinct from riskattitude-related uncertainty coding
in human reward systems. J. Neuro-physiol. 97, 1621–1632.
Tomb, I., Hauser, M., Deldin, P., andCaramazza, A. (2002). Do somaticmarkers mediate decisions on thegambling task? Nat. Neurosci. 5,1103–1104.
Conflict of Interest Statement: Theauthors declare that the research wasconducted in the absence of any
commercial or financial relationshipsthat could be construed as a potentialconflict of interest.
Received: 13 October 2011; accepted: 09February 2012; published online: 27 Feb-ruary 2012.Citation: Wang S, Krajbich I, AdolphsR and Tsuchiya N (2012) The roleof risk aversion in non-conscious deci-sion making. Front. Psychology 3:50. doi:10.3389/fpsyg.2012.00050
Wang et al. Conscious and non-conscious decision-making
APPENDIXBAYESIAN INFERENCE MODEL: ASSUMPTION AND VALIDATIONWe constructed a Bayesian inference model to estimate the prob-ability of each deck being the good deck. This estimated prob-ability would be a good proxy of how actual subjects wouldfeel about each deck (1) if subjects have perfect memory of thepayoff structure and can keep track of the Bayesian probabilityassociated with each deck (assuming the Markov property) and(2) if subjects understand and utilize the structure of the gam-bling task. Further, (3) if subjects were to select the deck andto wager on the chosen card based on the Bayesian probability,we should be able to predict the choice and the wager behaviorwell.
We quantified the performance of the Bayesian model in theirability to predict subjects’ choices and wagers on a trial-by-trial basis using signal detection theory (SDT; Macmillan andCreelman, 2005).
For prediction of a choice in a given trial, we say that the modelmade a correct prediction (i.e., hit) when it assigned the highestBayesian probability to the deck that the subject actually chose inthat trial. If the model assigned the highest probability to an uns-elected deck, we regarded it as a false alarm. Further, we regardedthe assigned highest probability as the confidence the model hadin each prediction. By shifting the threshold for this confidence ofthe model from zero to one, we were able to construct ROC curves,which quantify how successfully the model could predict subjects’behavior. For the following analysis, we computed the area underthe ROC curve, which we call A′ for short. A′ for the choice was0.80 ± 0.13 (mean ± SD) for the simple version and 0.80 ± 0.11 forthe complex version in Experiment 1, and 0.77 ± 0.13 for the sim-ple version and 0.74 ± 0.14 for the complex version in Experiment2.
For prediction of wagering in a given trial, the model alwayspredicts a high wager with a confidence expressed as the assignedprobability for the chosen deck. Again, by shifting the confidencethreshold, we constructed ROC curves and computed A′ for thewager prediction. A′ for the wagering was 0.87 ± 0.11 for thesimple version and 0.77 ± 0.13 for the complex version in Exper-iment 1, and 0.84 ± 0.12 for the simple version and 0.82 ± 0.16for the complex version in Experiment 2. Although it is far fromperfect (i.e., A′ = 1; p < 0.0005), A′ was significantly higher thanchance [chance A′ would be 0.5, A′ > 0.5 with p < 10−6 (t -test)].
There could be several reasons why subjects’ choices and wagerswere sub-optimal. First, subjects may not remember the payoffstructures and lose track of the Bayesian probabilities (assumption1 was wrong). This may be the case for the complex version, but ishighly unlikely for the simple version. Second, subjects might nothave understood or utilized the task structure. We took great careto familiarize subjects with the procedures, showed them the pay-off structures (Figure 1C) and even explained the optimal strategy(see Materials and Methods) prior to the experiment. In Experi-ment 1, there were three practice sessions before entering the finalcritical sessions. Still, it is possible that subjects may have adoptedother strategies, such as the “gambler’s fallacy”; A spurious beliefsuch as “after three positive outcomes in a row, I tend to receive anegative outcome” might have affected their decisions, which wedid not model.
Below, we describe our implementation of the Bayesian model.Assuming a subject satisfies assumptions 1 and 2, we can computethe Bayesian probability of each deck being the good deck as:
pi,t = P(Di,t = Good), i = 1, 2, 3, 4 (A1)
Where pi,t denotes the probability of deck i being the good deck attrial t, and Di,t represents the state of deck i at trial t (Di,t = Goodor Di,t = Bad).
In the simple version of the learning task, there is only one gooddeck, thus the sum of pi,t across the four decks is equal to 1.
∑
i=1,2,3,4
pi,t = 1 (A2)
In the complex version, there are two good decks, thus the sumof pi,t across the decks is equal to 2.
∑
i=1,2,3,4
pi,t = 2 (A3)
After each trial, we update pi,t+1 using the Bayesian updatingrule based on the behavior and the outcome at trial t. We used atwo-stage updating rule, first for the selected deck and then theother three unselected decks.
The Bayesian updating rule for the selected deckWe applied the Bayesian model to update the probability of decki being a good deck at trial t + 1 (pi,t+1) based on the probabilityof deck i being a good deck at trial t (pi,t) and the actual payoff(value) observed at trial t (Vt, representing the reward or loss thesubject received at trial t ) as follows:
The updating rule for the unselected decksFollowing the update of pi,t+1 for the selected deck, we updatedpi,t+1 for the other decks that were not selected at trial t. FollowingEqs A2 and A3, we updated the probability of each unselected deckbeing a good deck at trial t + 1 based on pi,t and the behavior andthe outcome at trial t as follows:
(a) If the selected deck gave a reward (i.e., Vt > 0),
Wang et al. Conscious and non-conscious decision-making
(b) If the selected deck gave a punishment (i.e., Vt < 0),
pi,t+1 = pi,t + 1 − pi,t∑i={1,2,3,4}, i �=Ai
(1 − pi,t
) ·(pA,t − pA,t+1)
(A6)
At the beginning of the experiment as well as after the reshuffleof the deck-reward contingency, we reset pi,t to 0.25 and 0.5 forthe simple and the complex versions, respectively.
Equations A4–A6 have the Markov property that only knowl-edge of the probabilities (pi,t, i = 1,2,3,4), selected action (At), andthe value of the action (Vt) from the current trial are needed tocalculate the probabilities of the next trial (pi,t+1, i = 1,2,3,4).
MODEL COMPARISONWe compared the performance of four other models to that of oursin predicting subjects’ choices and wagers. Here, we used modelsthat represent three popular conceptual variants in the decisionmaking literature, especially the ones that were applied to the realdata in the IGT (Busemeyer and Stout, 2002). We replicated Buse-meyer and Stout’s four models: a Strategy-Switching HeuristicChoice Model (Heuristic for short), a Bayesian-Expected Util-ity Model (Bayes_EU for short), an Expectancy–Valence Learning
Model (this is essentially a reinforcement learning model, RL forshort), and a Baseline Model. We followed the exact definitionof these models and the readers can refer to (Busemeyer andStout, 2002) for the details of these models. While these mod-els used three free parameters, our Bayesian model did not haveany free parameters to fit. However, our Bayesian updating rulesand inclusion of the knowledge of the task structure constrainsthe model in a way that may not be suitable for different tasksother than ours. Thus, comparisons of the model based on thenumber of free parameters or residual error in fitting are not wellsuited. Thus, we relied on the predictive performance based onSDT (Macmillan and Creelman, 2005) as a framework for modelcomparison.
We tuned three parameters for a given set of the data (i.e., eachsubject had the simple and the complex version of the learningtask, resulting in six free parameters) in each of these models care-fully to ensure that the models were well fitted. We quantifiedwhether each model could predict subjects’ choice and wageringbehavior using SDT as we did for our model. The results of themodel comparison are shown in Figure A1.
As can be seen from the figure, three models from Buse-meyer and Stout (2002), namely Baseline model, Heuristic model,
FIGURE A1 | Model comparison results of Experiment 1 (A,B,E,F) and
Experiment 2 (C,D,G,H). A′ (y -axis) was computed to quantify how well eachmodel (labeled on x -axis) can predict deck choice (A–D) and wageringbehavior (E–H). Simple (A,C,E,G) and complex (B,D,F,H) versions wereanalyzed separately. Each black dot represents A′ of an individual subject.
Green squares denote the median of A′. Error bars denote 1 SEM acrosssubjects. RL, Busemeyer and Stout’s (2002) reinforcement learning model(blue bars); Bayesian, our Bayesian inference model (red bars); Bayesian (w/oK n), a version of our Bayesian inference model without incorporating theknowledge of the task structure (magenta bars).
Frontiers in Psychology | Cognitive Science February 2012 | Volume 3 | Article 50 | 16
Wang et al. Conscious and non-conscious decision-making
Table A1 | Comparisons of prediction performance for deck choice.
B and S RL Our Bayesian p-Value
Exp 1 simple 0.77 ± 0.13 0.80 ± 0.13 p = 0.16
Exp 1 complex 0.83 ± 0.13 0.80 ± 0.11 p = 0.17
Exp 2 simple 0.78 ± 0.10 0.77 ± 0.13 p = 0.69
Exp 2 complex 0.83 ± 0.11 0.74 ± 0.14 p = 0.0014
Mean ± 1 SD.
and Bayes_EU model, performed poorly in all cases and wewill not describe them further. This trend is consistent withBusemeyer and Stout’s (2002) model evaluation using G2 mea-sures.
For predicting deck choice (Figures A1A–D), Busemeyer andStout’s (2002) RL model (blue bars) performed similarly to ourBayesian inference model (red). For the details, see Table A1. Weevaluated the significance of the difference with p-values fromtwo-tailed paired t -tests.
For predicting wagering behavior (Figures A1E–H), the RLmodel performed significantly worse than our Bayesian inferencemodel (red). For the details, see Table A2. We evaluated the sig-nificance of the difference with p-values from two-tailed pairedt -tests.
Table A2 | Comparisons of prediction performance for wagering
behavior.
B and S RL Our Bayesian p-Value
Exp 1 simple 0.80 ± 0.11 0.87 ± 0.11 p = 0.032
Exp 1 complex 0.66 ± 0.10 0.77 ± 0.13 p = 0.0015
Exp 2 simple 0.75 ± 0.13 0.84 ± 0.12 p = 0.0043
Exp 2 complex 0.68 ± 0.13 0.82 ± 0.16 p = 0.00022
Further, in all cases, our Bayesian inference model (red bars inFigure A1) outperformed a variant of this Bayesian model thatdoes not incorporate knowledge of the task structure (magentabars in Figure A1, paired t -test, p < 0.05 in all cases).
Taken together, we conclude that the RL model predicts choicebehavior equally well or slightly better than our Bayesian inferencemodel while it predicts wagering behavior much worse than ourmodel in all cases.
REFERENCESBusemeyer, J. R., and Stout, J. C. (2002). A contribution of cognitive decision models
to clinical assessment: decomposing performance on the bechara gambling task.Psychol. Assess. 14, 253–262.
Macmillan, N. A., and Creelman, D. C. (2005). Detection Theory: A User’s Guide.Mahwah, NJ: Lawrence Erlbaum.