51
The Role of Satellite Remote Sensing in Climate Change Studies Jun Yang Center for Earth System Science Tsinghua University Frontier of Earth System Science Seminar No.8 Spring 2013

The Role of Satellite Remote Sensing in Climate Change Studies
Jun Yang
Center for Earth System Science
Tsinghua University
Frontier of Earth System Science Seminar No.8
Spring 2013

Outline
4 Limitations
3 Integration with climate models
2 Observation of the climate system
1 Introduction
5 Prospects

1. INTRODUCTION
Outline

Climate observation
-the foundation of our understanding of the climate system (Overpeck, 2011, Science)
1. Introduction
(Source: Yang et al. under review)

What is satellite remote sensing?
-acquires information about the Earth’s surface and its atmosphere remotely from sensors onboard satellites.
1. Introduction
(Source: NASA 2011)

1. Introduction
Why satellite remote sensing?
•Observing the climate
system at multiple spatio-
temporal scales
•E.g.
The most efficient
approaches to monitor
land cover and its
changes in time over a
variety of spatial scales. (Bontemps et al., 2011,
Biogeosciences Discuss;
Gong et al., 2012, Int. J.
Remote Sens. )
Tucker et al., 1985, Science

Why satellite remote sensing?
Improvement of meteorological reanalysis
data
• E.g.
– National Center for Environmental Prediction (NCEP)
reanalysis
– European Center for Medium Range Weather Forecasts
(ECMWF)
1. Introduction

Why satellite remote sensing?
The Global Climate Observing System
(GCOS) declared 26 out of 50 essential
climate variables (ECVs) as significantly
dependent upon satellite observations. (GCOS, 2010)
1. Introduction

Why satellite remote sensing?
SRS are used for developing prevention,
mitigation and adaptation measures to cope
with the impacts of climate change.(Joyce et al.,
2009, Prog. Phys.Geog.)
1. Introduction

2. Observation of the climate system

Climate system
-observe the spatio-temporal states and processes of the climate system
1. Observation of the climate system
(Source: www.worldoceanreview.com)
H y d r o s p h e r e
A t m o s p h e r e
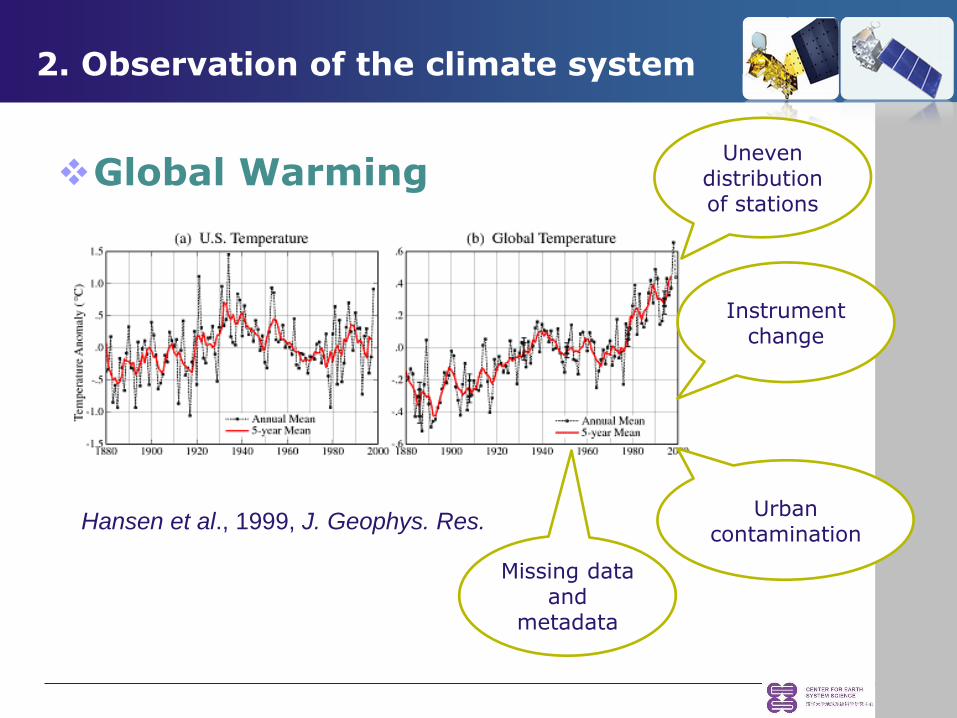
Global Warming
2. Observation of the climate system
Hansen et al., 1999, J. Geophys. Res.
Uneven distribution of stations
Instrument change
Urban contamination
Missing data and
metadata

Global Warming
Atmospheric temperature
2. Observation of the climate system
-Increase of CO2 will increase the
atmospheric temperature
-Enhanced maximum warming in the
tropical upper troposphere
Manabe and Wetherald, 1967, 1975,
J. Atmos. Sci
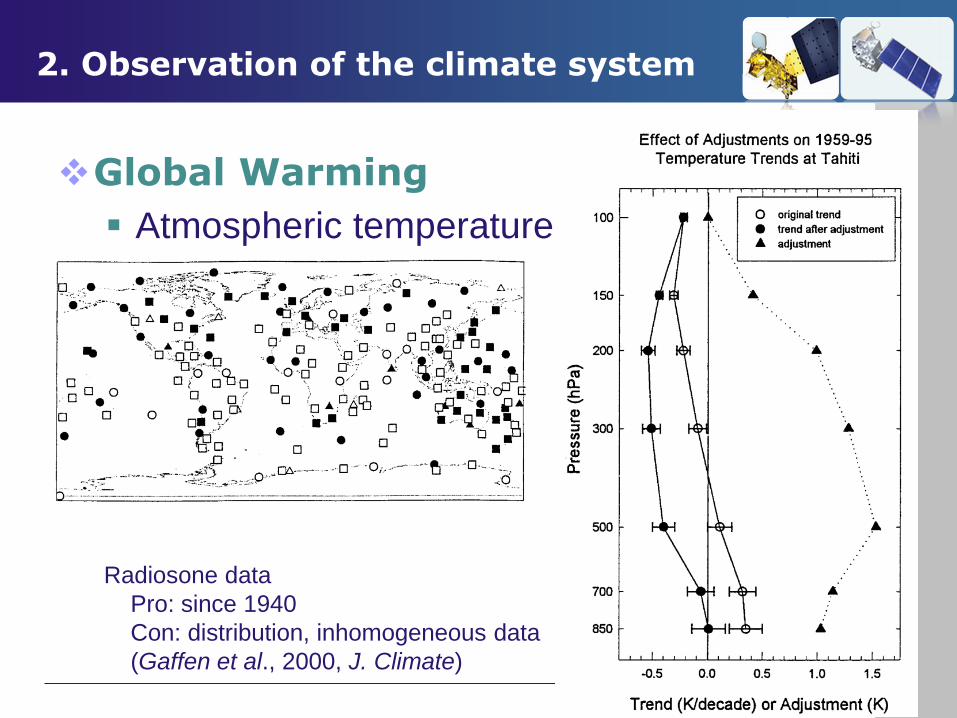
Global Warming
Atmospheric temperature
2. Observation of the climate system
Radiosone data
Pro: since 1940
Con: distribution, inhomogeneous data
(Gaffen et al., 2000, J. Climate)
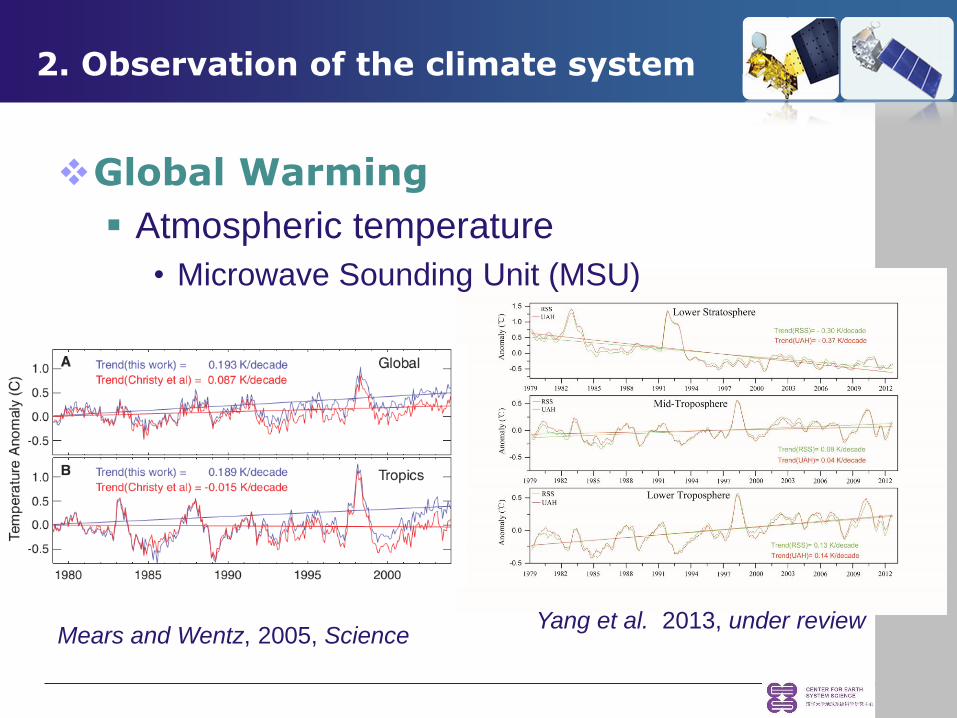
Global Warming
Atmospheric temperature
• Microwave Sounding Unit (MSU)
2. Observation of the climate system
Mears and Wentz, 2005, Science Yang et al. 2013, under review
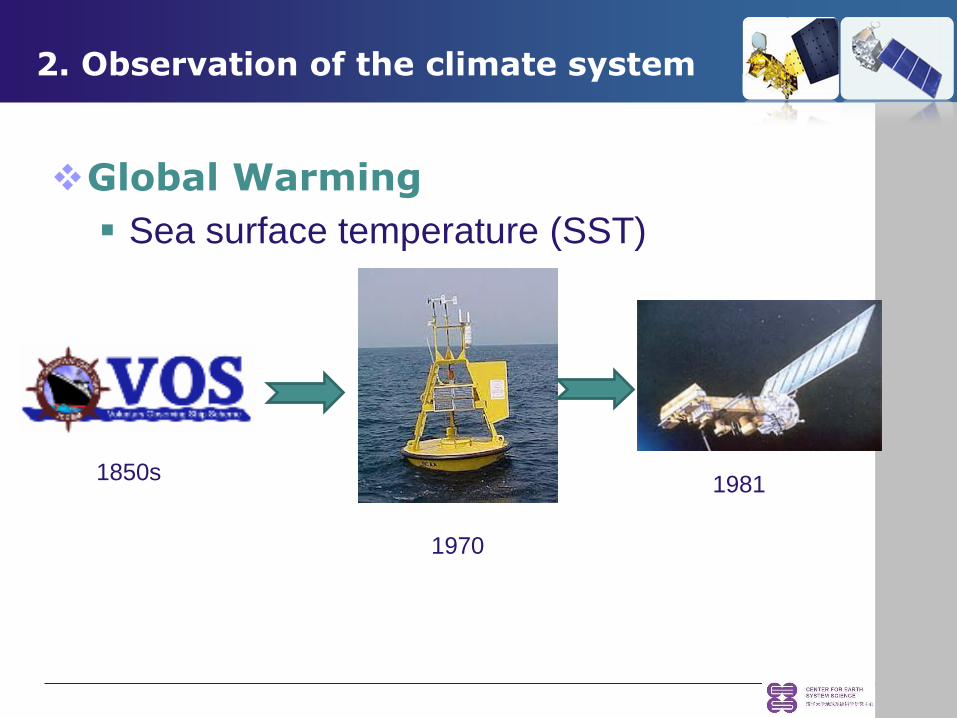
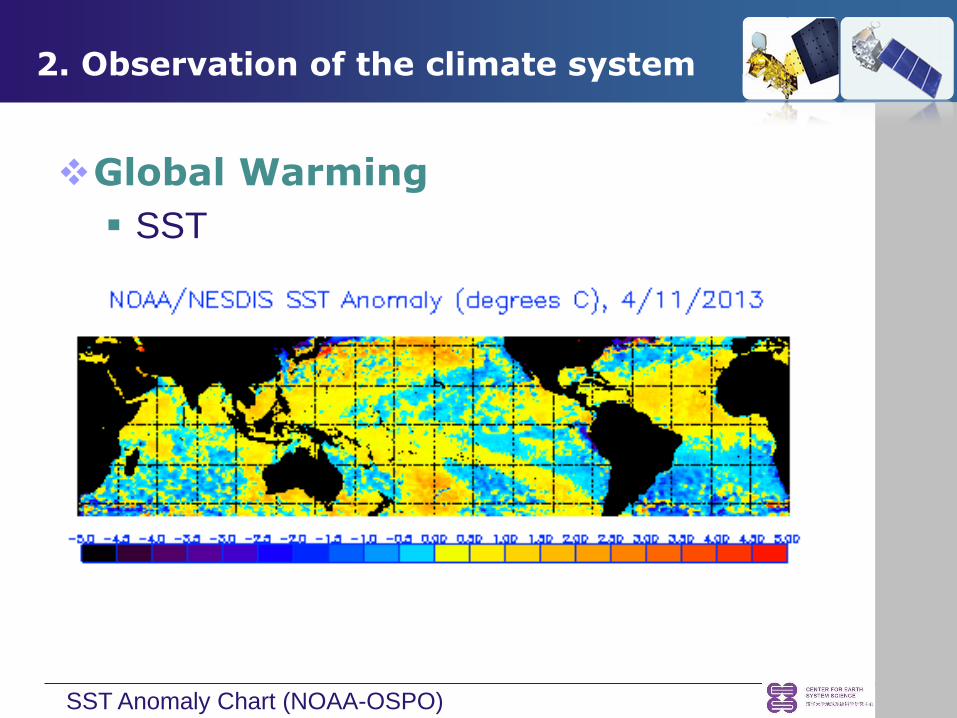
Global Warming
Sea surface temperature (SST)
2. Observation of the climate system
1850s
1970
1981
Global Warming
SST
2. Observation of the climate system
SST Anomaly Chart (NOAA-OSPO)

Global Warming
SST
• Slow down of sea
surface warming in
the last decade
• “Missing heat”
• Balmaseda et al., 2013, Geophys. Res. Lett.
2. Observation of the climate system
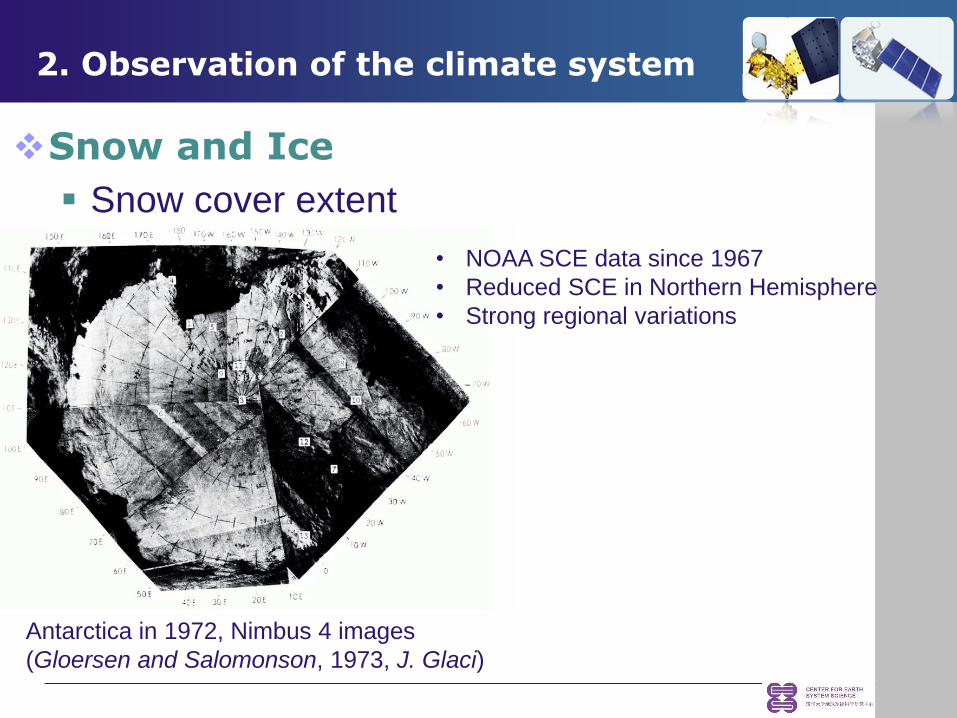
Snow and Ice
Snow cover extent
2. Observation of the climate system
Antarctica in 1972, Nimbus 4 images
(Gloersen and Salomonson, 1973, J. Glaci)
• NOAA SCE data since 1967
• Reduced SCE in Northern Hemisphere
• Strong regional variations

Snow and Ice
Sea ice extent (SMMR, SSMI, SSMIS)
2. Observation of the climate system
Map of sea ice extent in Southern Hemisphere (1979-2010)
Parkinson and Cavalieri. 2012, Cryosphere

Snow and Ice
Sea ice extent
2. Observation of the climate system
Map of sea ice extent in Northern Hemisphere (1979-2010)
Cavalieri and Parkinson, 2012, Cryosphere
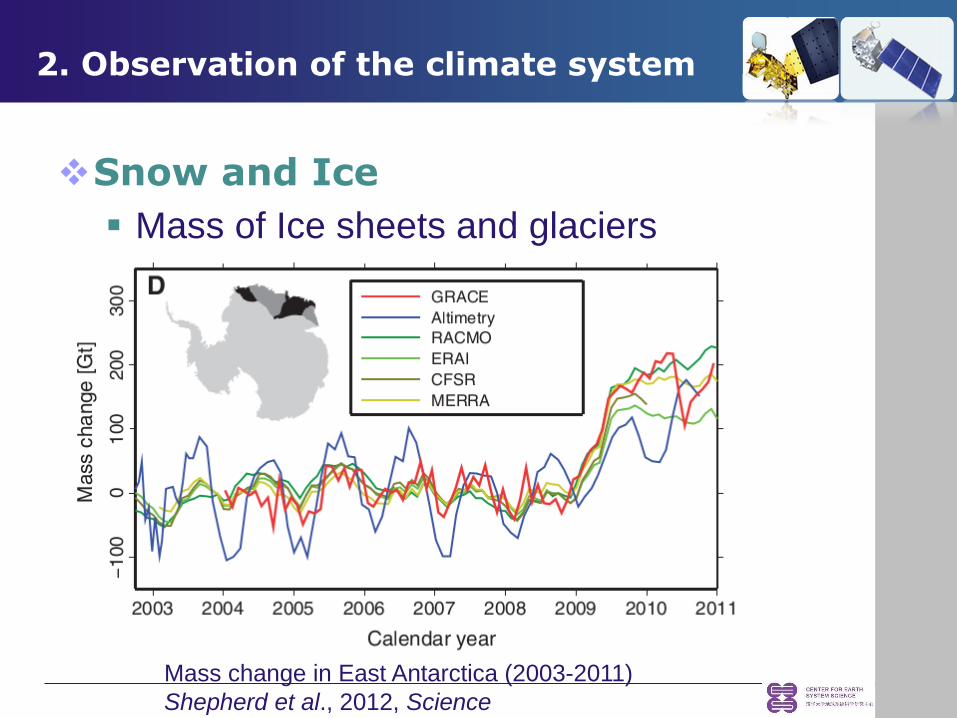
Snow and Ice
Mass of Ice sheets and glaciers
2. Observation of the climate system
Mass change in East Antarctica (2003-2011)
Shepherd et al., 2012, Science

Snow and Ice
Mass of Ice sheets and glaciers
1. Observation of the climate system
Glacial-isostatic
adjustment (GIA)
Short time span
Density of ice

Snow and Ice
Mass of Ice sheets and glaciers
2. Observation of the climate system
Changes in ice velocity measured by
ERS-1/2 (Rignot et al., 2004, GRL),
Ice-ocean interaction drives much of
the recent increase in mass loss from
Antarctic and Greenland ice sheets
-Joughin et al., 2012, Science
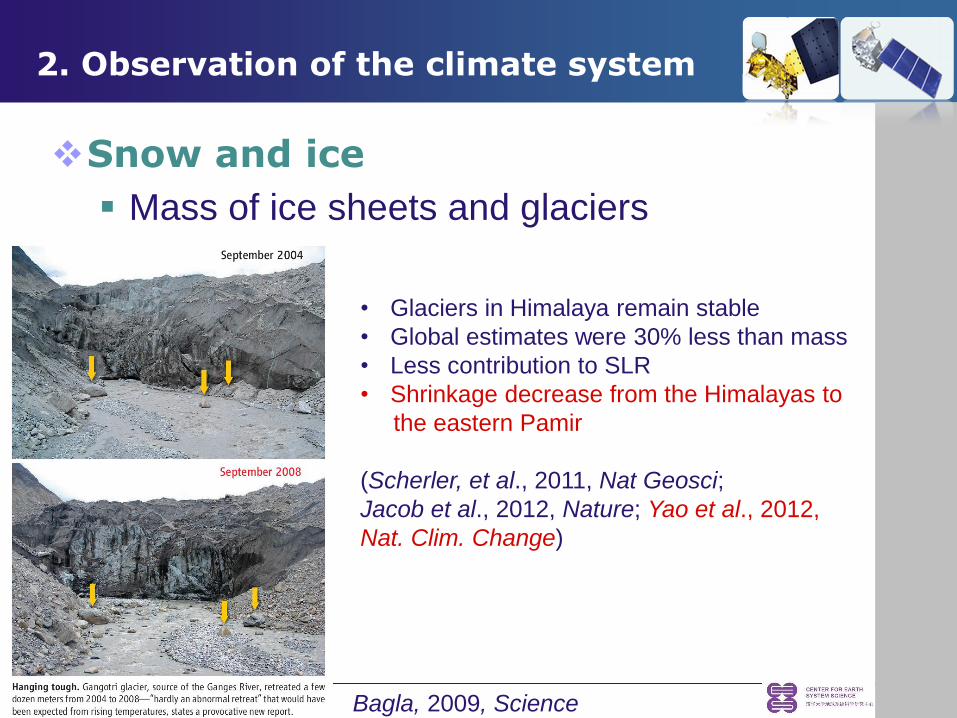
Snow and ice
Mass of ice sheets and glaciers
2. Observation of the climate system
Bagla, 2009, Science
• Glaciers in Himalaya remain stable
• Global estimates were 30% less than mass
• Less contribution to SLR
• Shrinkage decrease from the Himalayas to
the eastern Pamir
(Scherler, et al., 2011, Nat Geosci;
Jacob et al., 2012, Nature; Yao et al., 2012,
Nat. Clim. Change)
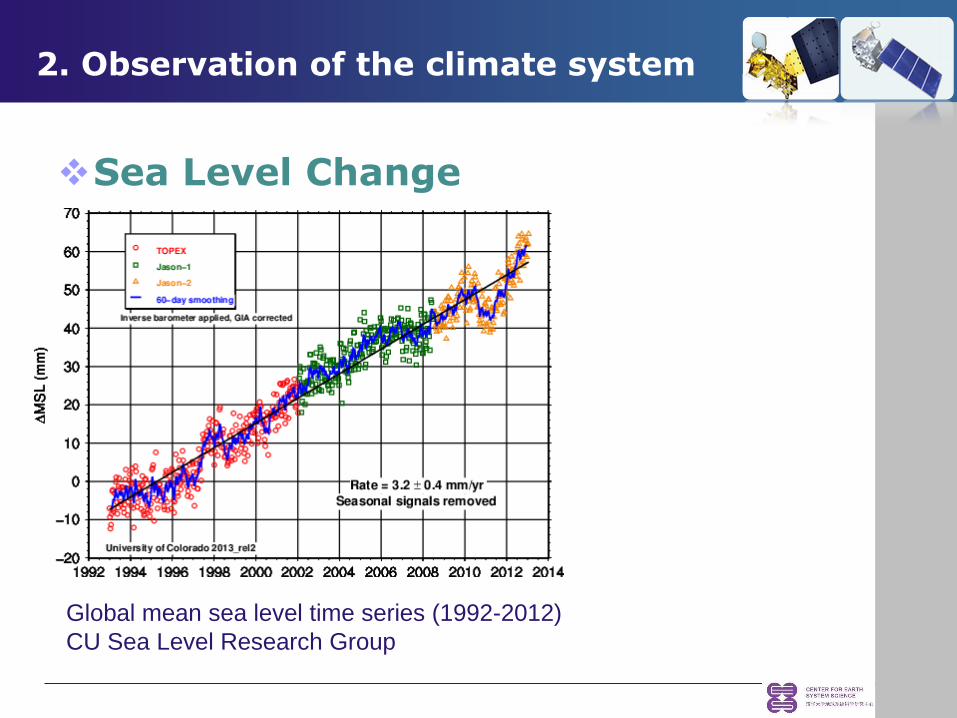
Sea Level Change
2. Observation of the climate system
Global mean sea level time series (1992-2012)
CU Sea Level Research Group

Sea Level Change
2. Observation of the climate system
• Strong regional
differences:
AVIOS, NOAA, CU
• Close the Sea
level rise budget:
steric expansion +
mass gain
• GRACE, ARGO,
Altimetry
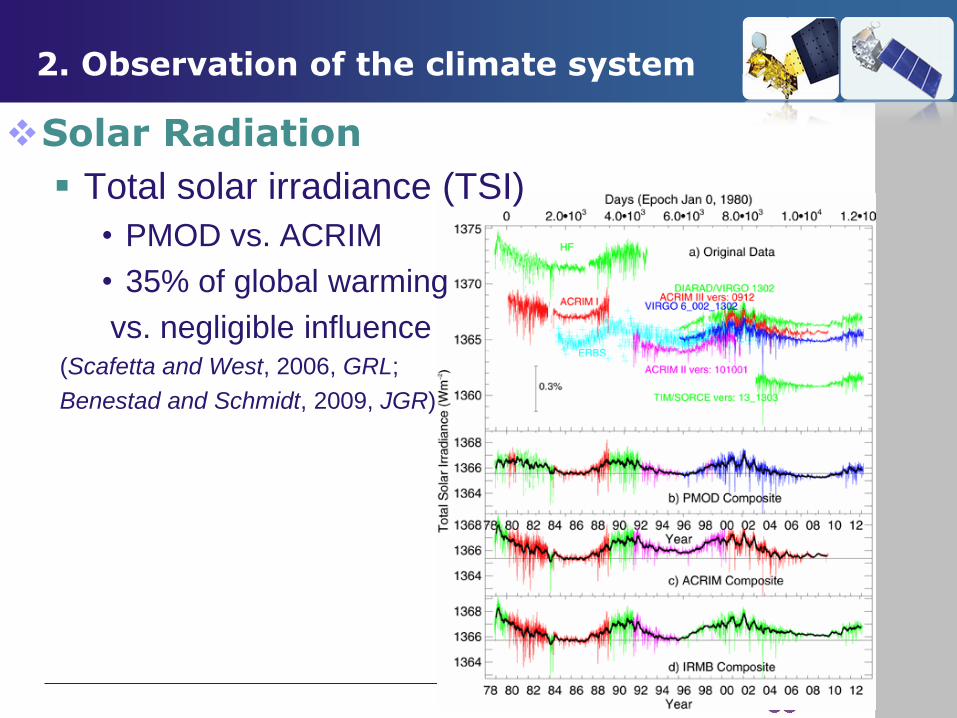
Solar Radiation
Total solar irradiance (TSI)
• PMOD vs. ACRIM
• 35% of global warming
vs. negligible influence (Scafetta and West, 2006, GRL;
Benestad and Schmidt, 2009, JGR)
2. Observation of the climate system

Solar Radiation
Spectrum variance
2. Observation of the climate system
• Decline in ultraviolet was
4-6 times more than
predicted, compensated by
visible wavelengths in
2004-2007 (Haigh et al.,
2010, Nature)
• Led to cold winters in
northern Europe and the
US (Ineson et al., 2011,
Nat. Geosci)
• Errors in calibrations of
sensors (Lean and DeLand,
2012, J. Clim)
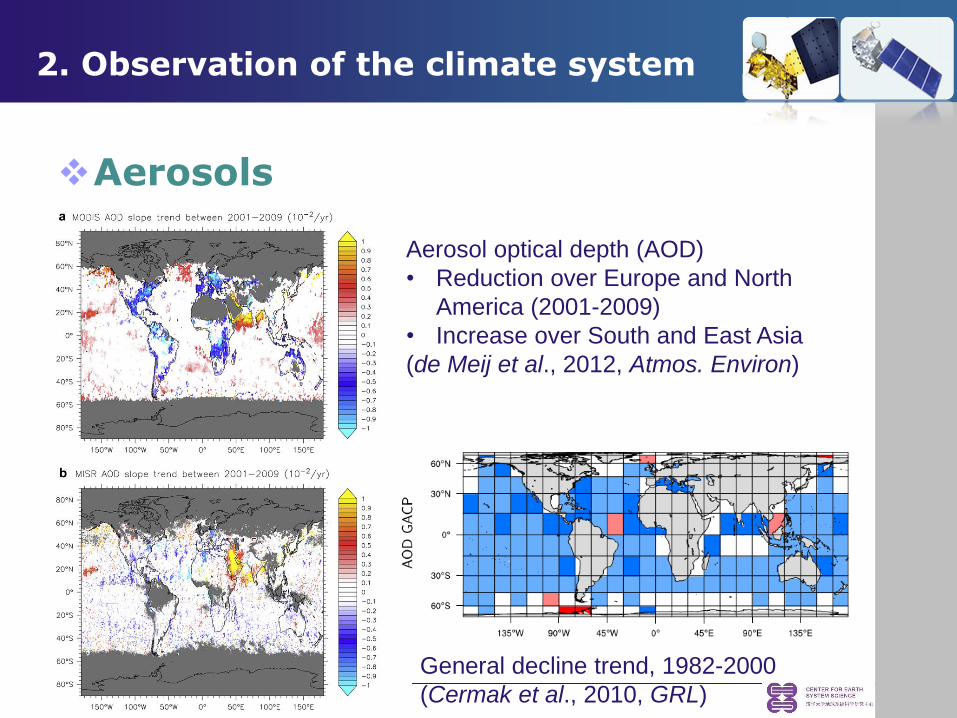
Aerosols
2. Observation of the climate system
Aerosol optical depth (AOD)
• Reduction over Europe and North
America (2001-2009)
• Increase over South and East Asia
(de Meij et al., 2012, Atmos. Environ)
General decline trend, 1982-2000
(Cermak et al., 2010, GRL)
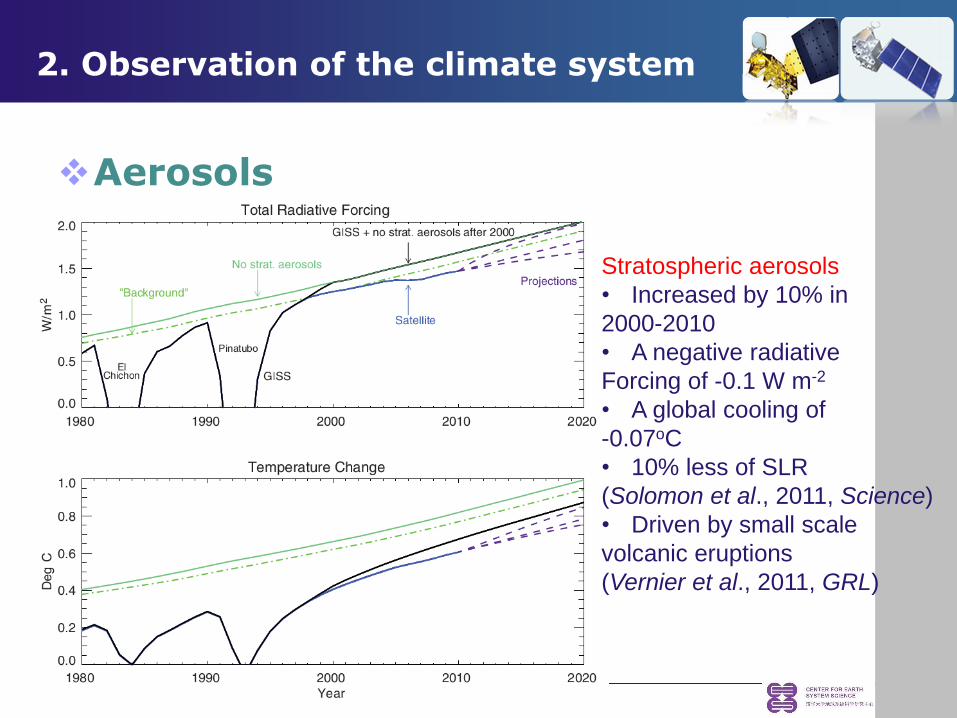
Aerosols
2. Observation of the climate system
Stratospheric aerosols
• Increased by 10% in
2000-2010
• A negative radiative
Forcing of -0.1 W m-2
• A global cooling of
-0.07oC
• 10% less of SLR
(Solomon et al., 2011, Science)
• Driven by small scale
volcanic eruptions
(Vernier et al., 2011, GRL)
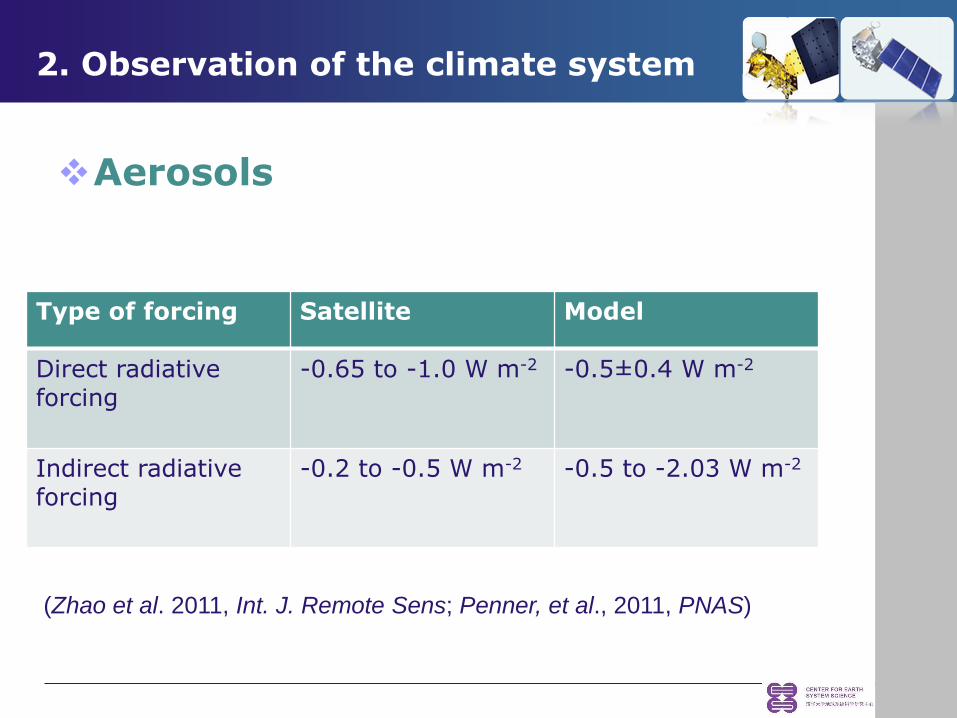
Aerosols
2. Observation of the climate system
Type of forcing Satellite Model
Direct radiative forcing
-0.65 to -1.0 W m-2 -0.5±0.4 W m-2
Indirect radiative forcing
-0.2 to -0.5 W m-2 -0.5 to -2.03 W m-2
(Zhao et al. 2011, Int. J. Remote Sens; Penner, et al., 2011, PNAS)
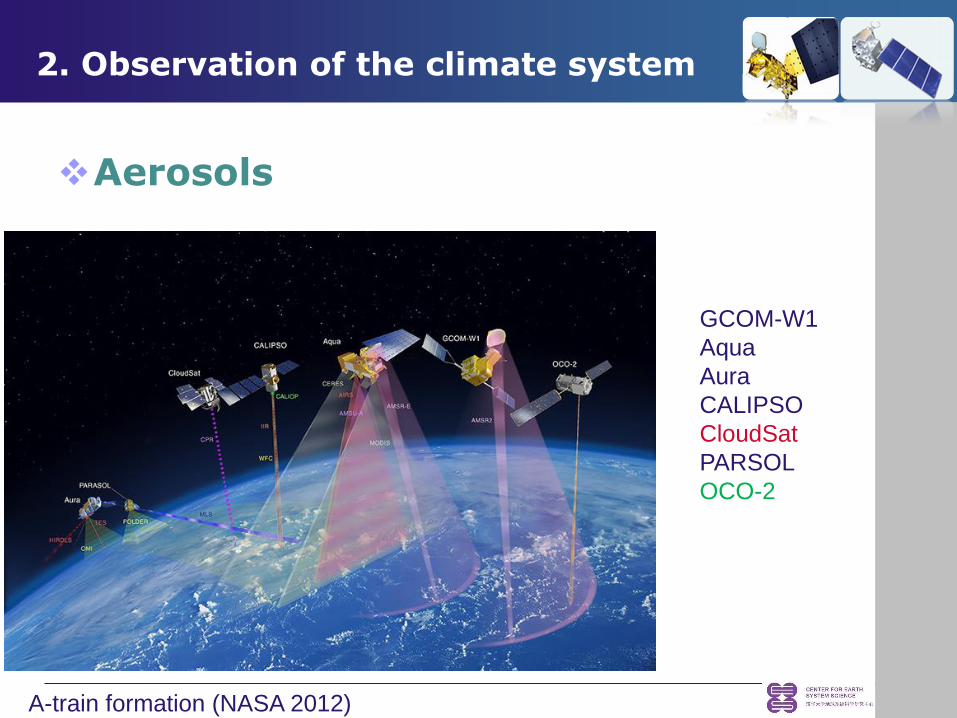
Aerosols
2. Observation of the climate system
GCOM-W1
Aqua
Aura
CALIPSO
CloudSat
PARSOL
OCO-2
A-train formation (NASA 2012)

Clouds
Net cloud forcing (NCF)
• -21 W m-2
• Reduction in the solar radiation absorbed at the
surface
• Heating the moist tropical atmosphere
• Daytime vs. night time (Allan, 2011, Meteorol. Appl)
2. Observation of the climate system
Infrared channel Visible channel
SEVIRI/Metosat-9
Clouds
Cloud feedback
• Short-term climate variations : 0.54±0.74 W m-2 K-1
• Long-term climate variations: unknown
(Dessler, 2010, Science; Taylor, 2012, Surv. Geophys)
2. Observation of the climate system
Water vapor and precipitation
Water vapor
• Model prediction: climate warmingincrease
atmospheric specific humidityamplify the
warming
• Satellite observation:
– an increase of 0.4±0.09 mm decade-1 of precipitable
water over the ocean
– Average increase of water vapor content in the upper
troposphere
– Strong inter-annual correlation between water vapor
content and surface temperature over the ocean-land
2. Observation of the climate system
(Dessler and Davis, 2010, JGR; Trenberth et al.,2005, Clim. Dyn.; Gu et al., In. J. Climatol
Shi and Bates, 2011, JGR-A)
Water vapor and precipitation
Water vapor
• Stratosphere
– 10% increase of water vapor in 2000-2009
– Contribute to the flattening of the global warming trend
– Not simulated by climate model
Solomon et al., 2010, Science
2. Observation of the climate system

Water vapor and precipitation
Precipitation
• Is there a global mean trend?
– 7% K-1 of surface warming vs. 1-3% K-1 by models (Wentz et al., 2007, Science)
– Weak correlation between precipitation and surface
temperature anomalies (Gu et al., 2012, Int. J. Climato)
– No trend in global precipitation (Gruber and Levizzani, 2008, WCRP report)
2. Observation of the climate system

Water vapor and precipitation
Precipitation
• Regional patterns: “wet-gets-wetter”
2. Observation of the climate system
Wang et al., 2012, Clim. Dynam

3. Integration with climate models

Input of climate models
Provide boundary conditions
Reinitialize models
Update the state variables
Provide constrains
• Net cloud forcing
• Short-term cloud feedback
Validate/calibrate climate models
3. Integration with climate models

Improve climate models
Revise model parameters
Improve representation
3. Integration with climate models
Homogeneous land cover
Dynamic vegetation model
Dynamic vegetation model with
disturbances

Problems
Spatio-temporal mismatching
Lack of interfaces in climate models
3. Integration with climate models

4. Limitations
4. Limitations
Short data spans of satellite data
Biases associated with instrument
Uncertainties in retrieval algorithms

4. Limitations
Short data spans of satellite data
Suggested data length
Climate variable Suggested length Source
Sea level rise 60 years Douglas, 1997, Surv. Geophys
Sea surface temperature
50 years Gornitz, 1995, Climatic Change
Ocean color 40 years Henson et al., 2010, Biogeosciences
General 30 years GCOS, ESA

4. Limitations
Short data spans of satellite data Time length of available observations
Time length
(year)
Atmospheric ECV Oceanic ECV Terrestrial ECV
0~9 Ocean salinity Biomass, Glacier
and ice caps
10~19 Wind speed and
direction(Upper
air), Carbon
dioxide, Ozone
Ocean color, Sea
state
Land cover,
Albedo, fAPAR,
Fire disturbance
20~29 Radiation budget,
Wind speed and
direction(surface
), Water vapor,
Cloud properties,
Aerosol
properties
Sea level Lakes, LAI
30~39 Precipitation,
Upper air
temperature
Sea surface
temperature, Sea
ice
Soil moisture
40~49 Snow cover
Yang et al. 2013, under review

Biases associated with instrument
Inadequate spatial resolution and temporal
frequency
Poor calibrations
Merging data from different systems
4. Limitations

Uncertainties in retrieval algorithms
Radiative transfer models
Uncertainties in common inputs
4. Limitations

5. Prospects

5. Prospects
Improvements in
Future works
• Intercomparison of data sets
• Innovative use of existing data
• Rigorous reanalysis
Future systems
• Dedicated satellite missions
• Combine passive and active remote sensing
• High-quality validation networks


