51
Prepared for May 2014 Prepared by Oil and Gas Industry in Alaska’s Economy e Role of the Oil and Gas Industry in Alaska’s Economy

Prepared for
May 2014
Prepared by
Oil and Gas Industry in Alaska’s Economy
The Role of the
Oil and Gas Industry in Alaska’s Economy
The Role of the Oil and Gas Industry In Alaska’s Economy
FINAL REPORT
Prepared for: Alaska Oil and Gas Association
Prepared by:
Juneau • Anchorage
May 2014
Table of Contents
Executive Summary .................................................................................................................. 1 Key Statewide Findings ............................................................................................................ 1 Key Local Area Findings ............................................................................................................ 2 Economic Benefits Related to Oil and Gas Industry Payments of Taxes and Royalties ............... 3 In Summary ............................................................................................................................. 4
Introduction .............................................................................................................................. 5 Study Scope ............................................................................................................................. 5 Report Organization ................................................................................................................. 6
Chapter 1. Alaska’s Production in the U.S. and World Market ............................................... 7 Alaska North Slope Oil Prices and Alaska Oil Production .......................................................... 7 Alaska’s Role in the Domestic Oil Industry ................................................................................ 8 World Oil Market ................................................................................................................... 10 Oil Consumption .................................................................................................................... 11
Chapter 2. Defining Alaska’s Oil and Gas Industry and its Economic Impact ...................... 12 “Primary Companies” in Alaska’s Oil and Gas Industry ........................................................... 12 Oilfield Support Companies ................................................................................................... 15 Other Suppliers of Goods and Services to the Oil and Gas Industry........................................ 15 Other Indirect and Induced Economic Linkages to the Oil and Gas Industry .......................... 16 Economic Effects of Taxes and Royalties Paid by the Oil and Gas Industry.............................. 17
Chapter 3. Statewide Impacts of the Oil and Gas Industry ................................................. 18 “Primary Company” Employment and Wages ........................................................................ 18 Indirect and Induced Employment and Payroll ....................................................................... 18
Chapter 4. Local/Regional Impact Profiles ............................................................................ 20 Municipality of Anchorage ..................................................................................................... 20 Fairbanks North Star Borough ................................................................................................ 21 Kenai Peninsula Borough ........................................................................................................ 22 Matanuska-Susitna Borough ................................................................................................... 23 North Slope Borough ............................................................................................................. 24 Valdez .................................................................................................................................... 25 Summary of Localized Impacts ............................................................................................... 26
Chapter 5. Oil Revenue Impacts on State and Local Governments .................................... 27 Oil Revenue Impacts on State Government ............................................................................ 27 Local Government Revenue .................................................................................................... 40 Employment Impact of State and Local Oil Revenue .............................................................. 42
Appendix A. Published Trends in Alaska’s Oil and Gas Industry ......................................... 44 Appendix B: Published Workforce Residency Data .............................................................. 46

Executive Summary
The Alaska Oil and Gas Association (AOGA) contracted with McDowell Group to assess the role of the oil and
gas industry in Alaska’s private and public sector economy, and in six geographic locations, including
Municipality of Anchorage, Fairbanks North Star Borough, Kenai Peninsula Borough, Matanuska-Susitna
Borough, North Slope Borough, and City of Valdez. The economic impact analysis conducted for this study
was based on detailed expenditure and payroll data provided by 16 “Primary Companies” in Alaska’s oil and
gas industry (including production and exploration companies, refineries, and pipeline companies).1 ADOLWD
and data sources were also used to analyze the economic impact.
Direct spending by the “Primary Companies” on goods, services and wages for employees in Alaska creates
substantial indirect and induced employment and wages for Alaska residents. This effect is often termed the
“multiplier effect.” The figure below displays how the money flows throughout the Alaska economy.
Economic impact of Oil and Gas Industry Spending in Alaska’s Economy
Key Statewide Findings
Oil and Gas Industry-Related Employment and Payroll
• In 2013, the “Primary Companies” employed 5,335 workers, including 4,700 Alaska residents earning
$780 million in wages. Alaska residents represent 88 percent of “Primary Company” hire.
• Including all direct, indirect, and induced employment and wages, oil and gas industry’s spending in
Alaska accounted for 51,000 jobs and $3.45 billion in total wages in Alaska’s private sector. These
estimates do not include nonresident oil and gas industry workers or their wages.
1 “Primary Companies” include Alyeska Pipeline Service Company, Apache Corporation, BP Exploration (Alaska) Inc., Chevron, ConocoPhillips Alaska, Inc., eni petroleum, ExxonMobil Production Company, Flint Hills Resources, Alaska, Hilcorp, Petro Star Inc., Pioneer Natural Resources Alaska, Inc., Repsol E&P USA Inc., Shell Exploration & Production Company, Statoil, Tesoro Alaska Company, and XTO Energy, Inc.
Spending with Alaska businesses
Indirect employment and payroll
Employment and payroll in Alaska
Induced employment and payroll
Taxes and royalties
State government spending
Wages, capital projects, programs
Local government spending
Wages, capital projects, programs
The Role of the Oil and Gas Industry in Alaska’s Economy McDowell Group, Inc. • Page 1

• State and local spending of taxes and royalties paid by the oil and gas industry directly creates jobs in
the public sector and indirectly creates jobs throughout the private sector. Government spending of
oil revenue accounted for 60,000 jobs and $3 billion in wages (direct, indirect and induced) in Alaska’s
economy in 2013.
• Combining the impacts of “Primary Company” spending in the private sector and payments to the
public sector:
o For each “Primary Company” job, 20 additional jobs are generated in the Alaska economy.
o For each dollar earned by employees of the “Primary Companies”, a total of $8 in additional
wages are generated in Alaska.
o The industry accounted for 33 percent of all wage and salary employment in Alaska (111,000
jobs out of total of 335,000 jobs) and 38 percent of all wages ($6.45 billion in wages out of a
total of $17.1 billion).
Key Local Area Findings
The table below summarizes the effects of Alaska’s oil and gas industry private sector spending on six
geographic areas, including Municipality of Anchorage, Fairbanks North Star Borough, Kenai Peninsula
Borough, Mat-Su Borough, North Slope Borough and the City of Valdez.
Alaska Resident Employment and Wages in the Oil and Gas Industry, by Local Area, 2013
Alaska Anchorage Fairbanks North Star Borough
Kenai Peninsula Borough
Mat-Su Borough
North Slope
Borough Valdez
Unattri-buted
Employment “Primary Companies”
4,700 2,300 475 930 535 5 300 155
Oil & Gas Support Services
8,400 2,800 750 2,250 2,200 70 155 175
All Other Indirect and Induced
37,900 25,900 2,275 2,820 1,265 1,925 245 3,470
Grand Total 51,000 31,000 3,500 6,000 4,000 2,000 700 3,800 Wages (millions)
“Primary Companies”
$780 $443 $60 $135 $80 $0.2 $37 $25
Oil & Gas Support Services
700 260 60 180 170 3.1 12 15
All Other Indirect and Induced
1,974 1,367 115 115 60 112 16 190
Grand Total ($millions) $3,454 $2,070 $235 $430 $310 $115 $65 $230
Source: McDowell Group estimates, ADOLWD, and “Primary Companies” data.
The Role of the Oil and Gas Industry in Alaska’s Economy McDowell Group, Inc. • Page 2

Economic Benefits Related to Oil and Gas Industry Payments of Taxes and Royalties
State Taxes and Royalties
• The amount of state revenue from Alaska’s oil and gas industry is the reason Alaska is the only state in
the U.S. that does not have either a state sales tax or personal income tax.
• Since 1959, 88 percent of all state revenue from natural resource development (including seafood,
mining, and timber taxes and royalties, and the applicable portion of state corporate income tax) came
from oil and gas development.
• In FY2013, the oil and gas industry paid:
o $7.4 billion in taxes and royalties to state government, 47 percent of all state revenue
(including all taxes, royalties, fees, licenses, permits, fines, forfeitures, federal revenue, and
investment revenue).
o $6.4 billion in Unrestricted General Fund (UGF) revenue, 92 percent of the State’s total UGF
(unrestricted revenues are available for appropriation by the state legislature, subject to a
Governor’s veto).
o $1 billion in restricted revenue, including:
$856 million deposited into the Alaska Permanent Fund and Public School Trust Fund.
$177 million in the Constitutional Budget Reserve Fund.
• In FY2013, the State’s operating budget was $8.5 billion; 56 percent of which was funded by oil and
gas industry payments. While all state agencies are supported by oil revenue, oil-revenue-related UGF
represented the majority of total operating budgets for:
o Departments of Corrections (81 percent), Public Safety (80 percent), Education and Early
Development (77 percent), Law (62 percent), and Natural Resources (50 percent)
44 percent of all state government agency positions can be attributed to oil-revenue-
related UGF.
• In FY2013 the State’s capital budget was $3.1 billion, including $1.9 billion (60 percent) from oil and
gas industry taxes and royalties.
• Several statewide government programs also benefitted from oil-related revenue, including:
o Alaska Permanent Fund Dividends paid to 631,470 Alaskans totaled $536 million in 2013.
Virtually all of the Fund’s principal comes from Alaska’s oil and gas production royalties.
o Approximately $8 of every $9 UGF spending on support of K-12 public education comes from
oil and gas industry payments to the state. That is, on average, each public school student
received approximately $9,100 in state aid; $8,170 was oil-revenue-funded.
The Role of the Oil and Gas Industry in Alaska’s Economy McDowell Group, Inc. • Page 3

o Alaska’s Medicaid program requires a state match to leverage federal Medicaid dollars.
Approximately $9 of every $10 of Alaska’s state match is related to oil revenue ($557 million
out of $612 million in total state match) or approximately $4 of every $10 spent on Medicaid
in Alaska ($557 million out of $1.4 billion).
o Approximately $9 of every $10 distributed from the Community Revenue Sharing Fund is oil-
revenue-related ($55 million out of $60 million). This spending affected about 229
municipalities, boroughs, and unincorporated communities throughout Alaska.
• Oil and gas property taxes totaled $405 million in FY2013, representing 25 percent of all local tax
revenue collected in Alaska, and 33 percent of all property tax receipts.
In Summary
Economic Impact of the Oil and Gas Industry in Alaska, 2013
Impacts
“Primary Company” employment in Alaska 5,335
“Primary Company” employment of Alaska residents 4,700
“Primary Company” wages paid to Alaska residents $780 million
“Primary Company” spending with Alaska vendors $5 billion
Total jobs related to “Primary Company” spending* 51,000
Percent of total Alaska private sector wage and salary jobs** 20%
Total wages related to “Primary Company” spending $3.45 billion
Percent of total Alaska private sector wages 27%
Jobs related to oil & gas industry taxes and royalties 60,500
Wages related to oil & gas industry taxes and royalties $2.98 billion
Total jobs related to Alaska’s oil & gas industry 111,500
Percent of total Alaska wage and salary jobs 33%
Total wages related to Alaska’s oil & gas industry $6.43 billion
Percent of total Alaska wages 38%
Total taxes & royalties paid by the oil & gas industry (FY2013) $7.4 billion
Oil & gas industry taxes & royalties as % of total Unrestricted General Funds (FY2013)
92%
Oil & gas industry taxes & royalties as % of total state revenues (FY2013) 47% Source: “Primary Companies” data, McDowell Group estimates, Alaska Department of Revenue, Alaska Department of Labor and Workforce Development. *Includes direct, indirect and induced employment. **Percent of wage and salary jobs as reported by Alaska Department of Labor and Workforce Development.
The Role of the Oil and Gas Industry in Alaska’s Economy McDowell Group, Inc. • Page 4

Introduction
Study Scope
The Alaska Oil and Gas Association (AOGA) contracted with McDowell Group to assess the role of the oil and
gas industry in Alaska’s economy and in the economies of the Municipality of Anchorage, the Kenai Peninsula
Borough, the Matanuska-Susitna Borough, the Fairbanks North Star Borough, the City of Valdez, and the North
Slope Borough. To accomplish this task, the McDowell Group study team collected data from a variety of
sources, including spending and payroll data from the following 16 “Primary Companies”:
• Alyeska Pipeline Service Company
• Apache Corporation
• BP Exploration (Alaska) Inc.
• Chevron
• ConocoPhillips Alaska, Inc.
• eni petroleum
• ExxonMobil Production Company
• Flint Hills Resources, Alaska
• Hilcorp
• Petro Star Inc.
• Pioneer Natural Resources Alaska, Inc.
• Repsol E&P USA
• Shell Exploration & Production Company
• Statoil
• Tesoro Alaska Company
• XTO Energy, Inc.
Many of the companies were able to provide detailed financial information, including the amount of money
they spend with specific Alaska companies, job counts and payroll information by both place of work and place
of residence, and the amount they pay in state and local taxes.
The study team also gathered select information from additional companies that were significant beneficiaries
of “Primary Company” spending in 2013. Many of these companies are categorized in government statistics
as oil and gas support companies, but some are not generally considered part of the oil and gas industry, for
example, construction companies, transportation companies, and companies that provide geological,
engineering, and related services.
In addition to the data collected directly from the “Primary Companies” and others that are the major direct
recipients of their spending, the study team collected data and information from a variety of published and
unpublished sources. These include the Alaska Department of Labor and Workforce Development (ADOLWD),
the Alaska Department of Revenue, the Alaska Department of Commerce, Community and Economic
The Role of the Oil and Gas Industry in Alaska’s Economy McDowell Group, Inc. • Page 5

Development, the U.S. Bureau of Labor Statistics, the U.S. Bureau of Economic Analysis (BEA), and the U.S.
Department of Energy’s Energy Information Administration, among others.
To measure multiplier effects (secondary economic impacts) produced by the “Primary Companies’” spending
with Alaska businesses and from the wages they paid to Alaska residents, the study team used the IMPLAN™2
(IMpact Analysis for PLANning) input-output modeling system to build custom models for Alaska and each of
the regions studied. The task of the models was to quantify the jobs and payroll added to the Alaska economy
statewide and regionally, as spending by the “Primary Companies” was subsequently re-spent within the state.
Report Organization
This report is organized as follows:
• Chapter 1: Background information on the oil and gas industry in Alaska, with brief discussions of
prices, production, and markets.
• Chapter 2: Overview of the oil and gas industry in Alaska, including brief profiles of the “Primary
Companies” and examples of companies that also play key roles in the industry, but are not captured
in published oil and gas industry employment data. This chapter also summarizes spending by
“Primary Companies” in support of their Alaska operations.
• Chapter 3: Statewide employment and wage impacts of the industry.
• Chapter 4: Local (or regional) area employment and wage impacts for Municipality of Anchorage,
Fairbanks North Star Borough, Kenai Peninsula Borough, Mat-Su Borough, North Slope Borough and
the City of Valdez.
• Chapter 5: Analysis of oil industry payments to state and local governments, and the economic impacts
of those payments on state government employment and wages.
• Appendix A: Oil and Gas employment trends as published by ADOLWD.
• Appendix B: Alaska Workforce Residency as published by ADOLWD.
2 IMPLAN™ was first developed in the 1970s as part of the U.S. Forest Service’s efforts to model different land management planning options. It is one of the most widely-used input-output models designed to quantify and detail the total impact of different events or industries on a regional, state, or national economy.
The Role of the Oil and Gas Industry in Alaska’s Economy McDowell Group, Inc. • Page 6

Chapter 1. Alaska’s Production in the U.S. and World Market
To set the stage for in-depth analysis of the oil and gas industry’s role in the Alaska economy today, this chapter
offers a broad overview of petroleum consumption, oil production and price trends, and Alaska’s role in U.S.
and world markets.
Alaska North Slope Oil Prices and Alaska Oil Production
Since 2001, Alaska North Slope (ANS) prices per barrel have fluctuated from an annual average of $22 in 2002
to a high of $113 in 2012. In 2013, the price held steady, then dropped slightly to $108 per barrel. The Alaska
Department of Revenue estimates that FY2014 and FY2015 jobs will hover around $105 to $106 per barrel.3
Forecast oil prices remain about $105 per barrel throughout the department’s forecast period to 2022.
Since 1988, Alaska oil production (ANS and Cook Inlet production) has trended downward (from 2.05 million
barrels per day).
• By 2013, total production had declined to 543,800 barrels per day, about 27 percent of 1988 levels.
Alaska North Slope Spot Price and Average Oil Production, 2001-2013
Source: Alaska Department of Revenue.
3 Alaska Department of Revenue, Spring 2014 Revenue Sources Book.
0
200,000
400,000
600,000
800,000
1,000,000
1,200,000
$0
$20
$40
$60
$80
$100
$120
2001 2002 2003 2004 2005 2006 2007 2008 2009 2010 2011 2012 2013
Aver
age
Barr
els p
er D
ay
ANS
Wes
t Coa
st S
pot
Pric
e
Axis Title
ANS West Coast Spot Price Alaska Oil Production ( average barrels per day)
The Role of the Oil and Gas Industry in Alaska’s Economy McDowell Group, Inc. • Page 7

Alaska’s Role in the Domestic Oil Industry
U.S. crude oil production peaked at 9.6 million barrels a day in 1970. From there it declined steadily to a cyclical
low point of 8.1 million barrels a day in 1976. Alaska oil – Prudhoe Bay production in particular – helped reverse
the decline. Alaska production of 1.2 million barrels a day in 1978 marked the beginning of an expansion of
U.S. oil production that lasted until 1985 when production peaked at 9.0 million barrels a day.
After 1985 U.S. oil production fell consistently, dropping to 5.0 million barrels a day by 2008. At that time,
higher oil prices and new drilling technologies stimulated industry activity in North Dakota, Texas, and the Gulf
of Mexico. By 2013, U.S. oil production’s surged to 7.4 million barrels a day.
The figure below shows how Alaska’s role in U.S. production has diminished from its peak in 1988 when it
accounted for 25 percent of all U.S. production. By 2013, Alaska’s share of the U.S. total production was 7
percent. Between 2012 and 2013, U.S. crude oil production grew 15 percent. Lower-48 production grew 18
percent, while Alaska production fell 8 percent.4
U.S. and Alaska Oil Production, Thousands Barrels per Day, 1950-2013
Source: Energy Information Administration.
The figure below shows Alaska’s share of total U.S. oil production from 2003 to 2013 relative to other top
producing U.S. states. Over this period, Alaska’s production proportionally declined, while other states, most
noticeably Texas and North Dakota, increased. The subsequent figure presents total production by the top five
states, including Alaska in fourth place, after Texas, North Dakota, and California.
4 U.S. Energy Information Administration and Alaska Department of Revenue, Spring 2014 Revenue Sources Book.
0
2,000
4,000
6,000
8,000
10,000
12,000
Thou
sand
Bar
rels
per D
ay
U.S. Less Alaska Alaska
The Role of the Oil and Gas Industry in Alaska’s Economy McDowell Group, Inc. • Page 8

U.S. Crude Oil Production, by Top Five States, Percent of Total Annual Production, 2003-2013
Source: Energy Information Administration
U.S. Crude Oil Annual Production, by Top Five Producing States, Thousands of Barrels, 2003-2013
Source: Energy Information Administration
0%
10%
20%
30%
40%
50%
60%
70%
80%
90%
100%
2003 2004 2005 2006 2007 2008 2009 2010 2011 2012 2013
All Other States
Texas
North DakotaCalifornia
Alaska
Oklahoma
0
500,000
1,000,000
1,500,000
2,000,000
2,500,000
3,000,000
2003 2004 2005 2006 2007 2008 2009 2010 2011 2012 2013
Thou
sand
Bar
rels
The Role of the Oil and Gas Industry in Alaska’s Economy McDowell Group, Inc. • Page 9

World Oil Market
The U.S. was the third-largest single-country producer of crude oil in 2013 behind Russia and Saudi Arabia.
Other Middle East countries are also major producers and China has steadily increased its oil production over
the last several decades.
World Crude Oil Production, 2013
Source: Energy Information Administration.
The next figure shows how, over the course of the last three decades – essentially the period during which
Alaska has been a major part of world oil production – the share of world production that has come from the
U.S. has fallen from a high of 20 percent in 1985 to a low of 7 percent in 2008. Increased U.S. production since
2009 boosted the U.S. share of world production to about 10 percent in 2013.
(See figure on next page.)
U.S.10%
Saudi Arabia13%
All Other Middle East
19%
China5%
Russia13%
All Other World40%
The Role of the Oil and Gas Industry in Alaska’s Economy McDowell Group, Inc. • Page 10

World Crude Oil Production, 1980-2013 (thousands of barrels per day)
Source: Energy Information Administration. Note: No data was available for Russia separate from the former Soviet Union prior to 1992.
Oil Consumption
In 2013, the U.S. consumed 6.9 billion barrels of petroleum products, an average of 18.9 million barrels per
day.5 This was about 21 percent of world petroleum consumption.6 With concerns about the political stability
of several major oil producing regions around the world, there is continued interest in stimulating U.S. oil
production and reducing the national’s dependence on oil imports.
In summary, Alaska plays a declining, but still important role in U.S. oil production. However, Alaska’s share of
world oil production is very small (about 0.7 percent in 2013), which means that changes in Alaska oil
production do not have any significant effect on oil prices. Additionally, the large international oil and gas
companies that produce most of the world’s oil have a significant variety of geographic options available to
them when they make investment decisions.
5 http://www.eia.gov/tools/faqs/faq.cfm?id=33&t=6 6 http://www.eia.gov/cfapps/ipdbproject/IEDIndex3.cfm?tid=5&pid=5&aid=2
The Role of the Oil and Gas Industry in Alaska’s Economy McDowell Group, Inc. • Page 11
0
10,000
20,000
30,000
40,000
50,000
60,000
70,000
80,000
United States Saudi Arabia All Other Middle East China Russia All Other World

Chapter 2. Defining Alaska’s Oil and Gas Industry and its Economic Impact
Government-published employment statistics for the oil and gas industry in Alaska provide only a partial
measure of the industry’s size and impact. Government oil and gas employment statistics include jobs in
companies classified under North American Industrial Classification System (NAICS) sector 211, “oil & gas
extraction,” and Sectors 213111 “drilling oil and gas wells” and 213112 “support activities for oil and gas
operations.”7 (A brief discussion of published oil and gas industry data as defined above is included in Appendix A.)
A broader definition of oil and gas industry is warranted to understand the true impact of this industry activity
on Alaska’s economy. The published statistics do not include approximately 900 Trans-Alaska Pipeline System
(TAPS)-related jobs, which are classified under transportation (NAICS sector 486), nor do they include refinery
employment of about 700 workers (NAICS sector 324). They also exclude several thousand jobs directly
connected to North Slope and Cook Inlet oil and gas production activity, but reported in other sectors,
including jobs in construction, transportation, camp-support services, engineering services, etc.
This chapter includes a discussion of the primary contributors (labeled as “Primary Companies”) that are
significant investors in Alaska’s oil and gas industry infrastructure, including production, transportation and
refining of oil and gas. The companies play a pivotal role in development of Alaska’s oil and gas resources. The
spending by these “Primary Companies” is termed a “direct impact” on Alaska’s economy. However, “Primary
Company” spending filters through the state’s economy in what is often labeled the “multiplier effect” or
“indirect and induced impact.” Oil dollars move through the economy as spending on goods and services,
payroll to Alaskan employees, taxes paid to local governments, and taxes and royalties paid to state
government.
The chapter also provides a brief description of the types of private sector firms affected by oil and gas spending,
including oilfield support and other types of businesses actively engaged in Alaska’s oil and gas industry.
“Primary Companies” in Alaska’s Oil and Gas Industry
For the purposes of this study, the following companies (in alphabetical order) are defined as “Primary
Companies” in Alaska’s oil and gas industry. They include oil and gas production companies, pipeline operators,
and refineries.8
• Alyeska Pipeline Service Company operates and maintains the 800-mile TAPS, including the pump
stations and the Valdez Marine Terminal. Alyeska is the largest employer and taxpayer in the
community of Valdez.
• Apache Corporation is an oil and gas exploration and production company with significant lease
holdings (approximately 850,000 acres on shore, in tidal areas, and offshore) in the Cook Inlet Basin.
7 Alaska Department of Labor and Workforce Development estimated 14,100 jobs Alaska’s oil and gas sector in 2013, including employment in NAICS Sectors 211 (oil and gas extraction), 213111 (drilling oil and gas wells), and 213112 (support activities for oil and gas operations). 8 These companies, plus ConocoPhillips Alaska Inc., are all members of the Alaska Oil and Gas Association (AOGA).
The Role of the Oil and Gas Industry in Alaska’s Economy McDowell Group, Inc. • Page 12

• BP Exploration (Alaska) Inc. operates 13 fields on the North Slope, including Greater Prudhoe Bay,
which together, accounting for about two-thirds of Alaska’s oil production. It also own a share of four
North Slope pipelines (Kuparuk Transportation Co., Endicott Pipeline Co., Milne Point Pipeline LLC,
and Northstar Pipeline) and significant interest in six other producing fields. BP is the largest partner in
TAPS with a 48 percent stake. BP’s net production rate in Alaska in 2012 was 142,000 barrels of oil
equivalent per day.
• Chevron has ownership interest in Endicott (11 percent), Greater Kuparuk Area (5 percent), Greater
Prudhoe Bay (1 percent), and Greater Point McIntrye (1 percent) fields, as well as 1 percent ownership
in TAPS.
• ConocoPhillips Alaska, Inc., a 29 percent owner of TAPS, is 36 percent owner of Prudhoe Bay and Point
McIntyre, and the operator at Kuparuk (55 percent). It also has operating interest in the Alpine field on
the Western North Slope (78 percent). ConocoPhillips has oil and gas production interests in Cook
Inlet, owning all of the Kenai Liquified Natural Gas Plant and operating the Tyonek Platform in North
Cook Inlet Field and the Beluga River natural gas field in the Cook Inlet Area. ConocoPhillips’s net
production rate in Alaska is 213,000 barrels of oil equivalent per day (2012).
• eni petroleum owns interests in 172 leases in Alaska, including 89 located in the federal Outer
Continental Shelf and 83 state leases. eni is 100 percent owner and operator of the Nikaitchuq Field at
Oliktok Point and owns 30 percent of the Oooguruk Field.
• ExxonMobil Production Company is 36 percent owner of Prudhoe Bay and 21 percent owner of TAPS.
ExxonMobil operates Point Thomson and has working interests in the Greater Point McIntyre Area,
Greater Kuparuk Area, Endicott and Granite Point fields.
• Flint Hills Resources, Alaska owns and operates the North Pole Refinery a facility with processing
capacity of about 85,000 barrels of North Slope crude oil per day. The refinery processes North Slope
crude oil and supplies gasoline, jet fuel, high sulfur diesel, turbine fuels and asphalt to Alaska markets.
The company also owns and operates refined petroleum products terminals in Fairbanks and
Anchorage. The refinery is scheduled to cease gasoline production in May 2014, with closure of the
crude processing unit shortly thereafter. The terminals in Fairbanks and Anchorage will continue to
operate with supplies coming from other sources.
• Hilcorp purchased Chevron’s assets in Cook Inlet, including interests in Granite Point, Middle Ground
Shoals, Trading Bay and MacArthur River fields, as well as interests in 10 offshore platforms, onshore
gas fields, two gas storage facilities and two pipeline companies.
• Petro Star Inc. is an Alaskan-owned refining and fuel marketing company that operates refineries in
North Pole and Valdez. Petro Star’s refineries draw crude supply from TAPS to produce off-road and
marine diesel, commercial and military jet fuel, and home heating oil.
• Pioneer Natural Resources Alaska, Inc. is an exploration and production company that operates the
Oooguruk field west of Prudhoe Bay. Pioneer was the first independent company to operate a
producing field on the North Slope. Pioneer has recently sold its Alaska subsidiary to Caelus Energy
Alaska.
The Role of the Oil and Gas Industry in Alaska’s Economy McDowell Group, Inc. • Page 13

• Repsol E&P USA is actively exploring on the North Slope. The company holds 156 onshore blocks to
the west of the Kuparak River and Prudhoe Bay fields. Repsol also holds 93 offshore leases (100 percent
working interest) in the Chukchi Sea.
• Shell Exploration & Production Company has a long history in Alaska’s oil and gas industry, including
oil production in Cook Inlet dating back to the 1960s. Shell’s current interests include 275 leases in the
Chukchi Sea. Plans to drill exploratory wells in the Chukchi Sea are pending.
• Statoil is an international energy company that recently expanded into Alaska by acquiring 16 leases
in the Chukchi Sea (including 14 joint bids with eni petroleum). Statoil is also a 25 percent owner in
the Devils Paw Chukchi Sea prospect (with majority owner ConocoPhillips).
• Tesoro Alaska Company operates a refinery in Kenai (the company also owns and operates 31 retail
outlets in Alaska). The refinery manufactures jet fuel, diesel, gasoline, propane, asphalt and heavy oils.
• XTO Energy, Inc. (a subsidiary of ExxonMobil) operates two platforms in Cook Inlet and an onshore
production facility located in Nikiski. XTP produces about 2,700 barrels of oil per day in Alaska.
“Primary Companies” reported approximately $7 billion in Alaska vendor and inter-company spending in 2013.
For purposes of calculating economic impact, inter-company spending was subtracted, leaving approximately
$5 billion in operating and capital expenditures with Alaska vendors who provide goods and services in support
of their Alaska operations. Each of these “Primary Company” provided confidential data on spending in support
of their Alaska operations, including payroll, purchases of goods and services from oilfield support and other
types of firms, payments to local and state governments, and other information pertinent to spending in Alaska.
This data revealed hundreds of additional businesses providing goods and services to Alaska’s oil and gas sector;
some based in Alaska with resident and nonresident employees and some based outside Alaska but with satellite
offices in Alaska and also with resident and nonresident employees. In addition, these firms (both Alaska- and
Lower-48 based) spend non-payroll money in Alaska, as well as outside of Alaska, in support of their operations.
The following figure presents “Primary Company” Alaska vendor spending by sector.
(See figure on next page.)
The Role of the Oil and Gas Industry in Alaska’s Economy McDowell Group, Inc. • Page 14
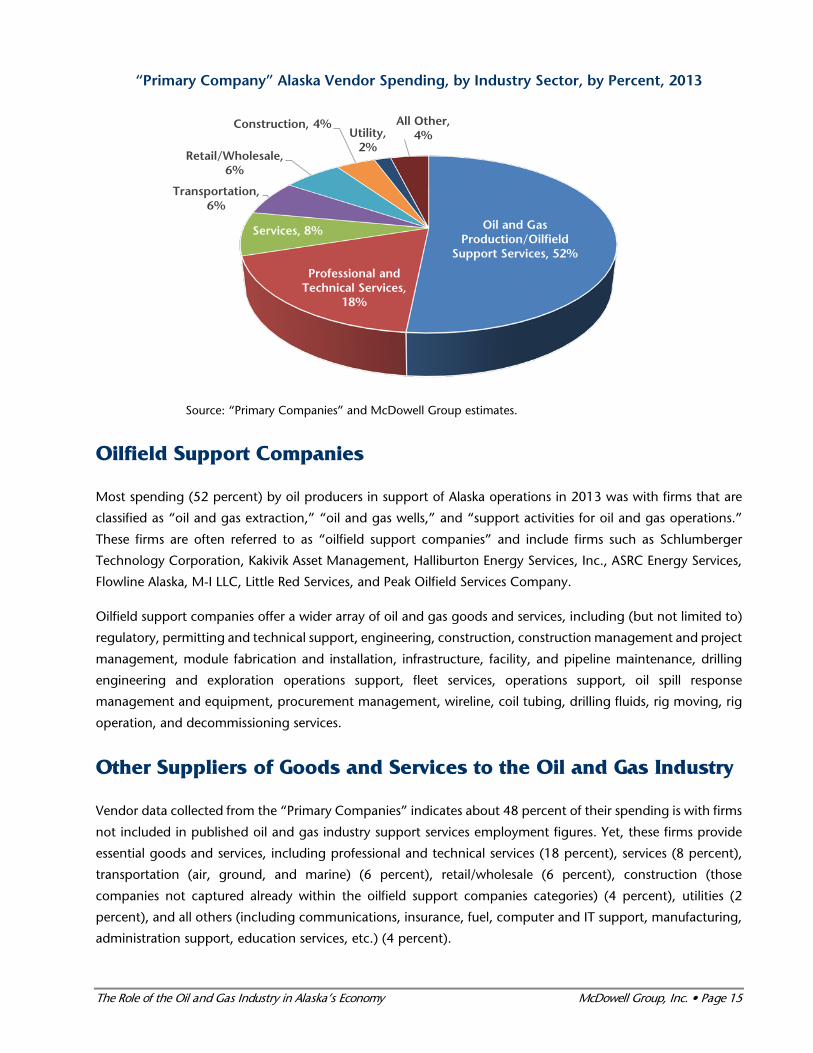
“Primary Company” Alaska Vendor Spending, by Industry Sector, by Percent, 2013
Source: “Primary Companies” and McDowell Group estimates.
Oilfield Support Companies
Most spending (52 percent) by oil producers in support of Alaska operations in 2013 was with firms that are
classified as “oil and gas extraction,” “oil and gas wells,” and “support activities for oil and gas operations.”
These firms are often referred to as “oilfield support companies” and include firms such as Schlumberger
Technology Corporation, Kakivik Asset Management, Halliburton Energy Services, Inc., ASRC Energy Services,
Flowline Alaska, M-I LLC, Little Red Services, and Peak Oilfield Services Company.
Oilfield support companies offer a wider array of oil and gas goods and services, including (but not limited to)
regulatory, permitting and technical support, engineering, construction, construction management and project
management, module fabrication and installation, infrastructure, facility, and pipeline maintenance, drilling
engineering and exploration operations support, fleet services, operations support, oil spill response
management and equipment, procurement management, wireline, coil tubing, drilling fluids, rig moving, rig
operation, and decommissioning services.
Other Suppliers of Goods and Services to the Oil and Gas Industry
Vendor data collected from the “Primary Companies” indicates about 48 percent of their spending is with firms
not included in published oil and gas industry support services employment figures. Yet, these firms provide
essential goods and services, including professional and technical services (18 percent), services (8 percent),
transportation (air, ground, and marine) (6 percent), retail/wholesale (6 percent), construction (those
companies not captured already within the oilfield support companies categories) (4 percent), utilities (2
percent), and all others (including communications, insurance, fuel, computer and IT support, manufacturing,
administration support, education services, etc.) (4 percent).
Oil and Gas Production/Oilfield
Support Services, 52%
Professional and Technical Services,
18%
Services, 8%
Transportation, 6%
Retail/Wholesale, 6%
Construction, 4%Utility,
2%
All Other, 4%
The Role of the Oil and Gas Industry in Alaska’s Economy McDowell Group, Inc. • Page 15
Examples of larger firms (more than 70 employees) directly engaged in oil and gas activity in Alaska, but not
reported as part of the oilfield support sector include:
• CONAM Construction Company, based in Anchorage, is a general construction contractor specializing
in oil and gas facilities (Sector 237 “heavy construction”).
• Alaska West Express, Inc., based in Anchorage with a Fairbanks terminal, transports general
commodities, bulk chemicals, tankers, heavy haul products, oil field materials, heavy machinery, and
other products (Sector 484 “truck transportation”).
• Beacon Occupational Health & Safety Services, based in Anchorage, provides medical, safety and
training services to include occupational health (pre-hire/annual surveillance), drug and alcohol testing
services, safety consulting, remote medical staffing, safety staffing and training (Sector 541 “all other
professional, scientific, and technical services”).
• Advanced Supply Chain International, based in Anchorage, provides materials management services,
purchasing administration, warehouse operations, supply chain management/supplier management
and e-commerce web tools. All of the firm’s business is with the oil and gas sector (Sector 493
“warehousing and storage”).
Other businesses with substantial interest in Alaska’s oil and gas industry include NANA Management Services
and Doyon Universal Services (Sector 561), AHTNA Construction (Sector 237), Alaska Interstate Construction
(Sector 237), and various transportation firms, such as ERA Helicopters (Sector 481), Crowley Marine Services
(Sector 483), and Lynden Transport (Sector 484). These firms are active in other sectors of the Alaska economy,
but the revenue generated in the oil and gas industry is important, if not essential, to business sustainability.
Other Indirect and Induced Economic Linkages to the Oil and Gas Industry
The wide range of businesses (described above) that provide goods and services to the “Primary Companies”,
are collectively described as being part of the “indirect” impact of “Primary Company” activity in Alaska. In
fact, detailed vendor data provided to the study team indicates that more than 1,500 businesses in Alaska
directly serve the “Primary Companies”. These businesses in turn purchase goods and services in support of
their operations in Alaska, creating additional jobs and wages.
The impact of the “Primary Companies” also includes the economic activity associated with their employees
spending their wages in the Alaska economy. Jobs and wages that are the result of wages being spent are
termed “induced” economic impacts.
Together, indirect and induced impacts are described as “multiplier effects.” In Chapters 3 and 4 of this report
the direct and multiplier effects of “Primary Company” spending are described from a statewide perspective as
well as for several local areas.
The Role of the Oil and Gas Industry in Alaska’s Economy McDowell Group, Inc. • Page 16
Economic Effects of Taxes and Royalties Paid by the Oil and Gas Industry
The jobs and wages associated with vendor and employee spending are largely in the private sector. Taxes and
royalties (totaling over $7 billion in 2013) paid to state government fund a wide variety of government agency
services, programs, and capital projects. Similarly, property taxes paid by the oil and gas industry to local
governments supports local services, programs, and projects. Alaska’s dependence on oil and gas industry
revenues, and the employment and wages associated with expenditure of those revenues is quantified are
described in Chapter 5.
The Role of the Oil and Gas Industry in Alaska’s Economy McDowell Group, Inc. • Page 17
Chapter 3. Statewide Impacts of the Oil and Gas Industry
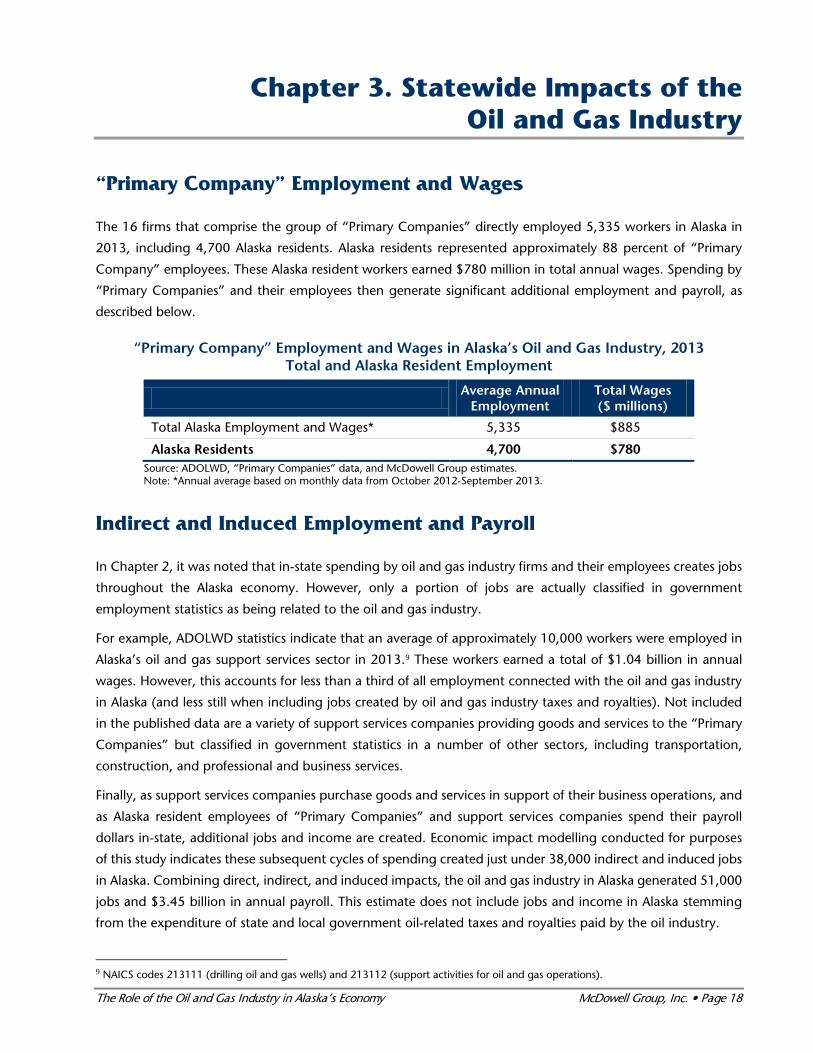
“Primary Company” Employment and Wages
The 16 firms that comprise the group of “Primary Companies” directly employed 5,335 workers in Alaska in
2013, including 4,700 Alaska residents. Alaska residents represented approximately 88 percent of “Primary
Company” employees. These Alaska resident workers earned $780 million in total annual wages. Spending by
“Primary Companies” and their employees then generate significant additional employment and payroll, as
described below.
“Primary Company” Employment and Wages in Alaska’s Oil and Gas Industry, 2013 Total and Alaska Resident Employment
Average Annual
Employment Total Wages ($ millions)
Total Alaska Employment and Wages* 5,335 $885
Alaska Residents 4,700 $780 Source: ADOLWD, “Primary Companies” data, and McDowell Group estimates. Note: *Annual average based on monthly data from October 2012-September 2013.
Indirect and Induced Employment and Payroll
In Chapter 2, it was noted that in-state spending by oil and gas industry firms and their employees creates jobs
throughout the Alaska economy. However, only a portion of jobs are actually classified in government
employment statistics as being related to the oil and gas industry.
For example, ADOLWD statistics indicate that an average of approximately 10,000 workers were employed in
Alaska’s oil and gas support services sector in 2013.9 These workers earned a total of $1.04 billion in annual
wages. However, this accounts for less than a third of all employment connected with the oil and gas industry
in Alaska (and less still when including jobs created by oil and gas industry taxes and royalties). Not included
in the published data are a variety of support services companies providing goods and services to the “Primary
Companies” but classified in government statistics in a number of other sectors, including transportation,
construction, and professional and business services.
Finally, as support services companies purchase goods and services in support of their business operations, and
as Alaska resident employees of “Primary Companies” and support services companies spend their payroll
dollars in-state, additional jobs and income are created. Economic impact modelling conducted for purposes
of this study indicates these subsequent cycles of spending created just under 38,000 indirect and induced jobs
in Alaska. Combining direct, indirect, and induced impacts, the oil and gas industry in Alaska generated 51,000
jobs and $3.45 billion in annual payroll. This estimate does not include jobs and income in Alaska stemming
from the expenditure of state and local government oil-related taxes and royalties paid by the oil industry.
9 NAICS codes 213111 (drilling oil and gas wells) and 213112 (support activities for oil and gas operations).
The Role of the Oil and Gas Industry in Alaska’s Economy McDowell Group, Inc. • Page 18

Alaska Oil and Gas Industry Employment and Wages, 2013 (excluding non-resident oil production and oil field services workers)
Employment Wages
“Primary Companies” (Alaska residents only) 4,700 $780 million
Oil & Gas Support Services (Alaska residents only)* 8,400 $700 million
All Other Indirect and Induced 37,900 $1.97 billion
Grand Total (Direct, Indirect, and Induced) 51,000 $3.45 billion *Includes ADOLWD Oil and Gas Support Services Sector 213111 and 213112. Source: McDowell Group estimates, ADOLWD, and “Primary Companies” data.
According to BEA employment data, which includes people who are self-employed and active-duty military
personnel, the Alaska economy included 458,400 jobs in 2012. Based on that figure, the oil industry accounts
for slightly more than 1 in 10 jobs in Alaska, not including Alaskan jobs associated with taxes and royalties paid
by the oil industry to state and local governments. All told, the oil and gas industry accounted for 1 in 7 private
sector jobs.
In 2013 Alaska’s economy included an annual average 335,000 wage and salary jobs, with total annual wages
of $17.1 billion, according to ADOLWD data. Based on ADOLWD wage and salary employment data (excluding
the self-employed and active duty military personnel), the oil and gas industry accounts for 15 percent of all
employment and 20 percent of all wages (again not including jobs associated with taxes and royalties paid by
the oil industry to state and local governments).
The oil and gas industry’s 51,000 jobs and $3.5 billion in annual wages accounts for a large share of private
sector employment in Alaska. In 2013 there was an average of 245,000 private sector wage and salary jobs in
Alaska, accounting for $12.8 billion in total wages. Based on estimates made in this study, the oil and gas
industry accounted for about 20 percent of those wage and salary jobs and more than a quarter (27 percent)
of private sector wages.
The Role of the Oil and Gas Industry in Alaska’s Economy McDowell Group, Inc. • Page 19
Chapter 4. Local/Regional Impact Profiles
This chapter provides an overview of oil and gas industry employment and wage impacts in six geographic
areas: the Municipality of Anchorage, Fairbanks North Star Borough, Kenai Peninsula Borough, Matanuska-
Susitna Borough, North Slope Borough and City of Valdez.
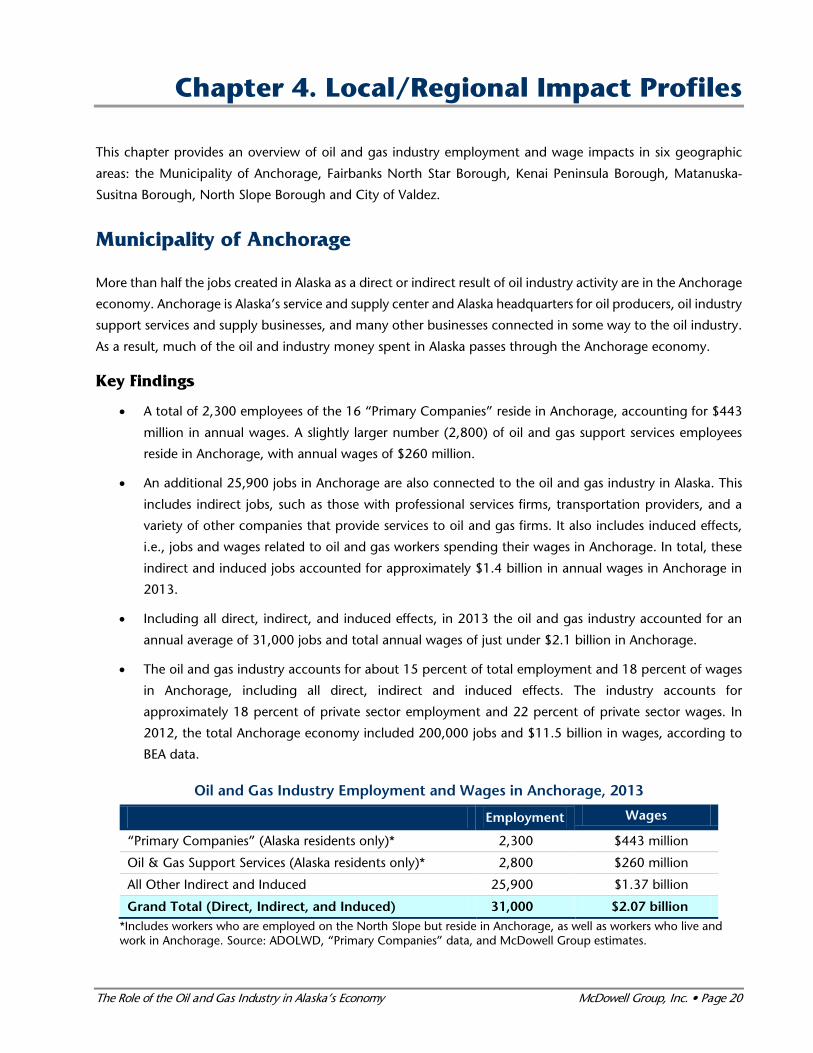
Municipality of Anchorage
More than half the jobs created in Alaska as a direct or indirect result of oil industry activity are in the Anchorage
economy. Anchorage is Alaska’s service and supply center and Alaska headquarters for oil producers, oil industry
support services and supply businesses, and many other businesses connected in some way to the oil industry.
As a result, much of the oil and industry money spent in Alaska passes through the Anchorage economy.
Key Findings
• A total of 2,300 employees of the 16 “Primary Companies” reside in Anchorage, accounting for $443
million in annual wages. A slightly larger number (2,800) of oil and gas support services employees
reside in Anchorage, with annual wages of $260 million.
• An additional 25,900 jobs in Anchorage are also connected to the oil and gas industry in Alaska. This
includes indirect jobs, such as those with professional services firms, transportation providers, and a
variety of other companies that provide services to oil and gas firms. It also includes induced effects,
i.e., jobs and wages related to oil and gas workers spending their wages in Anchorage. In total, these
indirect and induced jobs accounted for approximately $1.4 billion in annual wages in Anchorage in
2013.
• Including all direct, indirect, and induced effects, in 2013 the oil and gas industry accounted for an
annual average of 31,000 jobs and total annual wages of just under $2.1 billion in Anchorage.
• The oil and gas industry accounts for about 15 percent of total employment and 18 percent of wages
in Anchorage, including all direct, indirect and induced effects. The industry accounts for
approximately 18 percent of private sector employment and 22 percent of private sector wages. In
2012, the total Anchorage economy included 200,000 jobs and $11.5 billion in wages, according to
BEA data.
Oil and Gas Industry Employment and Wages in Anchorage, 2013
Employment Wages
“Primary Companies” (Alaska residents only)* 2,300 $443 million
Oil & Gas Support Services (Alaska residents only)* 2,800 $260 million
All Other Indirect and Induced 25,900 $1.37 billion
Grand Total (Direct, Indirect, and Induced) 31,000 $2.07 billion *Includes workers who are employed on the North Slope but reside in Anchorage, as well as workers who live and work in Anchorage. Source: ADOLWD, “Primary Companies” data, and McDowell Group estimates.
The Role of the Oil and Gas Industry in Alaska’s Economy McDowell Group, Inc. • Page 20

Fairbanks North Star Borough
The oil and gas industry in the Fairbanks North Star Borough (FNSB) includes refinery operations, TAPS
operations, and oil industry support services-related activity. The borough is also home to a number of North
Slope workers.
Key Findings
• A total of 475 “Primary Company” employees reside in the FNSB, accounting for $60 million in annual
wages.
• An estimated total of 750 oil and gas support services employees reside in the FNSB, with annual wages
of $60 million.
• An additional 2,275 jobs in the FNSB are also connected to “Primary Company” spending in Alaska,
including jobs with professional services firms, transportation providers, and a variety of other
companies, generating approximately $115 million in annual wages.
• Including all direct, indirect, and induced effects, the oil and gas industry accounted for an annual
average 3,500 jobs and total annual wages of $235 million in the FNSB in 2013.
• Wages related to the oil and gas industry (including all multiplier effects) equal approximately 8 percent
of total FNSB resident employment and wages. Approximately 15 percent of private sector resident
employment and wages are attributable to the oil and gas industry. In 2012, the FNSB economy
included 42,100 employed residents and $2.9 billion in resident wages, according to BEA and
ADOLWD data.
• The oil and gas industry paid $9.1 million in property taxes to the FNSB in 2013, 8.4 percent of total
Borough property tax revenue. The industry also paid $100,000 in property taxes to the City of
Fairbanks (representing 0.7 percent of total property tax revenue).
• Oil and gas industry firms are among the largest property-tax payers in the FNSB. Alyeska Pipeline
Service Company has been the single largest contributor of property-tax revenues. The Flint Hills
refinery was the fourth largest.10
Oil and Gas Industry Employment and Wages in Fairbanks, 2013
Employment Wages
“Primary Companies” (Alaska residents only)* 475 $60 million
Oil & Gas Support Services (Alaska residents only)* 750 $60 million
All Other Indirect and Induced 2,275 $115 million
Grand Total (Direct, Indirect, and Induced) 3,500 $235 million
*Includes workers who are employed on the North Slope but reside in the FNSB, as well as workers who live and work in the FNSB. Source: ADOLWD, “Primary Companies” data, and McDowell Group estimates.
10 Fairbanks North Star Borough, Comprehensive Annual Financial Report, FY13, p. 266
The Role of the Oil and Gas Industry in Alaska’s Economy McDowell Group, Inc. • Page 21
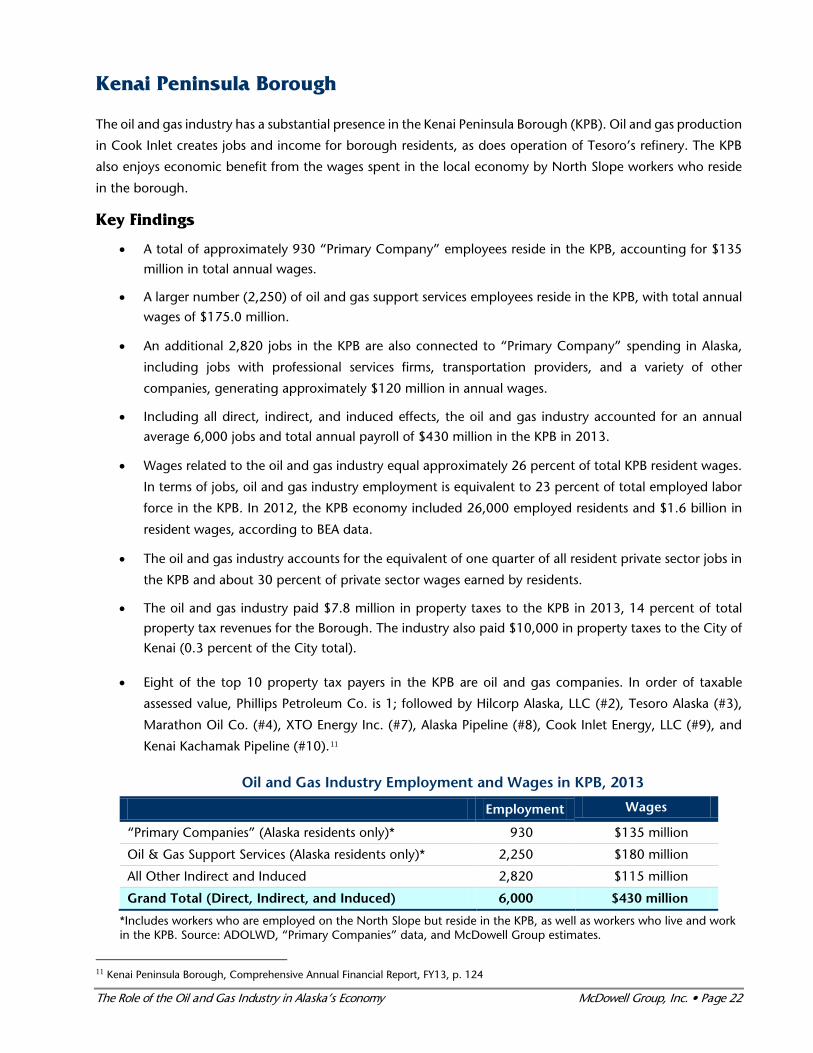
Kenai Peninsula Borough
The oil and gas industry has a substantial presence in the Kenai Peninsula Borough (KPB). Oil and gas production
in Cook Inlet creates jobs and income for borough residents, as does operation of Tesoro’s refinery. The KPB
also enjoys economic benefit from the wages spent in the local economy by North Slope workers who reside
in the borough.
Key Findings
• A total of approximately 930 “Primary Company” employees reside in the KPB, accounting for $135
million in total annual wages.
• A larger number (2,250) of oil and gas support services employees reside in the KPB, with total annual
wages of $175.0 million.
• An additional 2,820 jobs in the KPB are also connected to “Primary Company” spending in Alaska,
including jobs with professional services firms, transportation providers, and a variety of other
companies, generating approximately $120 million in annual wages.
• Including all direct, indirect, and induced effects, the oil and gas industry accounted for an annual
average 6,000 jobs and total annual payroll of $430 million in the KPB in 2013.
• Wages related to the oil and gas industry equal approximately 26 percent of total KPB resident wages.
In terms of jobs, oil and gas industry employment is equivalent to 23 percent of total employed labor
force in the KPB. In 2012, the KPB economy included 26,000 employed residents and $1.6 billion in
resident wages, according to BEA data.
• The oil and gas industry accounts for the equivalent of one quarter of all resident private sector jobs in
the KPB and about 30 percent of private sector wages earned by residents.
• The oil and gas industry paid $7.8 million in property taxes to the KPB in 2013, 14 percent of total
property tax revenues for the Borough. The industry also paid $10,000 in property taxes to the City of
Kenai (0.3 percent of the City total).
• Eight of the top 10 property tax payers in the KPB are oil and gas companies. In order of taxable
assessed value, Phillips Petroleum Co. is 1; followed by Hilcorp Alaska, LLC (#2), Tesoro Alaska (#3),
Marathon Oil Co. (#4), XTO Energy Inc. (#7), Alaska Pipeline (#8), Cook Inlet Energy, LLC (#9), and
Kenai Kachamak Pipeline (#10).11
Oil and Gas Industry Employment and Wages in KPB, 2013
Employment Wages
“Primary Companies” (Alaska residents only)* 930 $135 million
Oil & Gas Support Services (Alaska residents only)* 2,250 $180 million
All Other Indirect and Induced 2,820 $115 million
Grand Total (Direct, Indirect, and Induced) 6,000 $430 million
*Includes workers who are employed on the North Slope but reside in the KPB, as well as workers who live and work in the KPB. Source: ADOLWD, “Primary Companies” data, and McDowell Group estimates.
11 Kenai Peninsula Borough, Comprehensive Annual Financial Report, FY13, p. 124
The Role of the Oil and Gas Industry in Alaska’s Economy McDowell Group, Inc. • Page 22

Matanuska-Susitna Borough
The oil and gas industry’s economic impact on the Matanuska-Susitna (Mat-Su) Borough is largely the result of
oil and gas industry workers who choose to reside in the area. Mat-Su’s proximity to Anchorage and its relatively
less expensive housing have made it one of the fastest growing parts of the state over the last several decades.
Although Mat-Su’s growing network of businesses receives some benefit from oil industry purchases of goods
and services, the most significant impact the industry has on the area is in the incomes earned in the industry
by Borough residents.
Key Findings
• A total of approximately 535 “Primary Company” employees reside in the Mat-Su Borough, accounting
for $80 million in annual wages.
• A larger number (2,200) of oil and gas support services employees reside in the Mat-Su Borough, with
annual wages of $170 million.
• An additional 1,265 jobs in the Mat-Su Borough are also directly connected to “Primary Company”
spending in Alaska, including jobs with professional services firms, transportation providers, and a
variety of other companies, generating approximately $60 million in total annual wages.
• Including all direct, indirect, and induced effects, the oil and gas industry accounted for an annual
average 4,000 jobs in the Mat-Su Borough and total annual payroll of $310 million in 2013.
• While not many oil and gas industry-related jobs are located in the Mat-Su Borough (and many workers
commute to Anchorage), oil and gas industry-related wages equal approximately 10 percent of total
Mat-Su resident employment and wages. In 2012, the Mat-Su economy included 40,000 resident
workers and $3.2 billion in resident wages, according to BEA data.
Oil and Gas Industry Employment and Wages in Mat-Su, 2013
Employment Wages
“Primary Companies” (Alaska residents only)* 535 $80 million
Oil & Gas Support Services (Alaska residents only)* 2,200 $170 million
All Other Indirect and Induced 1,265 $60 million
Grand Total (Direct, Indirect, and Induced) 4,000 $310 million
*Includes workers who are employed on the North Slope or in Anchorage but reside in Mat-Su. Source: McDowell Group estimates, ADOLWD, and “Primary Companies” data.
The Role of the Oil and Gas Industry in Alaska’s Economy McDowell Group, Inc. • Page 23

North Slope Borough
There were approximately 14,400 jobs reported in the North Slope Borough in 2013. Almost 80 percent of
those jobs (11,000) were in the Prudhoe Bay area. While a very large number of oil and gas industry jobs are
based in the North Slope Borough (NSB), very few of the workers who hold those jobs reside in the borough.
The North Slope oil industry infrastructure and work sites are self-contained and hundreds of miles away from
most of the borough’s resident population. In fact the oil industry’s greatest economic impact on the residents
of the borough has been through oil-related property-tax revenues.
About 15 percent of the jobs in Prudhoe Bay are provided by oil producers and about 55 percent are provided
by oil support-services companies. The remaining 30 percent are categorized in other industries, but directly
tied to Prudhoe Bay or other area oil operations (construction, transportation, or professional services, for
example).
Key Findings
• By place of work, “Primary Companies” in the NSB provided approximately 2,000 jobs and accounted
for $310 million in annual wages; Alaska residents held 1,310 of these jobs (68 percent of total jobs)
and earned $215 million (69 percent).
• By place of work, oil and gas support services companies with operations in the NSB provided 8,410
jobs and accounted for $650 million in annual wages; Alaska residents held 5,190 of these jobs (62
percent of total jobs) and earned $400 million (61 percent).
• By place of residence, “Primary Company” or oil and gas support service companies provided jobs for
85 NSB residents, accounting for $3.2 million in annual wages.
• An additional 1,900 jobs in the NSB are also connected to oil and gas industry activity in Alaska,
generating approximately $97 million in annual wages. These jobs and wages are linked with property
taxes paid by the industry that support local government operations. It also includes high-level
estimates of the economic impact of Arctic Slope Regional Corporation (ASRC), which has important
interests in the oil and gas industry.
• Including all direct, indirect, and induced effects, the oil and gas industry accounted for an annual
average 2,000 jobs in the NSB and total annual wages of $100 million in 2013.
• The oil and gas industry paid $347.5 million in property taxes to the NSB in 2013, 99.2 percent of total
Borough tax revenues.
Oil and Gas Industry Employment and Wages in the North Slope Borough, 2013 Employment Wages
“Primary Companies” (Alaska residents only) 6 $0.2 million
Oil & Gas Support Services (Alaska residents only) 79 $3.1 million
All Other Indirect and Induced 1,915 $112 million
Grand Total (Direct, Indirect, and Induced) 2,000 $115 million
Source: McDowell Group estimates, ADOLWD, and “Primary Companies” data.
The Role of the Oil and Gas Industry in Alaska’s Economy McDowell Group, Inc. • Page 24

Valdez
Valdez is the terminus of the 800-mile Trans-Alaska pipeline and the site of the marine terminal where oil is
loaded onto oil tankers and transported to refineries, mainly on the U.S. West Coast. The marine terminal, Petro
Star’s Valdez refinery, and other pipeline facilities within the city account for the vast majority of all local
property-tax revenues.
An additional source of revenue dates back to the 1970s when the owners of the pipeline system paid the city
$13.5 million in exchange for letting them use the city’s bonding authority to issue tax-exempt bonds. That
windfall was used to create the Valdez Permanent Fund, the principal of which is protected by law. Since 1987,
the Valdez City Council has had made a policy of not appropriating fund earnings to annual operating and
capital budgets. That policy and additional financing fees have enabled the fund to grow considerably over the
years.12
Key Findings
• A total of 300 “Primary Company” employees reside in Valdez, accounting for $37 million in annual
wages.
• An estimated total of 155 Oil and Gas Support Services company employees reside in Valdez, with
annual wages of $11 million.
• An additional 245 jobs in Valdez are also connected to “Primary Company” spending and employee
spending in Valdez, accounting for approximately $17 million in annual wages.
• Including all direct, indirect, and induced effects, the oil and gas industry accounted for an annual
average 700 jobs and total annual wages of $65 million in Valdez in 2013.
• The oil and gas industry paid $34.5 million in property taxes to the City of Valdez in 2013, 90 percent
of total City tax revenues.
Oil and Gas Industry Employment and Wages in Valdez, 2013
Employment Wages
“Primary Companies” (Alaska residents only) 300 $37 million
Oil & Gas Support Services (Alaska residents only) 155 $12 million
All Other Indirect and Induced 245 $16 million
Grand Total (Direct, Indirect, and Induced) 700 $65 million
Source: McDowell Group estimates, ADOLWD, and “Primary Companies” data.
12 http://www.ci.valdez.ak.us/index.aspx?NID=324
The Role of the Oil and Gas Industry in Alaska’s Economy McDowell Group, Inc. • Page 25
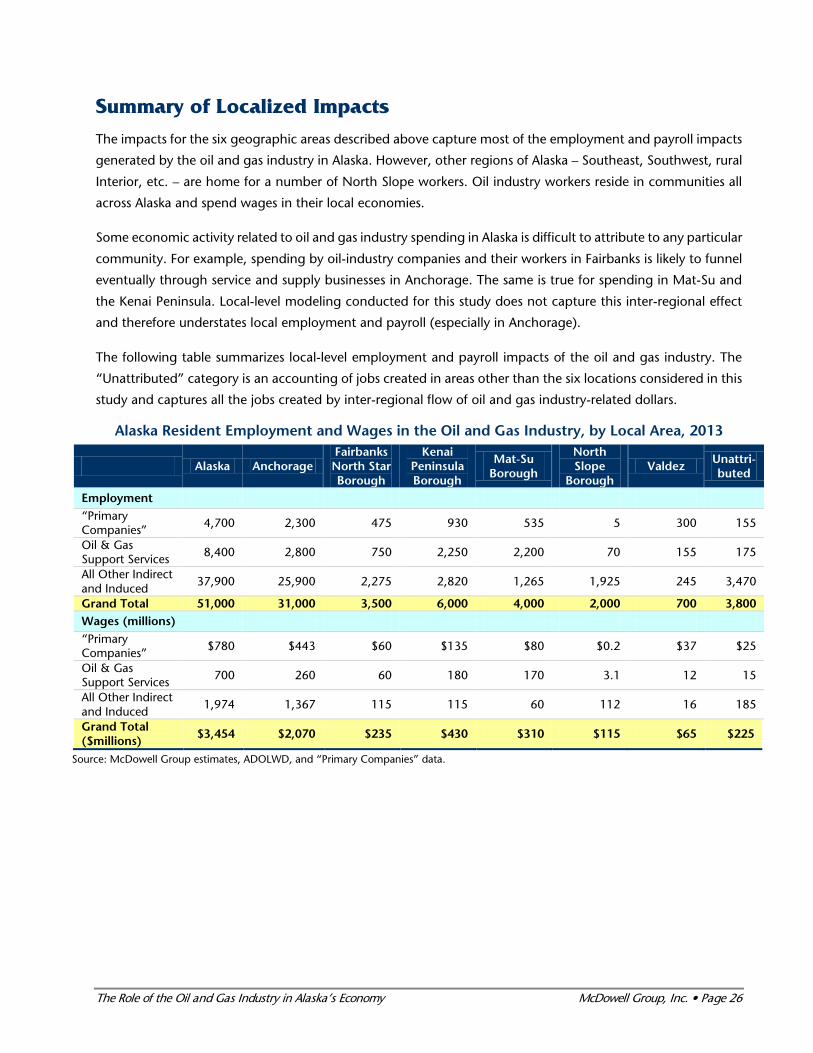
Summary of Localized Impacts
The impacts for the six geographic areas described above capture most of the employment and payroll impacts
generated by the oil and gas industry in Alaska. However, other regions of Alaska – Southeast, Southwest, rural
Interior, etc. – are home for a number of North Slope workers. Oil industry workers reside in communities all
across Alaska and spend wages in their local economies.
Some economic activity related to oil and gas industry spending in Alaska is difficult to attribute to any particular
community. For example, spending by oil-industry companies and their workers in Fairbanks is likely to funnel
eventually through service and supply businesses in Anchorage. The same is true for spending in Mat-Su and
the Kenai Peninsula. Local-level modeling conducted for this study does not capture this inter-regional effect
and therefore understates local employment and payroll (especially in Anchorage).
The following table summarizes local-level employment and payroll impacts of the oil and gas industry. The
“Unattributed” category is an accounting of jobs created in areas other than the six locations considered in this
study and captures all the jobs created by inter-regional flow of oil and gas industry-related dollars.
Alaska Resident Employment and Wages in the Oil and Gas Industry, by Local Area, 2013
Alaska Anchorage Fairbanks North Star Borough
Kenai Peninsula Borough
Mat-Su Borough
North Slope
Borough Valdez Unattri-
buted
Employment “Primary Companies” 4,700 2,300 475 930 535 5 300 155
Oil & Gas Support Services 8,400 2,800 750 2,250 2,200 70 155 175
All Other Indirect and Induced
37,900 25,900 2,275 2,820 1,265 1,925 245 3,470
Grand Total 51,000 31,000 3,500 6,000 4,000 2,000 700 3,800 Wages (millions) “Primary Companies” $780 $443 $60 $135 $80 $0.2 $37 $25
Oil & Gas Support Services 700 260 60 180 170 3.1 12 15
All Other Indirect and Induced
1,974 1,367 115 115 60 112 16 185
Grand Total ($millions) $3,454 $2,070 $235 $430 $310 $115 $65 $225
Source: McDowell Group estimates, ADOLWD, and “Primary Companies” data.
The Role of the Oil and Gas Industry in Alaska’s Economy McDowell Group, Inc. • Page 26

Chapter 5. Oil Revenue Impacts on State and Local Governments
Alaska is the only state that has neither a state sales tax nor a personal income tax. Instead, revenue from oil
and gas development supports 92 percent of state government’s unrestricted or discretionary spending. No
other state is so dependent on a single industry for funding of government programs.
This chapter provides an analysis of the impacts of Alaska’s oil and gas industry payments to state government
and a brief overview of oil and gas property taxes paid to various local governments in Alaska. A focus of the
analysis is the impact of State unrestricted revenues (see definition below), which accrue to the State mainly
from oil and gas production.
Oil Revenue Impacts on State Government
• From 1959 to fiscal year (FY) 2013, Alaska state oil revenues totaled $197 billion (in 2013 dollars). This
represents 88 percent of all state revenue from natural resources, including seafood, mining, and timber
taxes and royalties and the applicable portion of state corporate income tax.13
• In FY2013, Alaska received $7.4 billion in oil and gas revenue, representing 47 percent of all state
revenue ($15.8 billion).
State revenue is categorized into two important distinct pools of funding – unrestricted and restricted funds.
Below is a brief description of the sources of oil and gas revenue payments to the State of Alaska that fall into
each category.14
Unrestricted Revenues
Unrestricted revenues are paid into the General Fund and may be appropriated for any purpose, which means
it is available to be appropriated by the Alaska State Legislature (subject to the Governor’s veto). These funds
are completely flexible for use in any operating or capital budget allocations.
• In FY2013, $6.4 billion, or 86 percent of Alaska’s total oil revenue, was unrestricted.
• As a percent of all unrestricted revenue (from all sources), Alaska’s oil and gas industry payments
represented 92 percent of the State’s total unrestricted revenue.15
13 Data compiled and inflation-adjusted (2013$). Alaska Department of Revenue. Scott Goldsmith, UA Research Summary No. 17, February 2011; Institute of Social and Economic Research, University of Alaska Anchorage, and McDowell Group estimates. 14 More detailed descriptions can be found in the Alaska Department of Revenue, 2013 Annual Report. http://www.tax.alaska.gov/programs/documentviewer/viewer.aspx?1038r 15 The remaining sources of unrestricted revenue include: excise taxes (alcohol, tobacco, motor fuel, etc.) ($169 million), non-petroleum corporate income tax ($113 million), fisheries tax ($24.7 million), and other tax revenue from charitable gaming, estate, large vessel gambling, and mining taxes ($55 million), plus fees and investment revenue.
The Role of the Oil and Gas Industry in Alaska’s Economy McDowell Group, Inc. • Page 27
OIL AND GAS PRODUCTION TAX
• The largest source of tax revenue to the state comes from the Oil and Production Tax. In FY 2013,
production tax ($4.0 billion) represented:
o 64 percent of unrestricted oil and gas revenue,
o 55 percent of all oil revenue, and
o 26 percent of all state revenue.
The state levies an annual tax on the value of oil and gas production in Alaska (AS 43.55). The More Alaska
Production Act (MAPA) took effect on January 1, 2014. Prior to that, during FY2013, Alaska’s Clear and Equitable
Share (ACES) Act was in effect. Under ACES, the base tax rate was 25 percent of the production tax value per
BTU-equivalent barrel of taxable oil and gas. When the average monthly production tax value was more than
$30 per barrel, but not more than $92.50, there was an additional 0.4 percent progressive tax for each
additional dollar of production tax value per barrel. Production under state and federal royalty agreements are
not taxed. The tax on oil and gas is not levied on. Also not taxed is oil and gas used on a lease or property for
drilling, production, or re-pressuring.
ROYALTIES – OIL AND GAS BONUSES, RENTS, AND INTEREST
Royalties are the second largest source of state revenues from oil and gas production.
• In FY 2013, royalties of $1.8 billion – including oil and gas bonuses, rents, and interest – represented:
o 28 percent of unrestricted oil and gas revenue.
o 24 percent of all oil revenue.
o 11 percent of all state revenue.
Royalty agreements allow a company to share the risk of oil and gas development with the State (11 ACC
04.010-199, 11 AAC 83.201-295) in return for a portion of the profits. When a company purchases a lease from
the state they pay various “fees” and promise the state a portion of revenue (usually 12.5 or 16.67 percent) if
and when the oil and gas are marketed. Royalty payments are based on the value of the oil and gas removed
from the state lease, the volume removed, and the lease’s royalty rate. Large lease-owners have agreements
with the state about what expenses can be deducted from the sales value to calculate royalty due.16
PETROLEUM CORPORATE INCOME TAX
Alaska levies a corporate income tax on Alaska businesses (AS 43.20).
• In FY 2013, corporate income tax revenue ($434.6 million) represented:
o 7 percent of unrestricted oil and gas revenue.
16 More detailed description can be found on the Alaska Department of Natural Resources’ website: http://dog.dnr.alaska.gov/Royalty/Accounting.htm
The Role of the Oil and Gas Industry in Alaska’s Economy McDowell Group, Inc. • Page 28
o 6 percent of all oil revenue.
o 3 percent of all state revenue.
Corporate income tax on oil companies is based on a “modified” apportionment formula of property, sales,
and extraction. The extraction factor is the production of oil and gas in Alaska divided by their worldwide
production. Alaska taxes corporate income at graduated rates ranging from 0 percent to 9.4 percent divided
over 10 tax brackets. Credits, such as the Gas Exploration and Development Credit, Gas Storage Facility Tax
Credit, LNG Storage Facility Tax Credit, apply.
PROPERTY TAX
Alaska levies an oil and gas property tax on the value of taxable exploration, production, and pipeline
transportation property in Alaska (AS 43.56). The state tax rate is 20 mills, or 2 percent of the assessed value.
• In FY 2013, property tax revenue ($99.3 million) represented 1.6 percent of unrestricted oil and gas
revenue.
OIL CONSERVATION SURCHARGE
A $0.05 tax is levied upon each barrel of taxable oil through an Oil Conservation Surcharge ($0.01) and
Additional Conservation Surcharge ($0.04) and deposited into the Oil and Hazardous Substance Release
Prevention and Response Fund (AS43.55.201/300) as a source of funding to prevent and respond to a
hazardous substance spill. The fund is also commonly referred to as the “470 Fund.”
• In FY 2013, the Alaska oil and gas industry paid $7.8 million into the 470 Fund.
Restricted Revenues
While the majority of oil revenue is unrestricted, a portion of revenue is restricted and allocated for specific
uses.
• In FY2013, $1.0 billion, or 14 percent of Alaska’s total oil revenue, was restricted.
• As a percent of all restricted revenue (from all sources), Alaska’s oil and gas industry payments
represented 12 percent of the State’s total restricted revenue.
ROYALTY PAYMENTS TO SPECIFIED FUNDS
Alaska Permanent Fund and Public School Trust
The Alaska Permanent Fund receives between 25 to 50 percent of oil and gas royalties, depending on the
royalty agreement for the specific property. The remainder of restricted royalty revenue (0.5 percent
proportion) is deposited into the Public School Trust Fund.
• In FY2013, $855.9 million was deposited into the Alaska Permanent Fund and Public School Trust Fund.
(A more detailed discussion of the impact of the oil and gas payments to the Alaska Permanent Fund is found later
in this chapter.)
The Role of the Oil and Gas Industry in Alaska’s Economy McDowell Group, Inc. • Page 29
Constitutional Budget Reserve Fund
The Constitutional Budget Reserve Fund (CBRF) was established in 1990 to provide cash to fund government
during periods of temporarily low oil prices when revenues fall short of expenditures. The principal of the CBRF
represents proceeds from settlements of tax and royalty disputes with Alaska’s oil and gas companies.
• In FY 2013, $176.7 million was placed in the CBRF.
• In FY 2013, the CBRF (including the Main Fund and the Subaccount Fund) had a market value of $11.6
billion.17
NPR-A Royalties, Rents, and Bonuses
Similar to restricted royalties revenue that occur on State land, any royalties, rents or bonuses collected by the
Federal government from development in the National Petroleum Reserve – Alaska (NPR-A) is shared with the
State.
• In FY2013, $3.6 million was collected for activity on NPR-A lands.
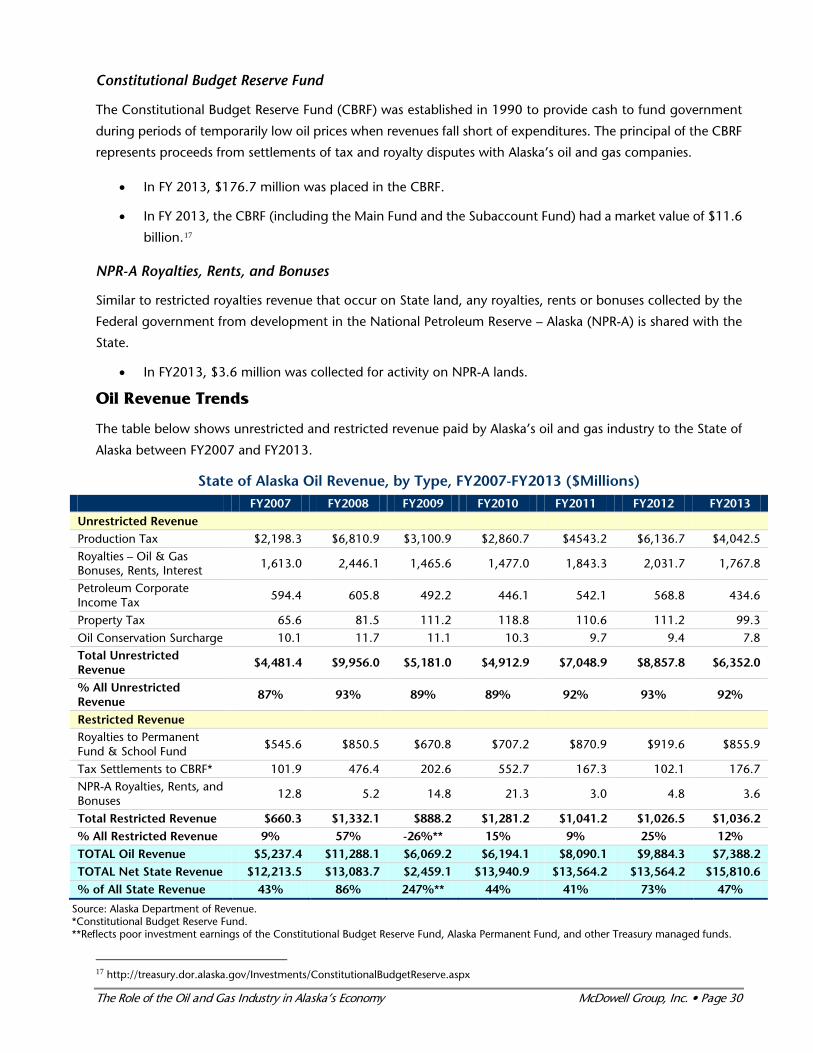
Oil Revenue Trends
The table below shows unrestricted and restricted revenue paid by Alaska’s oil and gas industry to the State of
Alaska between FY2007 and FY2013.
State of Alaska Oil Revenue, by Type, FY2007-FY2013 ($Millions) FY2007 FY2008 FY2009 FY2010 FY2011 FY2012 FY2013 Unrestricted Revenue Production Tax $2,198.3 $6,810.9 $3,100.9 $2,860.7 $4543.2 $6,136.7 $4,042.5 Royalties – Oil & Gas Bonuses, Rents, Interest 1,613.0 2,446.1 1,465.6 1,477.0 1,843.3 2,031.7 1,767.8
Petroleum Corporate Income Tax 594.4 605.8 492.2 446.1 542.1 568.8 434.6
Property Tax 65.6 81.5 111.2 118.8 110.6 111.2 99.3 Oil Conservation Surcharge 10.1 11.7 11.1 10.3 9.7 9.4 7.8 Total Unrestricted Revenue $4,481.4 $9,956.0 $5,181.0 $4,912.9 $7,048.9 $8,857.8 $6,352.0
% All Unrestricted Revenue 87% 93% 89% 89% 92% 93% 92%
Restricted Revenue Royalties to Permanent Fund & School Fund $545.6 $850.5 $670.8 $707.2 $870.9 $919.6 $855.9
Tax Settlements to CBRF* 101.9 476.4 202.6 552.7 167.3 102.1 176.7 NPR-A Royalties, Rents, and Bonuses 12.8 5.2 14.8 21.3 3.0 4.8 3.6
Total Restricted Revenue $660.3 $1,332.1 $888.2 $1,281.2 $1,041.2 $1,026.5 $1,036.2 % All Restricted Revenue 9% 57% -26%** 15% 9% 25% 12% TOTAL Oil Revenue $5,237.4 $11,288.1 $6,069.2 $6,194.1 $8,090.1 $9,884.3 $7,388.2 TOTAL Net State Revenue $12,213.5 $13,083.7 $2,459.1 $13,940.9 $13,564.2 $13,564.2 $15,810.6 % of All State Revenue 43% 86% 247%** 44% 41% 73% 47%
Source: Alaska Department of Revenue. *Constitutional Budget Reserve Fund. **Reflects poor investment earnings of the Constitutional Budget Reserve Fund, Alaska Permanent Fund, and other Treasury managed funds.
17 http://treasury.dor.alaska.gov/Investments/ConstitutionalBudgetReserve.aspx
The Role of the Oil and Gas Industry in Alaska’s Economy McDowell Group, Inc. • Page 30

For more than a decade, oil revenue has fluctuated significantly as a result of volatile oil prices and changes in
tax structure. In FY2002, total oil revenue was just $1.3 billion and production taxes were below $500 million.
At the other extreme, FY2008 total oil revenue reached $11.3 billion, and production taxes that year were 13
times higher at $6.8 billion. When oil prices fell, state oil revenue also declined to around $5 billion in 2009
and 2010. It rose again in FY 2011 ($7 billion) and FY 2012 ($9 billion), to dip once more to $6.4 billion in
FY2013.
State Government Oil Revenue by Type ($ millions) and ANS Annual Average Price ($), FY 2001-2013
Source: Alaska Department of Revenue.
Oil Revenue-Related Impacts on State Government Funding and Employment
Employment and other indirect impacts are generated by taxes and other payments the oil and gas industry
makes to state government. Those payments create jobs to support the operation of the state government and
its programs, as well as support additional jobs in the private sector from state capital spending and non-payroll
operational budget spending.
In FY2013, the state’s combined operating and capital budget (authorized plus supplemental budget) was
$11.6 billion. Undesignated General Funds (UGF) make up the majority of these budgets ($7.3 billion).
• In FY 2013, 58 percent (or $6.7 billion) of the State’s combined operating and capital budgets was
funded by oil revenue-related UGF.
$0
$20
$40
$60
$80
$100
$120
$0
$1,000
$2,000
$3,000
$4,000
$5,000
$6,000
$7,000
$8,000
$9,000
$10,000
2001 2002 2003 2004 2005 2006 2007 2008 2009 2010 2011 2012 2013
ANS
Annu
al A
vera
ge P
rice
Oil
Reve
nue,
$m
illio
ns
Axis Title
Oil and Gas Production Tax ($ millions) Net Oil and Gas Royalties ($ millions)
Petroleum Corporate Income Tax ($ millions) Petroleum Property Taxes ($ millions)
ANS Crude Oil Average Price
The Role of the Oil and Gas Industry in Alaska’s Economy McDowell Group, Inc. • Page 31

The impact of oil revenue-related UGF spending on state government employment and payroll is greater than
the UGF spending alone. For example, UGF funds are used to leverage additional federal dollars, and there is
the additional impact of restricted revenue spending. However, this analysis is limited to the direct impacts of
oil revenue-related UGF to department spending and employment, and support of state government programs.
Sources of Unrestricted General Funds, FY2013
Source: Alaska Department of Revenue
STATE OF ALASKA FY2013 OPERATING BUDGET
In FY2013, the State’s operating budget was $8.5 billion, including:
• $5.23 billion in UGF, or 62 percent of the total state operating budget, of which:
o 92 percent, or $4.8 billion, is oil-revenue-related UGF.
The remaining $3.23 billion of the operating budget consisted of federal funds ($2.0 billion or 24 percent of
the total budget), Designated General Funds ($756 million), and other funds ($472 million).
Departmental Impacts
The following table shows department-by-department budget allocations by funding sources. While all
departments depend on oil revenues to some extent, some are almost entirely dependent on oil revenues:
• By percent of total funding, departments most heavily dependent on oil-revenue-related UGF (50
percent or more) include: Corrections (81 percent of total operating budget), Public Safety (80
percent), Education and Early Development (77 percent), Law (62 percent) and Natural Resources (50
percent).
• By dollar amount, the Alaska Department of Education and Early Development ($1.2 billion), and
Health and Social Services ($1.1 billion) are by far the largest recipients of oil-related UGF.
Oil-related revenue,
92%
Non-petroleum
revenue, 8%
Investment revenue,
<0%
The Role of the Oil and Gas Industry in Alaska’s Economy McDowell Group, Inc. • Page 32

State of Alaska Department Funding, By Source ($Thousands), FY2013
State Departments
Undesignated General Funds (UGF)
Designated General Funds (DGF)
Other Funds
Federal Funds
Total Funding
% UGF from Oil Revenue of Total*
Funding Attributed
to Oil Revenue
Corrections $279,385 $20,662 $15,735 $3,113 $318,893 81% $257,034
Public Safety $166,978 $4,608 $12,044 $9,043 $192,673 80 $153,620
Education and Early Development
$1,290,122 $13,025 $26,240 $214,272 $1,543,658 77 $1,186,912
Law $62,993 $2,430 $26,952 $834 $93,209 62 $57,953
Natural Resources $97,218 $23,240 $30,984 $26,080 $177,522 50 $89,441
Health and Social Services
$1,154,657 $69,062 $81,414 $1,072,147 $2,377,279 45 $1,062,284
Transportation & Public Facilities
$303,439 $60,498 $265,195 $1,520 $630,652 44 $279,164
University of Alaska $362,945 $279,521 $78,012 $127,525 $848,003 39 $333,909
Military and Veterans Affairs
$22,787 $16 $11,018 $19,592 $53,413 39 $20,964
Fish and Game $78,866 $8,395 $50,058 $51,290 $188,609 38 $72,557
Commerce, Community, & Economic Development
$57,904 $69,928 $31,811 $32,694 $192,337 28 $53,272
Administration $82,909 $24,140 $198,411 $2,874 $308,334 25 $76,277
Environmental Conservation
$21,219 $25,695 $10,309 $22,788 $80,011 24 $19,522
Labor and Workforce Development
$35,062 $30,185 $20,488 $73,616 $159,351 20 $32,257
Revenue $31,669 $9,456 $196,786 $73,715 $311,626 9 $29,136
Source: Governor’s Office of Budget and Management and Alaska Legislative Finance. *Assumes 92 percent of UGF derives from oil revenue to unrestricted funds.
In employment terms, because of the State’s dependence on oil revenues to fund undesignated spending:
• Just over 10,210 positions (or 44 percent of all positions) in state government are funded by revenue
from Alaska’s oil and gas industry.
• The departments with the most positions (1,000+) supported by oil-related UGF include: University of
Alaska system (1,949 positions, or 39 percent of all department positions), Department of
Transportation & Public Facilities (1,690, or 44 percent), Department of Health and Social Services
1,631, or 45 percent), and Department of Corrections (1,377, or 81 percent)).
The Role of the Oil and Gas Industry in Alaska’s Economy McDowell Group, Inc. • Page 33

The table below provides a department by department employment allocation attributed to oil revenue-related
UGF.
State of Alaska Department Employment, FY2013
State Departments Full-Time Positions
Part-Time Positions
Temporary Positions
All Positions
% of All Positions
Supported by Oil Related UGF
# Positions Supported
by Oil-Related UGF
University of Alaska 4,727 222 0 4,949 39% 1,949
Transportation & Public Facilities
3,185 405 227 3,817 44 1,690
Health and Social Services 3,469 65 116 3,650 45 1,631
Corrections 1,708 1 0 1,709 81 1,377
Public Safety 869 18 17 904 80 721
Fish and Game 928 715 68 1,711 38 658
Natural Resources 755 251 103 1109 50 559
Law 571 3 0 574 62 357
Education and Early Development
335 14 18 367 77 282
Administration 1,051 19 58 1,128 25 279
Labor and Workforce Development
869 77 46 992 20 201
Commerce, Community, & Economic Development
531 1 14 546 28 151
Environmental Conservation
551 0 7 558 24 136
Military and Veterans Affairs 339 2 2 343 39 135
Revenue 887 36 19 942 9 88
Total 20,775 1,829 695 23,299 44% 10,214
Source: Governor’s Office of Budget and Management and Alaska Legislative Finance, and McDowell Group estimates.
STATE OF ALASKA FY2013 CAPITAL BUDGET
In FY2013, the State’s capital budget (authorized budget plus supplemental budget) was $3.13 billion,
including:
• $2.1 billion in UGF, representing 66 percent of the total state capital budget, of which:
o 92 percent, or $1.9 billion, of UGF is directly connected to oil and gas revenue.
The remaining $1.1 billion of the capital budget included federal dollars ($901 million or 29 percent of the
total budget), Designated General Funds ($112 million), and other funds ($48 million).
Capital funds allocated in one year may not actually be spent until the following year or even several years later.
Using a three-year average of oil-related UGF (FY2011-FY2013) to take this spending lag into account:
• An average of approximately $1.2 billion was spent in Alaska on state capital projects in FY2013. This
activity generated approximately 7,000 jobs directly.
The Role of the Oil and Gas Industry in Alaska’s Economy McDowell Group, Inc. • Page 34
Examples of Capital Projects
Capital projects supported by General Fund allocations between FY2011 to FY 2013 covered a wide variety of
infrastructure, such as:
• Sealaska Heritage Institute – Southeast Alaska Native Cultural and Visitor Center ($1 million in General
Funds, FY2011)
• University of Alaska Fairbanks Life Sciences Classroom and Lab Facility ($88 million, FY2011)
• Palmer Senior Citizens Center ($6 million, FY2011)
• Cordova Breakwater Extension and Boat Ramp ($1.4 million, FY2012)
• Fort Yukon Solid Waste Disposal Facility ($0.5 million, FY2012)
• Golden Valley Electric Association Eva Creek Wind Farm ($10 million, FY2012)
• Sutton-Palmer Correctional Center Projects ($0.6 million, FY2012)
• Angoon Headstart Playground ($30,000, FY2013)
• Fairbanks North Star Borough Natural Gas Distribution System Development ($3 million, FY2013)
• Kenai River King Salmon Sonar Assessment Program ($1.8 million, FY2013)
• Kodiak High School Vocation and Physical Education Facilities ($7 million, FY2013)
Statewide Impacts of Oil-related Revenue on Selected State Government Programs
A multitude of state government programs have far-reaching impacts on Alaskans and Alaska communities.
Below are some key examples of programs funded by oil- and gas-related revenue that have statewide
implications, including:
• Alaska Permanent Fund Dividend, affecting 631,470 Alaskans in 2013.
• State aid to K-12 Public Schools, affecting 129,021 Alaskan students, and funding to the University of
Alaska in 2013.
• Medicaid payments, affecting approximately 137,700 recipients of health care services in 2013.
• Community Revenue Sharing Programs, affecting about 229 municipalities, boroughs, cities, and
unincorporated communities throughout Alaska.
THE ALASKA PERMANENT FUND AND THE PERMANENT FUND DIVIDEND
In 1976, as pipeline construction neared completion, Alaska voters approved a constitutional amendment to
establish the Alaska Permanent Fund. The purpose of the Fund was to create a “Rainy Day” account to cover
future volatility or decline in oil revenues. The principal of the fund represents at least 25 percent of all mineral
lease rents, royalties, royalty sales proceeds, federal mineral revenue-sharing payments and bonuses.
The Role of the Oil and Gas Industry in Alaska’s Economy McDowell Group, Inc. • Page 35
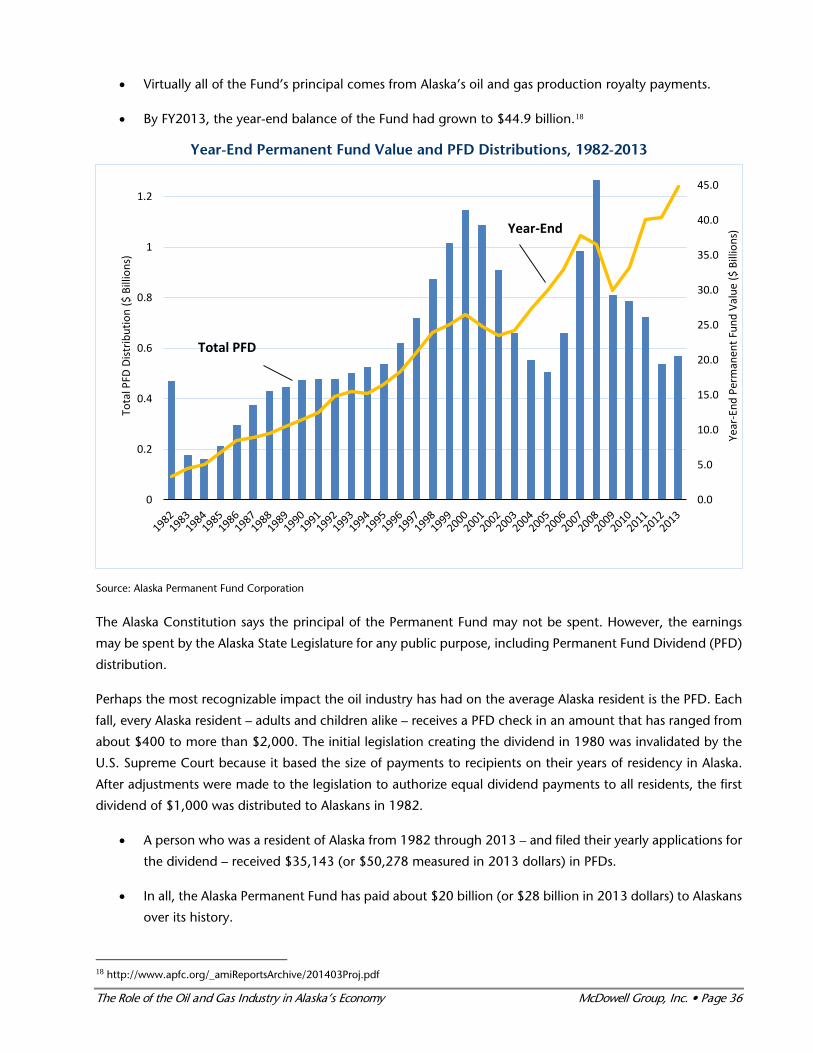
• Virtually all of the Fund’s principal comes from Alaska’s oil and gas production royalty payments.
• By FY2013, the year-end balance of the Fund had grown to $44.9 billion.18
Year-End Permanent Fund Value and PFD Distributions, 1982-2013
Source: Alaska Permanent Fund Corporation
The Alaska Constitution says the principal of the Permanent Fund may not be spent. However, the earnings
may be spent by the Alaska State Legislature for any public purpose, including Permanent Fund Dividend (PFD)
distribution.
Perhaps the most recognizable impact the oil industry has had on the average Alaska resident is the PFD. Each
fall, every Alaska resident – adults and children alike – receives a PFD check in an amount that has ranged from
about $400 to more than $2,000. The initial legislation creating the dividend in 1980 was invalidated by the
U.S. Supreme Court because it based the size of payments to recipients on their years of residency in Alaska.
After adjustments were made to the legislation to authorize equal dividend payments to all residents, the first
dividend of $1,000 was distributed to Alaskans in 1982.
• A person who was a resident of Alaska from 1982 through 2013 – and filed their yearly applications for
the dividend – received $35,143 (or $50,278 measured in 2013 dollars) in PFDs.
• In all, the Alaska Permanent Fund has paid about $20 billion (or $28 billion in 2013 dollars) to Alaskans
over its history.
18 http://www.apfc.org/_amiReportsArchive/201403Proj.pdf
0.0
5.0
10.0
15.0
20.0
25.0
30.0
35.0
40.0
45.0
0
0.2
0.4
0.6
0.8
1
1.2
Year
-End
Per
man
ent F
und
Valu
e ($
Bill
ions
)
Tota
l PFD
Dist
ribut
ion
($ B
illio
ns)
Total PFD
Year-End
The Role of the Oil and Gas Industry in Alaska’s Economy McDowell Group, Inc. • Page 36

These PFDs are a distinct and unique element of Alaska’s economy. The PFD represents a large cash infusion
that benefits every Alaska household:
• The PFD distribution in 2012 ($536 million) represented 10 percent of all government transfer
payments ($5.3 billion) to Alaska residents.19
PFD payments serve an especially important role in rural Alaska, where opportunities to earn cash income are
often limited. To illustrate, the 2013 median household income in Wade Hampton Census Area was an
estimated $40,608.20 The average family household included five people. Assuming each member of the family
received a $900 PFD in 2013 (totaling $4,500), the combined PFD income would represent 11 percent of that
family’s total household income.
A statewide survey conducted by McDowell Group in 2008 showed that 62 percent of Alaskans used a portion
of their PFD to pay for household expenses (such as maintenance, rent, utility bills), 58 percent saved or invested
a portion of their PFD, including college funds, 40 percent used it to pay debt (such as credit card debt,
garnishment, child support payments), 33 percent used it for vacation, 31 percent donated a portion to a
charity, and 19 percent used it to make a major purchase of more than $500 (such as snow machines, TVs,
four-wheelers).21 Like other income that enters Alaska’s economy, the PFD supports additional jobs and income
beyond the initial payment to recipients and has far-reaching impacts on many sectors in Alaska’s economy
(which are described in more detail later in this chapter).
STATE FUNDING OF K-12 SCHOOLS AND THE UNIVERSITY OF ALASKA
K-12 Support
Support of Alaska’s public K-12 school funding is determined using a “foundation formula” (adopted in 1998).
The formula calculates the amount of state aid to individual school districts each year based on student
enrollment, defined as the “average daily membership” (ADM). ADM is adjusted for variations in school size,
geographic cost differentials, special and intensive needs student populations, correspondence programs,
federal aid, and the ability of communities to provide local contributions. The adjusted ADM is then multiplied
by the Base Student Allocation (BSA) to determine each district’s level of state funding.
In FY2013,
• 76 percent (or $1.2 billion) of Alaska Department of Education and Early Development (DEED)’s total
budget ($1.5 billion) was allocated to state aid to Alaska’s K-12 public schools.
o 97 percent ($1.15 billion) of state aid to public schools was funded by UGF.
Oil revenue-related UGF was $1.05 billion (92 percent of UGF).
• The ADM was 129,021 Alaska public school students.
19 Bureau of Economic Analysis, Personal Income data. 20 American Community Survey 2008-2012 Five-Year Average data. 21 McDowell Group, A Statewide Household Survey of Alaskan Giving, prepared for The Alaska Giving Coalition, March 2008.
The Role of the Oil and Gas Industry in Alaska’s Economy McDowell Group, Inc. • Page 37

• On average, each student received approximately $9,100 in state aid, including a BSA of $5,680, and
other funding support (such as adjustments of ADM, pupil transportation, DEED grants, etc.).
o Approximately $8,900 per student was funded by UGF.
Approximately $8,170 per student was oil revenue-related UGF, or $9 out of every $10
of K-12 student support was supported by oil revenue.
• Oil revenue supports 90 percent ($5,100) of total BSA allocated to each public school student.
University of Alaska System
The University of Alaska system includes University of Alaska Anchorage (UAA), University of Alaska Fairbanks
(UAF), and University of Alaska Southeast (UAS). About 35,000 full- and part-time students are enrolled system-
wide. The university employs thousands of people and contributes an estimated $1.1 billion annually to the
Alaska economy.22
• In FY2013, $363 million in UGF was used to support the University of Alaska system, or 43 percent of
its total receipts from the state’s operating budget, or 39 percent of its budget from oil-revenue-related
UGF.
o For the UAF campus, 45 percent ($112 million) of its total operating budget is funded by oil-
related revenue.
o For the UAA campus, 39 percent ($102 million) is oil-related revenue.
o For the UAS campus, 52 percent ($21 million) is oil-related revenue.
MEDICAID PAYMENTS
Medicaid is the nation’s major source of health insurance for low-income families and also covers long-term
care services for the elderly and disabled. The Medicaid program in Alaska is administered by the Alaska
Department of Health and Social Services.
Medicaid financing rules require states to spend their own funds to receive federal financial match for Medicaid
services.23 The federal government covers 50 percent of state expenditures for the majority of Medicaid services
for eligible recipients and 65 percent of state expenditures for eligible children (ages 0-18) and expectant and
new mothers (60 days after birth). Coverage for children and new mothers is handled through the Denali Kid
Care program (Alaska’s Children Health Insurance Program).24
In recent years, there has been a concentrated push to enroll eligible individuals in Medicaid, and the number
of beneficiaries has grown 18 percent since 2008.
22 Economic Impact of the University of Alaska, prepared by McDowell Group, August 2012. 23 There are no federal limits on program spending. 24 The Federal Medical Assistance Percentage (FMAP) and Enhanced Federal Medical Assistance Percentage (eFMAP) are formula based and can vary. The eFMAP for 2013 is 65 percent.
The Role of the Oil and Gas Industry in Alaska’s Economy McDowell Group, Inc. • Page 38

• In 2012, 137,678 individuals received medical benefits through the Medicaid Program.25
• The state’s FY2013 budget for Medicaid was $1.4 billion, including $605 million in UGF (42 percent of
total), $836 million in federal support (58 percent), and $7 million in other funding (<1 percent).
o UGF related to oil revenue accounted for 38 percent (or $557 million) of Alaska’s Medicaid
program budget.
• Since state funds are required to obtain the federal match, without oil revenue the entire Medicaid
program in Alaska would be at risk.
o Approximately $9 of every $10 of Alaska’s state match of federal dollars is related to oil revenue
($557 million out of $612 million total)
o Approximately $4 of every $10 spent on Medicaid in Alaska (both state and federal funds) is
related to oil revenue ($557 million out of $1.4 billion).
COMMUNITY REVENUE SHARING PROGRAMS
The Community Revenue Sharing program is one of the most important sources of non-locally generated
operating revenue for Alaska’s communities (AS 29.60.850-.879 and 3 AAC 180). The Community Revenue
Sharing Program annually provides Alaska’s boroughs, cities, and unincorporated communities with funds vital
to the delivery of basic public services. Payments received from the State by communities can be used at their
discretion for any public purpose.26 Municipalities and unincorporated communities may receive, upon
application, a base payment, plus a per capita payment.
The Community Revenue Sharing Fund is established in the State’s General Fund (of which 92 percent is funded
by oil-revenue-related UGF). One-third of the Fund’s amount is distributed by the Alaska Department of
Commerce, Community and Economic Development. If the fund balance falls below $60 million, no payments
may be made from the fund. Historically, the Fund has had a balance of $180 million, so $60 million withdrawn
by the Department for distribution is replenished each year.
• Since the Fund’s inception in 1985, $1.6 billion (or $2.7 billion in 2013 dollars) has been distributed.
• An estimated $9 of every $10 distributed from the Fund is oil-revenue-related, reaching about 229
municipalities, boroughs, and unincorporated communities throughout Alaska.
The Legislature appropriates the fund using revenue from the Oil and Gas Production Tax at base payments of:
• $480,000 for Municipalities, of which $441,600 comes from oil-related UGF
• $384,000 for Organized Boroughs ($353,280 oil-related UGF)
• $96,000 for Cities ($88,320 oil-related UGF)
25 Source: FY14 Budget Overview citing MMIS/JUCE. Count includes beneficiaries for whom a direct services claim was paid. Total associated payment is $731.7 million. Excludes CAMA, Senior Care Drug and Public Assistance field service benefits. 26 http://www.commerce.alaska.gov/dnn/dcra/CommunityAidAccountability/CommunityRevenueSharing.aspx
The Role of the Oil and Gas Industry in Alaska’s Economy McDowell Group, Inc. • Page 39

• $32,000 for Unincorporated Communities in the unorganized borough ($29,440 oil-related UGF)
• $20,200 for Unincorporated Communities in organized boroughs ($18,580 oil-related UGF)
If the amount of funding available exceeds the amount needed to fund the basic payments, the balance is
distributed on a per capita basis, excluding the unincorporated communities located within organized
boroughs.
For some of Alaska’s smaller communities, the Revenue Sharing program is critical to sustain their operations.
Two examples include Akhiok where program funding accounted for 57 percent of the community’s revenues
($138,880 out of $241,437 total (FY2014)) and Eagle were receipts from the program’s fund represented 70
percent of its total revenue ($95,000 out of $136,240 total (FY2013)). This funding helps support government
services throughout communities and also generate economic activity (in the form of local government staffing,
operating expenses, or community projects.)
Local Government Revenue
Property taxes are paid directly to local governments by businesses and perform a similar role to state revenue
sharing in that they represent unrestricted revenue to communities. The choice for both state and local
governments if they did not have the oil-related revenue would be to provide fewer services and spend less on
capital projects, raise more taxes from businesses and households, or most likely some combination of both.
Oil and Gas Property Taxes
Oil and gas property is assessed and taxed by the state and then distributed to the local government entities
in which the property is located.
• Oil and gas property taxes totaled $405 million in FY2013 and made up 25 percent of all local tax
revenue collected in Alaska.
Oil and gas property tax revenue rose 6 percent from FY2012 to FY2013. During the same period, sales tax
and special tax revenue increased 3 percent and 9 percent respectively.27
27 Special taxes apply to motor fuel, raw fish, hotel beds, and alcohol and tobacco products, among others.
The Role of the Oil and Gas Industry in Alaska’s Economy McDowell Group, Inc. • Page 40

Local Government Tax Revenue by Major Category, FY 2013
($ millions)
Source: Alaska Department of Commerce, Community and Economic Development.
The table below shows the assessed full value of oil and gas property in Alaska, which is highest in the North
Slope Borough ($18.8 billion) because of the many production facilities there. High assessed values in the
Fairbanks North Star Borough ($952 million) and Valdez ($2.6 billion) result from TAPS and marine terminal
facilities. Production facilities in Kenai Peninsula Borough were assessed at $990 million in 2013.
State Taxable Oil and Gas Property, Full Value ($ millions), 2007 – 2013
2007 2008 2009 2010 2011 2012 2013
Borough or Municipality
Anchorage $264.9 $92.3 $235.9 $229.0 $255.4 $283.3 $350.8
Fairbanks North Star
369.5 508.8 694.1 763.4 705.6 669.2 951.7
Kenai 607.1 635.3 703.10 714.0 699.0 810.1 989.8
Mat-Su 2.7 7.2 6.0 7.7 7.2 7.1 7.8
North Slope 11,415.7 12,713.0 14,638.0 16,113.5 16,591.8 17,427.0 18,784.7
Cities in Unorganized Boroughs
Cordova $4.40 $5.9 $9.0 $10.1 $8.7 $8.6 $12.5
Valdez 992.9 1,327.1 1,978.6 2,151.2 1,943.9 1,882.7 2,676.7
Whittier 0.7 0.9 1.5 1.7 1.5 1.5 2.1
Subtotal 13,657.8 15,290.4 18,268.0 19,990.5 20,213.0 21,089.4 23,776.1
Outside Taxing Jurisdictions
1,957.5 2,634.0 3,813.2 4,045.6 3,609.2 3,402.3 4,874.6
State Oil & Gas Full Value Assessment
$15,615.30 $17,924.40 $22,082.10 $24,036.10 $23,822.19 $24,491.7 $28,650.6
Source: Alaska Department of Commerce, Community and Economic Development.
Oil and Gas Property Taxes,
$405
Other Property Taxes, $883
Sales Taxes, $223
Special Taxes, $102
The Role of the Oil and Gas Industry in Alaska’s Economy McDowell Group, Inc. • Page 41

• North Slope oil and gas property tax revenues were $348 million in 2013, or 99 percent of all property
tax revenue collected by the North Slope Borough.
• Oil and gas property taxes made up 88 percent of property tax revenue in Valdez and significant
percentages in the Kenai Peninsula Borough (14 percent) and the Fairbanks North Star Borough (8.4
percent).
• In 2013, oil and gas property taxes accounted for a third (34 percent) of all property tax revenue to all
of Alaska’s municipalities and boroughs that receive property tax payments for oil and gas infrastructure
in their jurisdictions.
• Total oil and gas property taxes to local governments increased by $148 million, or 74 percent,
between 2007 and 2013.
Local Revenues from Oil & Gas Property Taxes ($ millions), 2007 - 2013
2007 2008 2009 2010 2011 2012 2013
% of Total 2013
Property Tax
Receipts
City, Borough, or Municipality
Anchorage $4.2 $3.5 $1.4 $3.5 $3.4 $3.9 $5.5 1.1%
Fairbanks North Star Borough 5.7 5.3 6.9 9.3 10.7 9.6 9.1 8.4
Also taxed by City of Fairbanks
0.0 0.0 0.0 0.2 0.1 0.2 0.1 0.7
Kenai Peninsula Borough 7.0 6.7 6.6 6.8 7.1 6.7 7.8 13.7
Also taxed by City of Kenai 0.1 0.1 0.1 0.1 0.1 0.1 0.0 0.3
Mat-Su 0.0 0.1 0.1 0.1 0.1 0.2 0.1 0.1
North Slope 199.1 211.5 235.2 270.8 307.1 322.4 347.5 99.2
Valdez 19.9 26.5 39.6 43.0 43.8 38.9 34.5 88.0
All Other (Cordova/Whittier) <0.1 <0.1 <0.1 0.1 0.1 <0.1 <0.1 2.4
Total Oil & Gas Property Tax Revenues
$236.0 $253.7 $289.9 $333.9 $372.3 $382.1 $405.2 33.9%
Adjusted Tax Revenues (2013 Dollars) $265.2 $274.5 $314.8 $356.7 $385.6 $387.5 $405.2 33.9%
Source: Alaska Department of Commerce, Community and Economic Development.
Employment Impact of State and Local Oil Revenue
As described above, taxes and royalties payments from the oil and gas industry to state and local governments
are used to fund a broad range of agency operations, programs and projects. As these oil-related revenues are
spent, thousands of jobs and millions of dollars in wages are generated across Alaska. Economic modelling
conducted for purposes of this study provide estimates of the total (direct, indirect, and induced) employment
and wage impacts associated with government spending of oil-related revenue. The results of that analysis are
summarized in the following table (see next page).
The Role of the Oil and Gas Industry in Alaska’s Economy McDowell Group, Inc. • Page 42

Employment and Wages Related to Oil Industry Taxes and Royalties in Alaska, 2013
Spending of Oil &Gas Taxes & Royalties
($billions)
Total Employment
Total Annual Wages
($billions)
State Agencies (agencies plus UA) $2.3 19,500 $1.03
State Programs (K-12 education, Medicaid, etc.) $1.9 22,200 $1.02
State Capital Projects (3-year average) $1.2 12,000 $0.63
Permanent Fund Dividend (3-year average) $0.6 3,300 $0.14
Local Government Operations and Projects $0.4 3,500 $0.16
Grand Total $6.3 60,500 $2.98 Source: Alaska Legislative Finance and McDowell Group estimates.
Employment and wages impacts in FY2013 include,
• State Agency Operations: $2.3 billion in unrestricted oil and gas revenues were used to fund state
agency operations (including the University of Alaska). That spending funded a total of 19,500 jobs,
included approximately 10,000 state government jobs and another 9,500 jobs in the support sector.
These jobs accounted for a total of $1.03 billion in annual wages.
• Statewide Program Expenditures: Approximately $1.9 billion in state program expenditures (of oil and
gas derived revenues) generated approximately 22,200 jobs in schools, medical care facilities, and
throughout the support sector.
• Capital Spending: Approximately $1.2 billion of oil-related revenue was used to fund capital projects.
While this capital funding is often matched with funding from other sources (especially federal dollars),
in general this level of construction spending would have direct, indirect, and induced effects of
approximately 12,000 jobs and $630 million in wages.
Oil revenues also fund the Alaska Permanent Fund. Over the past three an average of $600 million has
distributed to Alaska’s through the PFD program. The portion of those dividends that is spent in Alaska creates
jobs and income.
• PFD Distribution: Assuming the dividends are spent much like other household income, PFD spending
accounts for an estimated 3,300 jobs and $140 million in annual wages.
Finally, local governments took in $405 million in property tax payments from the oil and gas industry in
FY2013. Property tax revenues are spent to provide a range of local government services, somewhat similar to
state government.
• Local Government: An estimated 3,500 direct, indirect and induced jobs are connected to spending oil
and gas property taxes paid to local governments. These jobs account for approximately $160 million
in annual wages.
In summary, taxes and royalties paid by the oil and gas industry account for just over 60,000 jobs in Alaska and
$3 billion in annual wages.
The Role of the Oil and Gas Industry in Alaska’s Economy McDowell Group, Inc. • Page 43
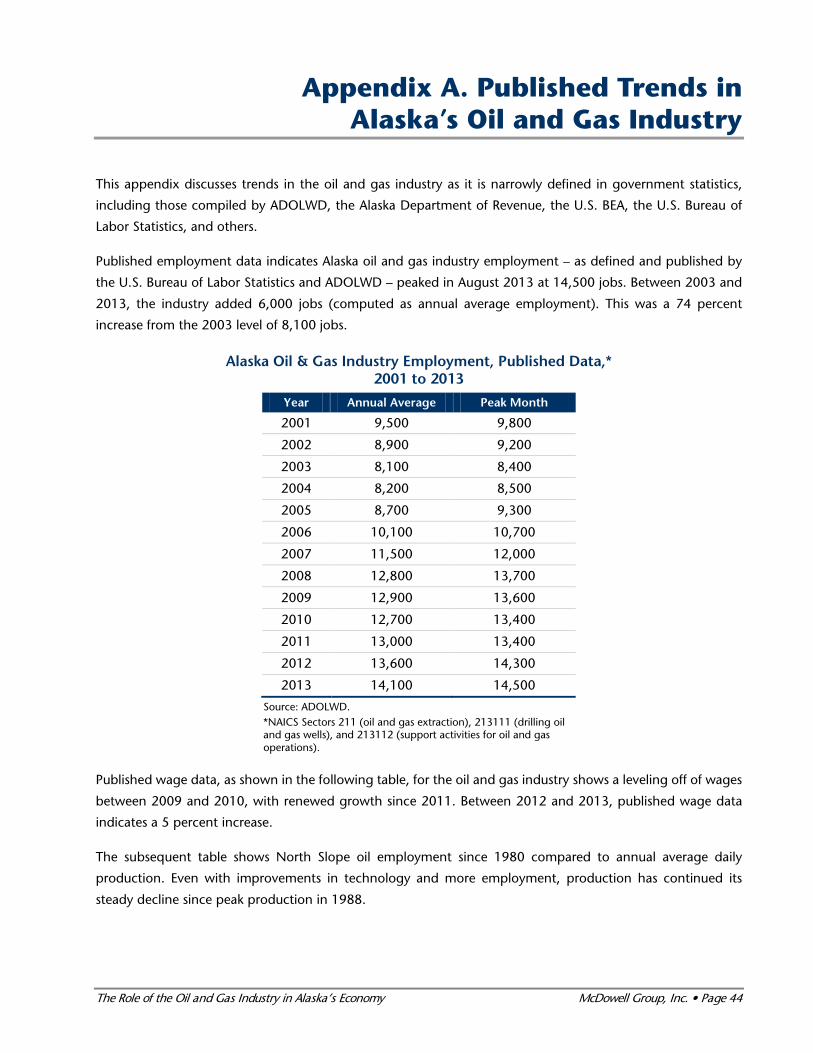
Appendix A. Published Trends in Alaska’s Oil and Gas Industry
This appendix discusses trends in the oil and gas industry as it is narrowly defined in government statistics,
including those compiled by ADOLWD, the Alaska Department of Revenue, the U.S. BEA, the U.S. Bureau of
Labor Statistics, and others.
Published employment data indicates Alaska oil and gas industry employment – as defined and published by
the U.S. Bureau of Labor Statistics and ADOLWD – peaked in August 2013 at 14,500 jobs. Between 2003 and
2013, the industry added 6,000 jobs (computed as annual average employment). This was a 74 percent
increase from the 2003 level of 8,100 jobs.
Alaska Oil & Gas Industry Employment, Published Data,* 2001 to 2013
Year Annual Average Peak Month
2001 9,500 9,800
2002 8,900 9,200
2003 8,100 8,400
2004 8,200 8,500
2005 8,700 9,300
2006 10,100 10,700
2007 11,500 12,000
2008 12,800 13,700
2009 12,900 13,600
2010 12,700 13,400
2011 13,000 13,400
2012 13,600 14,300
2013 14,100 14,500
Source: ADOLWD. *NAICS Sectors 211 (oil and gas extraction), 213111 (drilling oil and gas wells), and 213112 (support activities for oil and gas operations).
Published wage data, as shown in the following table, for the oil and gas industry shows a leveling off of wages
between 2009 and 2010, with renewed growth since 2011. Between 2012 and 2013, published wage data
indicates a 5 percent increase.
The subsequent table shows North Slope oil employment since 1980 compared to annual average daily
production. Even with improvements in technology and more employment, production has continued its
steady decline since peak production in 1988.
The Role of the Oil and Gas Industry in Alaska’s Economy McDowell Group, Inc. • Page 44
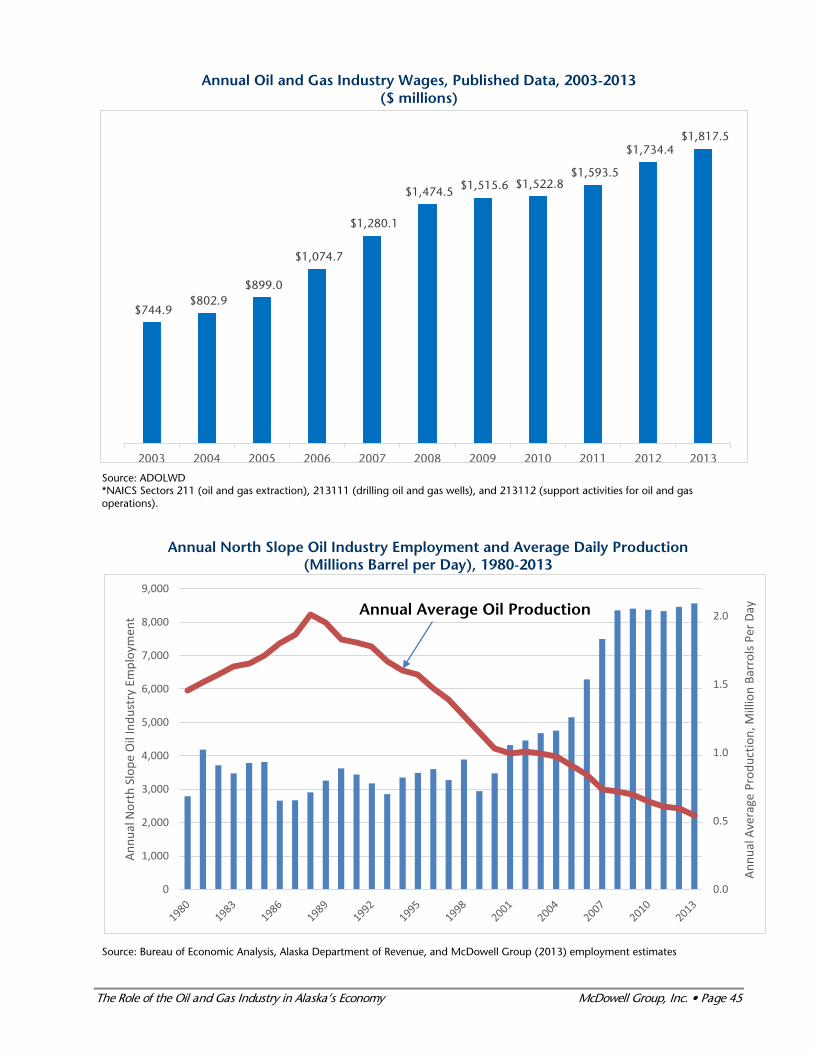
Annual Oil and Gas Industry Wages, Published Data, 2003-2013 ($ millions)
Source: ADOLWD *NAICS Sectors 211 (oil and gas extraction), 213111 (drilling oil and gas wells), and 213112 (support activities for oil and gas operations).
Annual North Slope Oil Industry Employment and Average Daily Production (Millions Barrel per Day), 1980-2013
Source: Bureau of Economic Analysis, Alaska Department of Revenue, and McDowell Group (2013) employment estimates
The Role of the Oil and Gas Industry in Alaska’s Economy McDowell Group, Inc. • Page 45
$744.9 $802.9
$899.0
$1,074.7
$1,280.1
$1,474.5 $1,515.6 $1,522.8 $1,593.5
$1,734.4 $1,817.5
2003 2004 2005 2006 2007 2008 2009 2010 2011 2012 2013
0.0
0.5
1.0
1.5
2.0
0
1,000
2,000
3,000
4,000
5,000
6,000
7,000
8,000
9,000
Annu
al A
vera
ge P
rodu
ctio
n, M
illio
n Ba
rrol
s Per
Day
Annu
al N
orth
Slo
pe O
il In
dust
ry E
mpl
oym
ent Annual Average Oil Production

Appendix B: Published Workforce Residency Data
Published Trends in Oil and Gas Workforce Residency
ADOLWD’s methodology for calculating workforce residence is based on Permanent Fund Dividend (PFD)
applications and produces a conservative estimate of “resident” employment. A new resident to Alaska must
reside in the state for a full calendar year before he or she is eligible to apply for a PFD. A new Alaska resident
who arrived in the state in March of 2013, for example, would not be eligible to apply for a PFD until the 2015
application period. As a result, this person would actually reside in Alaska for nearly two years before being
recorded as an Alaska resident.
ADOLWD publishes data on the residency of Alaska’s oil and gas industry workforce, again using a narrower
description for the industry that excludes the refineries, pipeline transportation companies, and the large
number of businesses that provide services directly to oil and gas producers, including construction companies,
transportation providers, camp support services firms, engineering firms, and others.
The data on nonresident and resident employment are slightly different than the employment numbers in that
they are a count of individual workers who worked in the industry at any point during the year, rather than an
average number of jobs in the industry over 12 months. That is why the total number of workers in the chart
below does not match the annual average employment totals in the chart above.
In the last 12 years, the total number of Alaskans employed in the oil and gas industry at some point during
the year hit a low point in 2003 at just over 8,000 workers. The low point for nonresident employment was
also in 2003 at about 2,900. Between 2008 and 2012, overall employment increased and held steady just
under the 12,000 mark with a similar ratio of resident to nonresident workers.
The share of nonresidents in Alaska’s oil and gas industry workforce has been fairly steady at between 26 percent
and 32 percent over the decade.
The Role of the Oil and Gas Industry in Alaska’s Economy McDowell Group, Inc. • Page 46

Alaska Oil & Gas Industry Workforce Residency, 2001 – 2012 Oil and Gas Extraction and Support Services Combined
Year Alaska
Resident Employment
Nonresident Employment
Total Nonresident Percent of
Total
2001 10,480 4,068 14,548 28%
2002 9,315 3,200 12,515 26
2003 8,056 2,914 10,970 27
2004 8,126 3,167 11,293 28
2005 8,186 3,442 11,628 30
2006 10,102 4,495 14,597 31
2007 10,941 4,531 15,472 29
2008 11,887 5,043 16,930 30
2009 11,841 4,627 16,468 28
2010 11,853 5,226 17,079 31
2011 11,747 5,302 17,049 31
2012 11,971 5,530 17,501 32
Source: ADOLWD.
ADOLWD provided 2012 data on worker residency for the oil and gas extraction, drillers, support services,
refineries and pipelines. On average, just under 30 percent of oil and gas industry workers are not residents of
Alaska (i.e., were not eligible to receive a PFD).
Alaska Residents in the Oil & Gas Industry Workforce, 2012
Resident Workers
Nonresident Workers
Nonresident % of Total
Resident Wages
($millions)
Nonresident Wages
($millions)
Nonresident % of Total
Oil & Gas Extraction 3,272 1,155 26.1% $548.9 $195.2 25.2%
Drilling Oil and Gas wells
776 293 27.4 68.8 21.8 24.1
Support Services 7,925 4,080 34.0 628.1 323.0 34.0
Refineries and Pipelines
1,503 118 7.2 165.1 10.0 5.7
Total 13,476 5,646 29.5% $1,410.9 $550.0 28.0%
Source: ADOLWD. Note: Data based on worker counts rather than annual average employment.
A more complete picture of resident participation in Alaska’s oil and gas industry would include those businesses
that provide goods and services directly to oil and gas producers. However, those figures are not captured by
published government statistics.
The Role of the Oil and Gas Industry in Alaska’s Economy McDowell Group, Inc. • Page 47

Regardless of the measure used, it is important to note Alaska’s economy overall relies on a significant
nonresident workforce. Statewide, 24 percent of the private workforce was defined as nonresident in 2012.
Sectors with higher nonresident participation than the oil and gas industry include seafood processing (74
percent nonresident), Scenic and Sightseeing Transportation (52 percent), and Accommodations (42 percent).
Even state government has 7 percent nonresident workers, mainly because of the lag between the time a person
may move to the state and the time when the data recognizes them as a resident.
Percent Nonresident Workers in Alaska, by Sector, DOLWD Published Data, 2012
Source: ADOLWD. Note: *Combined oil and gas industry includes oil and gas extraction, drillers of oil and gas wells, oil and gas support services, refineries, and pipeline companies.
74%
52%
42%
34%30%
27%24% 23% 20%
10%7% 7%
The Role of the Oil and Gas Industry in Alaska’s Economy McDowell Group, Inc. • Page 48


