The Role of Variable Slab Dip in Driving Mantle Flow atthe Eastern Edge of the Alaskan Subduction Margin:Insights From Shear-Wave SplittingC. M. A. Venereau1,2, R. Martin-Short2 , I. D. Bastow1 , R. M. Allen2 , and R. Kounoudis1
1Department of Earth Science and Engineering, Imperial College London, London, UK, 2Seismological Laboratory,University of California, Berkeley, CA, USA
Abstract Alaska provides an ideal tectonic setting for investigating the interaction betweensubduction and asthenospheric flow. Within the span of a few hundred kilometers along strike, thegeometry of the subducting Pacific plate varies significantly and terminates in a sharp edge. Furthermore,the region documents a transition from subduction along the Aleutian Arc to strike-slip faulting along thePacific Northwest. To better understand mantle interactions within this subduction zone, we conduct anSKS shear-wave splitting analysis on passive-source seismic data collected between 2011 and 2018 at 239broadband seismometers, including those from the Transportable Array. Anisotropic fast directions in theeast of our study area parallel the Queen Charlotte and Fairweather transform faults, suggesting that theongoing development of lithospheric anisotropy dominates the results there. However, our observed delaytimes (𝛿t = 1–1.5 s) obtained across the study region may also imply an asthenospheric contribution to thesplitting pattern. Our splitting observations exhibit slab-parallel fast directions northwest of the trench anda rotation of fast directions around the northeastern slab edge. These observations suggest the presence oftoroidal asthenospheric flow around the edge of the downgoing Pacific plate. We suggest that WrangellVolcanic Field volcanism might be caused by mantle upwelling associated with this flow. Splittingobservations closer to the trench can be explained by fossil anisotropy within the downgoingPacific-Yakutat plate combined with entrained subslab mantle. The geometry of the slab, including itsvariable dip and its abrupt eastern edge, thus plays an important role in governing mantle flow beneathAlaska.
1. IntroductionThe tectonics of southern Alaska are dominated by the northward subduction of the Pacific plate beneaththe North American plate (Figure 1). South-central Alaska exhibits a so-called “corner geometry” becauseit lies at the northeastern vertex of the Pacific plate, which is bounded to the east by transform faults andto the north by subduction (Eberhart-Phillips et al., 2006; Jadamec & Billen, 2010). Here the Pacific platesubducts beneath North America at a rate of ∼50 mm/year (Sauber et al., 1997). Active volcanism is abun-dant in Alaska, but its relationship to subduction is debated (e.g., Martin-Short et al., 2016). The subductiongeometry is heterogeneous along strike, transitioning from a steeply dipping slab under the Aleutians toshallow subduction at the eastern end of the subduction zone, which is associated with a paucity of volcan-ism known as the Denali Gap (Christenson et al., 2010; Martin-Short et al., 2016; Nye, 1999; Rondenay et al.,2010). This setting is further complicated by active collision and accretion of the Yakutat terrane (Figure 1),which is occurring at the easternmost boundary of the subduction zone (Eberhart-Phillips et al., 2006; Wang& Tape, 2014). The Yakutat terrane is a region of overthickened oceanic crust that has been convergingwith the Alaskan margin for ≥23 Ma and has led to broad continental deformation and uplift of the coastalChugach-St. Elias ranges (Christenson et al., 2010; Koons et al., 2010; Plafker & Berg, 1994). Furthermore,subduction of the thick, buoyant, Yakutat crust is believed to have caused the flattening of the subductingslab and cessesion of volcanism in the Denali Gap (Christenson et al., 2010; Plafker & Berg, 1994). The vari-ation of mantle flow geometry along strike beneath the Alaskan margin is poorly constrained. South-centralAlaska is therefore an ideal place to study the interaction between present-day mantle flow and varyingsubduction geometries.
A further unexplained tectonic feature of the region is the Wrangell Volcanic Field (WVF; Figure 1),which lies just east of the eastern edge of the subducted Yakutat terrane. The WVF has experienced
RESEARCH ARTICLE10.1029/2018GC008170
Key Points:• Fast directions parallel major
transform faults and Yakutat terranesubduction, suggesting a lithosphericsource of anisotropy
• Fast directions wrapping aroundthe slab edge and high delay timessuggest a toroidal asthenosphericflow as another cause of anisotropy
• Variability in slab geometry exertsfirst-order control over mantle flowat the edge of the Alaskan margin
Supporting Information:• Supporting Information S1• Table S1• Figure S1
Citation:Venereau, C. M. A., Martin-Short, R.,Bastow, I. D., Allen, R. M., &Kounoudis, R. (2019). The role ofvariable slab dip in driving mantleflow at the eastern edge of theAlaskan subduction margin: Insightsfrom shear-wave splitting.Geochemistry, Geophysics,Geosystems, 20, 2433–2448. https://doi.org/10.1029/2018GC008170
Received 2 JAN 2019Accepted 11 APR 2019Accepted article online 18 APR 2019Published online 27 MAY 2019
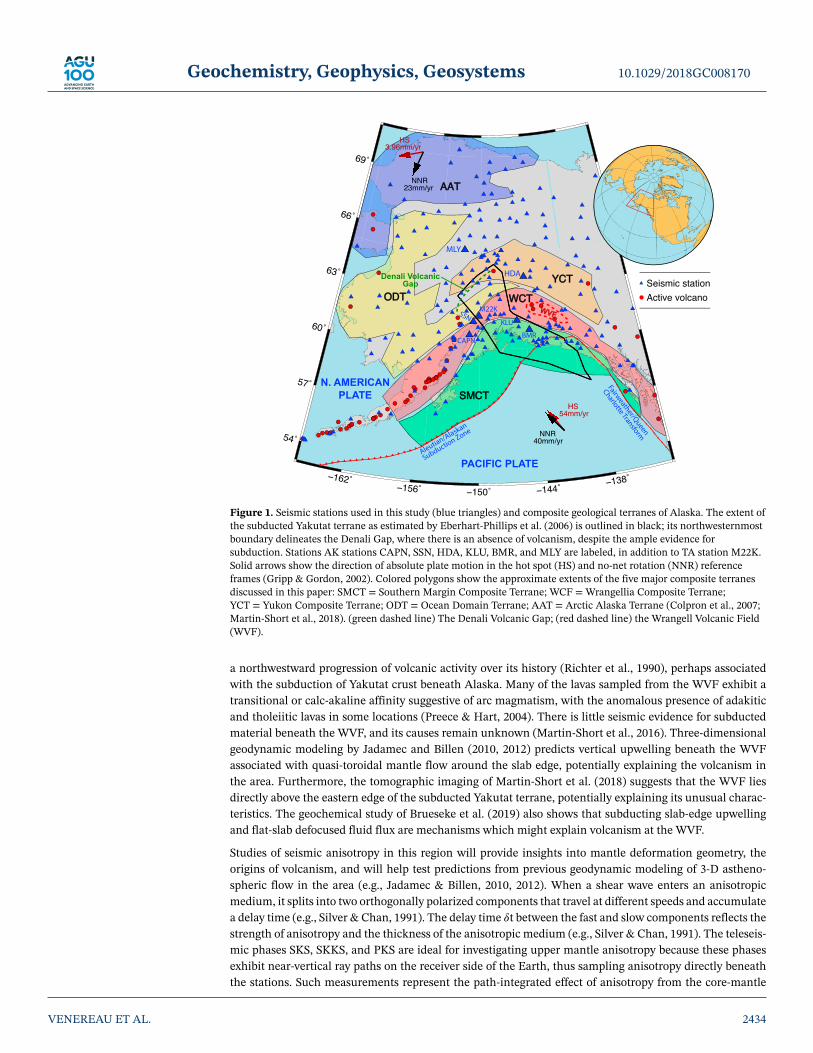
Figure 1. Seismic stations used in this study (blue triangles) and composite geological terranes of Alaska. The extent ofthe subducted Yakutat terrane as estimated by Eberhart-Phillips et al. (2006) is outlined in black; its northwesternmostboundary delineates the Denali Gap, where there is an absence of volcanism, despite the ample evidence forsubduction. Stations AK stations CAPN, SSN, HDA, KLU, BMR, and MLY are labeled, in addition to TA station M22K.Solid arrows show the direction of absolute plate motion in the hot spot (HS) and no-net rotation (NNR) referenceframes (Gripp & Gordon, 2002). Colored polygons show the approximate extents of the five major composite terranesdiscussed in this paper: SMCT = Southern Margin Composite Terrane; WCF = Wrangellia Composite Terrane;YCT = Yukon Composite Terrane; ODT = Ocean Domain Terrane; AAT = Arctic Alaska Terrane (Colpron et al., 2007;Martin-Short et al., 2018). (green dashed line) The Denali Volcanic Gap; (red dashed line) the Wrangell Volcanic Field(WVF).
a northwestward progression of volcanic activity over its history (Richter et al., 1990), perhaps associatedwith the subduction of Yakutat crust beneath Alaska. Many of the lavas sampled from the WVF exhibit atransitional or calc-akaline affinity suggestive of arc magmatism, with the anomalous presence of adakiticand tholeiitic lavas in some locations (Preece & Hart, 2004). There is little seismic evidence for subductedmaterial beneath the WVF, and its causes remain unknown (Martin-Short et al., 2016). Three-dimensionalgeodynamic modeling by Jadamec and Billen (2010, 2012) predicts vertical upwelling beneath the WVFassociated with quasi-toroidal mantle flow around the slab edge, potentially explaining the volcanism inthe area. Furthermore, the tomographic imaging of Martin-Short et al. (2018) suggests that the WVF liesdirectly above the eastern edge of the subducted Yakutat terrane, potentially explaining its unusual charac-teristics. The geochemical study of Brueseke et al. (2019) also shows that subducting slab-edge upwellingand flat-slab defocused fluid flux are mechanisms which might explain volcanism at the WVF.
Studies of seismic anisotropy in this region will provide insights into mantle deformation geometry, theorigins of volcanism, and will help test predictions from previous geodynamic modeling of 3-D astheno-spheric flow in the area (e.g., Jadamec & Billen, 2010, 2012). When a shear wave enters an anisotropicmedium, it splits into two orthogonally polarized components that travel at different speeds and accumulatea delay time (e.g., Silver & Chan, 1991). The delay time 𝛿t between the fast and slow components reflects thestrength of anisotropy and the thickness of the anisotropic medium (e.g., Silver & Chan, 1991). The teleseis-mic phases SKS, SKKS, and PKS are ideal for investigating upper mantle anisotropy because these phasesexhibit near-vertical ray paths on the receiver side of the Earth, thus sampling anisotropy directly beneaththe stations. Such measurements represent the path-integrated effect of anisotropy from the core-mantle
boundary to the surface (e.g., Silver & Chan, 1991). Due to mode conversion at the core-mantle bound-ary, the SKS, SKKS, and PKS phase analysis yields measurements that are not contaminated by source-sideanisotropy. In the upper mantle, seismic anisotropy occurs due to the development of lattice-preferred ori-entation (LPO) of anisotropic minerals such as olivine (e.g., Karato et al., 2008). In the absence of shearing,the crystallographic fast axes of these mineral grains are randomly oriented. However, in the asthenosphere,simple shear imposed by plate motions or other macroscopic influences can encourage large-scale align-ment of the crystallographic fast axes. For example, under typical asthenospheric conditions below stablelithosphere and in the presence of simple shear caused by plate motion, the fast axes direction of shear-wavesplitting (𝜙) is generally aligned with the direction of maximum shearing, which can be indicative of flowin the asthenosphere (Hall et al., 2000; Silver & Chan, 1991). However, in atypical mantle conditions, suchas the relatively low temperature, high water-content environment that exists within parts of the mantlewedge at subduction zones, the fast direction may instead align perpendicular to the direction of maximumshear stress (Karato et al., 2008). This is known as B-type fabric. Furthermore, shear-wave splitting may alsoresult from fossil anisotropy in the lithosphere (e.g., Darbyshire et al., 2015; Gilligan et al., 2016; Silver &Chan, 1988) or aligned structural heterogeneities (shape-preferred orientation) such as melt intrusions (e.g.,Blackman & Kendall, 1997; Bastow et al., 2010; Holtzman & Kendall, 2010). Hence, care must be taken indiscerning the main source of the anisotropic signal.
We present a teleseismic shear-wave splitting study of lithospheric and asthenospheric anisotropy insouth-central Alaska using data from 239 broadband seismometers, including the newly installed Trans-portable Array instruments (see Acknowledgments for detailed references). The station coverage is such thatwe are able to investigate a region of steeply dipping slab, a region of flat-slab subduction, the abrupt slabedge, and the transition from subduction to transform faulting along the Pacific Northwest. Our shear-wavesplitting study is the first of its type to have such extensive spatial coverage across south-central Alaska. Bypresenting additional splitting measurements spanning most of mainland Alaska, our study expands on andis in agreement with previous shear-wave splitting studies in this region (e.g., Christensen & Abers, 2009;Hanna & Long, 2012; Perttu et al., 2014), therefore providing important new constraints on present-daymantle flow in the region.
2. Tectonic FrameworkThe Alaskan lithosphere comprises several geologic terranes of various compositions, which have beensutured to the northwestern margin of Laurentia since the late Triassic (e.g., Plafker & Berg, 1994; Figure 1).The geology documents a complex tectonic history of volcanic arc accretion, subduction zone migra-tion, and movement along major strike-slip faults (Colpron et al., 2007; Moore & Box, 2016; O'Driscoll &Miller, 2015).
The oldest rocks in Alaska are Proterozoic-to-Triassic miogeoclinal sediments deposited at the edge of theLaurentian margin (Colpron et al., 2007). Over the past 200 Ma, the region has grown mainly though accre-tion of volcanic, metamorphic, and plutonic assemblages which have been brought to their modern positionsthough a combination of subduction and migration along right-lateral strike-slip faults (Nokleberg et al.,2000; Plafker & Berg, 1994). The accretion of terranes began with the Yukon Composite Terrane in the Tri-assic, followed by the Arctic-Alaska Terrane and Ocean Domain Terrane, which make up the northern andnorthwestern segments of Alaska (Colpron et al., 2007; Nokleberg et al., 2000; Figure 1). The southern mar-gin of Alaska has been a site of northward-verging subduction since the early Jurassic (Plafker & Berg, 1994).Finzel et al. (2011) describe its southward growth in the context of three major accretion events: the Wrangel-lia composite Terrane (middle to late Jurrassic), the Chugach Terrane (Cretaceous), and the Yakutat Terrane(collision ongoing; Moore & Box, 2016).
The Yakutat terrane is a region of thick (>20 km) oceanic crust, thought to have formed as an oceanicplateau 1,500–2,000 km to the south of its current position (e.g., Plafker & Berg, 1994). It was subsequentlyrafted north by motion on the Queen Charlotte/Fairweather transform system (Worthington et al., 2012)and has been subducting beneath the southern margin of Alaska for at least 23 Ma (Ferris et al., 2003).Tomographic models (Eberhart-Phillips et al., 2006; Rondenay et al., 2010) and receiver function studies(Ferris et al., 2003) reveal that thick crust of the Yakutat terrane has penetrated more than 600-km inlandof the trench. Subduction of this thick, buoyant crust is likely responsible for flattening of the slab in thisregion, which in turn has caused broad intraplate deformation and a region of volcanic quiescence known as
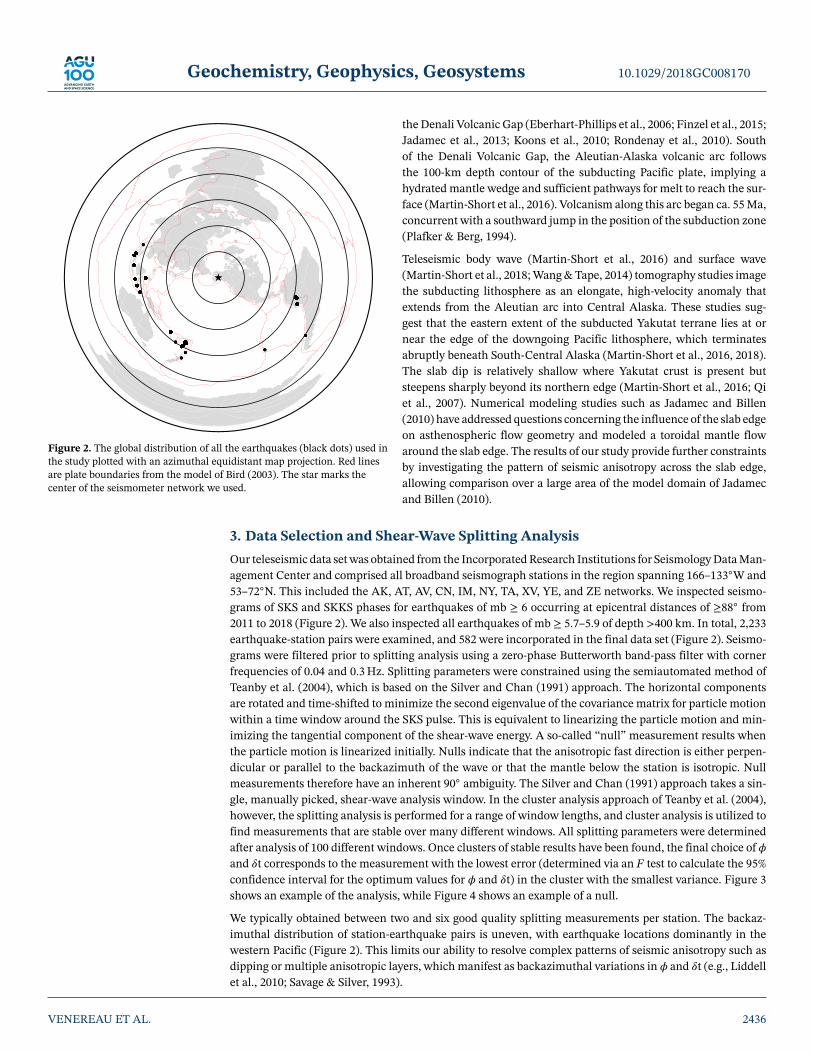
Figure 2. The global distribution of all the earthquakes (black dots) used inthe study plotted with an azimuthal equidistant map projection. Red linesare plate boundaries from the model of Bird (2003). The star marks thecenter of the seismometer network we used.
the Denali Volcanic Gap (Eberhart-Phillips et al., 2006; Finzel et al., 2015;Jadamec et al., 2013; Koons et al., 2010; Rondenay et al., 2010). Southof the Denali Volcanic Gap, the Aleutian-Alaska volcanic arc followsthe 100-km depth contour of the subducting Pacific plate, implying ahydrated mantle wedge and sufficient pathways for melt to reach the sur-face (Martin-Short et al., 2016). Volcanism along this arc began ca. 55 Ma,concurrent with a southward jump in the position of the subduction zone(Plafker & Berg, 1994).
Teleseismic body wave (Martin-Short et al., 2016) and surface wave(Martin-Short et al., 2018; Wang & Tape, 2014) tomography studies imagethe subducting lithosphere as an elongate, high-velocity anomaly thatextends from the Aleutian arc into Central Alaska. These studies sug-gest that the eastern extent of the subducted Yakutat terrane lies at ornear the edge of the downgoing Pacific lithosphere, which terminatesabruptly beneath South-Central Alaska (Martin-Short et al., 2016, 2018).The slab dip is relatively shallow where Yakutat crust is present butsteepens sharply beyond its northern edge (Martin-Short et al., 2016; Qiet al., 2007). Numerical modeling studies such as Jadamec and Billen(2010) have addressed questions concerning the influence of the slab edgeon asthenospheric flow geometry and modeled a toroidal mantle flowaround the slab edge. The results of our study provide further constraintsby investigating the pattern of seismic anisotropy across the slab edge,allowing comparison over a large area of the model domain of Jadamecand Billen (2010).
3. Data Selection and Shear-Wave Splitting AnalysisOur teleseismic data set was obtained from the Incorporated Research Institutions for Seismology Data Man-agement Center and comprised all broadband seismograph stations in the region spanning 166–133◦W and53–72◦N. This included the AK, AT, AV, CN, IM, NY, TA, XV, YE, and ZE networks. We inspected seismo-grams of SKS and SKKS phases for earthquakes of mb ≥ 6 occurring at epicentral distances of ≥88◦ from2011 to 2018 (Figure 2). We also inspected all earthquakes of mb ≥ 5.7–5.9 of depth >400 km. In total, 2,233earthquake-station pairs were examined, and 582 were incorporated in the final data set (Figure 2). Seismo-grams were filtered prior to splitting analysis using a zero-phase Butterworth band-pass filter with cornerfrequencies of 0.04 and 0.3 Hz. Splitting parameters were constrained using the semiautomated method ofTeanby et al. (2004), which is based on the Silver and Chan (1991) approach. The horizontal componentsare rotated and time-shifted to minimize the second eigenvalue of the covariance matrix for particle motionwithin a time window around the SKS pulse. This is equivalent to linearizing the particle motion and min-imizing the tangential component of the shear-wave energy. A so-called “null” measurement results whenthe particle motion is linearized initially. Nulls indicate that the anisotropic fast direction is either perpen-dicular or parallel to the backazimuth of the wave or that the mantle below the station is isotropic. Nullmeasurements therefore have an inherent 90◦ ambiguity. The Silver and Chan (1991) approach takes a sin-gle, manually picked, shear-wave analysis window. In the cluster analysis approach of Teanby et al. (2004),however, the splitting analysis is performed for a range of window lengths, and cluster analysis is utilized tofind measurements that are stable over many different windows. All splitting parameters were determinedafter analysis of 100 different windows. Once clusters of stable results have been found, the final choice of 𝜙and 𝛿t corresponds to the measurement with the lowest error (determined via an F test to calculate the 95%confidence interval for the optimum values for 𝜙 and 𝛿t) in the cluster with the smallest variance. Figure 3shows an example of the analysis, while Figure 4 shows an example of a null.
We typically obtained between two and six good quality splitting measurements per station. The backaz-imuthal distribution of station-earthquake pairs is uneven, with earthquake locations dominantly in thewestern Pacific (Figure 2). This limits our ability to resolve complex patterns of seismic anisotropy such asdipping or multiple anisotropic layers, which manifest as backazimuthal variations in 𝜙 and 𝛿t (e.g., Liddellet al., 2010; Savage & Silver, 1993).
Figure 3. High-quality splitting measurement example from station O30N. (a) The recorded seismogram showing the SKS phase and the initial window.(b) The seismogram rotated into radial and tangential components both before (top two) and after (bottom two) correction with calculated splitting parameters.(c, top L-R) Close up of the SKS phases for the fast and slow waveforms before correction, after correction, and after correction without normalized amplitudes.(bottom L-R) Particle motion before and after correction. (d) Contour map showing stability of the splitting parameters. Lines indicate one standard deviation.The thick line indicates the 95% confidence level. (e) Splitting parameter variations as a function of the changing window. (f) Cluster analysis results for 𝜙 and𝛿t for each of the 100 windows. These values were very stable over the full range of windows.
For stations where we have good backazimuthal coverage, we find relatively little evidence for variationsin 𝜙 and 𝛿t, though some stations (e.g., E24K and MLY) do show some evidence of variation (Figure 5; seesupporting information S1 for a full set of these plots). Abrupt changes in 𝜙 and 𝛿t over very short (<20◦)backazimuth ranges would be diagnostic of a two layer, rather than a dipping layer anisotropic model (e.g.,Liddell et al., 2010), but the lack of evidence for such patterns means discriminating between layered anddipping fabric anisotropic models would be speculative at best.
To obtain a single pair of splitting parameters per station (which we acknowledge assumes a single, horizon-tal, homogeneous anisotropic layer hypothesis), we use of the error matrix stacking procedure of Wolfe andSilver (1998). In the stack, increased weighting is assigned to higher signal-to-noise ratio results, allowingthem to exert greater control on the determined splitting parameters.
Several seismograph stations used in this study have associated instrument misorientations (Hanna & Long,2012). As far as we have been able to determine, these usually time-dependent component azimuth issuesare accurately reported by the Incorporated Research Institutions for Seismology Data Management Centerin the seismogram headers, which our splitting analysis takes account of. In any case, we omit any splittingmeasurements from our analysis whose incoming SKS polarization azimuth does not closely parallel (≤ 15◦)the great circle path defined by the earthquake backazimuth.
Figure 4. Example null measurement for AK station HDA. (a) Radial and tangential components before and after thesplitting analysis were performed. (b, top L-R) Close up of the SKS phases for the fast and slow waveforms beforecorrection, after correction, and after correction without normalized amplitudes. (bottom L-R) Particle motion beforeand after correction. Note the lack of tangential component energy before and after analysis and the linear particlemotion before and after analysis.
Figure 5. The distribution of splitting parameters as a function of backazimuth for (a) TA network station E24K and(b) AK network station MLY. The dashed lines indicate the values of 𝜙 and 𝛿t obtained by stacking these results. Errorbars show the 95% confidence interval on each measurement. See supporting information S1 for a full set of such plots.At many stations, we only obtain splitting results from earthquakes with backazimuths close to 270◦, but for thosestations with a wider range of results, the splitting parameters are generally consistent with backazimuth; station E24Kis one of only a few exceptions to this rule. See Figures S1–S218 for equivalent plots for each station in our study.
4. Shear-Wave Splitting ResultsTable S1 contains the splitting measurements determined at all stations, in addition to stacks for each stationand their associated uncertainties.
Our splitting results are shown in Figure 6, superimposed on a 200-km depth slice through the S wave mantletomographic model of Martin-Short et al. (2016). This depth slice was chosen because it clearly shows thelocation of the subducted slab within the asthenosphere, which is interpreted to be the most significantsource of the observed anisotropic signal (sections 5.4 and 5.5). The subducting Pacific plate appears as anelongate, high-velocity (blue) anomaly that extends beneath the Aleutian volcanic arc and into south-centralAlaska. As demonstrated by Martin-Short et al. (2016), the tomographic model has sufficient resolution toresolve features of the scale of the subducting Pacific plate. Our splitting delay times range from 𝛿t = 0.4 to1.95 s.
Our results can be grouped in three broad categories. First, we observe a pattern of fast directions generallyparallel to the strike of the subducting slab, which we refer to thereafter as slab-parallel, northwest of theslab. Second, at the northeastern edge of the slab, these slab-parallel fast directions fan out and rotate aroundto the south, producing an arcuate pattern of rotating fast directions around the subducting Pacific-Yakutatplate at latitudes ∼65◦N, −147◦W. Third, closer to the trench, at stations such as CAPN, SSN, or M22 K(Figure 1), fast directions are predominantly slab-perpendicular, paralleling the subduction direction of thePacific-Yakutat plate.
Figure 6. Shear-wave splitting observations overlain on a S wave velocity tomographic model (Martin-Short et al.,2016) depth slice at 200-km depth. White bars are null measurements. The splitting measurements rotate around thenortheast edge of the slab, identified by the elongate high-velocity (blue) anomaly. The thick blue line shows the extentof the Yakutat terrane (Eberhart-Phillips et al., 2006). Solid arrows show the direction of absolute plate motion in bothHS and NNR reference frames (Gripp & Gordon, 2002). Subducting slab depth contours from the Slab2.0 model ofHayes et al. (2018) are shown in magenta. The solid thick red line marks the north American-Pacific Plate boundary.NNR and HS refer to the no-net rotation and hot spot reference frames, respectively.
5. Discussion5.1. Mechanisms of Seismic AnisotropyThe primary cause of seismic anisotropy in the upper mantle worldwide is the LPO of olivine (e.g., Zhang &Karato, 1995). LPO fabrics can develop in the asthenosphere in response to simple shear imposed by mantleflow and/or the motion of the overlying plate (e.g., Bokelmann & Silver, 2002; Conrad et al., 2007; Karatoet al., 2008; Martin-Short et al., 2015). In subduction zone settings such as Alaska, where the mantle wedgeis cooled and hydrated, B-type olivine LPO can develop, giving rise to a 90◦ change in the anisotropic fastdirection, 𝜙 (Karato et al., 2008). A-type olivine LPO fabrics can also develop in the lithosphere in responseto tectonic deformation (e.g., Bastow et al., 2007; De Plaen et al., 2014; Liddell et al., 2010; Silver & Chan,1988; Vauchez & Nicolas, 1991). In addition to olivine LPO, the preferential alignment of fluid or melt (e.g.,Blackman & Kendall, 1997; Bastow et al., 2010) and the layering of rocks with different seismic velocities(Backus, 1962) can also impact the results of regional SKS splitting studies. Combinations of multiple mech-anisms influence the observations in some regions (e.g., Bastow et al., 2010; Long & Becker, 2010). In thefollowing sections, we explore each of these mechanisms as candidates to explain our Alaskan observations.
In doing so, we pay close attention to whether or not asthenospheric flow is deflected at the edge of the sub-ducting Pacific plate (Eakin et al., 2009; Jadamec & Billen, 2010; Mosher et al., 2014; Paczkowski et al., 2014)and whether B-type olivine LPO is in evidence along an arc with variable slab dip.
5.2. Seismic Anisotropy in Subduction SystemsAt subduction zones, patterns in anisotropy may be extremely varied (e.g., Long, 2013; Walpole et al., 2017),and shear-wave splitting observations can represent anisotropic contributions from the subslab mantle, themantle wedge, the downgoing slab, and the overriding plate, making interpretations challenging (e.g., Long& Silver, 2008).
A simple model of viscous coupling between the downgoing slab and mantle beneath implies entrained man-tle flow beneath the subducting slab, which would yield splitting fast directions perpendicular to the strikeof the slab (Long, 2013). However, shear-wave splitting studies (e.g., Smith et al., 2001) have long indicatedcomplex anisotropy patterns that cannot always be explained by such simple models. Previous observationsat subduction zones worldwide reveal both slab-parallel and slab-perpendicular fast splitting directions andlarge variations in 𝛿t. Many subduction zones exhibit slab-parallel splitting, which is incompatible withsimple entrainment models and has been variously attributed to three-dimensional flow induced by trenchrollback (e.g., Long & Silver, 2008), the transition from A-type to B-type olivine LPO in the relatively cool,hydrated nose of the mantle wedge (e.g., Karato et al., 2008; Kneller et al., 2005; Ohuchi et al., 2012) or theeffect of strong radial anisotropy within entrained flow that is steeply dipping (Song & Kawakatsu, 2012).By studying patterns of anisotropy along ∼40,000 km of the global subduction zone system, Walpole et al.(2017) found large variability in 𝜙, noting that slab-parallel observations are only slightly more prominentthan slab-perpendicular observations. Walpole et al. (2017) argue that slab-parallel shear-wave splitting canresult from the strong radial anisotropy of asthenosphere entrained at steeply dipping subduction zones, aview supported by the modeling work of Song and Kawakatsu (2012).
Geodynamic models show that the spatial extent of subduction-induced LPO and synthetic shear-wavesplitting parameters can vary as a function of slab buoyancy and geometry (e.g., Faccenda & Capitanio,2013; Kneller & Van Keken, 2007; MacDougall et al., 2017). In particular, MacDougall et al. (2017) showthat the “zone of influence” of a subducting plate in the asthenosphere upon shear-wave splitting pat-terns changes with varying slab geometry. Studying the effect of varying slab dip on SKS splitting patterns,Song and Kawakatsu (2013) predict splitting fast directions that are subparallel to plate motion direction(i.e., trench-perpendicular) where the slab dip is small (5–10◦). For a steeply dipping slab (≥40◦), the pre-dicted splitting fast directions are trench-parallel (Song & Kawakatsu, 2013). By modeling the Mariana andAndean subduction zones, Kneller and Van Keken (2007) investigate the influence of the strong slab cur-vature and large along-strike variations in geometry. Modeling average Andean slab dips of 10–30◦, theypredict trench-perpendicular stretching in regions of shallow slab dip. Slab-parallel flow is predicted in themantle wedge above the more steeply dipping slab region (Kneller & Van Keken, 2007). Geodynamic mod-els of slab-edge environments also predict the presence of toroidal flow of asthenospheric material aroundthe side of slab from the underside into the mantle wedge (Jadamec, 2016). This pattern of flow also has acomponent of upwelling, which is predicted to cause a concentration of null results in shear-wave splittingstudies (Jadamec, 2016).
The pattern of shear-wave splitting results in our study region (Figure 6) features several abrupt shifts in fastdirections that are consistent over long length scales (>200 km). This suggests several sources of anisotropybeneath different parts of Alaska, likely at different depths. Consistent measurements at nearby stations areindicative of large-scale layers of anisotropy, which we can link to tectonic processes. After comparing ourresults with previous splitting studies in the Alaska region in the following section, we discuss which mech-anisms of anisotropy likely dominate across Alaska and how they relate to studies at subduction systemselsewhere.
5.3. Comparison With Previous Studies in AlaskaPrevious SKS splitting studies in Alaska have variously analyzed data from the permanent AK network, thetemporary Broadband Experiment Across the Alaska Range (BEAAR), Alaska Receiving Cross Transect ofthe Inner Core, and Multidisciplinary Observations Of Subduction networks (Alaska Earthquake Center,Univ. of Alaska Fairbanks, 1987; Hanna & Long, 2012; BEAAR, Christensen & Abers, 2009; BEAAR/AlaskaReceiving Cross Transect of the Inner Core/Multidisciplinary Observations Of Subduction, Perttu et al.,2014). Our results corroborate previous work (Figure 7). Two main patterns of anisotropy emerge from
Figure 7. Comparison between the stacked splitting results obtained in our study (red) and for previous studies (black;Christensen & Abers, 2009; Hanna & Long, 2012; Perttu et al., 2014) overlain on the S wave tomographic model ofMartin-Short et al. (2016). Using data from the AK array allows direct comparison between our results at these stationsand results from previous studies. Orange triangles indicate active volcanoes. The extent of the Yakutat terrane(Eberhart-Phillips et al., 2006) is outlined in black.
these previous studies: slab-parallel fast directions indicative of along-strike flow in the mantle wedge andslab-perpendicular fast directions closer to the trench.
Hanna and Long (2012) argue that several factors contribute to their observed splitting pattern: shearin the asthenosphere due to absolute plate motion (APM), slab-parallel flow in the mantle wedge, andtwo-dimensional entrained mantle flow beneath the slab. This corroborates the interpretations of Perttuet al. (2014) and Christensen and Abers (2009), who suggest that their observed splitting pattern is influ-enced mainly by (i) along-strike asthenospheric flow in the mantle wedge where slab depth is >70 km and(ii) anisotropy within or below the subducting Pacific/Yakutat plate where the slab is shallower than 70 km.
5.4. Lithospheric Sources of AnisotropyAnisotropy in the continental crust typically results in 𝛿t = 0.1–0.5 s (Long & Silver, 2009; Silver, 1996;Savage, 1999). It is also largely uncorrelated with that of the underlying mantle (Lin et al., 2011). Therefore,our 𝛿t values (mean 𝛿t = 1.19 s) require a mantle contribution to the anisotropy. We calculate the splittingtime produced by a vertical incident ray traveling through a single anisotropic layer of thickness L (Silver &Chan, 1991) as
𝛿t = 𝜖L𝛽, (1)
where 𝜖 is the average percent anisotropy, L is the anisotropic layer thickness, and 𝛽 is shear-wave velocity.Using our observed mean 𝛿t = 1.19 s, 𝛽 = 4.48 km/s (ak135 mantle velocities; Kennett et al., 1995), and 𝜖 =4% (upper estimate of the strength of anisotropy to 200-km depth; Savage, 1999), we find L = 133 km.
Some of our splitting parameters vary over short length scales. According to Fresnel zone arguments, thisobservation points toward a shallow source of anisotropy (e.g., Alsina & Snieder, 1995). The length scaleof changes is in fact sometimes shorter than the width of the Fresnel zone at the base of the lithosphere(∼125 km). A particularly dramatic change in 𝜙 is evident from slab-parallel northwest of the slab to
Figure 8. Comparison between the modeled mantle velocity field of Jadamec and Billen (2010) and our shear-wavesplitting observations. (left) The velocity field at 100-km depth from an instantaneous flow model with compositeviscosity (figure from Jadamec & Billen, 2010). The displayed slab geometry slabE115 was preferred by Jadamec andBillen (2010) on the basis of a comparison between their modeled flow vectors and observed shear-wave splittingresults. (right) Our SKS splitting observations overlain on a 200-km depth slice through the S wave tomography modelof Martin-Short et al. (2016). A similar pattern of 3-D flow around the northeast slab edge is observed in theinstantaneous mantle flow field and the shear-wave splitting observations.
slab-perpendicular closer to the trench where the subducting slab is shallower at stations such as CAPN,SSN, or M22 K (Figure 1). Beneath south-central Alaska, the Yakutat lithosphere subducts at a shallow angleuntil ∼600-km inboard of the trench (e.g., Eberhart-Phillips et al., 2006). If there is alignment between fossilanisotropy in the continental lithosphere and underlying oceanic lithosphere, then the overall lithosphericcontribution may be large at stations on the subducted Yakutat terrane, whose outline is indicated by thethick blue contour in Figure 6. We do not see evidence for a significant contribution to the splitting signalfrom other Alaskan terranes, however (Figure 1).
In the southeastern corner of our study area, fast directions parallel the direction of motion of theFairweather and Queen Charlotte transform faults, a clear example of lithospheric anisotropy, whose devel-opment is ongoing. Our observations of delay times with an average of 𝛿t = 1.19 s can be compared tomeasurements along the San Andreas Fault to the south of our study area. The San Andreas is an archetypalexample of a two-layer splitting case (Özalaybey & Savage, 1995; Polet & Kanamori, 2002; Silver & Savage,1994). In central and southern California, the splitting delay time associated with the upper, “lithospheric”layer of San Andreas fault-parallel layer of anisotropy is considered relatively small (𝛿t ≤ 0.7 s), consistentwith the region's thin lithosphere. Corroborating this hypothesis from a Fresnel zone point of view, stationsto the west of the fault in southern/central California show evidence for only a single layer of anisotropy, notassociated with the fault. In contrast, further north in California, a 115- to 125-km-thick layer of fault-parallelanisotropy is observed (Özalaybey & Savage, 1995), akin to our results. We also observe that fast directionsapproximately parallel the Fairweather and Queen Charlotte transform faults up to ∼100-km east of thefault, consistent with the hypothesis of a relatively thick lithospheric anisotropic layer (Figure 6). Away fromthe Fairweather and Queen Charlotte transform faults, alignment of fast polarization directions with struc-tural trends is less clear. Thus, in the following sections, we explore the role asthenospheric flow might playin governing our results.
5.5. Asthenospheric Sources of Anisotropy5.5.1. Anisotropy Around the Slab EdgeThe teleseismic body wave tomography study of Martin-Short et al. (2016) indicates a sharp slab edgebeneath south central Alaska at ∼145◦W, 65◦N (Figure 6). The splitting geometry appears to change acrossthis feature, transitioning from a dominantly slab-parallel orientation west of slab edge to a fan-like patterneastward of the slab edge. The observed pattern of anisotropy east of the slab termination zone is similarto that predicted by the 3-D instantaneous mantle flow models of toroidal flow around the Alaskan slabedge (Jadamec & Billen, 2010, 2012). This flow geometry implies a decoupling of the subslab mantle andmantle wedge from the lithospheric plate motion (Jadamec & Billen, 2012). However, our observations do
not appear to match the model northwest of the slab, where we observe slab-parallel fast directions andthe modeled flow predicts predominantly slab-normal fast directions. Jadamec and Billen (2010, 2012) alsoshow that localized vertical upwelling occurs in the mantle near the WVF, for the preferred models usingthe SlabE115 slab geometry and buoyancy (Figure 8). This suggests that WVF volcanism may be in partdriven by localized mantle upwelling associated with the toroidal asthenospheric flow around the edge ofthe Pacific-Yakutat slab (Jadamec, 2016; Piromallo et al., 2006; Strak & Schellart, 2014). The interpretationof our splitting observations as toroidal asthenospheric flow at the slab edge, in combination with the pres-ence of a low velocity anomaly in the tomography beneath the WVF provides tentative evidence for the latterhypothesis for volcanism origin in the WVF.
The 3-D flow around the slab edge appears to be competing with the influence of APM as one moves furtheraway from the trench, in the southwest and northernmost regions of our study area. This is consistent withthe flow field modeled by Jadamec and Billen (2010), suggesting a decrease in the magnitude of the slabedge-induced 3-D flow away from the trench. However, due to variations in APM depending on the chosenmodel or reference frame (Figure 6), it is hard to determine the extent to which fast directions are alignedwith APM away from the subduction zone. Thus, it is also challenging to determine the northern extent ofthe influence of slab-parallel flow induced by mantle flow around the slab edge. Geodynamic studies (e.g.,Király et al., 2017; Piromallo et al., 2006) show that the generalized length scales of toroidal flow are in therange of 900–2,000 km.
The dip of the downgoing Pacific-Yakutat slab varies significantly along strike from nearly zero (flat-slabsubduction) below south-central Alaska to steeply dipping beyond 30–35◦ further west along theAleutian-Alaska arc (Eberhart-Phillips et al., 2006; Hayes et al., 2018; Song & Kawakatsu, 2012). The mod-eling work of Kneller and Van Keken (2007) has been shown that variations in slab dip and geometry alongstrike can result in a shift in splitting fast directions similar to that observed in our results immediately north-west of the slab. We therefore propose that in this region the near-vertical sinking of the arcuate slab withvariable dip causes pressure gradients in the mantle wedge and the slab-parallel fast directions. This processoccurs in addition to the slab-parallel fast directions associated with toroidal flow that occurs around thenorthern tip and eastern slab edge (e.g., Jadamec & Billen, 2010, 2012). We also cannot preclude the possi-bility that slab depth might also be a controlling factor to the mantle flow pattern, as modeled by S.-C. Lin(2014) in the Chilean subduction zone.
Tian and Zhao (2012) produced a tomographic model of P wave velocities and anisotropy from local earth-quakes, at depths of ≤190 km beneath south central Alaska. They also argue for a similar flow around theslab edge driven by a varied slab geometry along strike that yields slab-parallel fast directions in the mantlewedge and subslab mantle. However, their interpretation includes the presence of a significant “Wrangell”slab east of the slab imaged by Martin-Short et al. (2016). Jadamec and Billen (2010, 2012) developed andtested two slab geometries for the Alaska-Wrangell slab, one with a deeper Wrangell slab segment (SlabE325)and another with a shorter Wrangell slab (SlabE115). The flow field associated with the preferred modelin Jadamec and Billen (2010, 2012) using SlabE115 appears much more similar to our shear-wave splittingobservations than that associated with a geometry featuring deep subduction beneath the WVF. This sup-ports the interpretation of Martin-Short et al. (2016) with regard to WVF subduction and lends credence tothe idea that the observed toroidal splitting pattern is caused by flow around a truncated Pacific-Yakutat slabbeneath south-central Alaska.5.5.2. Slab-Perpendicular AnisotropyOne of the most striking and consistent features of our results is the transition from slab-perpendicular toslab-parallel splitting directions northwestward across the slab (in the northeasternmost part of the delim-ited Yakutat terrane delimited in Figure 6). The shift in dominant influence from slab-parallel flow in themantle wedge to the combination of subslab entrained flow and lithospheric anisotropy in the Yakutatterrane could explain the dramatic contrast in splitting directions that occurs across small length scales(<100 km).
Splitting measurements from stations west of the volcanic arc and Denali Volcanic Gap appear to followsouthwestward the curvature of the downgoing slab as constrained from the tomography of Martin-Shortet al. (2016), which suggests a steeply dipping slab at great depths (>200 km) in this region. This implies thatthe mantle wedge is sufficiently thick to provide a source of anisotropy capable of producing the observed
Figure 9. Summary sketch of mechanisms driving anisotropy in Alaska.
delay times. Thus, we suggest that these slab-parallel results are caused mainly by asthenospheric flow inthe mantle wedge along the strike of the slab.
Slab-perpendicular results around stations such as CAPN and M22 K are consistent with the study of Hannaand Long (2012; Figure 6). These authors argue that a subslab layer of entrained asthenosphere is responsiblefor this pattern; an interpretation that is consistent with splitting observations at other zones of shallow sub-duction (Long & Silver, 2009). East of the volcanic arc, where the Yakutat terrane is subducting, the mantlewedge is thin (<100 km), and the dip of the subducting lithosphere is relatively shallow due to the presenceof thick Yakutat crust. Thus, the main asthenospheric source of anisotropy is the subslab mantle. We suggestthat the slab-perpendicular splitting results may be caused by a thick asthenospheric layer entrained beneaththe downgoing Yakutat slab. The slab-perpendicular measurements can therefore be interpreted as resultingfrom a combination of lithospheric (fossil anisotropy within the subducting Yakutat) and asthenospheric(subslab mantle entrained by the drag of the subducting plate) sources.
Several stations above the subducted Yakutat terrane (e.g., KLU and BMR) display a consistent, N-S ori-entated splitting pattern (Figure 6). This may be the result of entrained asthenospheric flow beneath theYakutat lithosphere, a particularly thick or highly anisotropic section of Yakutat lithosphere itself, or byalignment of fossil anisotropy directions within the Yakutat and overlying continental lithosphere. There isa notable change in splitting geometry between this N-S-orientated pattern south of the WVF and a predom-inantly SE-NW-orientated pattern to the north. If the N-S-orientated pattern is related to the presence ofYakutat lithosphere, then this abrupt change implies that subduced Yakutat lithosphere is not present to thenorth of the WVF. Thus, these volcanoes may have formed at a slab edge, which is a conclusion supportedby the imaging work of Martin-Short et al. (2018).
Figure 9 illustrates the main conclusions from our study showing the processes driving seismic anisotropyat the Alaskan subduction zone.
6. ConclusionsWe have performed a shear-wave splitting study of upper mantle anisotropy in south-central Alaska usingdata from a large collection of seismic networks, including the Transportable Array. In doing so, we placenew constraints on the tectonics and mantle geodynamics at the south-central Alaskan subduction margin.Anisotropic fast directions (𝜙) vary over short length scales (∼50 km) suggesting relatively shallow sourcesof seismic anisotropy in some areas. For example, in the vicinity of the Queen Charlotte and Fairweathertransform faults, 𝜙 parallels these faults, consistent with a lithospheric source of anisotropy. However, thehigh delay times (𝛿t = 1–1.5 s) obtained across the study region require an asthenospheric contribution tothe anisotropic signal. We develop our interpretations using both shear-wave splitting observations and anS wave tomography model of Alaska. The pattern of fast directions wrapping around the slab edge impliesa three-dimensional toroidal mantle flow in this area (Figure 9). Upwelling at the slab edge associated withthis asthenospheric flow may thus be the cause of volcanism in the WVF (Jadamec & Billen, 2010, 2012).
Closer to the trench, we observe a 90◦ rotation in 𝜙 from slab-parallel to slab-perpendicular, correlating withthe location of the Yakutat terrane. This dramatic change in fast directions across the Yakutat subductionregion can be interpreted as resulting from the influence of fossil lithospheric anisotropy within the Yakukatterrane, supported by the imaging work of Martin-Short et al. (2018) and by the geodynamic modeling ofJadamec and Billen (2010, 2012). However, high delay times obtained across the Yakutat region (𝛿t ≈ 1.5 s)also suggest entrained subslab mantle flow as an anisotropic source. Ultimately, we infer that variability inslab geometry exerts first-order control on the pattern of mantle flow in south-central Alaska.
ReferencesAlaska Earthquake Center, Univ. of Alaska Fairbanks (1987). Alaska Regional Network. International Federation of Digital Seismograph
Networks. Retrieved from https://doi.org/10.7914/SN/AKAlsina, D., & Snieder, R. (1995). Small-scale sublithospheric continental mantle deformation: Constraints from SKS splitting observations.
Geophysical Journal International, 123, 431–448. https://doi.org/10.1111/j.1365-246X.1995.tb06864Backus, G. E. (1962). Long-wave elastic anisotropy produced by horizontal layering. Journal of Geophysical Research, 67(11), 4427–4440.
https://doi.org/10.1029/JZ067i011p04427Bastow, I. D., Owens, T. J., Helffrich, G., & Knapp, J. H. (2007). Spatial and temporal constraints on sources of seismic anisotropy: Evidence
from the Scottish highlands. Geophysical Research Letters, 34, L05305. https://doi.org/10.1029/2006GL028911Bastow, I. D., Pilidou, S., Kendall, J.-M., & Stuart, G. (2010). Melt-induced seismic anisotropy and magma assisted rifting in Ethiopia:
Evidence from surface waves. Geochemistry, Geophysics, Geosystems, 11, Q0AB05. https://doi.org/10.1029/2010GC003036Bird, P. (2003). An updated digital model of plate boundaries. Geochemistry, Geophysics, Geosystems, 4(3), 1027. https://doi.org/10.1029/
2001GC000252Blackman, D., & Kendall, J.-M. (1997). Sensitivity of teleseismic body waves to 635 mineral texture and melt in the mantle beneath a
mid-ocean ridge. Philosophical Transactions of the Royal Society, 355, 217–231.Bokelmann, G., & Silver, P. (2002). Shear stress at the base of shield lithosphere. Geophysical Research Letters, 29(23), 2091. https://doi.org/
10.1029/2002GL015925Brueseke, M. E., Benowitz, J. A., Trop, J. M., Davis, K. N., Berkelhammer, S. E., Layer, P. W., & Morter, B. K. (2019). The Alaska Wrangell
Arc: ∼30 Ma of subduction-related magmatism along a still active arc-transform junction. Terra Nova, 31(1). https://doi.org/10.1111/ter.12369
Christensen, D. H., & Abers, G. A. (2009). Seismic anisotropy under central Alaska from SKS splitting observations. Journal of GeophysicalResearch, 115, B04315. https://doi.org/10.1029/2009JB006712
Christenson, G. L., Gulick, S. P. S., van Avendonk, H. J. A., Worthington, L. L., Reece, R. S., & Pavlis, T. L. (2010). The Yakutat terrane:Dramatic change in crustal thickness across the Transition fault, Alaska. Geology, 38(10), 895–898.
Colpron, M., Nelson, J. L., & Murphy, D. C. (2007). Northern Cordilleran terranes and their interactions through time. GSA Today, 17, 4.https://doi.org/10.1130/GSAT01704-5A.1
Conrad, C. P., Behn, M. D., & Silver, P. G. (2007). Global mantle flow and the development of seismic anisotropy: Differences between theoceanic and continental upper mantle. Journal of Geophysical Research, 112, B07317. https://doi.org/10.1029/2006JB004608
Darbyshire, F. A., Bastow, I. D., Forte, A. M., Hobbs, T. E., Calvel, A., Gonzalez-Monteza, A., & Schow, B. (2015). Variability and originof seismic anisotropy across eastern Canada: Evidence from shear-wave splitting measurements. Journal of Geophysical Research: SolidEarth, 120, 8404–8421. https://doi.org/10.1002/2015JB012228
De Plaen, R., Bastow, I., Chambers, E., Keir, D., Gallacher, R., & Keane, J. (2014). The development of magmatism along the CameroonVolcanic Line: Evidence from seismicity and seismic anisotropy. Journal of Geophysical Research: Solid Earth, 119, 4233–4252. https://doi.org/10.1002/2013JB010583
Eakin, C. M., Obrebski, M., Allen, R. M., Boyarko, D. C., Brudzinski, M. R., & Porritt, R. (2009). Seismic anisotropy beneath Cascadiaand Mendocino triple junction: Interaction of the subducting slab with mantle flow. Earth and Planetary Science Letters, 297, 627–632.https://doi.org/10.1016/j.epsl.2010.07.015
Eberhart-Phillips, D., Christensen, D. H., Brocher, T. M., Hansen, R., Ruppert, N. A., Haeussler, P. J., & Abers, G. A. (2006). Imaging thetransition from Aleutian subduction to Yakutat collision in central Alaska, with local earthquakes and active source data. Journal ofGeophysical Research, 111, B11303. https://doi.org/10.1029/2005JB004240
Faccenda, M., & Capitanio, F. A. (2013). Seismic anisotropy around subduction zones: Insights from three-dimensional modeling of uppermantle deformation and SKS splitting calculations. Geochemistry, Geophysics, Geosystems, 14, 243–262. https://doi.org/10.1002/ggge.20055
Ferris, A., Abers, G. A., Christensen, D. H., & Veenstra, E. (2003). High resolution image of the subducted Pacific (?) plate beneath centralAlaska, 50–150. Earth and Planetary Science Letters, 214(3–4), 575–588.
Finzel, E. S., Flesch, L. M., Ridgway, K. D., Holt, W. E., & Ghosh, A. (2015). Surface motions and intraplate continental deformation inAlaska driven by mantle flow. Geophysical Research Letters, 42, 4350–4358. https://doi.org/10.1002/2015GL063987
Finzel, E. S., Trop, J. M., Ridgway, K. D., & Enkelmann, E. (2011). Upper plate proxies for flat-slab subduction processes in southern Alaska.Earth and Planetary Science Letters, 303(3–4), 348–360.
Gilligan, A., Bastow, I. D., Watson, E., Darbyshire, F. A., Levin, V., Menke, W., et al. (2016). Lithospheric deformation in the CanadianAppalachians: Evidence from shear-wave splitting. Geophysical Journal International, 206, 1273–1280.
Gripp, A., & Gordon, R. (2002). Young tracks of hotspots and current plate velocities. Geophysical Journal International, 150, 321–361.Hall, C. E., Fisher, K. M., & Parmentier, E. M. (2000). The influence of plate motions on three-dimensional back arc mantle flow and
shear-wave splitting. Journal of Geophysical Research, 105(B12), 28,009–28,033.Hanna, J., & Long, M. (2012). SKS splitting beneath Alaska: Regional variability and implications for subduction processes at a slab edge.
Tectonophysics, 530–531, 272–285. https://doi.org/10.1016/j.tecto.2012.01.003Hayes, G. P., Moore, G. L., Portner, D. E., Hearne, M., Flamme, H., Furtney, M., & Smoczyk, G. M. (2018). Slab2, a comprehensive subduction
zone geometry model. Science, 362(6410), 58–61. https://doi.org/10.1126/science.aat4723Holtzman, B. K., & Kendall, J.-M. (2010). Organized melt, seismic anisotropy, and plate boundary lubrication. Geochemistry, Geophysics,
AcknowledgmentsThe facilities of IRIS Data Services,and specifically the IRIS DataManagement Center, were used foraccess to waveforms, related metadata,and/or derived products used in thisstudy. IRIS Data Services are fundedthrough the Seismological Facilities forthe Advancement of Geoscience andEarthScope (SAGE) Proposal of theNational Science Foundation underCooperative Agreement EAR-1261681.Data from the AK network were madeavailable by the University of AlaskaFairbanks (Alaska Earthquake Center,Univ. of Alaska Fairbanks, 1987:Alaska Regional Network;International Federation of DigitalSeismograph Networks,10.7914/SN/AK) and data for the ATnetwork by the NOAA NationalOceanic and AtmosphericAdministration (NOAA NationalOceanic and AtmosphericAdministration (USA), 1967, NationalTsunami Warning Center AlaskaSeismic Network; InternationalFederation of Digital SeismographNetworks, doi:10.7914/SN/AT). Datafrom the TA network (IRISTransportable Array, 2003: USArrayTransportable Array; InternationalFederation of Digital SeismographNetworks, 10.7914/SN/TA) were madefreely available as part of theEarthScope USArray facility, operatedby Incorporated Research Institutionsfor Seismology (IRIS) and supportedby the National Science Foundation,under Cooperative AgreementsEAR-1261681. Figures in this articlewere made using the Generic Mappingtools (Wessel et al., 2013) and thePython Matplotlib library. The paperbenefited from discussions with B.Romanowicz and W. Hawley.
IRIS Transportable Array (2003). USArray Transportable Array. International Federation of Digital Seismograph Networks. Other/SeismicNetwork. Retrieved from https://doi.org/10.7914/SN/TA
Jadamec, M. A. (2016). Insights on slab-driven mantle flow from advances in three-dimensional modelling. Journal of Geodynamics, 100,51–70. https://doi.org/10.1016/j.jog.2016.07.004
Jadamec, M. A., & Billen, M. I. (2010). Reconciling surface plate motions with rapid three-dimensional mantle flow around a slab edge.Nature, 465, 338–341. https://doi.org/10.1038/nature09053
Jadamec, M. A., & Billen, M. I. (2012). The role of rheology and slab shape on rapid mantle flow: Three-dimensional numerical models ofthe Alaska slab edge. Journal of Geophysical Research, 117, B02304. https://doi.org/10.1029/2011JB008563
Jadamec, M. A., Billen, M. I., & Roeske, S. M. (2013). Three-dimensional numerical models of flat slab subduction and the Denali faultdriving deformation in south-central Alaska. Earth and Planetary Science Letters, 376, 29–42. https://doi.org/10.1016/j.epsl.2013.06.009
Karato, S., Jung, H., Katayama, I., & Skemer, P. (2008). Geodynamic significance of seismic anisotropy of the upper mantle: New insightsfrom laboratory studies. Annual Review of Earth and Planetary Sciences, 36, 59–95. https://doi.org/10.1146/annurev.earth.36.031207.124120
Kennett, B. L. N., Engdahl, E. R., & Buland, R. (1995). Constraints on seismic velocities in the Earth from traveltimes. Geophysical JournalInternational, 122, 108–124.
Király, A., Capitanio, F. A., Funiciello, F., & Faccenna, C. (2017). Subduction induced mantle flow: Length-scales and orientation of thetoroidal cell. Earth and Planetary Science Letters, 479, 284–297.
Kneller, E., & Van Keken, P. (2007). Trench-parallel flow and seismic anisotropy in the Mariana and Andean subduction systems. Nature,450(7173), 1222.
Kneller, E., Van Keken, P., Karato, S., & Park, J. (2005). B-type olivine fabric in the mantle wedge: Insights from high-resolutionnon-Newtonian subduction zone models. Earth and Planetary Science Letters, 237(3–4), 781–797.
Koons, P. O., Hooks, B. P., Pavlis, T., Upton, P., & Barker, A. D. (2010). Three-dimensional mechanics of Yakutat convergence in the southernAlaskan plate corner. Tectonics, 29, TC4008. https://doi.org/10.1029/2009TC002463
Liddell, M., Bastow, I. D., Darbyshire, F. A., Gilligan, A., & Pugh, S. (2010). The formation of Laurentia: Evidence from shear-wave splitting.Earth and Planetary Science Letters, 479, 170–178.
Lin, S.-C. (2014). Three-dimensional mantle circulations and lateral slab deformation in the southern Chilean subduction zone. Journalof Geophysical Research: Solid Earth, 119, 3879–3896. https://doi.org/10.1002/2013JB010864
Lin, F.-C., Ritzwoller, M. H., Yang, Y., Moschetti, M. P., & Fouch, M. J. (2011). Complex and variable crustal and uppermost mantle seismicanisotropy in the western United States. Nature Geoscience, 4, 55–61.
Long, M. (2013). Constraints on subduction geodynamics from seismic anisotropy. Reviews of Geophysics, 51, 76–112. https://doi.org/10.1002/rog.20008
Long, M., & Becker, T. W. (2010). Mantle dynamics and seismic anisotropy. Earth and Planetary Science Letters, 297, 341–354. https://doi.org/10.1016/j.epsl.2010.06.036
Long, M., & Silver, P. (2008). The subduction zone flow field from seismic anisotropy: A global view. Science, 319(5861), 315–318. https://doi.org/10.1126/science.1150809
Long, M., & Silver, P. (2009). Shear-wave splitting and mantle anisotropy: Measurements, interpretations, and new directions. Surveys inGeophysics, 30(4), 407–461.
MacDougall, J. G., Jadamec, M. A., & Fisher, K. M. (2017). The zone of influence of the subducting slab in the asthenospheric mantle.Journal of Geophysical Research: Solid Earth, 122, 6599–6624. https://doi.org/10.1002/2017JB014445
Martin-Short, R., Allen, R. M., & Bastow, I. D. (2016). Subduction geometry beneath south central Alaska and its relationship to volcanism.Geophysical Research Letters, 43, 9509–9517. https://doi.org/10.1002/2016GL070508
Martin-Short, R., Allen, R., Bastow, I., Porritt, R., & Miller, M. (2018). Seismic imaging of the Alaska Subduction Zone: Implications for slabgeometry and volcanism (Vol. 19, pp. 4541–4560). https://doi.org/10.1029/2018GC007962
Martin-Short, R., Allen, R. M., Bastow, I. D., Totten, E., & Richards, M. A. (2015). Mantle flow geometry from ridge to trench beneath theGorda-Juan de Fuca plate system. Nature Geoscience, 8, 965–968. https://doi.org/10.1038/ngeo2569
Moore, T. E., & Box, S. E. (2016). Age, distribution and style of deformation in Alaska north of 60◦ N: Implications for assembly of Alaska.Tectonophysics, 691(A), 133–170. https://doi.org/10.1016/j.tecto.2016.06.025
Mosher, S. G., Audet, P., & L'Heureux, I. (2014). Seismic evidence for rotating mantle flow around subducting slab edge associated withoceanic microplate fracture. Geophysical Research Letters, 41, 4548–4553. https://doi.org/10.1002/2014GL060630
NOAA National Oceanic and Atmospheric Administration (USA) (1967). National Tsunami Warning Center Alaska Seismic Network.International Federation of Digital Seismograph Networks. Other/Seismic Network. Retrieved from https://doi.org/10.7914/SN/AT
Nokleberg, W. J., Parfenov, L. M., Monger, J. W. H., Norton, I. O., Khanchuk, A. I., Stone, D. B., et al. (2000). Phanerozoic tectonic evolutionof the circum-North Pacific. U.S. Geological Survey Professional Paper 1626, 122.
Nye, C. (1999). The Denali volcanic gap—Magmatism at the eastern end of the Aleutian arc. Eos, Transactions American Geophysical Union,80(46), 1203.
O'Driscoll, L. J., & Miller, M. S. (2015). Lithospheric discontinuity structure in Alaska, thickness variations determined by Sp receiverfunctions. Tectonics, 34, 694–714. https://doi.org/10.1002/2014TC003669
Ohuchi, T., Kawazoe, T., Nishihara, Y., & Irifune, T. (2012). Change of olivine a-axis alignment induced by water: Origin of seismicanisotropy in subduction zones. Earth and Planetary Science Letters, 317-318, 111–119.
Özalaybey, S., & Savage, M. (1995). Shear-wave splitting beneath western United States in relation to plate tectonics. Journal of GeophysicalResearch, 100(B9), 18,135–18,149.
Paczkowski, K., Thissen, C. J., Long, M. D., & Montési, L. G. J. (2014). Deflection of mantle flow beneath subducting slabs and the originof subslab anisotropy. Geophysical Research Letters, 41, 6734–6742. https://doi.org/10.1002/2014GL060914
Perttu, A., Christensen, D., Abers, G., & Song, X. (2014). Insights into mantle structure and flow beneath Alaska based on a decade ofobservations of shear-wave splitting. Journal of Geophysical Research: Solid Earth, 119, 8366–8377. https://doi.org/10.1002/2014JB011359
Piromallo, C., Becker, T. W., Funiciello, F., & Faccenna, C. (2006). Three-dimensional instantaneous mantle flow induced by subduction.Geophysical Research Letters, 33, L08304. https://doi.org/10.1029/2005GL025390
Plafker, G., & Berg, H. (1994). Overview of the geology and tectonic evolution of Alaska. In G. Plafker & H. Berg (Eds.), The geology ofNorth America, G-1 (Chap. 33, vol. G-1, pp. 389–449). Boulder, CO: Geological Society of America. Retrieved from http://dggs.alaska.gov/pubs/id/22313
Polet, J., & Kanamori, H. (2002). Anisotropy beneath California: Shear wave splitting measurements using a dense broadband array.Geophysical Journal International, 149(2), 313–327.
Preece, S. J., & Hart, W. K. (2004). Geochemical variations in the < 5 Ma Wrangell Volcanic Field, Alaska: Implications for the magmaticand tectonic development of a com738 plex continental arc system. Tectonophysics, 392(1-4), 165–191.
Qi, C., Zhao, D., & Chen, Y. (2007). Search for deep slab segments under Alaska. Physics of the Earth and Planetary Interiors, 165(1–2),68–82.
Richter, D. H., Smith, J. G., Lanphere, M. A., Dalrymple, G. B., Reed, B. L., & Shew, N. (1990). Age and progression of volcanism, Wrangellvolcanic field, Alaska. Bulletin of Volcanology, 53(1), 29–44.
Rondenay, S., Montesi, L. G. J., & Abers, G. A. (2010). New geophysical insight into the origin of the Denali volcanic gap. GeophysicalJournal International, 182(2), 613–630.
Sauber, J., McClusky, S., & King, R. (1997). Relation of ongoing deformation rates to the subduction zone process in southern Alaska.Geophysical Research Letters, 24, 2853–2856.
Savage, M. K. (1999). Seismic anisotropy and mantle deformation: What have we learned from shear-waves. Reviews of Geophysics, 37(1),65–106.
Savage, M., & Silver, P. (1993). Mantle deformation and tectonics: Constraints from seismic anisotropy in the western United States. Physicsof the Earth and Planetary Interiors, 78, 207–227.
Silver, P. G. (1996). Seismic anisotropy beneath the continents: Probing the depths of geology. Nature, 335, 15,303–15,318.Silver, P., & Chan, W. (1988). Implications for continental structure and evolution from seismic anisotropy. Nature, 335, 6185. https://doi.
org/10.1038/335034a0Silver, P. G., & Chan, W. W. (1991). Shear-wave splitting and subcontinental mantle deformation. Journal of Geophysical Research, 96,
429–454.Silver, P., & Savage, M. (1994). The interpretation of shear wave splitting parameters in the presence of two anisotropic layers. Geophysical
Journal International, 119, 949–963.Smith, G. P., Wiens, D. A., Fisher, K. M., Dorman, L. M., Webb, S. C., & Hildebrand, J. A. (2001). A complex pattern of mantle flow in the
Lau Backarc. Science, 292, 713–716. https://doi.org/10.1126/science.1058763Song, T., & Kawakatsu, H. (2012). Subduction of oceanic asthenosphere: Evidence from sub-slab seismic anisotropy. Geophysical Research
Letters, 39, L17301. https://doi.org/10.1029/2012GL052639Song, T., & Kawakatsu, H. (2013). Subduction of oceanic lithospheric: A critical appraisal in central Alaska. Earth and Planetary Science
Letters, 367, 82–94.Strak, V., & Schellart, W. P. (2014). Evolution of 3-D subduction-induced mantle flow around lateral slab edges in analogue models of free
subduction analysed by stereoscopic particle image velocimetry technique. Earth and Planetary Science Letters, 403, 368–379.Teanby, N., Kendall, J.-M., & Van der Baan, M. (2004). Automation of shear-wave splitting measurements using cluster analysis. Bulletin
of the Seismological Society of America, 94(2), 453–463. https://doi.org/10.1785/0120030123Tian, Y., & Zhao, D. (2012). P-wave tomography of the western United States: Insight into the Yellowstone hotspot and the Juan de Fuca
slab. Physics of the Earth and Planetary Interiors, 200, 72–84.Vauchez, A., & Nicolas, A. (1991). Mountain building: Strike-parallel motion and mantle anisotropy. Tectonophysics, 185(3–4), 183–201.Walpole, J., Wookey, J., Kendall, J.-M., & Masters, T.-G. (2017). Seismic anisotropy and mantle flow below subducting slabs. Earth and
Planetary Science Letters, 465, 155–167.Wang, Y., & Tape, C. (2014). Seismic velocity structure and anisotropy of the Alaska subduction zone based on surface wave tomography.
Journal of Geophysical Research: Solid Earth, 119, 8845–8865. https://doi.org/10.1002/2014/JB011438Wessel, P., Smith, W. H. F., Scharroo, R., Luis, J. F., & Wobbe, F. (2013). Generic Mapping Tools: Improved version released. Eos, Transactions
American Geophysical Union, 94, 409–410.Wolfe, C. J., & Silver, P. G. (1998). Seismic anisotropy of oceanic upper mantle: Shear-wave splitting methodologies and observations.
Journal of Geophysical Research, 103, 749–771.Worthington, L. L., Van Avendonk, H. J. A., Gulick, S. P. S., Christeson, G. L., & Pavlis, T. L. (2012). Crustal structure of the Yakutat terrane
and the evolution of subduction and collision in southern Alaska. Journal of Geophysical Research, 117, B01102. https://doi.org/10.1029/2011JB008493
Zhang, S., & Karato, S. (1995). Lattice preferred orientation of olivine aggregates deformed in simple shear. Nature, 375, 774–777. https://doi.org/10.1038/375774a0