Perception & Psychophysics 1999,61 (7),1356-1368 The role of central and peripheral vision in postural control during walking BENOITG, BARDY University of the Mediterranean, MarseiUe, France and WILLIAM H. WARREN, JR., and BRUCEA. KAY Brown University, Providence, Rhode Island Three hypotheses have been proposed for the roles of central and peripheral vision in the percep- tion and control of self-motion: (1) peripheral dominance, (2) retinal invariance, and (3) differential sensitivity to radial flow. We investigated postural responses to optic flow patterns presented at dif- ferent retinal eccentricities during walking in two experiments. Oscillating displays of radial flow (0° driver direction), lamellar flow (90°),and intermediate flow (30°, 45°)patterns were presented at reti- nal eccentricities of 0°, 30°, 45°, 60°, or 90°to participants walking on a treadmill, while compensatory body sway was measured. In general, postural responses were directionally specific, of comparable am- plitude, and strongly coupled to the display for all flow patterns at all retinal eccentricities. One inter- mediate flow pattern (45°)yielded a bias in sway direction that was consistent with triangulation er- rors in locating the focus of expansion from visible flow vectors. The results demonstrate functionally specific postural responses in both central and peripheral vision, contrary to the peripheral dominance and differential sensitivity hypotheses, but consistent with retinal invariance. This finding emphasizes the importance of optic flow structure for postural control regardless of the retinal locus of stimulation. In the last 25 years, various roles have been ascribed to central and peripheral vision for the perception and con- trol of self-motion. Three basic positions have emerged. (1) The peripheral dominance hypothesis states that pe- ripheral vision dominates the perception of self-motion, whereas central vision dominates the perception of object motion (Dichgans & Brandt, 1978, p. 777). On this view, the retinal locus of stimulation plays a causal role in de- termining self-motion. (2) In contrast, the retinal invari- ance hypothesis states that self-motion and object mo- tion are perceived on the basis of information in optic flow, independent of the eccentricity of stimulation (Crowell & Banks, 1993; Gibson, 1968). There is thus no functional specialization for self-motion. (3) The func- tional sensitivity hypothesis. a combination of the two, proposes that self-motion and object motion are per- ceived on the basis of optical information but that central and peripheral vision are differentially sensitive to the flow patterns that typically fall on these retinal regions (Andersen & Braunstein, 1985; Stoffregen, 1985; War- ren & Kurtz, 1992). Specifically, central vision is sensitive Preparation of this article was supported in part by the French Min- istere de l'Education Nationale, de la Recherche et de la Technologie and by u.s. National Institutes of Health Grant EY10923. Correspon- dence should be addressed to B. G. Bardy, the University of Paris-Sud XI, Department of Sports Sciences (STAPS), Biitiment 335, 91405 Orsay cedex, France (e-mail: [email protected]). Accepted by previous editor, Myron L. Braunstein to a variety of radial, rotary, and lamellar flow patterns, whereas peripheral vision is sensitive to lamellar flow but insensitive to radial and rotary flow. In the literature, central vision is typically considered to be the central 30° of the visual field. Retinal Sensitivity to Optic Flow As described by Gibson (1950), movement of the ob- server through a rigid environment generates optic flow patterns that are specific to self-motion. Considered on a spherical projection surface surrounding the observer, translation on a straight path produces a radial flow pat- tern with a focus of expansion in the direction of self- motion, grading into lamellar (parallel) flow in the perpen- dicular direction, and finally a focus of contraction in the opposite direction. In contrast, observer rotation pro- duces global rotary flow about the axis of rotation, grad- ing into lamellar flow in the perpendicular direction. The flow pattern on the retina, however, depends not only on the type of self-motion but also on the direction of gaze and eye movements. For example, if the observer looks in the direction of translation (point A in Figure 1a), the retinal flow pattern will be radial in central vision and in- creasingly lamellar in peripheral vision. Looking off to one side near the horizon(point B) will yield a similar ra- dial flow pattern in the periphery. Thus, given that radial or lamellar flow can appear at any eccentricity, retinal in- variance would be advantageous. On the other hand, if a point nearer to the observer is tracked with a pursuit eye movement (point C in Figure 1b), the retinal flow pattern Copyright 1999 Psychonomic Society, Inc. 1356
Transcript
Perception & Psychophysics1999,61 (7),1356-1368
The role of central and peripheral visionin postural control during walking
BENOITG, BARDYUniversity ofthe Mediterranean, MarseiUe, France
and
WILLIAM H. WARREN, JR., and BRUCEA. KAYBrown University, Providence, Rhode Island
Three hypotheses have been proposed for the roles of central and peripheral vision in the perception and control of self-motion: (1) peripheral dominance, (2) retinal invariance, and (3) differentialsensitivity to radial flow. We investigated postural responses to optic flow patterns presented at different retinal eccentricities during walking in two experiments. Oscillating displays of radial flow (0°driver direction), lamellar flow (90°),and intermediate flow (30°, 45°)patterns were presented at retinal eccentricities of 0°, 30°, 45°, 60°, or 90°to participants walking on a treadmill, while compensatorybody sway was measured. In general, postural responses were directionally specific,of comparable amplitude, and strongly coupled to the display for all flow patterns at all retinal eccentricities. One intermediate flow pattern (45°)yielded a bias in sway direction that was consistent with triangulation errors in locating the focus of expansion from visible flow vectors. The results demonstrate functionallyspecific postural responses in both central and peripheral vision, contrary to the peripheral dominanceand differential sensitivity hypotheses, but consistent with retinal invariance. This finding emphasizesthe importance of optic flowstructure for postural control regardless of the retinal locus of stimulation.
In the last 25 years, various roles have been ascribedto central and peripheral vision for the perception and control of self-motion. Three basic positions have emerged.(1) The peripheral dominance hypothesis states that peripheral vision dominates the perception of self-motion,whereas central vision dominates the perception ofobjectmotion (Dichgans & Brandt, 1978, p. 777). On this view,the retinal locus of stimulation plays a causal role in determining self-motion. (2) In contrast, the retinal invariance hypothesis states that self-motion and object motion are perceived on the basis of information in opticflow, independent of the eccentricity of stimulation(Crowell & Banks, 1993; Gibson, 1968). There is thus nofunctional specialization for self-motion. (3) The functional sensitivity hypothesis. a combination of the two,proposes that self-motion and object motion are perceived on the basis ofoptical information but that centraland peripheral vision are differentially sensitive to theflow patterns that typically fall on these retinal regions(Andersen & Braunstein, 1985; Stoffregen, 1985; Warren & Kurtz, 1992). Specifically, central vision is sensitive
Preparation of this article was supported in part by the French Ministere de l'Education Nationale, de la Recherche et de la Technologieand by u.s. National Institutes of Health Grant EY10923. Correspondence should be addressed to B. G. Bardy, the University of Paris-SudXI, Department of Sports Sciences (STAPS), Biitiment 335, 91405Orsay cedex, France (e-mail: [email protected]).
Accepted by previous editor, Myron L. Braunstein
to a variety of radial, rotary, and lamellar flow patterns,whereas peripheral vision is sensitive to lamellar flowbut insensitive to radial and rotary flow. In the literature,central vision is typically considered to be the central 30°of the visual field.
Retinal Sensitivity to Optic FlowAs described by Gibson (1950), movement of the ob
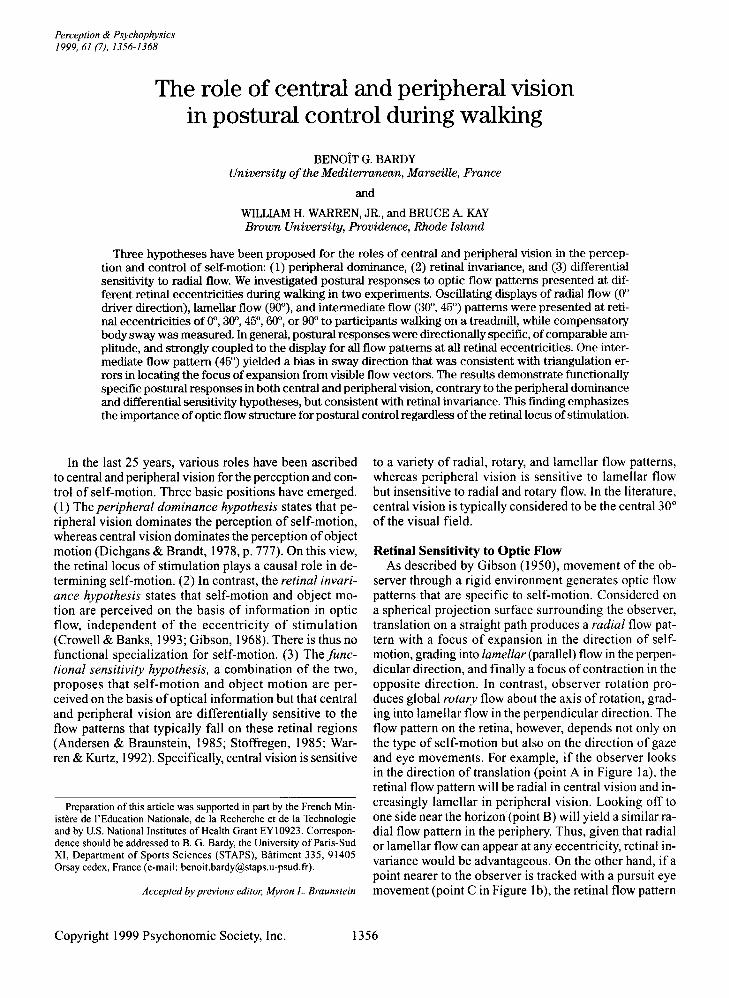
server through a rigid environment generates optic flowpatterns that are specific to self-motion. Considered ona spherical projection surface surrounding the observer,translation on a straight path produces a radial flow pattern with a focus of expansion in the direction of selfmotion, grading into lamellar (parallel) flow in the perpendicular direction, and finally a focus ofcontraction in theopposite direction. In contrast, observer rotation produces global rotary flow about the axis of rotation, grading into lamellar flow in the perpendicular direction. Theflow pattern on the retina, however, depends not only onthe type of self-motion but also on the direction of gazeand eye movements. For example, if the observer looksin the direction of translation (point A in Figure 1a), theretinal flow pattern will be radial in central vision and increasingly lamellar in peripheral vision. Looking off toone side near the horizon(point B) will yield a similar radial flow pattern in the periphery. Thus, given that radialor lamellar flow can appear at any eccentricity, retinal invariance would be advantageous. On the other hand, if apoint nearer to the observer is tracked with a pursuit eyemovement (point C in Figure 1b), the retinal flow pattern
/Figure I. Retinal velocity field produced by translation parallel to a ground plane while (a)
fixating in the direction of self-motion at point A or near the horizon at point B, and (b) fixating a spot on the ground plane at point C, which induces a pursuit eye rotation. Verticalline indicates heading direction.
in the periphery tends to be locally lamellar, while incentral vision it is more complex and depends on the 3D structure of the scene. In general, radial and rotaryflow patterns are thus less common in the periphery.
The data on retinal sensitivity are mixed (see Warren& Kurtz, 1992, for a critical review). Initial results favoring the peripheral dominance hypothesis came fromthe study of vection, or the subjective sensation of selfmotion. Brandt, Dichgans, and Koenig (1973) first reported that circular (yaw) vection was easily obtainedwith 30°-diameter displays when they were presented45° to 75° in the periphery, but not when they were presented centrally. Similar results were subsequently reported for roll vection (Held, Dichgans, & Bauer, 1975)and linear vection (Berthoz, Pavard, & Young, 1975).However, more recent research has shown that vectioncan also be obtained in central vision. Using radial flowpatterns simulating motion through a 3-D cloud of dots,Andersen and Braunstein (1985) reported linear vectionwith only 7.5° central stimulation, and Delorme and Martin (1986) elicited linear vection in an oscillating roomwith 40° central stimulation. Most convincingly, Post
(1988) found equal circular vection in central and peripheral vision with a 30° display, contrary to the peripheral dominance hypothesis.
The peripheral dominance hypothesis initially appearedto generalize to postural responses during standing (Amblard & Carblanc, 1980; Lestienne, Soechting, & Berthoz, 1977). But subsequent experiments found that postural sway could be elicited by central stimulation aswell, using both radial and lamellar flow as small as 15°in diameter (Andersen & Dyre, 1989; Delorme & Martin, 1986; Nougier, Bard, Fleury, & Teasdale, 1997).Paulus, Straube, and Brandt (1984) even found that spontaneous postural sway when one is viewing a textured wallwas substantially lower with 30° of central vision thanwith 30° ofperipheral vision, owing to information frombinocular convergence. In a suggestive set ofexperimentswith a moving room, Stoffregen (1985, 1986) reportedthat both radial and lamellar flow patterns (60° diameter)induced significant postural sway when presented centrally, whereas only lamellar flow was effective 90° in theperiphery. This interaction led Stoffregen to propose thatthe central retina is sensitive to both types of flow but
1358 BARDY, WARREN, AND KAY
that the peripheral retina is insensitive to radial flow forpostural control-the functional sensitivity hypothesis.
In the context ofjudging the direction of self-motion,Warren and Kurtz (1992) also found that heading accuracywas higher when the focus ofexpansion (FOE) appearedat the fovea as opposed to the periphery, and they interpreted this result in line with the functional sensitivityhypothesis. However, their displays confounded the retinaleccentricity of the FOE with its position in the display.Crowell and Banks (1993) studied the discrimination ofsuccessive flow fields and found a similar four-fold advantage when the FOE was at the fovea, but otherwiseconstant performance as a function ofretinal eccentricity,with a range of radial to lamellar flow patterns. In anideal observer analysis (Crowell & Banks, 1996), theyconcluded that radial flow has a small foveal advantage,and that radial flow is extracted an order of magnitudeless efficiently than lamellar flow. Otherwise, the efficiency for both radial and lamellar flow is constant acrosseccentricity, contrary to any cortical magnification factorbut consistent with retinal invariance. In addition, Stoffregen and Riccio (1990) reported that head-dodging responses to radial flow patterns specifying a looming objectwere equally accurate in central and peripheral (90°) vision.
Even though vection, postural control, and heading perception are to some extent dissociable (Warren & Kurtz,1992), it is likely that they share some visual processesin common. With regard to central vision, the literaturediscussed above offers converging evidence from all threephenomena for central sensitivity to both radial and lamellar flow, leading to the rejection of simple peripheraldominance. With regard to peripheral vision, sensitivityto radial flow has been demonstrated for the cases ofheading and looming, but not for vection or posture. Thus,the question ofretinal invariance or differential sensitivity remains unresolved. In the present study, we examineit for the case of postural control during locomotion.
Visual Control of Posture During LocomotionTo keep balance during locomotion, observers must
make adaptive postural adjustments while maintainingforward progression. As in the case of standing posture,optic flow at the eye of a walking observer contains information that specifies the appropriate compensatoryresponses. By manipulating a visual "driver" display foran observer on a treadmill, we have recently shown thatboth radial flow and motion parallax information are usedto control postural sway during walking (Bardy, Warren,& Kay, 1996; Warren, Kay, & Yilmaz, 1996). In general,compensatory sway isfunctionally specific to the specifieddisturbance; it is (I) directionally specific or in the direction specified by the flow pattern, (2) isotropic or ofcomparable amplitude in all driver directions, and (3) stronglycoupled to the visual driver with a high cross-correlationin all directions.
The present experiments were designed to test whetherthese postural responses depend on the retinal eccentricity of the display. We presented radial and lamellar flow
patterns in central and peripheral vision to subjects walking on a treadmill, and we measured their postural sway.The retinal invariance hypothesis predicts that posturalresponses will be functionally specific at all eccentricities. In contrast, the differential sensitivity hypothesispredicts functionally specific responses to both radialand lamellar flow in central vision, but only to lamellarflow in peripheral vision. Finally,the peripheral dominancehypothesis predicts functionally specific responses withperipheral but not central stimulation. The results areconsistent with retinal invariance.
EXPERIMENT 1
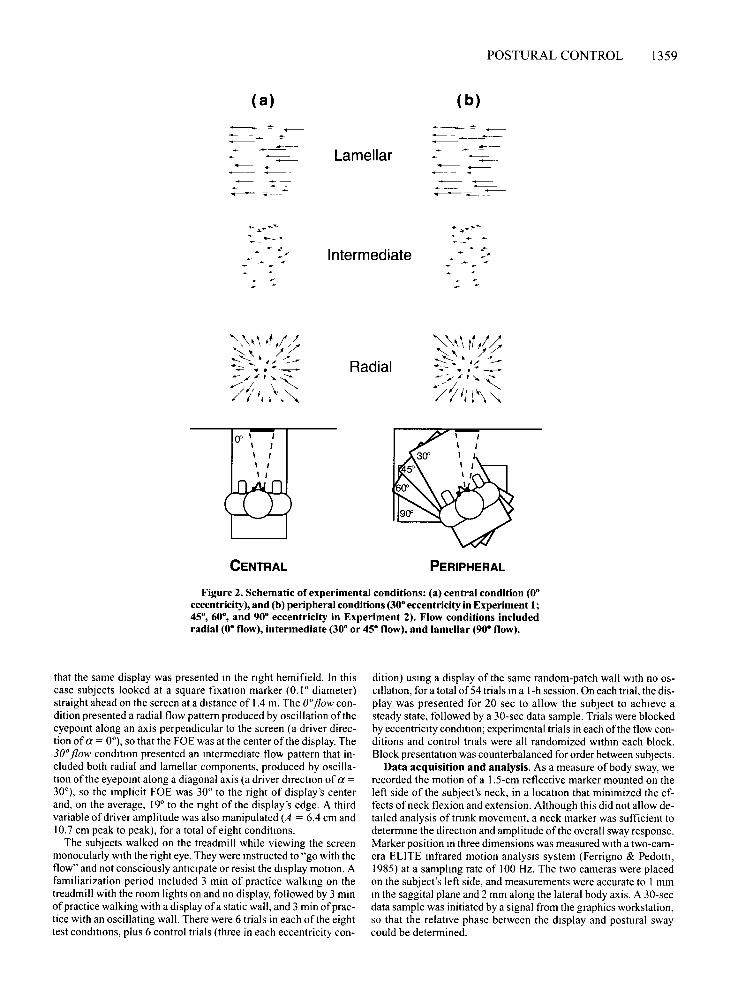
Displays (22° in diameter) of a frontal surface oscillating sinusoidally in depth were presented to observerswalking on a treadmill, while postural sway was estimated from a marker on the neck. In Experiment 1, wetested two flow patterns corresponding to postural swayin two directions (see Figure 2): a radial flow pattern withthe FOE at the center ofthe display (0° flow), and an intermediate flow pattern with an implicit FOE 30 0 fromthe center ofthe display (30 0 flow). These were presentedin both central vision (00 eccentricity) and peripheral vision (30 0 eccentricity). The displays included an oscillatory component corresponding to postural sway but nota constant-velocity component corresponding to forwardprogression, for previous results showed that postural responses are similar with or without the latter (Warrenet aI., 1996). The range of flow patterns and retinal eccentricities was extended in Experiment 2.
MethodSubjects. Eight subjects, 20 to 30 years ofage, were paid to par
ticipate in the experiment. They included 7 graduate students and thefirst author, who was the only one informed about the aim ofthe study.
Apparatus. Displays depicted a random-patch frontal wall thatoscillated in depth (the visual driver), simulating a sinusoidal oscillation of the observation point. I These were generated on a Silicon Graphics Iris 40/310 VGX workstation at a frame rate of60 Hzand presented on a rear-projection screen (2.94 m horizontal [H] X
2.17 m vertical [V]) using a BARCO Graphics 800 video projectorwith a 60-Hz refresh rate. Each subject viewed the screen from adistance of approximately 1.2 m while walking on a motor-driventreadmill (Quinton Q-55, 0.5 X 1.3 m belt) at a constant speed ofI m/sec. Image resolution was 1,280 H X 1,024 V pixels. Thesquare wall consisted of 256 white squares (each 1.5 cm-) in random positions and orientations on a blue background and subtendeda mean visual angle of f) = 22° over one cycle ofoscillation, equivalent to a 0.5-m-diameter surface at the screen distance of I.2 m. Itoscillated in depth at a frequency off = 0.25 Hz, with a peakto-peak amplitude of either A = 6.4 em (total change in visualangle of 1.2°, mean expansion rate over one half-cycle of8,f) =0.026/sec) or A = 10.7 em (change of2.0°, mean expansion rate of0.044/ sec). The subject's field of view was restricted to the screenby a head-mounted sport mask.
Design and Procedure. Twoeccentricity conditions were crossedwith two flow conditions (FIgure 2). In the central condition (0° eccentricity), the treadmill was oriented perpendicular to the screenand subjects were instructed to look straight ahead.? so the centerofthe display was presented in central vision. In the peripheral condition (30° eccentricity), the treadmill was rotated 30° to the left, so
(a)
--~ Lamellar
Intermediate
Radial
POSTURAL CONTROL
( b)
------~--- .~
1359
(J' \ I\ I\ I\ I\ I
CENTRAL PERIPHERAL
Figure 2. Schematic of experimental conditions: (a) central condition (0·eccentricity), and (b) peripheral conditions (30· eccentricity in Experiment I;45·, 60·, and 90· eccentricity in Experiment 2). Flow conditions includedradial (0· flow), intermediate (30· or 45· flow), and lamellar (90· flow).
that the same display was presented In the right hemifield. In thiscase subjects looked at a square fixation marker (0.1 ° diameter)straight ahead on the screen at a distance of 1.4 m. The O·flow condition presented a radial flow pattern produced by oscillation oftheeyepoint along an axis perpendicular to the screen (a driver direction of a = 0°), so that the FOE was at the center of the display. The30oflow condmon presented an Intermediate flow pattern that included both radial and lamellar components, produced by oscillanon ofthe eyepoint along a diagonal axis (a driver drrection of a =30°), so the implicit FOE was 30° to the right of display's centerand, on the average, 19° to the right of the display's edge. A thirdvariable ofdriver amplitude was also manipulated (A = 6.4 em and10.7 ern peak to peak), for a total of eight conditions.
The subjects walked on the treadmill while viewing the screenmonocularly with the right eye. They were Instructed to "go with theflow" and not consciously anttcipate or resist the display motron. Afamiliarization period Included 3 min of practice walking on thetreadmill with the room lights on and no display, followed by 3 minofpractice walking with a display ofa static wall, and 3 min ofpractice with an oscillating wall. There were 6 trials in each of the eighttest conditions, plus 6 control trials (three in each eccentricity con-
dition) USIng a display of the same random-patch wall with no oscrllation, for a total of54 trials In a l-h session. On each trial, the display was presented for 20 sec to allow the subject to achieve asteady state, followed by a 3D-sec data sample. Trials were blockedby eccentricity conditron: experimental trials in each of the flow conditions and control trials were all randomized withm each block.Block presentatron was counterbalanced for order between subjects.
Data acquisition and analysis. As a measure of body sway, werecorded the motion of a 1.5-cm reflective marker mounted on theleft side of the subject's neck, in a location that minimized the effects of neck flexion and extension. Although this did not allow detailed analysis of trunk movement, a neck marker was sufficient todeterrmne the direction and amplitude of the overall sway response.Marker position In three dimensions was measured with a two-camera ELITE Infrared motion analysis system (Ferrigno & Pedotti,1985) at a sarnplmg rate of 100 Hz. The two cameras were placedon the subject's left side, and measurements were accurate to I mmIn the saggital plane and 2 mm along the lateral body axis. A 3D-secdata sample was initiated by a signal from the graphics workstation,so that the relative phase between the display and postural swaycould be determined.
1360 BARDY, WARREN, AND KAY
For each trial, the time series of body sway was fit with a cosineat the driver frequency, leaving amplitude and phase as free parameters; the same cosine was fit to the control trials as a baseline measure. As is noted in Warren et al. (1996), this method gives resultsidentical to performing a discrete Fourier transform at the driverfrequency alone. Because sway could occur in any direction, thiscross-correlation was computed at 2° intervals in the horizontal planeand the direction with the maximal sway amplitude was determined. We used this iterative method because the function relatingsway amplitude to direction is complicated to infer from responsesm two cardinal directions (see Granat, Barnett, Kirkwood, & Andrews, 1991). This method was successully applied previously(Bardy et al., 1996; Warren et aI., 1996). The resulting multiple Rvalue provided an estimate of the overall strength of the couplingbetween the dnver and sway.' Thus, the dependent variables were(\) the direction a' havmg the maximal amplitude of sway, (2) thepeak-to-peak amplitude A'max of sway in that direction, (3) thecross-correlation R between the driver and sway in that direction,and (4) the phase angle if! between driver and sway. Standard circular statistics (Batschelet, 1981) were used for computing means ofdirection and phase as well as relevant inferential statistics. Furthermethodological details are described in Bardy et al. (\ 996) andWarren et al. (1996).
Results and DiscussionThe mean direction and amplitude of sway in each ec
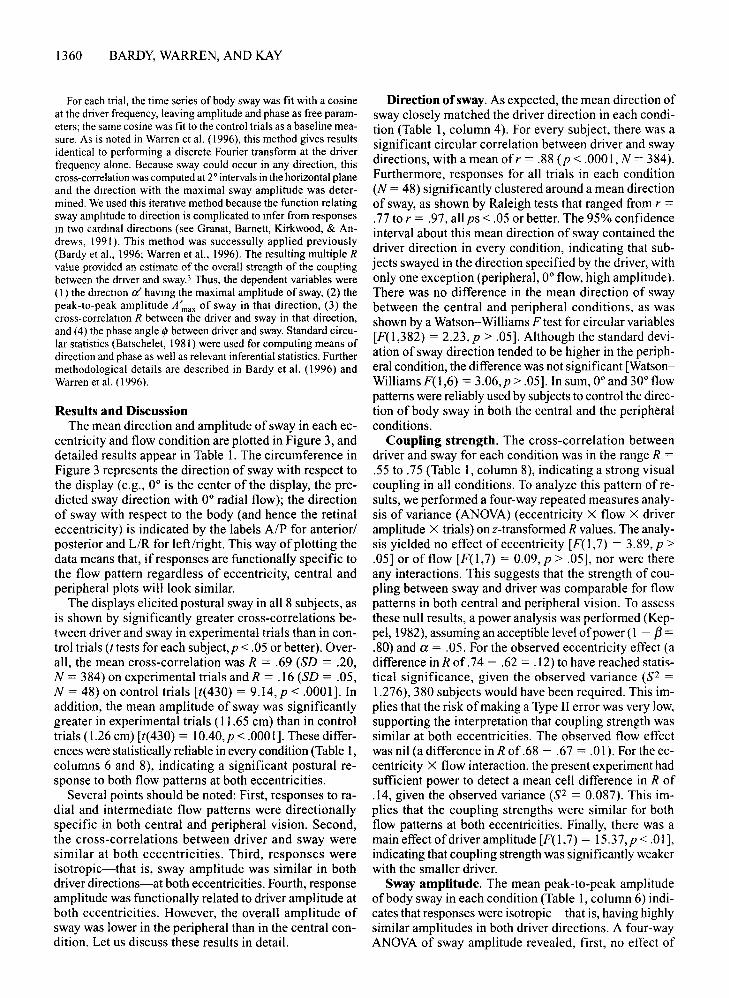
centricity and flow condition are plotted in Figure 3, anddetailed results appear in Table I. The circumference inFigure 3 represents the direction of sway with respect tothe display (e.g., 0° is the center of the display, the predicted sway direction with 0° radial flow); the directionof sway with respect to the body (and hence the retinaleccentricity) is indicated by the labels AlP for anteriorlposterior and L/R for left/right. This way of plotting thedata means that, if responses are functionally specific tothe flow pattern regardless of eccentricity, central andperipheral plots will look similar.
The displays elicited postural sway in all 8 subjects, asis shown by significantly greater cross-correlations between driver and sway in experimental trials than in control trials (t tests for each subject, p < .05 or better). Overall, the mean cross-correlation was R = .69 (SD = .20,N = 384) on experimental trials and R = .16 (SD = .05,N = 48) on control trials [t(430) = 9.14,p < .0001]. Inaddition, the mean amplitude of sway was significantlygreater in experimental trials (11.65 em) than in controltrials (1.26 em) [t( 430) = 10.40,p < .000 I]. These differences were statistically reliable in every condition (Table I,columns 6 and 8), indicating a significant postural response to both flow patterns at both eccentricities.
Several points should be noted: First, responses to radial and intermediate flow patterns were directionallyspecific in both central and peripheral vision. Second,the cross-correlations between driver and sway weresimilar at both eccentricities. Third, responses wereisotropic-that is, sway amplitude was similar in bothdriver directions-at both eccentricities. Fourth, responseamplitude was functionally related to driver amplitude atboth eccentricities. However, the overall amplitude ofsway was lower in the peripheral than in the central condition. Let us discuss these results in detail.
Direction ofsway. As expected, the mean direction ofsway closely matched the driver direction in each condition (Table I, column 4). For every subject, there was asignificant circular correlation between driver and swaydirections, with a mean ofr = .88 (p < .0001, N = 384).Furthermore, responses for all trials in each condition(N = 48) significantly clustered around a mean directionof sway, as shown by Raleigh tests that ranged from r =.77 to r = .97, allps < .05 or better. The 95% confidenceinterval about this mean direction of sway contained thedriver direction in every condition, indicating that subjects swayed in the direction specified by the driver, withonly one exception (peripheral, 0° flow, high amplitude).There was no difference in the mean direction of swaybetween the central and peripheral conditions, as wasshown by a Watson-Williams F test for circular variables[F(l,382) = 2.23, p > .05]. Although the standard deviation of sway direction tended to be higher in the peripheral condition, the difference was not significant [WatsonWilliams F(I,6) = 3.06,p > .05]. In sum, 0° and 30° flowpatterns were reliably used by subjects to control the direction of body sway in both the central and the peripheralconditions.
Coupling strength. The cross-correlation betweendriver and sway for each condition was in the range R =
.55 to .75 (Table I, column 8), indicating a strong visualcoupling in all conditions. To analyze this pattern of results, we performed a four-way repeated measures analysis of variance (ANaYA) (eccentricity X flow X driveramplitude X trials) on z-transformed R values. The analysis yielded no effect of eccentricity [F(l,7) = 3.89, p >.05] or of flow [F(l,7) = 0.09, p > .05], nor were thereany interactions. This suggests that the strength of coupling between sway and driver was comparable for flowpatterns in both central and peripheral vision. To assessthese null results, a power analysis was performed (Keppel, 1982), assuming an acceptible level ofpower (I - f3 =
.80) and a = .05. For the observed eccentricity effect (adifference in R of.74 - .62 = .12) to have reached statistical significance, given the observed variance (S2 =
1.276),380 subjects would have been required. This implies that the risk ofmaking a Type II error was very low,supporting the interpretation that coupling strength wassimilar at both eccentricities. The observed flow effectwas nil (a difference in R of.68 - .67 = .0 I). For the eccentricity X flow interaction, the present experiment hadsufficient power to detect a mean cell difference in R of.14, given the observed variance (S2 = 0.087). This implies that the coupling strengths were similar for bothflow patterns at both eccentricities. Finally, there was amain effect ofdriver amplitude [F(l,7) = 15.37,p< .01],indicating that coupling strength was significantly weakerwith the smaller driver.
Sway amplitude. The mean peak-to-peak amplitudeofbody sway in each condition (Table I, column 6) indicates that responses were isotropic-that is, having highlysimilar amplitudes in both driver directions. A four-wayANaYA of sway amplitude revealed, first, no effect of
POSTURAL CONTROL 1361
~A00 • A = 6.4 em
(a) CENTRAL -30 030 0 oA=10.7em
/"
/
/ /"
/ I
I / /
L -90 0 I I 900 R\ \ 9
\ \Amp (em)
/\ /"
/-1200 -, 1200
/<,
/"
1500-15001800
P
\00
• A", 6.4 em~
-30 030 0 o A = 10.7 em
(b) PERIPHERAL /"......
/<,
~-60 0
/-, 600
/"30'
\/ I \\
I / \\ \-90 0 I I 900
\ \ 6 9/ Amp (em)
\ \/ /
\ -,/"
<,/
1200<,
/
\,.. ...... /"
-1500 1500
1800~
Figure 3. Polar plots representing mean direction and amplitude of body sway in Experiment I: (a) central condition (0· eccentricity), (b) peripheral condition (30· eccentricity). The radial (0· flow) and intermediate (30· flow) conditions are indicated by numbers on the curves. The circumferential coordinates (0· to 180·) represent sway directionwith respect to the center of the display, which appeared at 00. The participant's bodyaxes are indicated by A-P and L-R; in the peripheral condition, the body axes are rotatedwith respect to the display by -30·. Arrows indicate the treadmill orientation. Driver frequency = 0.25 Hz, driver amplitudes = 6.4 and 10.7 em.
flow condition [F(1,7) = 3.73,p > .05], with a mean of12.23 ern (SD = 6.92) for 0° flow and 11.06 em (SD =6.43) for the 30° flow. A power analysis showed that forthe observed flow effect (a difference of 1.17 ern) to havereached significance, 400 subjects would have been re-
qui red, given the observed variance (S2 = 34.78). Therisk of a Type II error was thus very low, implying thatsway amplitude was similar in both flow conditions. Thelack of a flow X eccentricity interaction [F(1, 7) = .48,p > .05], is consistent with isotropic responses in both
1362 BARDY, WARREN, AND KAY
Table 1Mean Postural Sway and Standard Deviation by Condition in Experiment 1
Retinal Flow Driver a' (deg) A 'max (em) R ¢(deg) RaleighEccentricity conditions Amp (em) M SD M SD M SD M SD Phase r
Grand mean 11.65* 5.96 .69* .20 -27.75* 39.81 .76*Control 1.26 0.59 .16 .05
Note-Frequency (0.25 Hz) is fixed. For a~ asterisks indicate that the Raleigh test of nonhomogeneity for sway directionwas significant. For A 'max • asterisks indicate that the experimental amplitude was statistically different from the control am-plitude. For R, asterisks indicate that the driver sway cross-correlation was statistically different between control and ex-perimental trials. For ¢, asterisks indicate that the mean phase angle between driver and sway was statistically different from0°. For Raleigh phase r, asterisks indicate that the Raleigh test of nonhomogeneity for phase was statistically significant."p < .05 or better.
central and peripheral vision. Given the observed variance (S2 = 17.38), the present experiment had sufficientpower to detect a mean cell difference of 3.8 em. Swayamplitude was 4 em greater with the large driver thanwith the small driver [F(1,7) = 15.38,p < .01], with no interactions. This indicates that responses to both flow patterns were functionally linked to the amplitude of the driver at both eccentricities.
The only unexpected finding was that mean sway amplitude was significantly lower in the peripheral condition (9.12 em, SD = 6.00) than in the central condition(14.17 cm, SD = 6.37) [F(1,7) = 14.85,p < .01]. Notethat this effect was due to the retinal eccentricity of theentire display, not the eccentricity of the FOE; when theimplicit FOE appeared in the same retinal location (+30°eccentricity), sway responses were still 4 em smaller inthe peripheral condition with radial flow (9.86 em) thanin the central condition with intermediate flow (13.75 ern)(Newman-Keuls p < .05). Conversely, however, whenthe entire display appeared in the same retinal location,there was no effect of the position of the FOE. Thus, themagnitude of sway was independent of the retinal locusof the FOE, but it depended on the retinal locus of the entire display.
Finally, the ANOVAs showed no effect of the trialsfactor on either sway amplitude [F(1,7) = .77,p > .05] orthe cross-correlation [F(1,7) = .78,p > .05], and no signofadaptation was observed during the experiment. Noneof the other interactions was significant.
Phase. In each condition, the phase angle between swayand driver was found to be significantly clustered arounda mean, with Raleigh tests ranging from r = .65 to r =.85 (N = 48, ps <.05 or better) indicating a preferred phaseangle (Table 1, columns 10 and 12). By convention, a positive value of phase indicates that the head is leading thedisplay, whereas a negative value suggests that the headis following it. Phase angle was similar in the two flowconditions, with means of - 31.18° (SD = 38.93) for 0°
flow and -25.94° (SD = 43.84) for 30° flow [WatsonWilliams F(1,382) = 1.30,P > .05]. This provides converging evidence that sway was driven in a similar manner by different flow patterns. On the other hand, meanphase angle was significantly more negative in centralvision (- 38.27°, SD = 37.40) than in peripheral vision(-18.03°, SD = 43.55) [Watson-Williams F(1,382) =20.48, p < .01], indicating that sway lagged farther behind the display oscillation. This was largely due to the twoperipheral conditions with intermediate flow, in whichmean phase was not significantly different from 0°. In allother conditions, phase was significantly negative (asterisks in Table 1, column 10).
Thus, the results provide evidence that compensatorysway is functionally specific to the structure ofoptic flowin both central and peripheral vision. In particular, postural sway (1) was directionally specific to the flow pattern, (2) was isotropic in amplitude across driver directions, (3) had similarly strong cross-correlations with thedisplay, and (4) covaried with display amplitude, whetherthe stimulation appeared centrally or peripherally. Thisindicates that peripheral vision is sensitive to radial aswell as lamellar flow for purposes of postural control,contrary to the functional sensitivity hypothesis. This pattern of results is consistent with retinal invariance, at leastout to an eccentricity of 30°.
The only anomalous result was that the amplitude ofsway was actually smaller with peripheral than with central stimulation, and that mean phase was closer to zeroin the periphery. One possible explanation is that the peripheral eccentricity tested (30°) is adjacent to the "blindspot," located at 15°-20° along the nasal retina (Pirenne,1967), perhaps making the driver amplitude harder to detect. A more likely possibility is that the lower amplitudeis an artifact of using a fixation marker in the peripheralcondition only. A stationary fixation point could contribute to the stabilization of posture. In addition, stabilized gaze may allow greater sensitivity to the phase of
oscillation ofthe display. Paulus, Straube, Krafczyk, andBrandt (1989, Figure 6) found that a similar monocularfixation spot (G.O?" at 0.4 m) in the dark did not reducespontaneous standing sway in comparison with an eyesclosed condition, but our testing situation induced muchgreater sway. Both of these confounds were eliminated inthe second experiment.
EXPERIMENT 2
The purpose of Experiment 2 was to extend the rangeofretinal eccentricities and flow patterns tested. Our initial finding that peripheral vision is sensitive to both radialand intermediate flow patterns appeared to contradictprevious reports that radial flow is ineffective in the periphery (Stoffregen, 1985, 1986). However, whereas Stoffregen's peripheral display appeared at a retinal eccentricity of 90°, ours appeared at an eccentricity of only 30°.The area centralis in the human retina is about 6 mm indiameter and subtends roughly 10° 15° centered on thefovea (Buser & Imbert, 1987). In the self-motion literature, eccentricities ranging from 20° to 90° are often referred to as peripheral. Thus, our display was at the lowerend of the peripheral range, and it is possible that responses to radial flow might deteriorate at greater eccentricities. In the present experiment, we tested a largerrange of eccentricities (0°,45°,60°,90°).
Second, previous researchers have compared radialflow with pure lamellar flow, whereas we used an intermediate flow pattern that contained both radial andlamellar components. Thus, in Experiment 2 we alsotested a wider range of flow structures, including pureradial (0° flow), intermediate (45° flow), and pure lamellar (90° flow), crossed with the four eccentricities. Finally, to eliminate the fixation confound, a fixation pointwas presented in all conditions.
MethodThe displays, procedure, and data analysis were the same as in
Experiment I, with the following three exceptions. FIrst, the flowconditions included a radial pattern, a lamellar pattern, and an intermediate pattern midway between them. Specifically, the O"flowcondition was similar to that of Experiment I, with the FOE at thecenter of the display, corresponding to oscillation along an axis perpendicular to the screen. The 45"flow condition had an intermediate pattern corresponding to oscillation along the main diagonalaXIS, such that the virtual FOE was 45° to the right of the center ofthe display. The 90"flow condition was a pure lamellar patterncorresponding to oscillation along an axis parallel to the screen,such that the VIrtual FOE was at 90". Second, retmal eccentricitiesincluded the central condition ofExpenment I (0° eccentricity) andthree new peripheral conditions (45°,60°,90° eccentricity). For thelatter conditions, the treadmill was turned to the left, so that thesame visual displays were presented in the right hermfield (see Figure 2). To occlude the surrounding room, black curtains were hungon either side of the screen, perpendicular to it. Third, a fixationpoint (0.1° diameter) appeared directly in front of the treadmill ateye level in all conditions. For eccentricities of 0° and 45°, the fixation point was a red dot projected on the screen, whereas for ec-
POSTURAL CONTROL 1363
centricities of 60° and 90° It was a red LED attached to the curtainon the left SIde of the screen.
We tested the same driver frequency (0.25 Hz) and one ofthe twoamplitudes (A = 10.7 ern) from Experiment I. The three authorsand 9 graduate students at Brown University, 21 to 27 years ofage,were paid to participate. None ofthe students had partIcipated in thefirst experiment, nor were they informed about the aim ofthe study.Each subject received 5 experimental trials in each of the 12 condmons plus 5 control trials with a static display for a total of 65 trials. Trials were blocked by eccentricity condition, WIth conditionorder counterbalanced across subjects.
ResultsThe mean sway direction and amplitude in each con
dition are presented in Figure 4, and details appear inTable 2. Overall, the mean cross-correlation and sway amplitude were greater in experimental trials (R = .72,A / = II 29 em N = 720) than in control trials (R =max . ,.15, A/max = 1.35 ern,N = 60)[t(778) > 11.37,p < .001].This difference was statistically reliable in every condition (Table 2, columns 5 and 7), indicating a significantpostural response to all flow patterns at all eccentricities.
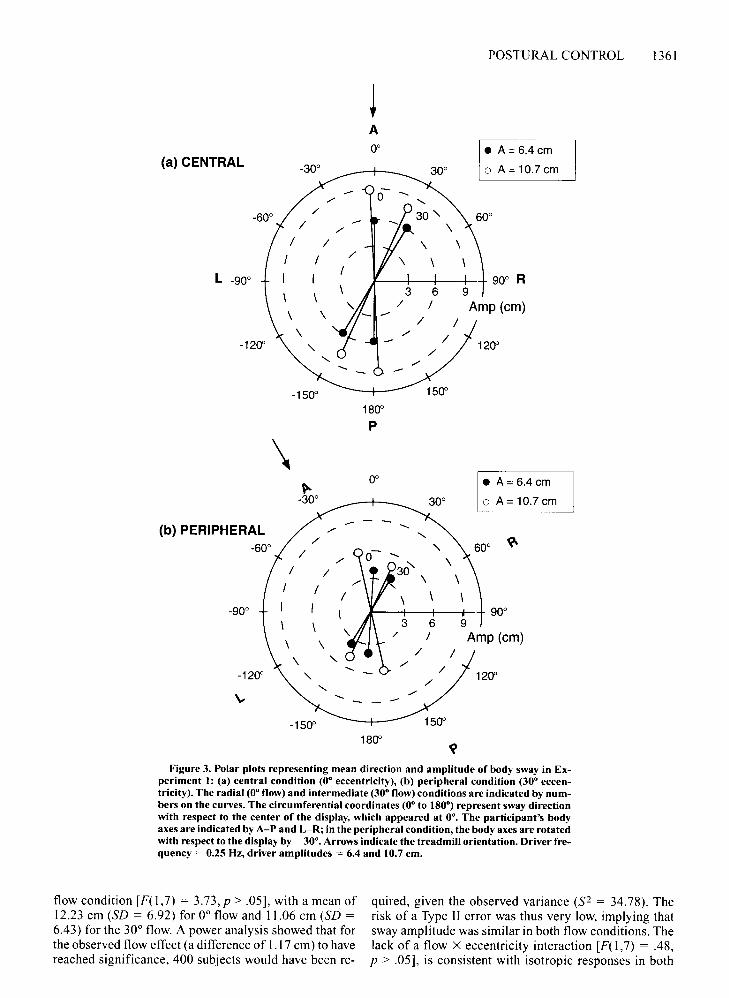
Four points should be noted about the results. First, thedifference in amplitude between central and peripheralconditions observed in Experiment 1 disappeared. Second, sway was strongly coupled to the driver and swayamplitudes were isotropic across driver directions, regardless of retinal eccentricity. Third, the direction of swayclosely matched the driver direction in both the radialand the lamellar conditions, but in the intermediate condition it was consistently biased toward the lamellar driver direction. Fourth, subjects followed the driver withabout a 20° phase lag in all conditions. We shall discussthese points in detail.
Sway amplitude. Unlike in Experiment I, the amplitude of sway was comparable at all eccentricities, withmeans of 12.59 em (SD = 6.33) in the 0° central condition, 10.94 em (SD = 6.79) in the 45° peripheral condition, 11.47 em (SD = 6.07) in the 60° peripheral condition, and 10.17 em (SD = 7.28) in the 90° peripheralcondition. In addition, sway amplitude was similar in alldriver directions, with means of 10.57 em for radial flow,11.09 em for intermediate flow, and 12.22 em for lamellar flow. A three-way repeated measures ANOVAofswayamplitude (flow X eccentricity X trials) yielded no maineffects of eccentricity [F(3,33) = 1.24, p > .05] or flowpattern [F(2,22) = 3.12, p > .05], and no eccentricity X
flow interaction [F(6,66) = 1.471, p > .05]. A poweranalysis showed that for the observed eccentricity effectto have reached significance would have required 526subjects, given the observed variance (S2A X S = 149.73),and that the observed flow effect would have required374 subjects, given the observed variance (S2B X S = 55.00),implying that the risk ofa Type II error in either case waslow. For the eccentricity X flow interaction, the presentexperiment had sufficient power to detect a mean cell difference of2.8 em, given the observed variance (S2AXBXS =45.77). This implies that the sway amplitudes were similar
1364 BARDY, WARREN, AND KAY
(a) CENTRAL
A
L -90" +--+--1.......,..--:::~__..;;.;;...+--+ 90" R
(b) 45° PERIPHERAL
(c) 60° PERIPHERAL
180"
(d) 90° PERIPHERAL
a:
180"
..I
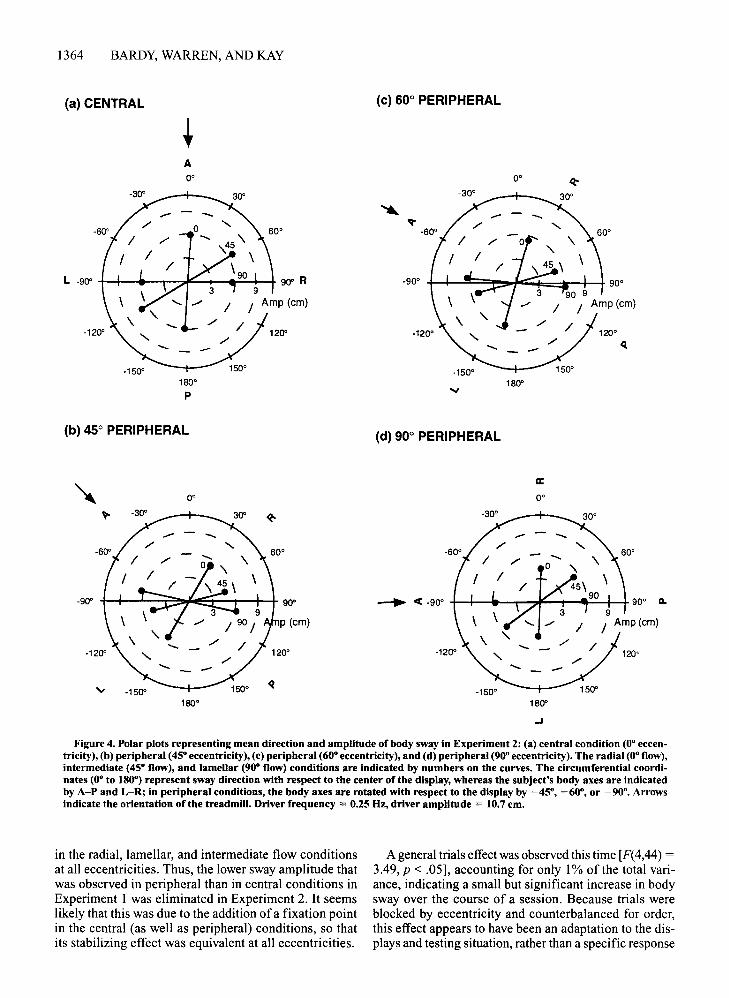
Figure 4. Polar plots representing mean direction and amplitude of body sway in Experiment 2: (a) central condition (0· eccentricity), (b) peripheral (45· eccentricity), (c) peripheral (60· eccentricity), and (d) peripheral (90· eccentricity). The radial (0· flow),intermediate (45· flow), and lamellar (90· flow) conditions are indicated by numbers on the curves. The circumferential coordinates (0· to 180·) represent sway direction with respect to the center of the display, whereas the subject's body axes are indicatedby A-P and L-R; in peripheral conditions, the body axes are rotated with respect to the display by -45·, -60·, or -90·. Arrowsindicate the orientation of the treadmill. Driver frequency = 0.25 Hz, driver amplitude = 10.7 ern.
in the radial, lamellar, and intermediate flow conditionsat all eccentricities. Thus, the lower sway amplitude thatwas observed in peripheral than in central conditions inExperiment 1 was eliminated in Experiment 2. It seemslikely that this was due to the addition ofa fixation pointin the central (as well as peripheral) conditions, so thatits stabilizing effect was equivalent at all eccentricities.
A general trials effect was observed this time [F(4,44) =3.49, p < .05], accounting for only 1% of the total variance, indicating a small but significant increase in bodysway over the course of a session. Because trials wereblocked by eccentricity and counterbalanced for order,this effect appears to have been an adaptation to the displays and testing situation, rather than a specific response
POSTURAL CONTROL 1365
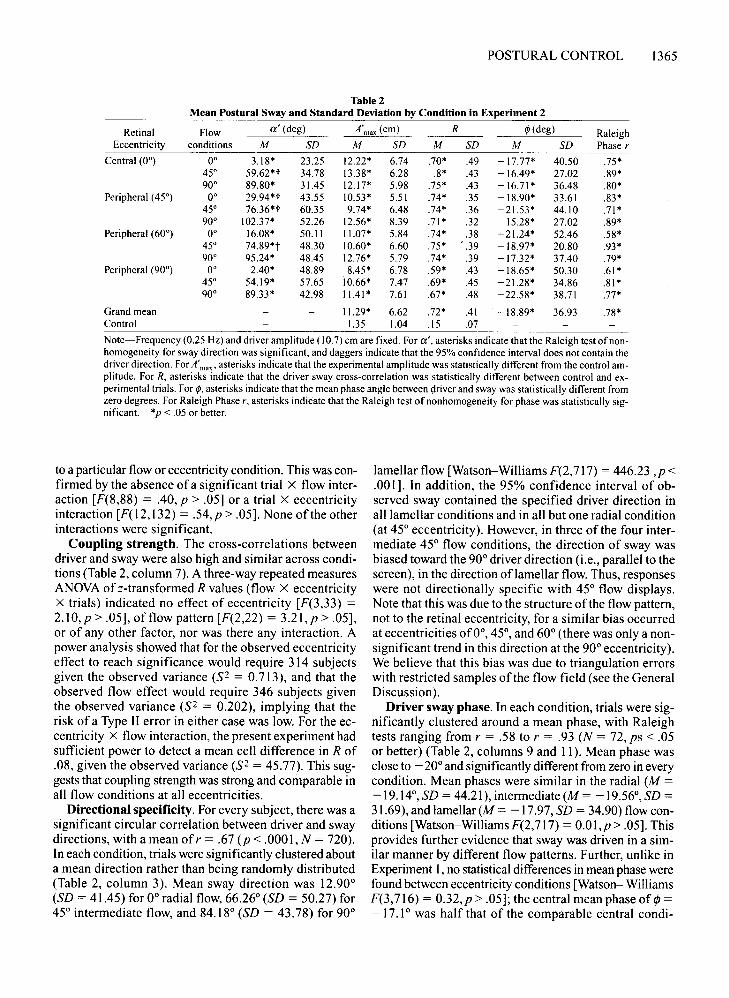
Table 2Mean Postural Sway and Standard Deviation by Condition in Experiment 2
Retinal Flow a' (deg) A'max (ern) R ¢(deg) RaleighEccentricity conditions M SD M SD M SD M SD Phase r
Grand mean 11.29* 6.62 .72* .41 -18.89* 36.93 .78*Control 1.35 1.04 .15 .07
Note-Frequency (0.25 Hz) and driver amplitude (10.7) ern are fixed. For a', asterisks indicate that the Raleigh test of non-homogeneity for sway direction was significant, and daggers indicate that the 95% confidence interval does not contain thedriver direction. For A'max' asterisks indicate that the experimental amplitude was statistically different from the control am-plitude. For R, asterisks indicate that the driver sway cross-correlation was statistically different between control and ex-perimental trials. For ¢, asterisks indicate that the mean phase angle between driver and sway was statistically different fromzero degrees. For Raleigh Phase r, asterisks indicate that the Raleigh test of nonhomogeneity for phase was statistically sig-nificant. *p < .05 or better.
to a particular flow or eccentricity condition. This was confirmed by the absence ofa significant trial X flow interaction [F(8,88) = .40, p > .05] or a trial X eccentricityinteraction [F( 12,132) = .54, p > .05]. None of the otherinteractions were significant.
Coupling strength. The cross-correlations betweendriver and sway were also high and similar across conditions (Table 2, column 7). A three-way repeated measuresANOYA ofz-transformed R values (flow X eccentricityX trials) indicated no effect of eccentricity [F(3,33) =2.1O,p> .05], of flow pattern [F(2,22) = 3.21,p > .05],or of any other factor, nor was there any interaction. Apower analysis showed that for the observed eccentricityeffect to reach significance would require 314 subjectsgiven the observed variance (S2 = 0.713), and that theobserved flow effect would require 346 subjects giventhe observed variance (S2 = 0.202), implying that therisk of a Type II error in either case was low. For the eccentricity X flow interaction, the present experiment hadsufficient power to detect a mean cell difference in R of.08, given the observed variance (S2 = 45.77). This suggests that coupling strength was strong and comparable inall flow conditions at all eccentricities.
Directional specificity. For every subject, there was asignificant circular correlation between driver and swaydirections, with a mean ofr = .67 (p < .0001, N = 720).In each condition, trials were significantly clustered abouta mean direction rather than being randomly distributed(Table 2, column 3). Mean sway direction was 12.90°(SD = 41.45) for 0° radial flow, 66.26° (SD = 50.27) for45° intermediate flow, and 84.18° (SD = 43.78) for 90°
lamellar flow [Watson-Williams F(2,717) = 446.23 ,p <.001]. In addition, the 95% confidence interval of observed sway contained the specified driver direction inall lamellar conditions and in all but one radial condition(at 45° eccentricity). However, in three of the four intermediate 45° flow conditions, the direction of sway wasbiased toward the 90° driver direction (i.e., parallel to thescreen), in the direction oflamellar flow. Thus, responseswere not directionally specific with 45° flow displays.Note that this was due to the structure of the flow pattern,not to the retinal eccentricity, for a similar bias occurredat eccentricities of0°, 45°, and 60° (there was only a nonsignificant trend in this direction at the 90° eccentricity).We believe that this bias was due to triangulation errorswith restricted samples of the flow field (see the GeneralDiscussion).
Driver sway phase. In each condition, trials were significantly clustered around a mean phase, with Raleightests ranging from r = .58 to r = .93 (N = 72, ps < .05or better) (Table 2, columns 9 and 11). Mean phase wasclose to - 20° and significantly different from zero in everycondition. Mean phases were similar in the radial (M =-19.14°, SD = 44.21), intermediate (M = -19.56°, SD =31.69), andlameIIar(M = -17.97, SD == 34.90) flow conditions [Watson-Williams F(2,717) = O.OI,p > .05]. Thisprovides further evidence that sway was driven in a similar manner by different flow patterns. Further, unlike inExperiment 1, no statistical differences in mean phase werefound between eccentricity conditions [Watson- WilliamsF(3,716) = 0.32,p > .05]; the central mean phase of cf> =-17.1 ° was half that of the comparable central condi-
1366 BARDY, WARREN, AND KAY
tions in Experiment 1 (ct> = - 33.2°). Again, this was likelydue to the addition of a fixation point in the central condition, so that stabilized gaze may have allowed the visual system to be more sensitive to display phase.
In sum, these results replicate and extend those of Experiment 1 by showing that a 22° patch of optic flow cansignificantly influence postural sway at retinal eccentricities ranging from 0° to 90°. Responses were directionally specific at all eccentricities with radial and lamellarflow, and even the directional bias observed in the intermediate flow condition was consistent across eccentricity. Furthermore, we found no evidence ofdifferences insway amplitude, cross-correlation, or phase as a functionofeccentricity, and the power analyses indicated that theprobability oferroneously accepting these null hypotheses was low. This pattern of similar adaptive responsesacross a wide range of eccentricities is consistent withthe retinal invariance hypothesis.
GENERAL DISCUSSION
The present data indicate that the structure of opticflow is more important than the retinal locus of stimulation for controlling posture during locomotion. The mainresult of both experiments is that postural responses arefunctionally specific to radial, intermediate, and lamellar flow patterns, whether they appear in central or peripheral vision. Compensatory sway was strongly coupledto the driver, directionally specific, isotropic over driverdirection, with large amplitudes and a constant phase, atall retinal eccentricities. The conclusion of functionallyspecific responses is warranted, first of all, by the factthat sway amplitudes and cross-correlations were statistically greater than control levels at all eccentricities.Second, it is supported by the finding that sway was directionally specific and covaried with driver amplitude atall eccentricities. The more difficult claim is that the swayamplitudes and cross-correlations were actually similarfor all flow patterns at all eccentricities. We have obtainedno evidence that postural responses to optic flow differas a function of eccentricity, and the power analyses indicated that the likelihood of erroneously accepting thenull hypothesis was small. These observations have obvious implications for the three self-motion hypotheses.
First, the results clearly contradict the hypothesis thatperipheral vision dominates the perception and controlof self-motion. Central stimulation (0° eccentricity) elicited postural responses that were just as large and adaptive as those for peripheral stimulation (30°, 45°, 60°, 90°eccentricity). This finding is consistent with previous results demonstrating significant responses for standingposture in central vision (Andersen & Dyre, 1989; Delorme & Martin, 1986; Paulus et al., 1984; Stoffregen,1985, 1986), as well as centrally induced vection (Andersen & Braunstein, 1985; Howard & Heckmann, 1989;Post, 1988) and accurate central heading judgments
(Crowell & Banks, 1993; Warren & Kurtz, 1992). Theperipheral dominance hypothesis must be rejected.
Second, the results are inconsistent with the functionalsensitivity hypothesis, which states that the peripheralretina is insensitive (or markedly less sensitive) to radialflow for self-motion. We find that peripheral as well ascentral vision yields functionally specific postural responses to radial flow patterns. This is consistent with previous results showing accurate peripheral heading discrimination (Crowell & Banks, 1993) and avoidance oflooming objects (Stoffregen & Riccio, 1990). However,it appears to be at variance with Stoffregen's (1985, 1986)observation that peripheral radial flow did not elicit postural sway during standing. What might account for thedifference in our results?
A likely possibility is that our displays had larger amplitudes, and hence higher optical velocities, than didthose of Stoffregen. Our driver amplitudes of 6.4 and10.7 em peak to peak yielded mean expansion rates of0.026/sec and 0.044/sec over a half-cycle of oscillation.These are an order of magnitude larger than Stoffregen's,about 0.002/sec (1985, Experiment 3) and 0.005/sec(1986, Experiment 2).4 Given that thresholds for motiondetection and speed and direction discrimination all increase with eccentricity (Crowell & Banks, 1996;McKee & Nakayama, 1984; van de Grind, Koenderink,& van Doorn, 1986), it is likely that Stoffregen's radialflow patterns were harder to detect in the periphery thanours, reflecting a general property of the visual systemrather than a functional specialization. Consonant withthis interpretation, reports of accurate peripheral heading discrimination (Crowell & Banks, 1993) and avoidance responses (Stoffregen & Riccio, 1990) also werebased on much higher mean expansion rates, around2.0/sec and 0.6/sec, respectively. Although our expansion rates may be higher than those typical of standingsway, they are relevant to postural control during walking, when sway is greater.
Third, the present data support a retinal invariance hypothesis for postural control. The postural adjustmentsthat we have observed are adaptive directional responsesto the flow pattern regardless of its retinal eccentricityand even have similar amplitudes, cross-correlations,and phases in central and peripheral vision. This retinalinvariance is similar to the recent data on heading judgments, with the exception of a narrow foveal advantagefor radial flow patterns (Crowell & Banks, 1993, 1996;Warren & Kurtz, 1992). Why didn't we find this fovealadvantage in postural responses? One possibility is thata foveal advantage that can be revealed by sensitive psychophysical tests may simply not show up in noisier postural responses. Another possibility is that, rather than aspecialization for radial flow, the advantage is due tohigh acuity for the position and motion of elements nearthe FOE when it appears at the fovea. It is likely that suchacuity would be degraded by large head movements dur-
Figure 5. Schematic oftriangulation error in locating the FOE from a restricted sample of intermediate flow, assuming noise in local motion extraction. Estimated FOE exhibits a constant bias.
ing locomotion. In either case, the import of our resultsis that the functional use of optic flow in the control ofbehavior appears to be retinally invariant.
Finally, it may seem puzzling that postural responseswere directionally specific with radial and lamellar flow,but biased with the 45° intermediate flow. We believethat this effect is attributable to the structure of the flowpattern, as follows. The required direction of sway isspecified by the location ofthe FOE in the field ofviewthe common point of intersection ofall visible flow vectors. The visual system must, in effect, triangulate the visible flow vectors to locate the FOE. As Koenderink andvan Doorn (1987) have pointed out, given that there isconstant unbiased noise in extracting the direction oflocal velocity vectors, this can introduce triangulationerrors in localizing the FOE (see Figure 5). Specifically,as the flow pattern is sampled farther from the FOE, theerror in localizing the common point of intersection willincrease, and a constant bias toward the opposite side ofthe true FOE will also increase. Thus, a pure radial pattern will yield minimum variable error and no bias, butas intermediate flow patterns become more lamellar,both the variable error and constant bias will increase. Indeed, when Crowell and Banks (1993, 1996) asked subjects to discriminate the headings of two successive flowpatterns (thus measuring only the variable error), theyfound low errors with pure radial patterns (threshold =0.2° with a 0° radial flow) that increased as the flow became more lamellar (threshold = 3° with a 30° intermediate flow). In our postural data, a constant bias does notshow up with a 30° intermediate flow, but appears witha more lamellar 45° intermediate flow pattern in the expected direction. The fact that a reliable bias recurred atthree eccentricities (0°, 45°, 60°), with a consistent trendat the 90° eccentricity, only reinforces the visual system'sdependence on the structure of the flow pattern over theretinal region of stimulation.
In sum, our results favor the retinal invariance hypothesis that both central and peripheral vision can use
radial and lamellar flow to control posture during walking. This is what one might expect from an adaptive postural system, for it is desirable that balance be adequatelystabilized regardless of where the observer is looking.Control principles for posture during locomotion thusappear to be based primarily on the structure of the opticflow pattern, regardless of its retinal eccentricity.
REFERENCES
AMBLARD, B., & CARBLANC, A. (1980). Role of foveal and peripheralvision information in the maintenance of postural equilibnum inman. Perceptual & Motor Skills, 51, 903-916.
ANDERSEN, G. J., & BRAUNSTEIN, M. L. (1985). Induced self-motion mcentral vision. Journal ofExperimental Psychology: Human Perception & Performance, 11, 122-132.
ANDERSEN, G. J., & DYRE, B. P.(1989). Spatial onentauon from optic flowin the central VIsual field. Perception & Psychophysics, 45, 453-458.
BARDY. B. G., WARREN. W. H., & KAY, B. A. (1996). Motion parallax ISused to control postural sway during walkmg. Experimental BrainResearch, 111, 271-282.
BATSCHELET, E. (1981). Circular statistics in biology. New York: Academic Press.
BERTHOZ, A., PAVARD, 8..,& YOUNG, L. R. (1975). Perception of lmearhonzontal self motion induced by peripheral VISIon (hnear vection).Experimental Brain Research, 23, 471-489.
BRANDT, T., DICHGANS, J., & KOENIG, E. (1973). DIfferential effects ofcentral versus penpheral VISIon on egocentric and exocentric motionperception. Experimental Brain Research, 16,476-491.
BUSER, P., & IMBERT, M. (1987). Vision. Paris: Hermann.CROWELL, J. A., & BANKS, M. S. (1993). Perceiving heading WIth dif
ferent retmal regions and types of opnc flow. Perception & Psychophysics, 53, 325-337.
CROWELL, 1. A., & BANKS, M. S. (1996). Ideal observer for headingJudgments. Vision Research, 36, 471-490
DELORME, A., & MARTIN, C. (1986). Roles of retmal penphery anddepth penphery m linear vecnon and VIsual control of standing mhumans. Canadian Journal ofPsychology, 40, 176-187.
DICHGANS, J., & BRANDT, T. (1978). Visual-vestibular mteracuon: Effects on self-motion perception and postural control. In R. Held,H. Leibowitz, & H.-L. Teuber (Eds.), Handbook ofsensory physiology Vol 8. Perception (pp. 755-804). New York: Spnnger-Verlag.
DIJKSTRA, T M. H., SCHONER, G., & GIELEN, C. C. A. M. (1994). Temporal stability of the action-percepnon cycle for postural control in amovmg VIsual environment. Experimental Brain Research, 97,477-486.
1368 BARDY, WARREN, AND KAY
FERRIGNO, G., & PEDOTTI, A. (1985). ELITE: A digital dedicated hardware system for movement analysis via real time TV-signal processing. IEEE Transactions on Biomedical Engineering, 32, 943.950.
GIBSON, J. J. (1950). The perception of the visual world. Boston:Houghton Mifflin.
GIBSON, J. J. (1968). What gives rise to the perception of motion? Psychological Review, 75, 335-346.
GRANAT, M. H., BARNETT, R. W., KIRKWOOD, C. A., & ANDREWS, B. 1.(1991). Technique for calculating the direction of postural sway.Medical & Biological Engineering & Computing, 29, 599-601.
HELD, R., DICHGANS, 1., & BAUER, J. (1975). Characteristics ofmovingvisual areas influencing spatial orientation. Vision Research, 15,357-365.
HOWARD, I. P., & HECKMANN, T. (1989). Circular vection as a functionof the relative sizes, distances, and positions oftwo competing visualdisplays. Perception, 18,657-665.
KEPPEL, G. (1982). Design and analysis: A researcher's handbook. Englewood Cliffs, NJ: Prentice-Hall.
KOENDERINK, J. J., & VAN DOORN, A. J. (1987). Facts on optic flow. Biological Cybernetics, 56, 247-254.
LESTIENNE, E, SOECHTlNG, J., & BERTHOZ, A. (1977). Postural readjustments induced by linear motion of visual scenes. ExperimentalBrain Research, 28, 363-384.
MARPLE, S. L. (1986). Digital spectral analysis with applications. Englewood Cliffs, NJ: Prentice-Hall.
McKEE, S. P.,& NAKAYAMA, K. (1984). The detection of motion in theperipheral visual field. Vision Research, 24, 25-32.
NOUGIER, v., BARD, C; FLEURY, M., & TEASDALE, N. (1997). Contribution of central and peripheral vision to the regulation of stance.Gait & Posture, 5, 34-41.
PAULUS, W., STRAUBE, A., & BRANDT, T. (1984). Visual stabilization ofposture: Physiological stimulus characteristics and clinical aspects.Brain, 107,1143-1163.
PAULUS, W, STRAUBE, A., KRAFCZYK, S., & BRANDT, T. (1989). Differential effects of retinal target displacement, changing size, andchanging disparity in the control ofanterior/posterior and lateral bodysway. Experimental Brain Research. 78, 243-252.
PIRENNE, M. H. (1967). Vision and the eye (2nd ed.). New York: Methuen.POST, R. B. (1988). Circular vection is independent of stimulus eccen
tricity. Perception, 17, 737-744.STOFFREGEN, T. A. (1985). Flow structure versus retinal location in the
STOFFREGEN, T. A. (1986). The role of optical velocity in the control ofstance. Perception & Psychophysics, 39, 355-360.
STOFFREGEN, T. A., & RICCIO, G. E. (1990). Responses to optical looming in the retinal center and periphery. Ecological Psychology, 2,251-274.
VAN DER GRIND, W A., KOENDERINK, J. 1., & VAN DOORN, A. J. (1986).The distribution of human motion detector properties In the monocular visual field. Vision Research, 26, 797-810.
WARREN, W H., KAY, B. A., & YILMAZ, E. H. (1996). Visual control ofposture during walking: Functional specificity. Journal of Experimental Psychology: Human Perception & Performance, 22, 818-838.
WARREN, W H., & KURTZ, K. J. (1992). The role of central and peripheral vision in perceiving the direction of self-motion. Perception& Psychophysics, 51, 443-454.
NOTES
I. Even though a sinusoidal driver may be anticipated by the subject,to do so in a functionally specific manner requires that the flow patternbe accurately detected in central or penpheral vision and used to control sway adaptively. This is precisely what we wished to determine.Further, a current view holds that matching the temporal characteristicsof the stimulation, which is often self-produced, may be more basic topostural control than responding to a random driver (Dijkstra, Schoner,& Gielen, 1994).
2. In Experiment I, a fixation point was not used in the central condition, to avoid relative motion between it and the wall display, including induced motion of the fixation marker that might affect sway. Experiment 2 replicated the findings of Experiment I, but with a fixationpoint in the central condition.
3. The multiple R provides an overall measure of the SImilarity between the driver and sway, since it ISsensitive to phase, amplitude, andwaveform fluctuations during a trial. An alternative measure, the magnitude squared coherence (MSC; e.g., Marple, 1986), may provide amore refined measure of the linear coupling of two signals, because itis sensitive to only phase and amplitude fluctuations; however, the MSCis statistically unreliable with the short data records of this study.
4. The expansion rate for Stoffregen (1985) IScalculated from the experimental parameters, (J = 60°, F = 0.08 Hz, and A = 2.5 cm With asurface at a distance of about 1.85 m. The total change in visual anglein one half-period (6 sec) is!i(J = 0.67°, and the mean expansion rate is!i(J/6(J = 0.002/sec. The expansion rate for Stoffregen (1986) is determined from his Figure 4.
(Manuscript received July 17, 1996;revision accepted for publication July 17, 1998.)