Page 1
The Royal Birth of 2013: Analysing and Visualising Public Sentiment in the UK Using Twitter
Vu Dung Nguyen, Blesson Varghese, Adam Barker
University of St Andrews, UK
[email protected]
http://www.blessonv.com
Page 2
Table of Contents
• Breaking the Title Apart
• Introduction
• Framework for Sentiment
Analysis
• Case Study
• Public Dissemination
• Conclusions
8 Oct 2013 ~ B. Varghese ~ 2
Page 3
Breaking the Title Apart - 1
Big Data
•MapReduce, Distributed File Systems
High-Performance Computing
•Hardware acceleration
Sentiment Analysis
•Dictionary-based
•Machine Learning
•Microblogging Services
8 Oct 2013 3 ~ B. Varghese ~
Page 4
Breaking the Title Apart - 2
• Sentiment Analysis using
Microblogging services o Who and Why?
• Widespread participation
o Occupy Wall Street, Arab
Spring
• Gathering public opinion as
an event unfolds
o Human sensors
o Characteristics of Problems
• Rapid data ingestion
• Rapid data management
• Rapid data processing
• Rapid data visualisation
8 Oct 2013 4 ~ B. Varghese ~
Page 5
Introduction - 1 • Public Sentiment Analysis using Twitter
o Approaches
• Dictionary Approach (most popular)
o Comparing tweets against lexicons from dictionaries
o Classifying individual words in tweets
• Machine Learning Approaches
o Approaches to classify tweets
o Classifying tweets based on a training data set
o Not readily available for aggregating public sentiment
• Examples o Prediction of elections, stock market
o Natural disaster notification and management
8 Oct 2013 5 ~ B. Varghese ~
Page 6
Introduction - 2
• Challenges in Public Sentiment Analysis o Processing large data can be slow and not possible in real-time
o Mechanisms to obtain timely results
o Data processing at a fine-grain level
o Accuracy of prediction or what analytics produce
o Visualisation of data that is meaningful
8 Oct 2013 6 ~ B. Varghese ~
Page 7
Introduction - 3 • Objectives
o Development of a framework for analysing and visualising public
sentiment from a Twitter corpus
• Exploit parallelism
• Big Data techniques
• Efficiently manage data
o Implementation and comparison of two approaches within the
framework for analysing public sentiment
• Extend Machine Learning approaches for public sentiment analysis
• Compare against a test case
o Investigation of visualisation techniques for public sentiment at multiple
geographic levels
• Graphically present results in a timely manner
8 Oct 2013 7 ~ B. Varghese ~
Page 8
Framework - 1
• Collection o Using Twitter Streaming API
o Stored to an SQL database
• Parsing o Trimming down the Twitter
corpus
8 Oct 2013 ~ B. Varghese ~ 8
Page 9
Framework - 2 • Analysing tweets
o Dictionary Approach
8 Oct 2013 ~ B. Varghese ~ 9
Page 10
Framework - 3 • Analysing tweets (contd.)
o Machine Learning Approach
8 Oct 2013 ~ B. Varghese ~ 10
Page 11
Framework - 4 • Estimation
o Dictionary based approach
o Machine Learning approach
g=1(country) and g=2 (county), t is the time frame
8 Oct 2013 ~ B. Varghese ~ 11
Page 12
Framework - 5 • Estimation (contd.)
o Dictionary based approach
8 Oct 2013 ~ B. Varghese ~ 12
Page 13
Framework - 6 • Estimation (contd.)
o Machine Learning approach
8 Oct 2013 ~ B. Varghese ~ 13
Page 14
Framework - 7 • Visualisation (3 techniques):
o Choropleth visualisation
• Thematic Mapping Engine (TME)
to generate .kml files
• Multiple layers can be overlaid on
geographical data
• .kml files are visualised on Google
Earth
o Tile graph visualisation
• Google Chart API
• Geographic region vs static data
(population, no. of tweets) /
public sentiment
o Line graph visualisation
• Independent of a geo-browser
• Time vs public sentiment
8 Oct 2013 ~ B. Varghese ~ 14
Page 15
Case Study - 1 • Birth of Prince George of Cambridge, 22 July 2013
o 487 million users accessed tweets related to the event
o Twitter corpus
• Collected using Twitter Streaming API
• Collected from Sunday, July 21 2013, 00:00:01 BST until Tuesday, 23
July, 2013, 23:59:59 BST
• One million tweets, over 150,000 Twitter users
• Location bounding box - NE 60.854691, 1.768960 and SW 49.162090, -
13.413930
o Geographic data
• Shapefiles (.shp) from Global Administrative Areas (GADM)
8 Oct 2013 ~ B. Varghese ~ 15
Page 16
Case Study – 2 • Geobrowser visualisation – 22 July, 2013
8 Oct 2013 ~ B. Varghese ~ 16
Page 17
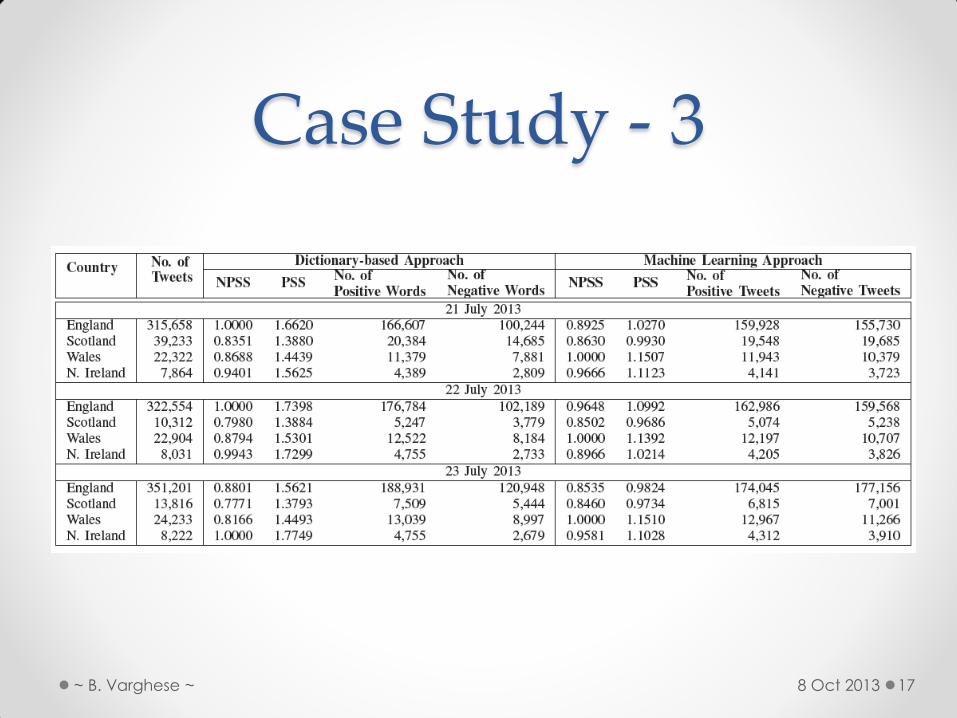
Case Study - 3
8 Oct 2013 ~ B. Varghese ~ 17
Page 18
Case Study - 4 • Tile map visualisation
8 Oct 2013 ~ B. Varghese ~ 18
Page 19
Case Study – 5 • Line graph visualisation
8 Oct 2013 ~ B. Varghese ~ 19
Page 20
Case Study - 6 • Line graph visualisation (contd.)
8 Oct 2013 ~ B. Varghese ~ 20
Page 21
Case Study - 7 • Correlation ratios
• For large volume of tweets there is good correlation
between both approaches
• Machine Learning method slow
• SQL querying will be very slow for volumes any
larger than what was employed
8 Oct 2013 ~ B. Varghese ~ 21
Page 22
Conclusion - 1
Public dissemination: http://www.blessonv.com/research/publicsentiment
8 Oct 2013 ~ B. Varghese ~ 22
Page 23
Conclusion - 2 • Implemented a framework for public sentiment
analysis o Not in real-time; approaches are slow
o Big Data techniques, exploit parallel methods and hardware accelerators
• Approaches consider positive and negative
sentiment o Analyse / predict social disorders
Thank you for your attention
8 Oct 2013 ~ B. Varghese ~ 23