+ All Categories
Home > Documents > The SAR Activity Review By the Numbers - FinCEN.gov · 3 Introduction Welcome to the eighteenth...

The SAR Activity Review By the Numbers - FinCEN.gov · 3 Introduction Welcome to the eighteenth...

Date post: 17-Mar-2019
Category:
Upload: trinhdieu
View: 213 times
Download: 0 times
Share this document with a friend
12
1 The SAR Activity Review – By the Numbers Issue 18 Table of Contents Introduction Section 1: Suspicious Activity Report by Depository Institutions (Form TD F 90-22.47), from January 1, 2003 through December 31, 2012 Exhibit 1: Filings by Year & Month Exhibit 2: Filings by States & Territories Exhibit 3: Number of Filings Ranked by States & Territories in Descending Order Exhibit 4: Number of Filings by Characterization of Suspicious Activity in Descending Order Exhibit 5: Number of Filings by Characterization of Suspicious Activity Exhibit 6: Filings by Primary Federal Regulator Exhibit 7: Relationship to Financial Institution Exhibit 8: Characterization of Suspicious Activity by State & Territory by Year Section 2: Suspicious Activity Report by Money Services Business (FinCEN Form 109 1 ), from January 1, 2003 through December 31, 2012 Exhibit 1: Filings by Year & Month Exhibit 2: Filings by States & Territories Exhibit 3: Number of Filings Ranked by States & Territories in Descending Order Exhibit 4: Number of Filings by Character of Suspicious Activity in Descending Order Exhibit 5: Number of Filings by Character of Suspicious Activity Exhibit 6: Filings by Financial Services Involved Exhibit 7: Character of Suspicious Activity by State & Territory by Year 1 Formerly Form TD F 90-22.56.
Transcript

1

The SAR Activity Review – By the Numbers Issue 18

Table of Contents

Introduction

Section 1: Suspicious Activity Report by Depository Institutions

(Form TD F 90-22.47), from January 1, 2003 through

December 31, 2012

Exhibit 1: Filings by Year & Month

Exhibit 2: Filings by States & Territories

Exhibit 3: Number of Filings Ranked by States &

Territories in Descending Order

Exhibit 4: Number of Filings by Characterization of

Suspicious Activity in Descending Order

Exhibit 5: Number of Filings by Characterization of

Suspicious Activity

Exhibit 6: Filings by Primary Federal Regulator

Exhibit 7: Relationship to Financial Institution

Exhibit 8: Characterization of Suspicious Activity by State &

Territory by Year

Section 2: Suspicious Activity Report by Money Services Business

(FinCEN Form 1091), from January 1, 2003 through

December 31, 2012

Exhibit 1: Filings by Year & Month

Exhibit 2: Filings by States & Territories

Exhibit 3: Number of Filings Ranked by States &

Territories in Descending Order

Exhibit 4: Number of Filings by Character of Suspicious

Activity in Descending Order

Exhibit 5: Number of Filings by Character of Suspicious

Activity

Exhibit 6: Filings by Financial Services Involved

Exhibit 7: Character of Suspicious Activity by State &

Territory by Year

1 Formerly Form TD F 90-22.56.

2

Section 3: Suspicious Activity Report by Casinos and Card Clubs

(FinCEN Form 102), from January 1, 2003 through

December 31, 2012

Exhibit 1: Filings by Year & Month

Exhibit 2: Filings by States & Territories

Exhibit 3: Number of Filings Ranked by States &

Territories in Descending Order

Exhibit 4: Number of Filings by Type of Suspicious

Activity in Descending Order

Exhibit 5: Number of Filings by Type of Suspicious

Activity

Exhibit 6: Filings by Type of Gaming Institution

Exhibit 7: Filings by Relationship to Financial Institution

Exhibit 8: Type of Suspicious Activity by State &

Territory by Year

Section 4: Suspicious Activity Report by the Securities & Futures

Industries (FinCEN Form 101),2 from January 1, 2003

through December 31, 2012

Exhibit 1: Filings by Year & Month

Exhibit 2: Filings by States & Territories

Exhibit 3: Number of Filings Ranked by State &

Territories in Descending Order

Exhibit 4: Number of Filings by Type of Suspicious

Activity in Descending Order

Exhibit 5: Number of Filings by Type of Suspicious

Activity

Exhibit 6: Filings by Instrument Type

Exhibit 7: Filings by Type of Reporting Institution

Exhibit 8: Type of Suspicious Activity by State &

Territory by Year

2 Includes suspicious activity reported by a certain segment of the insurance industry (those insurance

companies offering covered products), since May 2, 2006.

3

Introduction

Welcome to the eighteenth issue of The SAR Activity Review – By the Numbers (BTN). BTN

is published once a year and incorporates numerical data covering a decade of Suspicious

Activity Report (SAR) filings through the most recent twelve-month period, for each of the

filing industries for which a form has been developed.3 By the Numbers serves as a

companion piece to The SAR Activity Review – Trends, Tips & Issues, which provides

information about the preparation, use, and utility of SARs.

This issue represents the last full calendar year of data as obtained from the formerly-

mandatory four SAR types (known as “legacy” reports): TD F 90-22.47 (Depository

Institutions), FinCEN Form 109 (Money Services Business), FinCEN Form 102 (Casinos &

Card Clubs), and FinCEN Form 101 (Securities & Futures Industries). In addition to

numbers up through December 31, 2012, readers may also review various visual

representations of data pertinent to States & Territories (as available) encompassing pie

charts, bar diagrams, and line graphs.

As introduced in the last edition of BTN, this edition will include detailed data tables with

geographic summaries at the county level to enhance State graphical displays (traditionally

referred to as “heat maps”). Similarly, FinCEN is providing Metropolitan Statistical Area

(MSA) summary tables of SAR data as well as spreadsheets illustrating filing rates and

percentage changes for CY2011 & CY2012 Characterizations of Suspicious Activities by

State & Territories. Such information (as applicable) may be accessed through highlighted

hyperlinks within Exhibit 2 in each section provided.

A review of the numerical data generated for Issue 18 shows that the total volume of all

SARs within the Bank Secrecy Act (BSA) database experienced an increase of 4% in 2012 as

compared to the previous year. Legacy SARs experienced a decrease of 2% in 2012, while

submissions of the new Universal SAR (FinCEN Form 111) introduced in March 2012

represented 6% of total SAR filings in 2012. The decrease in legacy SAR filings is to be

expected as a result of some filers submitting the Universal rather than legacy form(s). 4

In 2012, the number of legacy depository institution SARs grew approximately 8%, while

legacy non-depository institution SARs saw a marked decrease of 13% for the corresponding

twelve month period. Graph 1 depicts the comparisons of depository institution SARs and

non-depository institution SARs over the last five years, as well as the new Universal SAR

filings in 2012.

3 For the entire CY2012 period, insurance company filings may still be included in the analysis of SAR-SFs. As a

result, filing data for certain segments of the insurance industry are included in Section 4. 4 FinCEN made available the new Universal SAR in March 2012, and mandated the use of the new SAR as of April

2013. As one-to-one correlations cannot be made between the legacy forms and the Universal SAR for most

exhibits, this edition of BTN contains detailed analysis of the legacy reports. FinCEN plans to provide more

detailed analysis of Universal SAR filings in a forthcoming future edition of BTN.

ATTENTION: As viewers may have different operating systems, in order to access and

view graphical data in its entirety, you must open the PowerPoint in SLIDE SHOW mode.

4

Graph 1

Suspicious Activity Report Filings by Depository Institutions andNon-Depository Institutions*

For the Period January 1, 2008 through December 31, 2012

* Non-depository institutions consist of money services businesses; securities and futures industries; and casino and card clubs.

732,563 720,309697,367

798,688

860,858

558,027 560,996

629,239

722,539

628,464

93,557

0

100,000

200,000

300,000

400,000

500,000

600,000

700,000

800,000

900,000

2008 2009 2010 2011 2012

Suspicious Activity Reports Filed bt Depository Institutions Suspicious Activity Reports Filed by Non-Depository Institutions Universal Suspicious Activity Report

In 2012, non-depository institutions filed approximately 42% of all SARs, down 5% from the

previous year.

The following information incorporates both detailed numbers relative to reporting rates for

specific SAR fixed fields as well as general observations of data for each type of form.

Number of Suspicious Activity Report Filings by Year

Form 2003 2004 2005 2006 2007 2008 2009 2010 2011 2012

Depository Institution 288,343 381,671 522,655 567,080 649,176 732,563 720,309 697,367 798,688 860,858

Money Services Business 209,512 296,284 383,567 496,400 578,439 531,761 530,518 596,494 685,009 585,874

Casinos and Card Clubs 5,095 5,754 6,072 7,285 9,943 11,162 12,093 13,987 17,627 21,282

Securities & Futures Industries 4,267 5,705 6,936 8,129 12,881 15,104 18,385 18,758 19,903 21,308

Universal SAR

N/A

N/A

N/A

N/A

N/A

N/A

N/A

N/A

N/A 93,557

Subtotal 507,217 689,414 919,230 1,078,894 1,250,439 1,290,590 1,281,305 1,326,606 1,521,227 1,582,879

Total 11,447,801

5

Suspicious Activity Report by Depository Institution / TD F 90-22.47 (from January

1, 2003 through December 31, 2012)

This calendar year the number of depository institution SARs identifying

Mortgage Loan actually decreased by 29%. Until 2012, Mortgage Loan Fraud

was the only summary characterization that had experienced an increase every

year since 1996, with the past three years accounting for nearly 46% of all noted

instances of this specific activity for the last decade.5

Twelve of the twenty-one reportable suspicious activity categories saw growth in

CY2012. Increases ranged from a high of 163% to less than one percent. Of

these, the following characterizations saw the largest fluctuation: Identity Theft

(+163%),6 Other (+63%),7 Computer Intrusion (+63%), Wire Transfer Fraud

(+34%), and Counterfeit Credit/Debit Card (+27%).

In addition to Mortgage Loan Fraud, Counterfeit Instrument (Other) experienced

a noticeable decrease in CY2012 (down 21%), as did Bribery/Gratuity, falling

34%, from 301 instances in 2011 to 198 for the same period the year prior.

Though having seen increases every year since 2003, the number of 2012 SARs

indicating National Credit Union Administration (NCUA) as the Primary

Federal Regulator showed a slight decline of 3% from the previous twelve

months.

Fraud-related activities (Check Fraud, Commercial Loan Fraud, Consumer Loan

Fraud, Credit Card Fraud, Debit Card Fraud, Mortgage Loan Fraud, and Wire

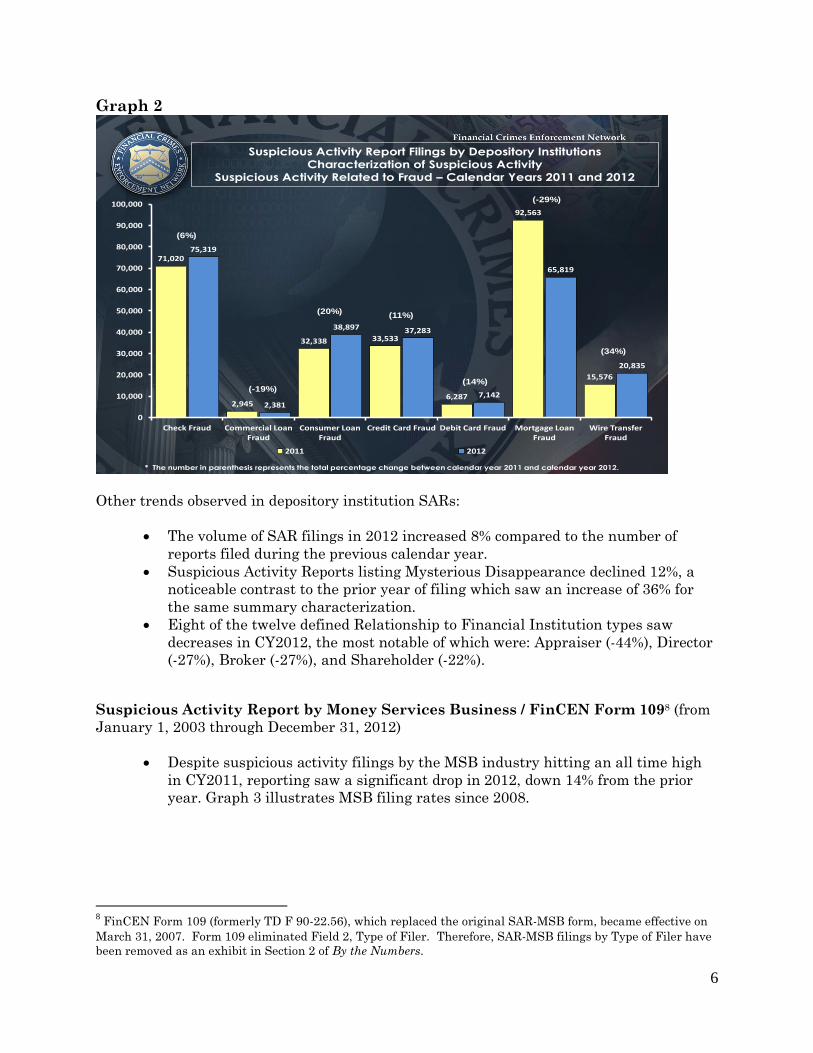
Transfer Fraud) accounted for 23% of all suspicious activities reported by

depository institutions in 2012. This represents a modest decrease in the number

of instances reported (in whole or part) for fraud-related activities, as a group, for

the same period in 2011. However, only two of the seven fraud types saw a

decline in reported activity for 2012, and each of these experiencing double-digit

decreases: Mortgage Loan Fraud (-29%) and Commercial Loan Fraud (-19%).

Graph 2 illustrates comparisons of each fraud-related activity reported in

depository institution Suspicious Activity Reports filed in calendar years 2011

and 2012.

5 For additional information gleaned from analysis of SARs involving suspected mortgage loan fraud (MLF), see

FinCEN’s 8 analytic MLF SAR assessments found at http://www.fincen.gov/news_room/rp/mortgagefraud.html. 6 The increase in this characterization is predominately attributable to back filings.

7 The increase in this characterization is predominately attributable to back filings.

6

Graph 2

71,020

2,945

32,338 33,533

6,287

92,563

15,576

75,319

2,381

38,897 37,283

7,142

65,819

20,835

0

10,000

20,000

30,000

40,000

50,000

60,000

70,000

80,000

90,000

100,000

Check Fraud Commercial Loan Fraud

Consumer Loan Fraud

Credit Card Fraud Debit Card Fraud Mortgage Loan Fraud

Wire Transfer Fraud

2011 2012

Suspicious Activity Report Filings by Depository InstitutionsCharacterization of Suspicious Activity

Suspicious Activity Related to Fraud – Calendar Years 2011 and 2012

* The number in parenthesis represents the total percentage change between calendar year 2011 and calendar year 2012.

(6%)

(-19%)

(11%)(20%)

(14%)

(-29%)

(34%)

Other trends observed in depository institution SARs:

The volume of SAR filings in 2012 increased 8% compared to the number of

reports filed during the previous calendar year.

Suspicious Activity Reports listing Mysterious Disappearance declined 12%, a

noticeable contrast to the prior year of filing which saw an increase of 36% for

the same summary characterization.

Eight of the twelve defined Relationship to Financial Institution types saw

decreases in CY2012, the most notable of which were: Appraiser (-44%), Director

(-27%), Broker (-27%), and Shareholder (-22%).

Suspicious Activity Report by Money Services Business / FinCEN Form 1098 (from

January 1, 2003 through December 31, 2012)

Despite suspicious activity filings by the MSB industry hitting an all time high

in CY2011, reporting saw a significant drop in 2012, down 14% from the prior

year. Graph 3 illustrates MSB filing rates since 2008.

8 FinCEN Form 109 (formerly TD F 90-22.56), which replaced the original SAR-MSB form, became effective on

March 31, 2007. Form 109 eliminated Field 2, Type of Filer. Therefore, SAR-MSB filings by Type of Filer have

been removed as an exhibit in Section 2 of By the Numbers.

7

Graph 3

531,761 530,518

596,494

685,009

585,874

-8%

0%

12%15%

-14% -20%

0%

20%

40%

60%

80%

100%

0

100,000

200,000

300,000

400,000

500,000

600,000

700,000

800,000

2008 2009 2010 2011 2012

Total Filings Percentage Change of Filing Rate Differential

Suspicious Activity Report by Money Services Business FilingsIn Calendar Years 2008 through 2012

Though seeing declines in 2012, MSB filers continued to report money transfers

and money orders, with both methods accounting for 93% of types of financial

services related to suspicious activity since 2003. Graph 4 illustrates the filing

rates for both categories in relation to the overall number of MSB SARs for the

last five years.

8

Graph 4

Suspicious Activity Report Filings by Money Services BusinessFilings by Financial Services Involved – Money Transfer and Money Order

For the Period January 1, 2008 through December 31, 2012

531,761 530,518

596,494

685,009

585,874

32%29%

25%27%

31%

59%

65%

71%67%

65%

0%

10%

20%

30%

40%

50%

60%

70%

80%

90%

100%

0

100,000

200,000

300,000

400,000

500,000

600,000

700,000

800,000

2008 2009 2010 2011 2012

Filings Money Order (% of total MSB SARs) Money Transfer (% of total MSB SARs)

In 2012, Currency Exchange experienced the most notable rise among the

Financial Services Involved, jumping 175% from the reported number of

instances the year before.

All of the types of suspicious activity reported a decline during the 2012 calendar

year, with all but two reporting double-digit decreases. Those that sustained the

greatest drop offs during this filing period included: “Offers a bribe in the form of

a tip/gratuity,” down 59% (going from 299 reported instances in 2011 to 122 the

year following); “Exchanges small bills for large bills or vice versa,” down 52%

(listed 156 times in 2012 and 324 the year previous); and “Two or more

individuals using similar/same identification,” diminishing 34% for the same

period twelve months prior.

Marked decreases were also seen for “Alters transaction to avoid completing

funds transfer record or money order or travelers check record ($3,000 or more)”

and “Alters transaction to avoid filing CTR form (more than $10,000),” falling

27% and 25%, respectively.

Suspicious Activity Report by Casinos and Card Clubs / FinCEN Form 102 and,

previously, TD F 90-22.49 (from January 1, 2003 through December 31, 2012)

CY2012 represents the first time since 2002 in which SARs reporting Tribal

Licensed Casino as the Type of Gaming Institution experienced a decrease,

dropping 16% as compared to the number of reports filed during the previous

calendar year.

For the seventh consecutive year, listings of State Licensed Casino as the Type of

Gaming Institution continue to rise, increasing 5% from the prior year.

9

Similarly, the number of filings listing Card Clubs as the Type of Gaming

Institution saw sustained growth, rising a notable 22% from 858 in 2011 to 1,050

in 2012.

Since January 2003, casinos and card clubs have filed 110,300 SARs – the last

two years of which accounted for 35% of these reports. This year saw an increase

of 21% over those filed in 2011. Graph 5 depicts Suspicious Activity Report

filings since 2008.

Graph 5

Suspicious Activity Report by Casinos and Card Clubs FilingsIn Calendar Years 2008 through 2012

11,16212,093

13,987

17,627

21,282

12%

8%

16%

26%

21%

0%

5%

10%

15%

20%

25%

30%

35%

40%

45%

50%

0

5,000

10,000

15,000

20,000

25,000

2008 2009 2010 2011 2012

Total Filings Percentage Change of Filing Rate Differential

Eleven of the seventeen defined types of suspicious activity saw increases in

2012, with the following showing the most prominent upward trend: Unusual

Use of Negotiable Instruments (Checks) (+76%), Other (+32%), and No Apparent

Business or Lawful Purpose (+22%).

Equally, but within a lesser sphere of reports concerned, Unusual Use of Wire

Transfers (+173%) and Embezzlement/Theft (+44%) also saw sizeable increases,

going from 309 listed instances in 2011 to 844 in 2012, for the former activity,

and from 71 in 2011 to 102 in 2012, for the latter.

Numerically, Structuring continues to be the most cited activity by casinos and

card clubs – accounting for more than 34% of reported activities overall.

Of the relationship types listed, Customer has been increasing every year since

2003, up approximately 16% from the previous twelve months and accounting for

92% of Affiliation(s) or Relationship(s) to Casino/Card Club for CY2012.

10

Suspicious Activity Report by the Securities and Futures Industries / FinCEN

Form 101 (from the mandated reporting date in January 1, 2003 through December 31,

2012)9

The top three types of suspicious activity reported in securities and futures

industries SARs since 2003 are shown in Graph 6. Reports characterizing Other

have grown every year since 2003, with noteworthy increases in 2004 and 2007.

In 2012, this activity saw a rise of 28% when compared to the previous twelve-

months. For the same period, Wire Fraud increased by 63%, while SARs

indicating Money Laundering/Structuring fell 9%.

Graph 6

Suspicious Activity Reports by the Securities and Futures IndustriesTop Three Reported Types of Suspicious Activity

For the Period January 1, 2003 through December 31, 2012

0

2,000

4,000

6,000

8,000

10,000

12,000

2003 2004 2005 2006 2007 2008 2009 2010 2011 2012

Other Money Laundering/Structuring Wire Fraud

Of the listed 20 Types of Suspicious Activity, more than half saw an increase. Of

these, Computer Intrusion experienced the biggest rise (up 94%) in 2012 as

compared to the year prior, going from 317 reported instances in 2011 to 614 in

2012.

Equally, the activities of Identity Theft (+57%) and Embezzlement/Theft (+40%)

also experienced double-digit growth in CY2012 when compared to the preceding

filing period.

Of those activity types showing a decrease, Securities Fraud and Market

Manipulation sustained the greatest drop in the number of reported instances,

falling 823 and 470, respectively.

9 Includes suspicious activity reported by a certain segment of the insurance industry (those insurance

companies offering covered products), since May 2, 2006.

11

The number of suspicious activity reports has increased every year since

reporting began in 2003, with double-digit growth occurring every year up

through 2009. Conversely, filing rate differentials have become noticeably

stagnant over the past three years. Graph 7 illustrates FinCEN Form 101 filing

rates since 2008.

Graph 7

Suspicious Activity Report Filings by the Securities and Futures IndustriesIn Calendar Years 2008 through 2012

15,104

18,385 18,758

19,955

21,308

17%

22%

2%

6% 7%

0%

5%

10%

15%

20%

25%

30%

35%

40%

0

5,000

10,000

15,000

20,000

25,000

2008 2009 2010 2011 2012

Total Filings Percentage Change of Filing Rate Differential

Only three of the 17 categories of Instrument Type showed an increase in 2012:

Stocks (up 24%), Cash or Equivalent (up 9%), and Other Non-Securities (going

from 111 reported instances in 2011 to 116 this year).

Instrument Types that experienced a notable decrease in CY2012 included

Foreign Currency Futures (falling 98%), down from 363 reported instances in

2011 to 7 in 2012, Foreign Currencies (down 75%), Warrants (down 58%), and

Commodity Futures Contract (down 57%).

Numerically, Cash or Equivalent (in whole or part) continues to be the most cited

instrument type by the securities and futures industry – accounting for more

than 42% of all reported instrument types in 2012.

Several types of reporting institutions saw either an increase or decrease in the

number of instances reported in 2012. Among the most notable rises and falls

were: National Futures Association, experiencing a rise of over 700% (with 700

noted instances in 2012 and up from 87 the year before), and Futures

Commission Merchant, which saw an increase of 94% with 982 instances in 2012

(up from 505 the previous twelve months). Conversely, Agriculture Trade Option

Merchant (down over 95%), went from 112 references in 2011 to just 5 a year

later.

12

As always, we welcome your suggestions and comments. Questions regarding present,

past, or future issues of By the Numbers may be directed to FinCEN’s Regulatory Policy

and Programs Division, Office of Regulatory Analysis at (703) 905-3968 or by contacting

[email protected].


Recommended