32
The science of climate change questions and answers february 2015

The science of climate changequestions and answers
february 2015
2 | The science of climate change
page conTenTs
3 Foreword 4 Summary 6 Q1: What is climate change? 8 Q2: How has climate changed? 12 Q3: Are human activities causing climate change? 16 Q4: How do we expect climate to evolve in the future? 20 Q5: How are extreme events changing? 22 Q6: How are sea levels changing? 24 Q7: What are the impacts of climate change? 28 Q8: What are the uncertainties and their implications? 30 Q9: What does science say about options to address climate change?
For a version with full references visit www.science.org.au/climatechange
Published by the Australian Academy of Science ISBN 978 0 85847 413 0
Please cite “The science of climate change: Questions and answers”, Australian Academy of Science, Canberra, 2015 www.science.org.au/climatechange
Cover: Wollongong Harbour, NSW. Photo: Robert Montgomery

The science of climate change | 3
Foreword
The purpose of this booklet is to provide an understanding, based on our present scientific knowledge, of some key questions about climate change.
It is an extensively revised update of a similarly titled Academy publication in 2010 that summarised the state of knowledge at that time. It has been prepared by a broadly-based Working Group of Australian climate scientists with review and guidance provided by an Oversight Committee composed of Academy Fellows and the former Chair of the Academy’s National Committee for Earth System Science.
Along with its sister Academies, the Australian Academy of Science has played an active role in assessing the science of climate change since the 1970s. The Academy recognises the role of the Intergovernmental Panel on Climate Change (IPCC) as the mechanism for the international scientific assessment of climate change science, impacts and response strategies. However, it believes that it is important that Australian climate scientists explain the science, including its uncertainties and implications, to the Australian community in simpler terms than can be found in most of the IPCC reports.
The Working Group who prepared this update was led by Professor Michael Raupach FAA FTSE and Dr Ian Allison AO with special support, in the later stages, from Professor Steven Sherwood. The views presented in the answers to the nine key questions were carefully reviewed by an Oversight Committee and 12 independent climate scientists* who agreed to help with the preparation of this document. The role of the Oversight Committee was to make sure that all reasonable review comments were properly considered by the Working Group in preparing their final text. While the reviewers provided more than 600 individual comments on the penultimate draft, neither they nor the Oversight Committee are responsible for the final wording of the detailed answers that represent the views of the expert members of the Working Group.
Nevertheless the summary on pages 4 and 5 represents the fully agreed views of both the Oversight Committee and the Working Group. It has been endorsed by the Academy as a balanced, objective and authoritative summary of the current state of knowledge of the science of climate change.
As in all areas of active science, uncertainties remain. However, enormous scientific progress has been made in our understanding of climate change and its causes and implications. Since 2010, the IPCC has prepared a new international assessment with the active involvement of many Australian researchers, including several members of the Academy Working Group. This Q&A update is thus well informed by recent international developments in the science as well as the most recent work by our own scientists on peculiarly Australian aspects of the climate change problem.
As the summary states, ‘Societies, including Australia, face choices about how to respond to the consequences of future climate change.’ It is incumbent on society to consider these choices.
I wish to thank all the members of the Working Group and Oversight Committee (whose names are listed on the back cover) for their painstaking work in the preparation of this update. I also acknowledge the assistance of the reviewers and others who helped with this update. The Academy is especially grateful to the Department of the Environment, which provided the financial support for the preparation and publication of this document.
On behalf of the Academy, I am pleased to commend the information in the following pages to all those who are looking for authoritative answers to the key questions we are all asking about the science of climate change.
Andrew Holmes AM PresAA FRS FTSE President Australian Academy of Science
*In addition to multi-stage review carried out by the Oversight Committee, the penultimate draft of this document was reviewed by Dr G Ayers FTSE, Dr I G Enting, Professor D Griggs FTSE, Professor D Karoly, Mr WR Kininmonth, Professor M J Manton FTSE, Dr K G McCracken AO FAA FTSE, Professor N Nicholls, Dr N Smith FTSE and three anonymous reviewers.
left: An image from space of the cloud patterns associated with a mid-latitude cyclone off southwest Australia. Photo: NASA
4 | The science of climate change
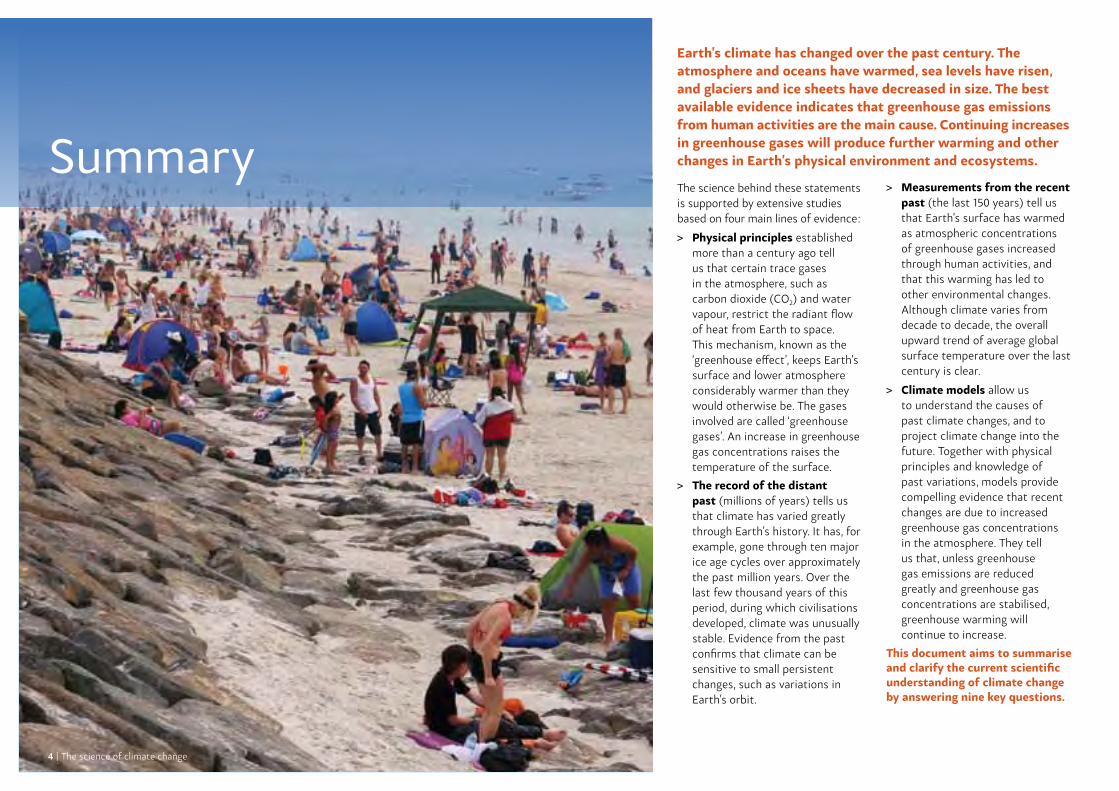
Earth’s climate has changed over the past century. The atmosphere and oceans have warmed, sea levels have risen, and glaciers and ice sheets have decreased in size. The best available evidence indicates that greenhouse gas emissions from human activities are the main cause. Continuing increases in greenhouse gases will produce further warming and other changes in Earth’s physical environment and ecosystems.
The science behind these statements is supported by extensive studies based on four main lines of evidence:
> Physical principles established more than a century ago tell us that certain trace gases in the atmosphere, such as carbon dioxide (CO2) and water vapour, restrict the radiant flow of heat from Earth to space. This mechanism, known as the ‘greenhouse effect’, keeps Earth’s surface and lower atmosphere considerably warmer than they would otherwise be. The gases involved are called ‘greenhouse gases’. An increase in greenhouse gas concentrations raises the temperature of the surface.
> The record of the distant past (millions of years) tells us that climate has varied greatly through Earth’s history. It has, for example, gone through ten major ice age cycles over approximately the past million years. Over the last few thousand years of this period, during which civilisations developed, climate was unusually stable. Evidence from the past confirms that climate can be sensitive to small persistent changes, such as variations in Earth’s orbit.
> Measurements from the recent past (the last 150 years) tell us that Earth’s surface has warmed as atmospheric concentrations of greenhouse gases increased through human activities, and that this warming has led to other environmental changes. Although climate varies from decade to decade, the overall upward trend of average global surface temperature over the last century is clear.
> Climate models allow us to understand the causes of past climate changes, and to project climate change into the future. Together with physical principles and knowledge of past variations, models provide compelling evidence that recent changes are due to increased greenhouse gas concentrations in the atmosphere. They tell us that, unless greenhouse gas emissions are reduced greatly and greenhouse gas concentrations are stabilised, greenhouse warming will continue to increase.
This document aims to summarise and clarify the current scientific understanding of climate change by answering nine key questions.
summary
4 | The science of climate change
1 What is climate change? The term ‘climate’, in its broadest sense, refers to a statistical description of weather and of the related conditions of oceans, land surfaces and ice sheets. This includes consideration of averages, variability and extremes. Climate change is an alteration in the pattern of climate over a long period of time, and may be due to a combination of natural and human-induced causes.
2 How has climate changed?Global climate has varied greatly throughout Earth’s history. In the final decades of the 20th century, the world experienced a rate of warming that is unprecedented for thousands of years, as far as we can tell from the available evidence. Global average temperature rise has been accompanied by ongoing rises in ocean temperatures, ocean heat storage, sea levels and atmospheric water vapour. There has also been shrinkage in the size of ice sheets and most glaciers. The recent slowdown in the rate of surface warming is mainly due to climate variability that has redistributed heat in the ocean, causing warming at depth and cooling of surface waters. Australia’s climate has warmed along with the global average warming.
3 Are human activities causing climate change?Human activities are increasing greenhouse gas concentrations in the atmosphere. This increase is extremely likely to have caused most of the recent observed global warming, with CO2 being the largest contributor. Some observed changes in Australia’s climate, including warming throughout the continent and drying trends in the southwest, have been linked to rising greenhouse gas concentrations.
4 How do we expect climate to evolve in the future?If greenhouse gas emissions continue to grow rapidly, it is expected that, by 2100, the global average air temperature over the Earth’s surface will warm by around 4°C above mid-19th century temperatures. There are many likely ramifications of this warming. However, if emissions are reduced sufficiently rapidly, there is a chance that global average warming will not exceed 2°C and other impacts will be limited.
5 How are extreme events changing?Since the mid-20th century, climate change has resulted in increases in the frequency and intensity of very hot days and decreases in very cold days. These trends will continue with further global warming. Heavy rainfall events have intensified over most land areas and will likely continue to do so, but changes are expected to vary by region.
6 How are sea levels changing?Sea levels have risen during the 20th century. The two major contributing factors are the expansion of sea water as it warms, and the loss of ice from glaciers. Sea levels are very likely to rise more quickly during the 21st century than the 20th century, and will continue to rise for many centuries.
7 What are the impacts of climate change?Climate change has impacts on ecosystems, coastal systems, fire regimes, food and water security, health, infrastructure and human security. Impacts on ecosystems and societies are already occurring around the world, including in Australia. The impacts will vary from one region to another and, in the short term, can be both positive and negative. In the future, the impacts of climate change will intensify and interact with other stresses. If greenhouse gas emissions continue to be high, it is likely that the human-induced component of climate change will exceed the capacity of some countries to adapt.
8 What are the uncertainties and their implications?There is near-unanimous agreement among climate scientists that human-caused global warming is real. However, future climate change and its effects are hard to predict accurately or in detail, especially at regional and local levels. Many factors prevent more accurate predictions, and some uncertainty is likely to remain for considerable time. Uncertainty in climate science is no greater than in other areas where policy decisions are routinely taken to minimise risk. Also, the uncertainty means that the magnitude of future climate change could be either greater or less than present-day best estimates.
9 What does science say about options to address climate change?Societies, including Australia, face choices about how to respond to the consequences of future climate change. Available strategies include reducing emissions, capturing CO2, adaptation and ‘geoengineering’. These strategies, which can be combined to some extent, carry different levels of environmental risk and different societal consequences. The role of climate science is to inform decisions by providing the best possible knowledge of climate outcomes and the consequences of alternative courses of action.
The science of climate change | 5
facing page: People flocked to the beach for respite one evening during Melbourne’s record breaking four-day heatwave in January 2014, under a sky made hazy by smoke from a scrub fire. Photo: Neil O’Connor
6 | The science of climate change
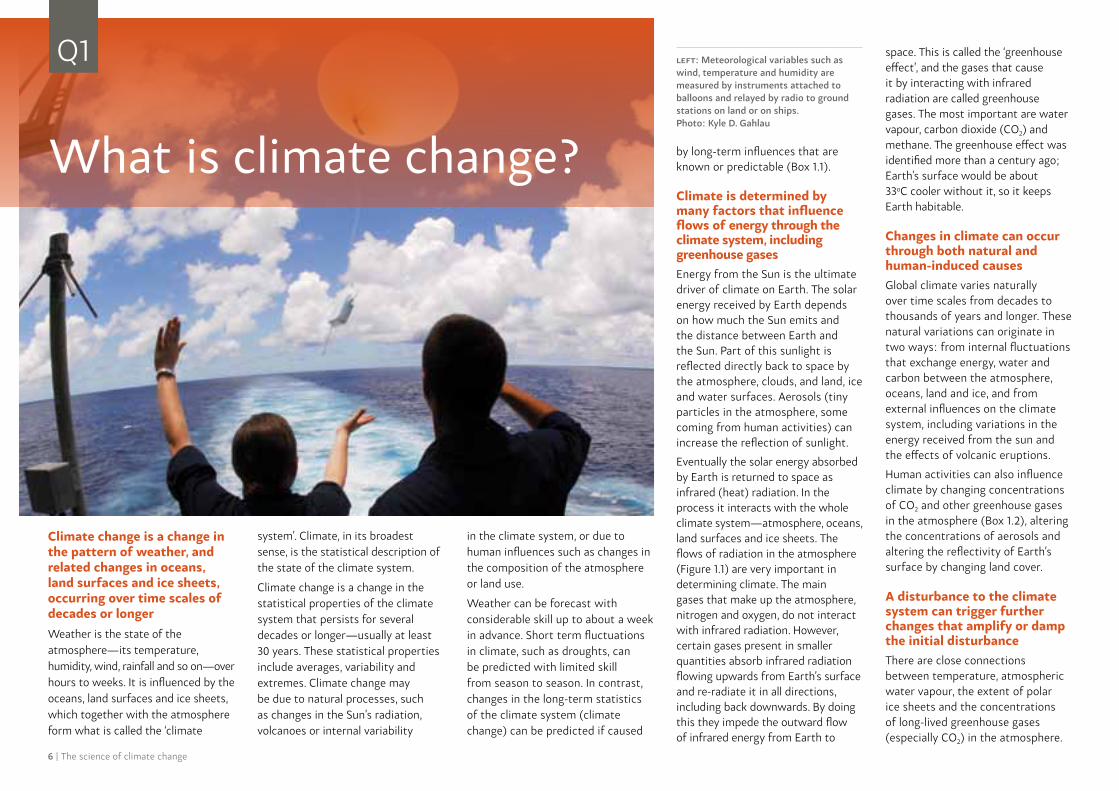
Climate change is a change in the pattern of weather, and related changes in oceans, land surfaces and ice sheets, occurring over time scales of decades or longerWeather is the state of the atmosphere—its temperature, humidity, wind, rainfall and so on—over hours to weeks. It is influenced by the oceans, land surfaces and ice sheets, which together with the atmosphere form what is called the ‘climate
system’. Climate, in its broadest sense, is the statistical description of the state of the climate system.
Climate change is a change in the statistical properties of the climate system that persists for several decades or longer—usually at least 30 years. These statistical properties include averages, variability and extremes. Climate change may be due to natural processes, such as changes in the Sun’s radiation, volcanoes or internal variability
in the climate system, or due to human influences such as changes in the composition of the atmosphere or land use.
Weather can be forecast with considerable skill up to about a week in advance. Short term fluctuations in climate, such as droughts, can be predicted with limited skill from season to season. In contrast, changes in the long-term statistics of the climate system (climate change) can be predicted if caused
by long-term influences that are known or predictable (Box 1.1).
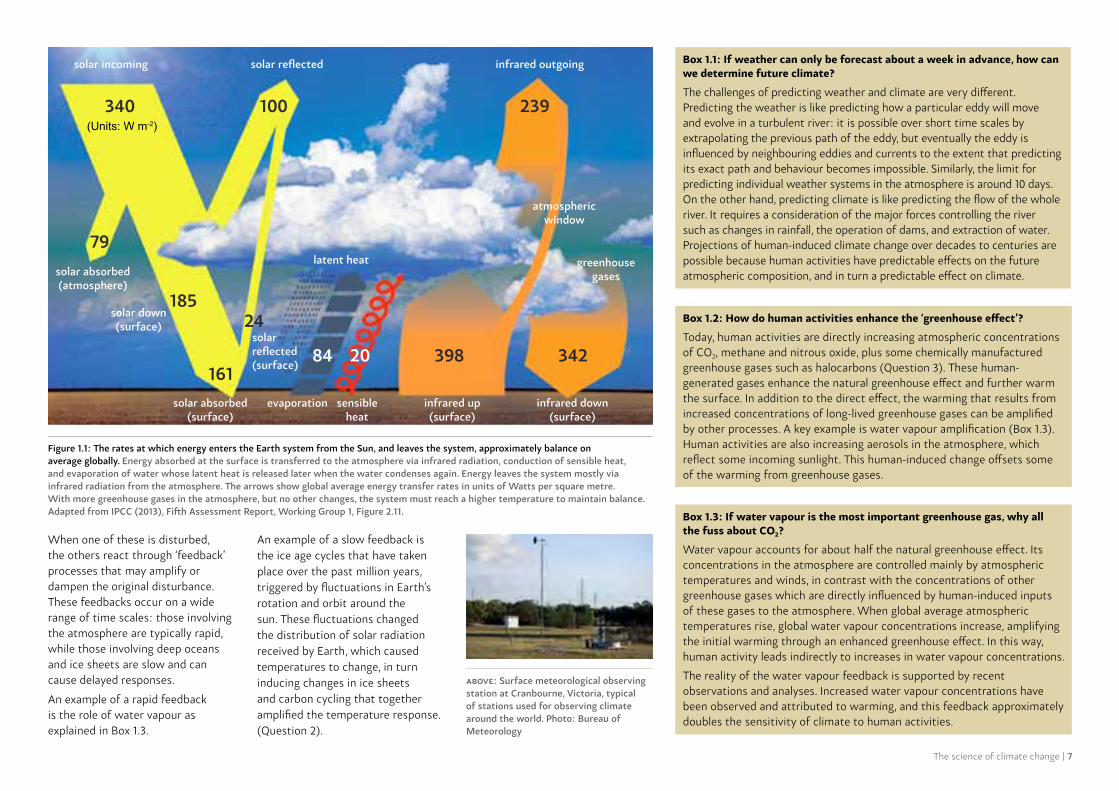
Climate is determined by many factors that influence flows of energy through the climate system, including greenhouse gasesEnergy from the Sun is the ultimate driver of climate on Earth. The solar energy received by Earth depends on how much the Sun emits and the distance between Earth and the Sun. Part of this sunlight is reflected directly back to space by the atmosphere, clouds, and land, ice and water surfaces. Aerosols (tiny particles in the atmosphere, some coming from human activities) can increase the reflection of sunlight.
Eventually the solar energy absorbed by Earth is returned to space as infrared (heat) radiation. In the process it interacts with the whole climate system—atmosphere, oceans, land surfaces and ice sheets. The flows of radiation in the atmosphere (Figure 1.1) are very important in determining climate. The main gases that make up the atmosphere, nitrogen and oxygen, do not interact with infrared radiation. However, certain gases present in smaller quantities absorb infrared radiation flowing upwards from Earth’s surface and re-radiate it in all directions, including back downwards. By doing this they impede the outward flow of infrared energy from Earth to
space. This is called the ‘greenhouse effect’, and the gases that cause it by interacting with infrared radiation are called greenhouse gases. The most important are water vapour, carbon dioxide (CO2) and methane. The greenhouse effect was identified more than a century ago; Earth’s surface would be about 33oC cooler without it, so it keeps Earth habitable.
Changes in climate can occur through both natural and human-induced causesGlobal climate varies naturally over time scales from decades to thousands of years and longer. These natural variations can originate in two ways: from internal fluctuations that exchange energy, water and carbon between the atmosphere, oceans, land and ice, and from external influences on the climate system, including variations in the energy received from the sun and the effects of volcanic eruptions.
Human activities can also influence climate by changing concentrations of CO2 and other greenhouse gases in the atmosphere (Box 1.2), altering the concentrations of aerosols and altering the reflectivity of Earth’s surface by changing land cover.
A disturbance to the climate system can trigger further changes that amplify or damp the initial disturbanceThere are close connections between temperature, atmospheric water vapour, the extent of polar ice sheets and the concentrations of long-lived greenhouse gases (especially CO2) in the atmosphere.
What is climate change?
Q1 left: Meteorological variables such as wind, temperature and humidity are measured by instruments attached to balloons and relayed by radio to ground stations on land or on ships. Photo: Kyle D. Gahlau
The science of climate change | 7
Box 1.2: How do human activities enhance the ‘greenhouse effect’?
Today, human activities are directly increasing atmospheric concentrations of CO2, methane and nitrous oxide, plus some chemically manufactured greenhouse gases such as halocarbons (Question 3). These human-generated gases enhance the natural greenhouse effect and further warm the surface. In addition to the direct effect, the warming that results from increased concentrations of long-lived greenhouse gases can be amplified by other processes. A key example is water vapour amplification (Box 1.3). Human activities are also increasing aerosols in the atmosphere, which reflect some incoming sunlight. This human-induced change offsets some of the warming from greenhouse gases.
Box 1.3: If water vapour is the most important greenhouse gas, why all the fuss about CO2?
Water vapour accounts for about half the natural greenhouse effect. Its concentrations in the atmosphere are controlled mainly by atmospheric temperatures and winds, in contrast with the concentrations of other greenhouse gases which are directly influenced by human-induced inputs of these gases to the atmosphere. When global average atmospheric temperatures rise, global water vapour concentrations increase, amplifying the initial warming through an enhanced greenhouse effect. In this way, human activity leads indirectly to increases in water vapour concentrations.
The reality of the water vapour feedback is supported by recent observations and analyses. Increased water vapour concentrations have been observed and attributed to warming, and this feedback approximately doubles the sensitivity of climate to human activities.
above: Surface meteorological observing station at Cranbourne, Victoria, typical of stations used for observing climate around the world. Photo: Bureau of Meteorology
Box 1.1: If weather can only be forecast about a week in advance, how can we determine future climate?
The challenges of predicting weather and climate are very different. Predicting the weather is like predicting how a particular eddy will move and evolve in a turbulent river: it is possible over short time scales by extrapolating the previous path of the eddy, but eventually the eddy is influenced by neighbouring eddies and currents to the extent that predicting its exact path and behaviour becomes impossible. Similarly, the limit for predicting individual weather systems in the atmosphere is around 10 days. On the other hand, predicting climate is like predicting the flow of the whole river. It requires a consideration of the major forces controlling the river such as changes in rainfall, the operation of dams, and extraction of water. Projections of human-induced climate change over decades to centuries are possible because human activities have predictable effects on the future atmospheric composition, and in turn a predictable effect on climate.
(Units: W m-2)
solar reflected
latent heat
atmosphericwindow
greenhousegases
infrared down(surface)
infrared up(surface)
sensible heat
solar absorbed(surface)
evaporation
solar incoming infrared outgoing
340 100 239
79
18524
16120 398 34284
solar absorbed(atmosphere)
solar down(surface)
solar reflected(surface)
Figure 1.1: The rates at which energy enters the Earth system from the Sun, and leaves the system, approximately balance on average globally. Energy absorbed at the surface is transferred to the atmosphere via infrared radiation, conduction of sensible heat, and evaporation of water whose latent heat is released later when the water condenses again. Energy leaves the system mostly via infrared radiation from the atmosphere. The arrows show global average energy transfer rates in units of Watts per square metre. With more greenhouse gases in the atmosphere, but no other changes, the system must reach a higher temperature to maintain balance. Adapted from IPCC (2013), Fifth Assessment Report, Working Group 1, Figure 2.11.
When one of these is disturbed, the others react through ‘feedback’ processes that may amplify or dampen the original disturbance. These feedbacks occur on a wide range of time scales: those involving the atmosphere are typically rapid, while those involving deep oceans and ice sheets are slow and can cause delayed responses.
An example of a rapid feedback is the role of water vapour as explained in Box 1.3.
An example of a slow feedback is the ice age cycles that have taken place over the past million years, triggered by fluctuations in Earth’s rotation and orbit around the sun. These fluctuations changed the distribution of solar radiation received by Earth, which caused temperatures to change, in turn inducing changes in ice sheets and carbon cycling that together amplified the temperature response. (Question 2).
8 | The science of climate change
Past climate has varied enormously on a variety of time-scalesEarth’s climate has changed dramatically many times since the planet was formed 4.5 billion years ago. These changes have been triggered by the changing configuration of continents and oceans, changes in the Sun’s intensity, variations in the orbit of Earth, and volcanic eruptions.
Natural variations in the concentrations of greenhouse gases
in the atmosphere, the evolution of life and meteorite impacts have also caused climate change in the past. Several million years ago, for example, global average temperature was a few degrees higher than today and warm, tropical waters reached much farther from the equator, resulting in very different patterns of ocean and atmospheric circulation from today.
Over the past million years, Earth’s globally averaged surface temperature has risen and fallen by
about 5˚C in ice-age cycles, roughly every 100,000 years or so (Figure 2.1a). In the coldest period of the last ice age, about 20,000 years ago, sea level was at least 120 metres lower than today because more water was locked up on land in polar ice sheets. The last 8,000 years, which includes most recorded human history, have been relatively stable at the warmer end of this temperature range. This stability enabled agriculture, permanent settlements and population growth.
Most past changes in global temperature occurred slowly, over tens of thousands or millions of years. However, there is also evidence that some abrupt changes occurred, at least at regional scales. For example, during the last ice age, temperatures in the North Atlantic region changed by 5°C or more over as little as a few decades, likely due to sudden collapses of Northern Hemisphere ice sheets or changes in ocean currents.
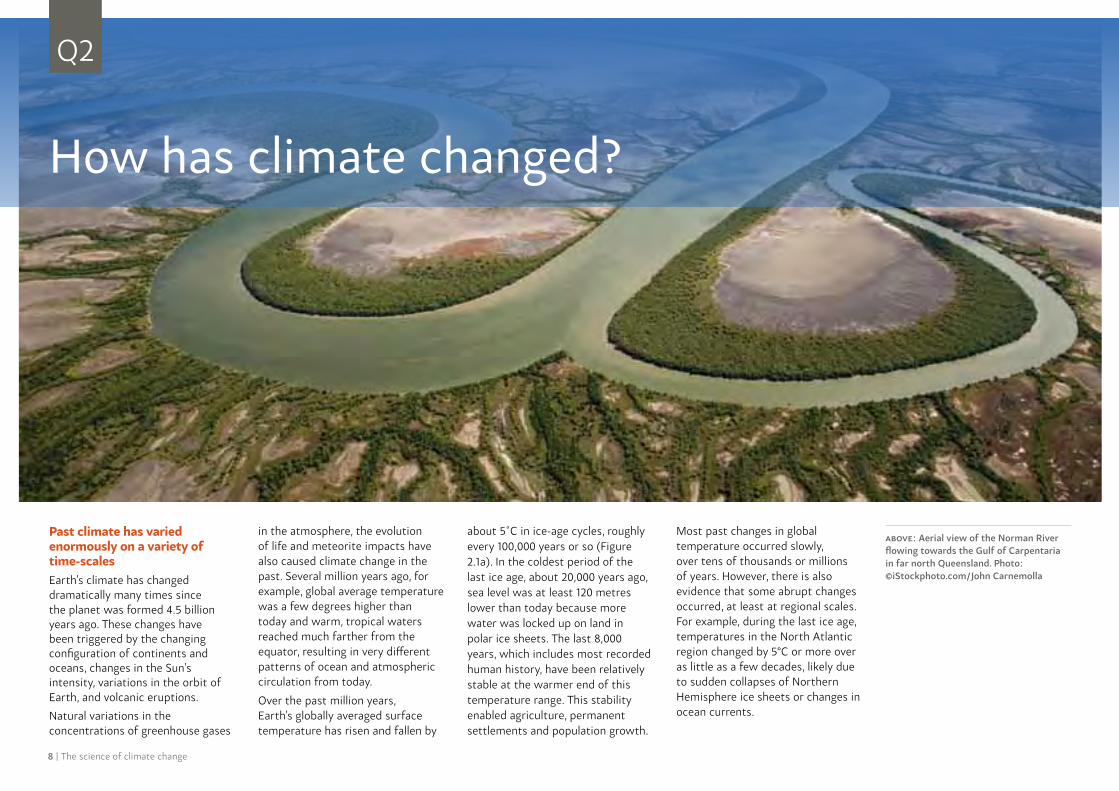
above: Aerial view of the Norman River flowing towards the Gulf of Carpentaria in far north Queensland. Photo: ©iStockphoto.com/John Carnemolla
How has climate changed?
Q2

The science of climate change | 9
Changes over the last 2,000 years
Years AD
-0.6-0.4-0.2
00.20.4
Tem
p. c
hang
e (°
C)
280
320
360
400
CO
2 (pp
m)
0 500 1000 1500 2000
Changes over the last 160 years
Years AD
-0.6-0.4-0.20.00.20.40.6
Tem
p. c
hang
e (°
C)
280
320
360
400
CO
2 (pp
m)
1850 1870 1890 1910 1930 1950 1970 1990 2010
-10
-5
0
5
Tem
p. c
hang
e (°
C)
Changes over the last 800,000 years
(b)
(c)
(a)
Years BC
2013 CO2 concentration (396 ppm)
175
250
325
400
800,000 700,000 600,000 500,000 400,000 300,000 200,000 100,000 0
CO
2 (pp
m)
Figure 2.1: Past changes in temperature align with changes in CO2 at a variety of time scales. These graphs show the changes from long-term average temperature (oC) and average atmospheric CO2 concentration (parts per million) over the last (a) 800,000 years, (b) 2,000 years and (c) 160 years. The temperature changes in (a) are for Antarctica, while for (b) and (c) they are global averages. Source: Compiled from various publicly available data sources (for details, see web version of this document) as summarised in Box 2.1 (see page 10).
Global average temperatures have increased over the past centuryClimate and sea level were relatively stable over thousands of years of recorded human history up to the 19th century, although with some variations (Figure 2.1b). However, globally averaged near-surface air temperature rose by around 0.8°C between 1850 and 2012 (Figure 2.1c). The rate of warming increased in the mid-1970s, and each of the most recent three decades has been warmer than all preceding decades since 1850. The last decade has been the warmest of these. Satellite observations and direct measurements also show warming in the lower atmosphere over the past three decades. In contrast, the atmosphere above about 15 km elevation (the stratosphere) has cooled over this time.
The temperature of the oceans has also risen. More than 90% of the total heat accumulated in the climate system between 1971 and 2010 has been stored in the oceans. The greatest ocean warming has taken place close to the surface, with the upper 75 m of the ocean warming by an average of 0.11oC each decade between 1971 and 2010.
Past records demonstrate that global climate is sensitive to small but persistent influences Ice-age cycles were initiated by small variations in the rotation of Earth and in its orbit around the sun. These changed the seasonal and latitudinal distribution of solar energy reaching Earth’s surface. Measurements from climate archives such as ice cores (Box 2.1) show that changing temperatures triggered changes to other climate factors such as the concentration of carbon dioxide (CO2) in the atmosphere (Figure 2.1a), amplifying the initial disturbances. During warm periods, the major greenhouse gases CO2 and methane were released into the atmosphere, and receding ice sheets reflected less sunlight to space. These observations confirm that the climate system is sensitive to small disturbances that can be amplified by reinforcing feedback processes. Likewise, the climate system today is sensitive to disturbances from human influences.

10 | The science of climate change
Box 2.2: Has climate warming recently stopped?
According to most estimates, the rate of average surface warming has slowed since 2001, despite ongoing rises in greenhouse gases. This slowdown is consistent with known climate variability. Indeed, decades of little or no temperature trend can be seen throughout the last century, superimposed on the long-term warming trend. Two main factors have contributed to the most recent period of slowed surface warming. First, decadal variability in the ocean-atmosphere system has redistributed heat in the ocean, especially in the eastern and central Pacific. This has caused warming at depth and cooling of surface waters and the lower atmosphere in this region. Second, several temporary global cooling influences have come into play including unusually weak solar activity (Box 3.1, see page 15), increased aerosol production, and volcanic activity. None of these influences is likely to continue over the long term. Moreover, despite the slowdown in warming at the surface, there have been continuing increases in heat extremes and in the heat content of the oceans, as well as rising sea levels, shrinking Arctic sea-ice, and ongoing melt of ice sheets and glaciers. Some models predict that, when the current slowdown ends, renewed warming will be rapid.
Box 2.1: How do we detect climate change?
Identifying temperature change that is global in extent requires frequent observations from many locations around the world. Thermometers, rain gauges and other simple instruments have been used to measure climate variables, starting in the mid-19th century. Over time the quality, variety and quantity of observations has improved. Since the 1970s, sophisticated sensors on earth-orbiting satellites have provided near global coverage of many climate variables. By carefully analysing the data gathered using these techniques (with careful account for changes in instrument types, observational practices, instrument locations and urban areas) it has been possible to map the distribution of temperature and other climate changes since the late 19th century.
To study climate changes that occurred before direct measurements were made, scientists use indirect evidence from other sources that record a climate signal. These include climate signals encoded in the composition of ice cores, corals, sediments in oceans and lakes, and tree rings. All these records are laid down sequentially over time as an organism grows or as sediments accumulate. Ice cores from polar ice sheets, which are built from snow laid down over tens to hundreds of thousands of years, provide records of both past CO2 and temperature. As the snow transforms into ice, it traps air in sealed bubbles that provide a sample of past atmospheric composition, while the ratio of stable isotopes of either oxygen or hydrogen in the water molecule is related to the temperature at the time when the snow fell. More recent historical changes can be identified by analysing written and pictorial records, for example of changes in glacier extent.
Changes are evident in many parts of the climate systemChanges consistent with an increase in global temperature have been observed in many other components of the climate system.
> Mountain glaciers have been shrinking and contributing to global sea-level rise since about 1850. Melting accelerated significantly in the 1990s.
> The Greenland and West Antarctic Ice Sheets have both lost ice since 1990, further contributing to sea-level rise as discussed in Question 6. This is from increased discharge of ice into the ocean, and also increased surface melting in Greenland. The rate of loss from Greenland appears to be increasing.
> The area of the Arctic Ocean covered by sea ice has decreased significantly since 1987 throughout
the year and particularly in summer. The thickness of the ice has also decreased by more than 30% over the last 30 years.
> In the Southern Ocean, there are strong regional differences in the changes to areas covered by sea ice, but a small increase in total coverage, driven by shifts in winds and ocean currents in a warming Southern Ocean. Strengthening circumpolar winds around Antarctica have also been linked in part to thinning of the ozone layer.
> The amount of water vapour in the atmosphere has increased since the 1980s, which is consistent with warmer air (Box 1.3, see page 7).
> The surface of the ocean in rainy parts of the world is becoming less salty, which is consistent with freshwater dilution from increased rainfall.
top right: Scientists use ice core samples to reconstruct climatic records over hundreds of thousands of years. Photo: NASA/Lora Koenig
top left: Tree rings provide one source of climate change data over hundreds of years. Photo: LandLearn NSW
above left: Scientists have been using specialised equipment to measure and record weather and climate since 1850. NASA’s Global Precipitation Measurement (GPM) Core Observatory satellite is designed to provide rain and snow observations worldwide. Visualisation: NASA

The science of climate change | 11
Figure 2.4: Recent rainfall in northern Australia has been higher than average during the northern wet season, and in southern Australia it has been drier during the southern wet season. The maps show the relative ranking (in 10% increments) of rainfall from July 1995 to June 2014 compared with the average since 1900 for (left) northern Australian wet season (Oct–Apr) and (right) southern Australian wet season (Apr–Nov). Adapted from BOM/CSIRO State of the Climate 2014, p.6–7.
Trend (ºC over period)-0.6 -0.4 -0.2 0 0.2 0.4 0.6 0.8 1. 1.25 1.5 1.75 2.5
HadCRUT4 1901-2012
MLOST 1901-2012
GISS 1901-2012
Figure 2.3: Temperature has risen over Australia and in the surrounding ocean since the beginning of the 20th century, although there are regional differences. Plot on left shows deviations from the 1961–1990 average of sea surface temperature and temperatures over land in the Australian region; map on right shows distribution of annual average temperature change across Australia since 1910. Adapted from BOM/CSIRO State of the Climate 2014 p.4–5.
Figure 2.2: Surface temperature has increased across most of the world since 1901. This map shows the distribution of the average temperature change between 1901 and 2012. Adapted from IPCC (2013), Fifth Assessment Report, Working Group 1, Figure 2.21.
1.00
0.50
0.0
-0.50
-1.00
1910 1920 1930 1940 1950 1960 1970 1980 1990 20102000Te
mpe
ratu
re a
nom
oly
(°C
) Departures from 1961–1990 climatological average
Sea-surface temperatureSea-surface temperature10-year average
Surface air temperatureSurface air temperature10-year average
> Some ocean currents have changed in response to changes in surface winds, ocean temperature and ocean saltiness. The changes include a southward shift of the Antarctic Circumpolar Current and increasing southward penetration of the East Australian Current.
> An increasing number of plants and animals, on land and in the oceans, are undergoing shifts in their distribution and lifecycles that are consistent with observed temperature changes.
There are regional differences to climate change including within AustraliaOver the past 100 years, temperature has increased over almost the entire globe; the rate of increase has been largest in continental interiors (Figure 2.2). The average surface temperatures over the Australian continent and its surrounding oceans have increased by nearly 1°C since the beginning of the 20th century (Figure 2.3 left). Seven of the ten warmest years on record in Australia have occurred since 2002. However there are differences across Australia with some regions having warmed faster and others showing relatively little warming (Figure 2.3 right).
Since the mid 1990s there have been significant increases in wet season rainfall over northwest Australia (Figure 2.4 left), a declining trend in southwest Australia, and a 15% decline in late autumn and early winter rainfall in the southeast (Figure 2.4 right).
Trend (ºC over period)-0.6 -0.4 -0.2 0 0.2 0.4 0.6 0.8 1. 1.25 1.5 1.75 2.5
HadCRUT4 1901-2012
MLOST 1901-2012
GISS 1901-2012
Trend (oC over period)
-0.6 -0.4 -0.2 0.0 0.2 0.4 0.6 0.8 1.0 1.25 1.5 1.75 2.0

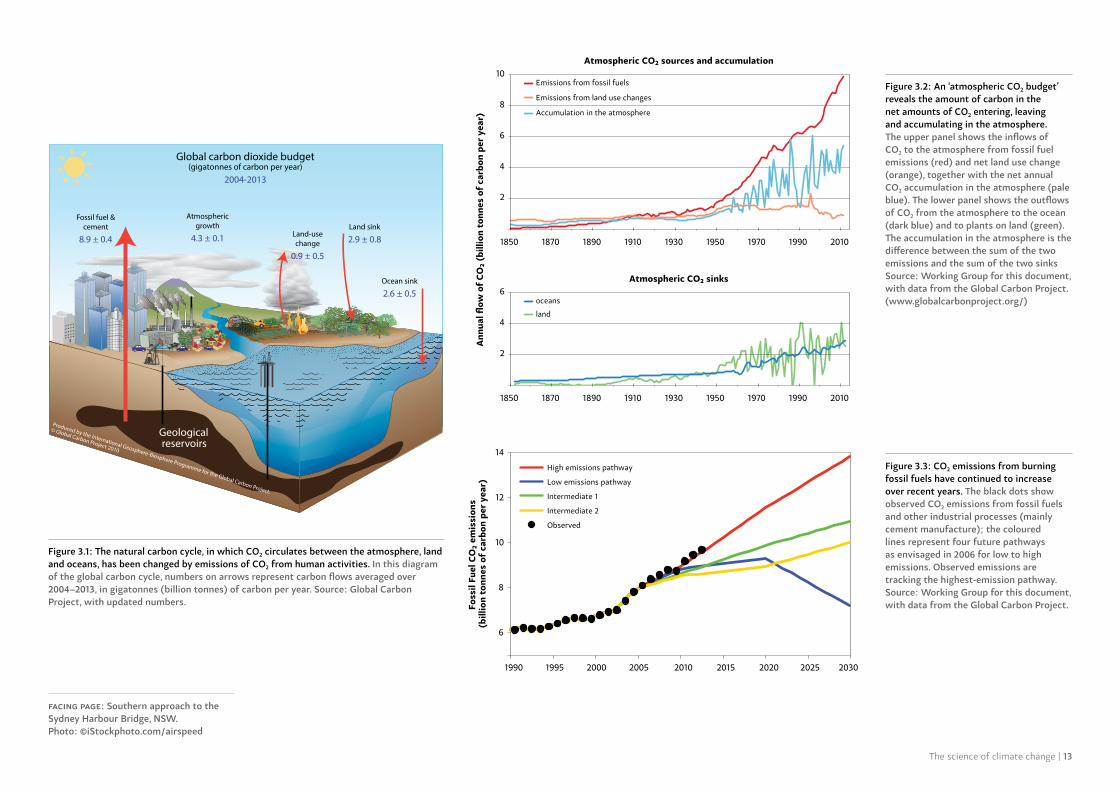
Human activities have increased greenhouse gas concentrations in the atmosphereAtmospheric concentrations of carbon dioxide (CO2), methane and nitrous oxide began to rise around two hundred years ago, after changing little since the end of the last ice age thousands of years earlier. The concentration of CO2 has increased from 280 parts per million (ppm) before 1800, to 396 ppm in 2013. This history of greenhouse gas concentrations has been established by a combination of modern measurements and analysis of ancient air bubbles in polar ice (Box 2.1, see page 10).
Particularly important is CO2. Enormous amounts of it are continually exchanged between the atmosphere, land and oceans, as land and marine plants grow, die and decay, and as carbon-rich waters circulate in the ocean. For several thousand years until around 200 years ago, this ‘carbon cycle’ was approximately in balance and steady. Since the 19th century, human-induced CO2 emissions from fossil fuel combustion, cement manufacture and deforestation have disturbed the balance, adding CO2 to the atmosphere faster than it can be taken up by the land biosphere and the oceans (Figures 3.1 and 3.2). On average over the last 50 years, about 25% of total CO2 emissions were absorbed by the ocean—making sea water more acidic—and 30% was taken up on land, largely by increased plant growth stimulated by rising atmospheric CO2, increased nutrient availability, and
responses to warming and rainfall changes (though the mix of these mechanisms remains unclear). The other 45% of emissions accumulated in the atmosphere. These changes to the carbon cycle are known from measurements in the atmosphere, on land and in the ocean, and from modelling studies.
The dominant cause of the increasing concentration of CO2 in the atmosphere is the burning of fossil fuels. Over the last two centuries, the growth of fossil-fuel combustion has been closely coupled to global growth in energy use and economic activity. Fossil-fuel emissions grew by 3.2% per year from 2000 to 2010 (Figure 3.3), a rapid growth that is dominated by growth in Asian emissions and has exceeded all but the highest recent long-range scenarios for future emissions.
Although fossil-fuel emissions of CO2 have grown fairly steadily, the upward march of the CO2 concentration in the atmosphere varies from year to year. This is caused mainly by the effects of weather variability on vegetation, and also by sporadic volcanic activity: major volcanic eruptions have a significant indirect influence on atmospheric CO2 concentrations, causing temporary drawdown of CO2 through the promotion of plant growth by the light-scattering and cooling effects of volcanic haze. By contrast, the direct contribution of volcanic emissions to atmospheric CO2 is negligible, amounting to around 1% of current human-induced emissions.
are human activities causing climate change?
Q3
12 | The science of climate change
The science of climate change | 13
Geological reservoirs
Fossil fuel & cement
8.9 ± 0.4 Land-use change
0.9 ± 0.5
Land sink
2.9 ± 0.8
Ocean sink
2.6 ± 0.5
Atmospheric growth
4.3 ± 0.1
Global carbon dioxide budget (gigatonnes of carbon per year)
2004-2013
Produced by the International Geosphere-Biosphere Programme for the Global Carbon Project.
© Global Carbon Project 2010
Figure 3.1: The natural carbon cycle, in which CO2 circulates between the atmosphere, land and oceans, has been changed by emissions of CO2 from human activities. In this diagram of the global carbon cycle, numbers on arrows represent carbon flows averaged over 2004–2013, in gigatonnes (billion tonnes) of carbon per year. Source: Global Carbon Project, with updated numbers.
2
4
6
8
10
1850 1870 1890 1910 1930 1950 1970 1990 2010
Emissions from fossil fuels
Emissions from land use changes
Accumulation in the atmosphere
2
4
6
1850 1870 1890 1910 1930 1950 1970 1990 2010
oceans
land
Atmospheric CO₂ sources and accumulation
Atmospheric CO₂ sinks
Ann
ual fl
ow o
f C
O₂
(bill
ion
tonn
es o
f ca
rbon
per
yea
r)
6
8
10
12
14
1990 1995 2000 2005 2010 2015 2020 2025 2030
Foss
il Fu
el C
O₂
emis
sion
s (b
illio
n to
nnes
of
carb
on p
er y
ear)
High emissions pathway
Low emissions pathway
Intermediate 1
Intermediate 2
Observed
Figure 3.2: An ‘atmospheric CO2 budget’ reveals the amount of carbon in the net amounts of CO2 entering, leaving and accumulating in the atmosphere. The upper panel shows the inflows of CO2 to the atmosphere from fossil fuel emissions (red) and net land use change (orange), together with the net annual CO2 accumulation in the atmosphere (pale blue). The lower panel shows the outflows of CO2 from the atmosphere to the ocean (dark blue) and to plants on land (green). The accumulation in the atmosphere is the difference between the sum of the two emissions and the sum of the two sinks Source: Working Group for this document, with data from the Global Carbon Project. (www.globalcarbonproject.org/)
Figure 3.3: CO2 emissions from burning fossil fuels have continued to increase over recent years. The black dots show observed CO2 emissions from fossil fuels and other industrial processes (mainly cement manufacture); the coloured lines represent four future pathways as envisaged in 2006 for low to high emissions. Observed emissions are tracking the highest-emission pathway. Source: Working Group for this document, with data from the Global Carbon Project.
facing page: Southern approach to the Sydney Harbour Bridge, NSW. Photo: ©iStockphoto.com/airspeed
14 | The science of climate change
Most of the observed recent global warming results from human activitiesClimatic warming or cooling arises from changes in the flows of energy through the climate system (Figure 1.1, see page 7) that can originate from a number of possible driving factors. The main drivers that have acted over the last century are:
> increases in atmospheric CO2 and other long-lived greenhouse gases (methane, nitrous oxide and halocarbons)
> increases in short-lived greenhouse gases (mainly ozone)
> changes to land cover (replacement of darker forests with paler croplands and grasslands)
> increases in aerosols (tiny particles in the atmosphere)
> solar fluctuations (changes in the brightness of the sun)
> volcanic eruptions.
Of these, solar fluctuations and volcanic eruptions are entirely natural, while the other four are predominantly caused by human influences. The human-induced drivers have been dominant over the past century (Figure 3.4). Changes in greenhouse gas concentrations, dominated by CO2, caused a large warming contribution. Some of this has been offset by the net cooling effects of increased aerosol concentrations and their impact on clouds. Black carbon or soot has probably exerted a smaller, warming influence. The net effect of all aerosol types including soot remains hard to quantify accurately. Among the natural influences, the effect of changes in the brightness of the Sun has been very small (Box 3.1). Volcanic influences are highly intermittent, with major eruptions (such as Pinatubo in 1991) causing significant cooling for a year or two, but their average effects over the past century have been relatively small.
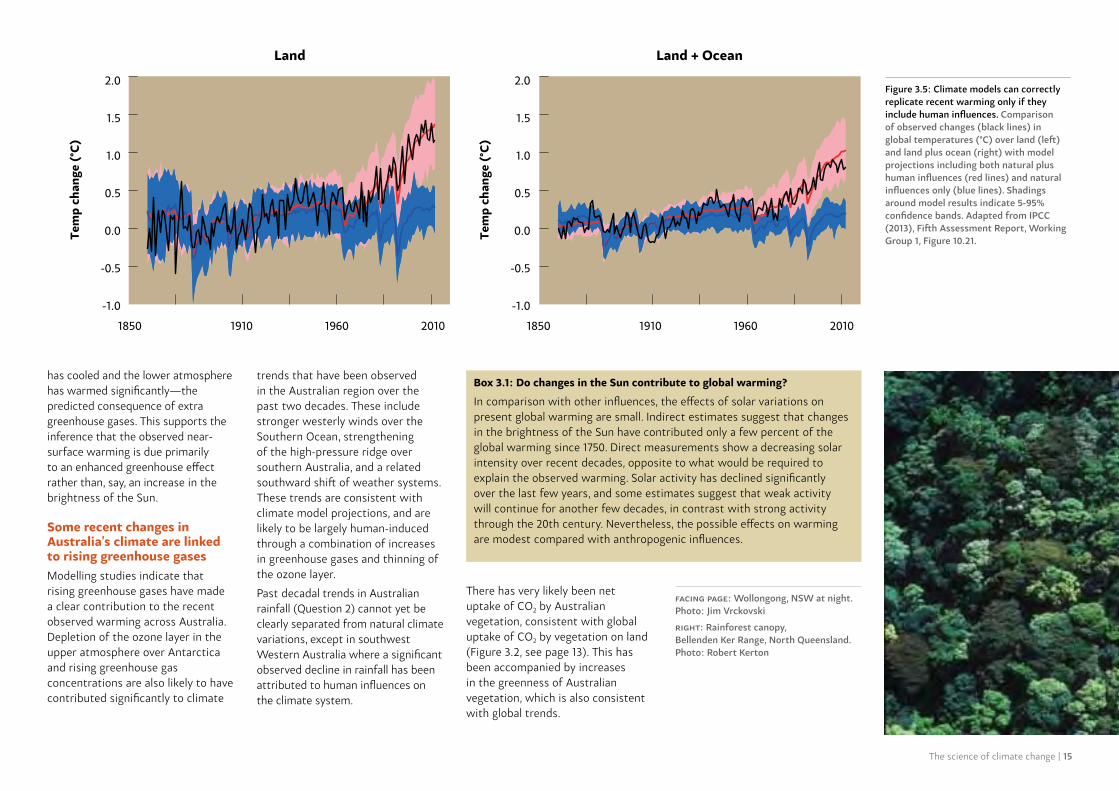
Using climate models, it is possible to separate the effects of the natural and human-induced influences on climate. Models can successfully reproduce the observed warming over the last 150 years when both natural and human influences are included, but not when natural influences act alone (Figure 3.5). This is both an important test of the climate models against observations and also a demonstration that recent observed global warming results largely from human rather than natural influences on climate.
It is also possible to distinguish the effects of different human and natural influences on climate by studying particular characteristics of their effects. For example, it was predicted more than a century ago that increases in CO2 would trap more heat near the surface and also make the stratosphere colder. In recent years, satellite and other measurements have provided strong evidence that the upper atmosphere
Effect on climate (Watts per square metre)
-3 -2 -1 0 1 2
CO2
Methane + other long-lived gases
Ozone + other short-lived gases
Land use change
Solar
Aerosol
Figure 3.4: Human-induced drivers of climate change have been much larger than natural drivers over the last century. The strength of these drivers, which are changing the long-term energy balance of the planet, is measured in Watts per square metre (see also Figure 1.1). Orange and green bars respectively indicate human and natural drivers; error bars indicate 5-95% uncertainties. The solar effect (shown in green) is very small. Volcanic effects are highly variable in time (see text) and are not shown here. Source: Working Group for this document, with data from IPCC (2013), Fifth Assessment Report, Working Group 1, Chapter 8 Supplementary Material.
The science of climate change | 15
Box 3.1: Do changes in the Sun contribute to global warming?
In comparison with other influences, the effects of solar variations on present global warming are small. Indirect estimates suggest that changes in the brightness of the Sun have contributed only a few percent of the global warming since 1750. Direct measurements show a decreasing solar intensity over recent decades, opposite to what would be required to explain the observed warming. Solar activity has declined significantly over the last few years, and some estimates suggest that weak activity will continue for another few decades, in contrast with strong activity through the 20th century. Nevertheless, the possible effects on warming are modest compared with anthropogenic influences.
2.0
1.5
1.0
0.5
0.0
-0.5
-1.0
Tem
p ch
ange
(°C
)Land Land + Ocean
2.0
1.5
1.0
0.5
0.0
-0.5
-1.0
Tem
p ch
ange
(°C
)
1850 19601910 2010 1850 19601910 2010
has cooled and the lower atmosphere has warmed significantly—the predicted consequence of extra greenhouse gases. This supports the inference that the observed near-surface warming is due primarily to an enhanced greenhouse effect rather than, say, an increase in the brightness of the Sun.
Some recent changes in Australia’s climate are linked to rising greenhouse gasesModelling studies indicate that rising greenhouse gases have made a clear contribution to the recent observed warming across Australia. Depletion of the ozone layer in the upper atmosphere over Antarctica and rising greenhouse gas concentrations are also likely to have contributed significantly to climate
trends that have been observed in the Australian region over the past two decades. These include stronger westerly winds over the Southern Ocean, strengthening of the high-pressure ridge over southern Australia, and a related southward shift of weather systems. These trends are consistent with climate model projections, and are likely to be largely human-induced through a combination of increases in greenhouse gases and thinning of the ozone layer.
Past decadal trends in Australian rainfall (Question 2) cannot yet be clearly separated from natural climate variations, except in southwest Western Australia where a significant observed decline in rainfall has been attributed to human influences on the climate system.
facing page: Wollongong, NSW at night. Photo: Jim Vrckovski
right: Rainforest canopy, Bellenden Ker Range, North Queensland. Photo: Robert Kerton
Figure 3.5: Climate models can correctly replicate recent warming only if they include human influences. Comparison of observed changes (black lines) in global temperatures (°C) over land (left) and land plus ocean (right) with model projections including both natural plus human influences (red lines) and natural influences only (blue lines). Shadings around model results indicate 5-95% confidence bands. Adapted from IPCC (2013), Fifth Assessment Report, Working Group 1, Figure 10.21.
There has very likely been net uptake of CO2 by Australian vegetation, consistent with global uptake of CO2 by vegetation on land (Figure 3.2, see page 13). This has been accompanied by increases in the greenness of Australian vegetation, which is also consistent with global trends.
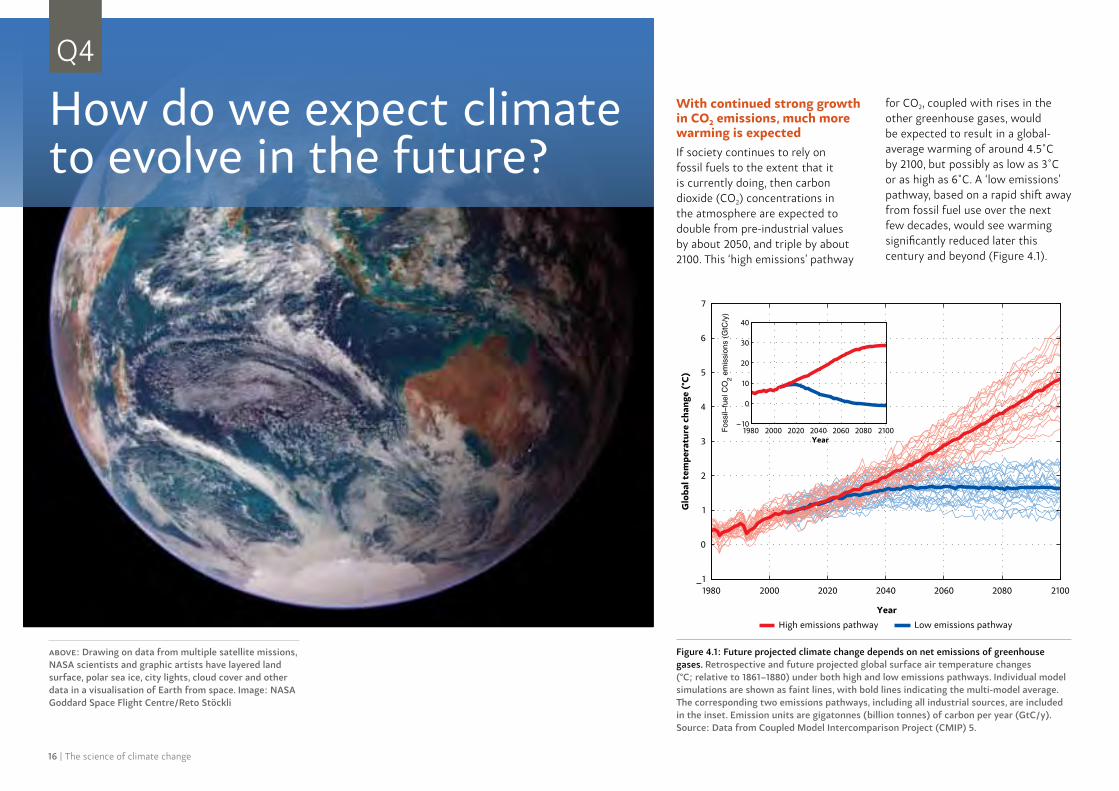
With continued strong growth in CO2 emissions, much more warming is expectedIf society continues to rely on fossil fuels to the extent that it is currently doing, then carbon dioxide (CO2) concentrations in the atmosphere are expected to double from pre-industrial values by about 2050, and triple by about 2100. This ‘high emissions’ pathway
for CO2, coupled with rises in the other greenhouse gases, would be expected to result in a global-average warming of around 4.5˚C by 2100, but possibly as low as 3˚C or as high as 6˚C. A ‘low emissions’ pathway, based on a rapid shift away from fossil fuel use over the next few decades, would see warming significantly reduced later this century and beyond (Figure 4.1).
Year
1980 2000 2020 2040 2060 2080 2100−1
0
1
2
3
4
5
6
7
Year1980 2000 2020 2040 2060 2080 2100
−10
0
10
20
30
40
Glo
bal t
empe
ratu
re c
hang
e (°
C)
High emissions pathway Low emissions pathway
Figure 4.1: Future projected climate change depends on net emissions of greenhouse gases. Retrospective and future projected global surface air temperature changes (°C; relative to 1861–1880) under both high and low emissions pathways. Individual model simulations are shown as faint lines, with bold lines indicating the multi-model average. The corresponding two emissions pathways, including all industrial sources, are included in the inset. Emission units are gigatonnes (billion tonnes) of carbon per year (GtC/y). Source: Data from Coupled Model Intercomparison Project (CMIP) 5.
above: Drawing on data from multiple satellite missions, NASA scientists and graphic artists have layered land surface, polar sea ice, city lights, cloud cover and other data in a visualisation of Earth from space. Image: NASA Goddard Space Flight Centre/Reto Stöckli
How do we expect climate to evolve in the future?
Q4
16 | The science of climate change

The science of climate change | 17
−50
−40
−30
−20
−10
0
10
20
30
40
50
−1
1
3
5
7
9
11
Projections of surface air temperature and precipitation change for years 2081–2100
A model with high climate sensitivity A model with low climate sensitivity
Projected surface air tem
perature changes °CProjected %
precipitation change
Figure 4.2: Projections of temperature and rainfall show consistent features at large scales but differ regionally, especially for rainfall. Projected global distributions of surface air temperature changes (top) and percentage precipitation change (bottom) averaged for the years 2081–2100 (relative to 1981–2000), under a high emissions pathway for two particular climate models, one with relatively high sensitivity to an initial disturbance to the climate system (left hand panels) and one with relatively low climate sensitivity (right hand panels). The projections have many similar patterns but differ in regional details, as is typical of climate projections from different models. Source: Data from Coupled Model Intercomparison Project 5.
During the next few decades and beyond, global warming is expected to cause further increases in atmospheric moisture content, more extreme heatwaves, fewer frosts, further decreases in the extent and thickness of sea ice, further melting of mountain glaciers and ice sheets, shifts in rainfall (increases in most tropical and high-latitude regions
and decreases in many subtropical and mid-latitude regions), further ocean warming, and further rises in sea levels. The magnitude of expected change depends on future greenhouse gas emissions and climate feedbacks.
Future projections, based on climate models operated across a large number of research centres
worldwide, broadly agree on the patterns of global-scale warming, with greater atmospheric warming over land than over the oceans, and greater warming at high northern latitudes than in the tropics and Southern Ocean (Figure 4.2 top). Future changes depend on the emissions pathway, and will be less if emissions are curtailed
than under a high emissions scenario. At more localised regional scales the models can produce different results: for example, some models project substantial changes to phenomena such as El Niño or dramatic changes to vegetation, and regional projections of precipitation vary between models (Figure 4.2 bottom).

18 | The science of climate change
Australia can expect further warming and changes in water availabilityAustralian temperatures are expected to rise by approximately half a degree or more by 2030 relative to 1990, bringing more hot days and nights. Average sea level is expected to be about 15 cm higher by 2030 relative to 1990 and some models project tropical cyclones becoming less frequent but more severe in peak rainfall intensity as the world warms.
It is likely that future rainfall patterns across Australia will be different from today. However, compared with temperature trends, changes in rainfall patterns are harder to predict. Regional rainfall projections from different climate models are frequently different from one another (e.g. over Australia; Figure 4.2, see page 17). Nevertheless, some future trends are projected by a majority of models, including decreases over southwest Western Australia coastal regions. Future rainfall trends across the Murray Darling basin remain uncertain.
Changes in rainfall greatly affect water availability because changes in rainfall are amplified in the resulting changes in runoff to rivers: the runoff in typical Australian catchments changes by 2 to 3% for each 1% change in rainfall.
Long-term climate change is effectively irreversibleThe decisions we make on carbon emissions over coming decades will affect our climate for a long time to come, as emissions will profoundly impact the rate of future climate change, particularly after 2030 (Figure. 4.1, see page 16). Even if emissions of greenhouse gases are reduced to near zero during this century, we will have to live with a warmer climate for centuries. For those parts of the climate system that respond slowly, such as the deep ocean, ice sheets and permafrost, change will continue for a long time. Many associated impacts—such as sea-level rise—and processes that exacerbate climate change—such as releases of methane and CO2 from thawing permafrost soils—will continue long after emissions are stopped.
These characteristics of the climate system mean that the only way to stop human-induced climate change (without resorting to ‘geoengineering’—the deliberate, large-scale modification of climate) is to reduce net greenhouse gas emissions to near-zero levels. The longer this takes to achieve, and the more greenhouse gases that are emitted in the meantime, the larger the scale of future climate change.
left: Low water levels in the Cotter Dam near Canberra, ACT. Photo: Nick Pitsas
above right: 1 Bligh St, Sydney, NSW is an energy efficient development with six-star green status. Improving urban energy efficiency will help reduce emissions. Photo: Sardaka

The science of climate change | 19
To keep global warming below any specified threshold, there is a corresponding limit on cumulative carbon dioxide emissionsThe amount of future global warming is closely related to cumulative CO2 emissions (Figure 4.3). For example, to have a 50:50 chance of keeping
global average temperatures to no more than 2°C above preindustrial levels, the total CO2 emitted from human activities (accounting also for effects of other gases) would have to stay below a ‘carbon quota’ between 820 and 950 billion tonnes of carbon. So far, humanity has emitted well over half of this quota: between 1870 and 2013 cumulative
emissions were 530 billion tonnes. The remaining quota is equivalent to around 30 years worth of current emissions. To stay within such a carbon quota, long-term global emissions reductions would have to average between 5.5% and 8% per year, accounting for time required to turn around present emissions growth.
AR5AR4
0 500 1000 1500 2000 2500 30000
1
2
3
4
5
6
7
War
min
g re
lati
ve t
o 18
60–1
880
(°C
)
Cumulative CO2 emissions from 1870 (billion tonnes of carbon)
Figure 4.3: Global warming is closely related to cumulative CO2 emissions. Points represent Intergovernmental Panel on Climate Change projections from the Fourth and Fifth Assessments (IPCC AR4, AR5); coloured bands represent uncertainty, by showing the relationship if the climate were more (red) or less (blue) sensitive to disturbance than current best estimates. Source: Working Group for this document, with data from IPCC AR4 and AR5.

20 | The science of climate change
Australia has a variable climate with many extremes With its iconic reference to ‘droughts and flooding rains’, Dorothea Mackellar’s 1904 poem My Country highlights the large natural variations that occur in Australia’s climate, leading to extremes that can frequently cause substantial economic and environmental disruption. These variations have existed for many thousands of years, and indeed past floods and droughts in many regions have likely been larger than those recorded since the early 20th century. This high variability poses great challenges for recording and analysing changes in climate extremes not just in Australia, but the world over. Nevertheless, some changes in Australia’s climate extremes stand out from that background variability.
Human-induced climate change is superimposed on natural variabilityIn a warming climate, extremely cold days occur less often and very hot days occur more often (Figure 5.1). These changes have already been observed. For example, in recent
Time
Tem
pera
ture
cold extremes threshold
hot extremes threshold
Figure 5.1: Temperature extremes change as average temperature increases. In this schematic illustration, the increase in average temperature is shown by the sloping line on the right. The idealised temperature time series has similar variability throughout the whole record. In the latter part of the record, the hot extremes threshold is exceeded progressively more frequently. Source: Working Group for this document.
decades, hot days and nights have become more frequent, more intense and longer lasting in tandem with decreases in cold days and nights for most regions of the globe. Since records began, the frequency, duration and intensity of heatwaves have increased over large parts of Australia, with trends accelerating since 1970.
Because a warmer atmosphere contains more moisture, rainfall extremes are also expected to become more frequent and intense as global average temperatures increase. This is already being observed globally: heavy rainfall events over most land areas have become more frequent and intense in recent decades, although these trends have varied notably between regions and seasons. In southern Australia, for example, the frequency of heavy rainfall has decreased in some seasons. While there is no clear trend in drought occurrence globally, indications are that droughts have increased in some regions (such as southwest Australia) and decreased in others (such as northwest Australia) since the middle of the 20th century.
For other extreme weather events such as tropical cyclones, there are not yet sufficient good quality observational data to make conclusive statements about past long-term trends. However, as the climate continues to warm, intensification of rainfall from tropical cyclones is expected.
Recent scientific advances now allow us to begin ascribing changes in the climate system to a set of underlying natural and human causes. For example, it is now possible to estimate the contribution of human-induced global warming to the probabilities of some kinds of extreme events. There is a discernible human influence in the observed increases in extremely hot days and heatwaves. While the record high temperatures of the 2012/2013 Australian summer could have occurred naturally, they were substantially more likely to occur because of human influences on climate. By contrast, the large natural variability of other extremes, such as rainfall or tropical cyclones, means that there is still much less confidence in how these are being affected by human influences.
How are extreme events changing?
above: Flooding in Darwin, NT, following tropical cyclone Carlos in 2011. Photo: Charles Strebor
Q5
The science of climate change | 21
1960 1980 2000 2020 2040 2060 2080 21000
2
4
6
8
10
12
Year
Exce
edan
ce ra
te (%
)
0
2
4
6
8
10
12
Cold days (TX10p)
historicalRCP2.6RCP4.5RCP8.5
historicalRCP2.6RCP4.5RCP8.5
historicalRCP2.6RCP4.5RCP8.5
historicalRCP2.6RCP4.5RCP8.5
1960 1980 2000 2020 2040 2060 2080 2100−5
0
5
10
15
20
Year
Rel
ative
cha
nge
(%)
−5
0
5
10
15
20
Wettest consecutive five days (RX5day)
1960 1980 2000 2020 2040 2060 2080 2100
10
20
30
40
50
60
70
Year
Exce
edan
ce ra
te (%
)
10
20
30
40
50
60
70
Warm days (TX90p)
1960 1980 2000 2020 2040 2060 2080 2100
0
20
40
60
Year
Rel
ative
cha
nge
(%)
0
20
40
60
Precipitation from very wet days (R95p)
(a) (b)
(d)(c)
(e) (f)Future change in 20yr RV of warmest daily Tmax (TXx) Future RP for present day 20yr RV of wettest day (RX1day)
(°C) Years-0.5-1-1.5-2 1.510.50 8642 14 16 18 2012105432 1197
29
18
18
18
18
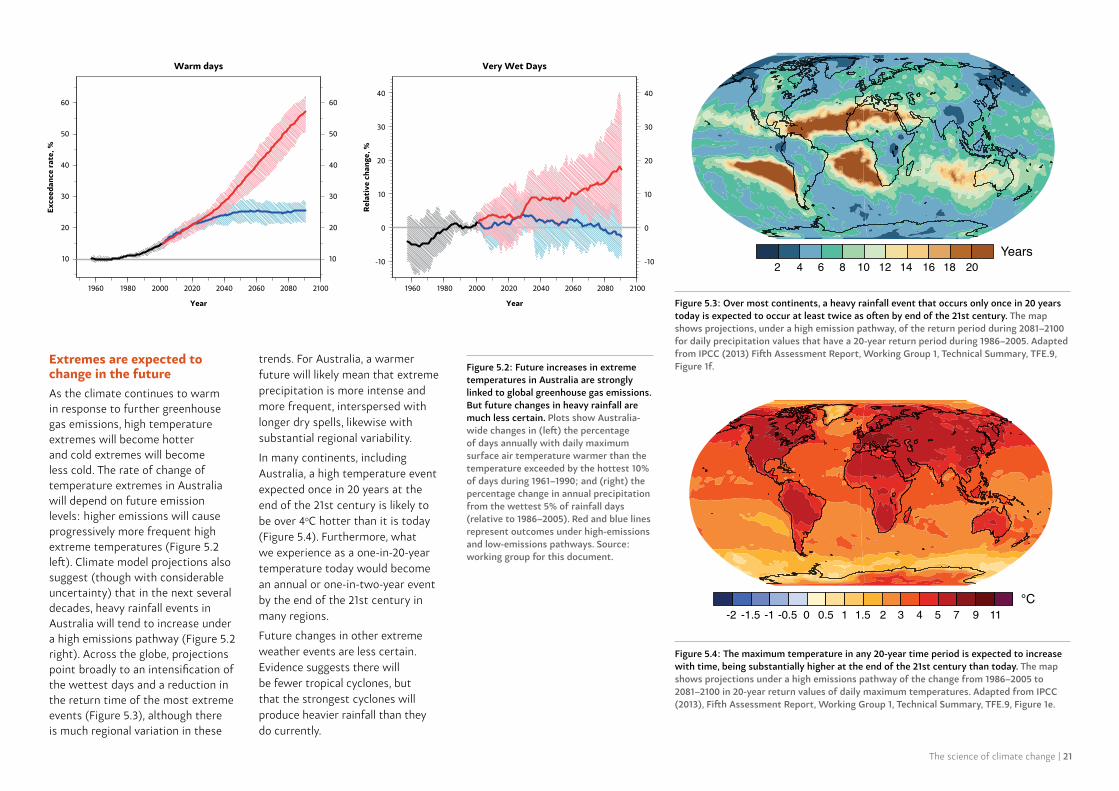
Extremes are expected to change in the futureAs the climate continues to warm in response to further greenhouse gas emissions, high temperature extremes will become hotter and cold extremes will become less cold. The rate of change of temperature extremes in Australia will depend on future emission levels: higher emissions will cause progressively more frequent high extreme temperatures (Figure 5.2 left). Climate model projections also suggest (though with considerable uncertainty) that in the next several decades, heavy rainfall events in Australia will tend to increase under a high emissions pathway (Figure 5.2 right). Across the globe, projections point broadly to an intensification of the wettest days and a reduction in the return time of the most extreme events (Figure 5.3), although there is much regional variation in these
trends. For Australia, a warmer future will likely mean that extreme precipitation is more intense and more frequent, interspersed with longer dry spells, likewise with substantial regional variability.
In many continents, including Australia, a high temperature event expected once in 20 years at the end of the 21st century is likely to be over 4oC hotter than it is today (Figure 5.4). Furthermore, what we experience as a one-in-20-year temperature today would become an annual or one-in-two-year event by the end of the 21st century in many regions.
Future changes in other extreme weather events are less certain. Evidence suggests there will be fewer tropical cyclones, but that the strongest cyclones will produce heavier rainfall than they do currently.
10
20
30
40
50
60
10
20
30
40
50
60
Year
Exce
edan
ce r
ate,
%
Warm days
0
10
20
30
40
Year
Rel
ativ
e ch
ange
, %
Very Wet Days
2080206020402020200019801960 2100 2080206020402020200019801960 2100
-10
0
10
20
30
40
-10
1960 1980 2000 2020 2040 2060 2080 21000
2
4
6
8
10
12
Year
Exce
edan
ce ra
te (%
)
0
2
4
6
8
10
12
Cold days (TX10p)
historicalRCP2.6RCP4.5RCP8.5
historicalRCP2.6RCP4.5RCP8.5
historicalRCP2.6RCP4.5RCP8.5
historicalRCP2.6RCP4.5RCP8.5
1960 1980 2000 2020 2040 2060 2080 2100−5
0
5
10
15
20
Year
Rel
ative
cha
nge
(%)
−5
0
5
10
15
20
Wettest consecutive five days (RX5day)
1960 1980 2000 2020 2040 2060 2080 2100
10
20
30
40
50
60
70
Year
Exce
edan
ce ra
te (%
)
10
20
30
40
50
60
70
Warm days (TX90p)
1960 1980 2000 2020 2040 2060 2080 2100
0
20
40
60
Year
Rel
ative
cha
nge
(%)
0
20
40
60
Precipitation from very wet days (R95p)
(a) (b)
(d)(c)
(e) (f)Future change in 20yr RV of warmest daily Tmax (TXx) Future RP for present day 20yr RV of wettest day (RX1day)
°C Years-0.5-1-1.5-2 1.510.50 8642 14 16 18 2012105432 1197
18
18
18
18
29
Figure 5.2: Future increases in extreme temperatures in Australia are strongly linked to global greenhouse gas emissions. But future changes in heavy rainfall are much less certain. Plots show Australia-wide changes in (left) the percentage of days annually with daily maximum surface air temperature warmer than the temperature exceeded by the hottest 10% of days during 1961–1990; and (right) the percentage change in annual precipitation from the wettest 5% of rainfall days (relative to 1986–2005). Red and blue lines represent outcomes under high-emissions and low-emissions pathways. Source: working group for this document.
Figure 5.3: Over most continents, a heavy rainfall event that occurs only once in 20 years today is expected to occur at least twice as often by end of the 21st century. The map shows projections, under a high emission pathway, of the return period during 2081–2100 for daily precipitation values that have a 20-year return period during 1986–2005. Adapted from IPCC (2013) Fifth Assessment Report, Working Group 1, Technical Summary, TFE.9, Figure 1f.
Figure 5.4: The maximum temperature in any 20-year time period is expected to increase with time, being substantially higher at the end of the 21st century than today. The map shows projections under a high emissions pathway of the change from 1986–2005 to 2081–2100 in 20-year return values of daily maximum temperatures. Adapted from IPCC (2013), Fifth Assessment Report, Working Group 1, Technical Summary, TFE.9, Figure 1e.

In past warmer climates, sea level was higher than today Sea level was between 5 metres and 10 metres above current levels during the last interglacial period (129,000 to 116,000 years ago) when global average surface temperatures were less than 2°C above their values just before the start of the industrial era in the 19th century. The estimated contributions from ocean thermal expansion and a then smaller Greenland Ice Sheet imply a contribution also from Antarctica to this higher sea level.
Globally, sea levels are currently rising For two thousand years before the mid-19th century, the long-term global sea-level change was small, only a few centimetres per century. Since then, the rate of rise has increased substantially; from 1900 to 2012, sea level rose by a global average of about 19 centimetres. In the past 20 years, both satellite and coastal sea-level data indicate that the rate of rise has increased to about 3 centimetres per decade. A similarly high rate was experienced in the 1920 to 1950 period (Figure 6.1).
The two largest contributions to sea-level rise since 1900 were the
expansion of ocean water as it warmed, and the addition of water to the ocean from loss of ice from glaciers. Since 1990, there have been further contributions from surface melting of the Greenland ice sheet, and the increased discharge of ice into the ocean from both the Greenland and Antarctic ice sheets. This increase in ice-sheet discharge is related to increases in ocean temperatures adjacent to and underneath the glacier tongues and floating ice shelves that fringe the coast of Greenland and Antarctica. The sum of storage of water in terrestrial reservoirs and the depletion of ground water have made a small contribution to sea-level rise during the 20th century.
Australian sea levels are risingAround the Australian coastline, sea level rose relative to the land throughout the 20th century, with a faster rate (partly as a result of natural climate variability) since 1993. This follows several thousand years when there was a slow fall of Australian sea levels relative to the land at rates of a few centimetres per century. This was a result of ongoing changes to the ‘solid’ Earth following loss of the large surface loading from ice sheets of the last ice age.
How are sea levels changing?
left: Coogee Beach sea pool, NSW. Photo: Robert Montgomery
Q6
22 | The science of climate change
The science of climate change | 23
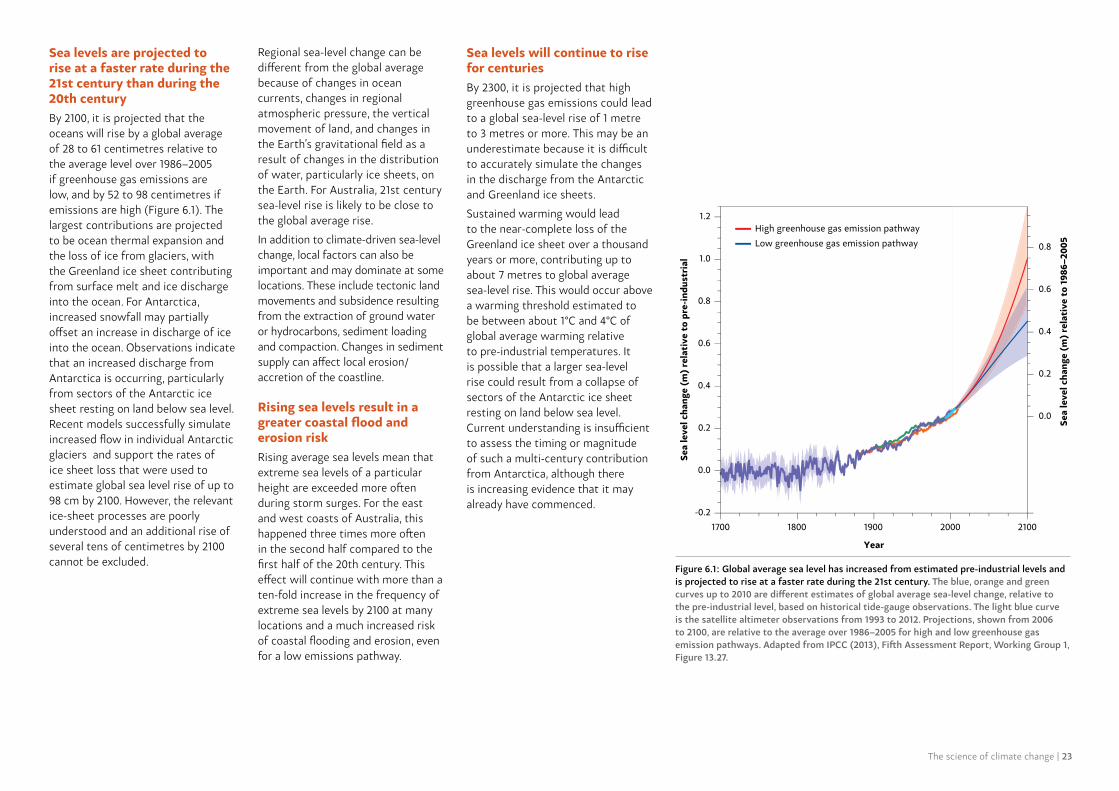
Sea levels are projected to rise at a faster rate during the 21st century than during the 20th centuryBy 2100, it is projected that the oceans will rise by a global average of 28 to 61 centimetres relative to the average level over 1986–2005 if greenhouse gas emissions are low, and by 52 to 98 centimetres if emissions are high (Figure 6.1). The largest contributions are projected to be ocean thermal expansion and the loss of ice from glaciers, with the Greenland ice sheet contributing from surface melt and ice discharge into the ocean. For Antarctica, increased snowfall may partially offset an increase in discharge of ice into the ocean. Observations indicate that an increased discharge from Antarctica is occurring, particularly from sectors of the Antarctic ice sheet resting on land below sea level. Recent models successfully simulate increased flow in individual Antarctic glaciers and support the rates of ice sheet loss that were used to estimate global sea level rise of up to 98 cm by 2100. However, the relevant ice-sheet processes are poorly understood and an additional rise of several tens of centimetres by 2100 cannot be excluded.
Regional sea-level change can be different from the global average because of changes in ocean currents, changes in regional atmospheric pressure, the vertical movement of land, and changes in the Earth’s gravitational field as a result of changes in the distribution of water, particularly ice sheets, on the Earth. For Australia, 21st century sea-level rise is likely to be close to the global average rise.
In addition to climate-driven sea-level change, local factors can also be important and may dominate at some locations. These include tectonic land movements and subsidence resulting from the extraction of ground water or hydrocarbons, sediment loading and compaction. Changes in sediment supply can affect local erosion/accretion of the coastline.
Rising sea levels result in a greater coastal flood and erosion risk Rising average sea levels mean that extreme sea levels of a particular height are exceeded more often during storm surges. For the east and west coasts of Australia, this happened three times more often in the second half compared to the first half of the 20th century. This effect will continue with more than a ten-fold increase in the frequency of extreme sea levels by 2100 at many locations and a much increased risk of coastal flooding and erosion, even for a low emissions pathway.
Sea levels will continue to rise for centuriesBy 2300, it is projected that high greenhouse gas emissions could lead to a global sea-level rise of 1 metre to 3 metres or more. This may be an underestimate because it is difficult to accurately simulate the changes in the discharge from the Antarctic and Greenland ice sheets.
Sustained warming would lead to the near-complete loss of the Greenland ice sheet over a thousand years or more, contributing up to about 7 metres to global average sea-level rise. This would occur above a warming threshold estimated to be between about 1°C and 4°C of global average warming relative to pre-industrial temperatures. It is possible that a larger sea-level rise could result from a collapse of sectors of the Antarctic ice sheet resting on land below sea level. Current understanding is insufficient to assess the timing or magnitude of such a multi-century contribution from Antarctica, although there is increasing evidence that it may already have commenced.
Figure 6.1: Global average sea level has increased from estimated pre-industrial levels and is projected to rise at a faster rate during the 21st century. The blue, orange and green curves up to 2010 are different estimates of global average sea-level change, relative to the pre-industrial level, based on historical tide-gauge observations. The light blue curve is the satellite altimeter observations from 1993 to 2012. Projections, shown from 2006 to 2100, are relative to the average over 1986–2005 for high and low greenhouse gas emission pathways. Adapted from IPCC (2013), Fifth Assessment Report, Working Group 1, Figure 13.27.
1700 1800 1900 2000 2100-0.2
0.0
0.2
0.4
0.6
0.8
1.0
1.2
Sea
leve
l cha
nge
(m)
rela
tive
to
pre-
indu
stri
al
Sea
leve
l cha
nge
(m)
rela
tive
to
1986
–200
5
Year
0.2
0.4
0.6
0.0
0.8
High greenhouse gas emission pathwayLow greenhouse gas emission pathway

24 | The science of climate change
Box 7.1: Impacts of a drier climate: the case of southwest Western Australia
Declining rainfall and surface reservoir recharge since the mid-1970s in southwest Western Australia have been linked to changes in atmospheric circulation that are consistent with what would be expected in an atmosphere influenced by increasing greenhouse gas concentrations. The Water Corporation of Western Australia is addressing the diminishing surface water resource by setting out to deliver a ‘climate-independent’ supply of water for domestic consumption through two desalination plants. These now have the capacity to provide around half the piped water supply for the wider Perth region at a cost several times greater than that of surface water.
Climate changes have always affected societies and ecosystemsClimate change, whatever the cause, has profoundly affected human societies and the natural environment in the past. Throughout history there are examples of societal collapse associated with regional changes in climate, ranging from the decline of the Maya in Mexico (linked to drought) to the disappearance of the Viking community from Greenland in the fifteenth century (linked to decreasing temperatures). Some of these regional climate changes occurred rapidly, on timescales similar to current rates of global climate change.
Impacts from human-induced climate change are already occurring The clearest present-day impacts of climate change in Australia and elsewhere are seen in the natural environment, and are associated with warming temperatures and increases in the number, duration and severity of heatwaves. These impacts include changes in the growth and distribution of plants, animals and insects; poleward shifts in the distribution of marine species; and increases in coral bleaching on the Great Barrier Reef and Western Australian reefs. Some of these changes can directly affect human activities; for example, through the effects of changing distributions of fish and other marine organisms on commercial and recreational fisheries, and the impacts of coral bleaching on tourism.
Some regional changes in Australian rainfall have been linked to human-induced climate change. Southwest Western Australia has experienced a reduction in rainfall since the 1970s that has been attributed, at least in part, to enhanced greenhouse warming (Question 3). Societal adaptation to the resulting shortfalls in water supply is possible and already occurring (Box 7.1).
above left: The Southern Seawater Desalination Plant at Binningup, WA, supplies drinking water to Perth. Photo: Darryl Peroni Photography, courtesy of Water Corporation.
above right: Developed by the CSIRO Information and Communications Technology Centre at its Queensland laboratory, Starbug is an autonomous, miniature submarine for underwater monitoring and surveying of ecosystems such as the Great Barrier Reef. Photo: QCAT
What are the impacts of climate change?
Q7

The science of climate change | 25
1000
2000
3000
4000
5000
1970 1975 1980 1985 1990 1995 2000 2005 2010 2015
Annual (July to June) cumulative FFDI for Melbourne Airport
Cum
ulat
ive
Fore
st F
ire
Dan
ger
Inde
x (F
FDI)
Current changes are expected to continue and intensify in the futureThe impacts of future climate change and related sea-level rise will be experienced in many areas, from the natural environment to food security and from human health to infrastructure.
Ecosystems: Among Australia’s terrestrial ecosystems, some of the most vulnerable to climate change are (1) alpine systems as habitats shift to higher elevations and shrink in area; (2) tropical and subtropical rainforests due to warming temperatures (moderated or intensified by rainfall changes); (3) coastal wetlands affected by sea-level rise and saline intrusion; (4) inland ecosystems dependent on freshwater and groundwater
that are affected by changed rainfall patterns; and (5) tropical savannahs affected by changes in the frequency and severity of bushfires.
Climate warming causes land and ocean life to migrate away from areas that have become too warm, and towards areas that previously were too cool. In many places, climate change is likely to lead to invasion by new species and extinctions of some existing species that will have nowhere to migrate, for example because they are located on mountain tops (Figure 7.1). Seemingly small changes, such as the loss of a key pollinating species, may potentially have large impacts.
Carbon dioxide affects ecosystems directly, both positively and negatively. On land it enhances growth in some trees and plants,
an effect sometimes called ‘CO2 fertilisation’. Absorption of CO2 into the oceans causes ‘ocean acidification’, impeding shell formation by organisms such as corals and causing coral deterioration or death.
current climate +1°C +3.5°C +5°C
Cairns
1–5
species richness Wet Tropics bioregion
6–10 11–15 16–20 21–25 26–30 31–35 36–40 41–45 46–50
species
100200400
600
< 100(pts/decade)
Increase
Figure 7.1: As temperatures become warmer, native animals that depend on cooler mountain habitats may be particularly vulnerable, as shown for this example from northern Queensland. The maps indicate the number of considered species now present in the Wet Tropics bioregion under the current climate and those expected with temperature rises of 1°C, 3.5°C and 5°C shown according to the colour code at the left. The impacts of changes in rainfall are not included in this example. Adapted from Williams et al. (2003).
Bushfires: The number of extreme fire risk days has grown over the past four decades, particularly in southeast Australia and away from the coast (Figure 7.2). Future hotter and drier conditions, especially in southern Australia, are likely to cause further increases in the number of high fire-risk days and in the length of the fire season. CO2 fertilisation may lead to increased foliage cover and hence increased
fuel loads in warm arid environments such as parts of southern Australia. A study of southeast Australia has projected that the number of fire danger days rated at ‘very high’ and above could double by 2050, under high emission climate scenarios. Whether or not this leads to more, or worse, fires, and hence to changes in ecosystems, agriculture and human settlements, will depend on how this risk is managed.
Figure 7.2: In most parts of Australia, the number of extreme fire weather days has increased over the last few decades. The map, left, shows the trends in average fire weather days (annual cumulative values of the McArthur Forest Fire Danger Index (FFDI)) at 38 climate reference sites. Trends are given in FFDI points per decade and larger circles represent larger trends according to the size code shown below. Filled circles represent trends that are statistically significant. The time series, top, shows the trend in the annual cumulative FFDI at Melbourne Airport. Adapted from Clarke et al (2013). Please note: This caption differs slightly to the first print run of the booklet.

25.5
36.4
43.4 44.9
45.1
30.5
33.8
2004-08 average deaths
2009 deaths
Date
Dea
ths
Max
imum
tem
pera
ture
(°C
)
26/01 27/01 28/01 29/01 31/0130/01 1/02
45
40
35
30
25
20
15
10
5
0
200
150
100
50
0*Deaths data from BDM and reports to SCO
50250
2009 max temp (°C)
Food security: In a non-drought year, around three-quarters of Australian crop and livestock production is exported. The range of adaptation strategies for primary producers to meet the challenge of climate change is large, including breed and seed selection, water conservation and changes in the timing of farm operations. Over the next few decades, some Australian agriculture may benefit from warmer conditions and from the fertilisation effect of increased CO2 in the atmosphere. Looking further into the future, much depends on the effects of climate change on rainfall regimes in Australia’s farming regions. If rainfall increases, climate change may continue to be beneficial for some agriculture. However, for drier, hotter, higher-variability climate change scenarios, there are limits to adaptation with anticipated declines in crop yield and livestock production.
Health: Heatwaves are among the highest-impact climate events in terms of human health in Australia. In very hot conditions, people can suffer from heat stress, especially vulnerable individuals such as the sick and elderly. During the heatwave of early 2009 in Victoria, there were 374 more deaths than average for the time of year (Figure 7.3). Warmer temperatures in future will lead to increased occurrences of heatwaves (Figure 5.2 left, see page 21). Without further adaptation, extremely hot episodes are expected to have the greatest impact on mortality in the hotter north, while in cooler southern Australia there is likely to be an offsetting reduction in the number of cold-season deaths.
Warmer temperatures may lead to an increase in diseases spread via water and food such as gastroenteritis. Over the next few decades, Australia is expected to remain malaria-free. However, other vector-borne diseases such as dengue fever, Barmah Forest Virus and Ross River Virus may expand their range, depending on socioeconomic and lifestyle factors related to hygiene, travel frequency and destinations, in addition to climate scenarios.
Extreme events also have psychological impacts. Drought is known to cause depression and stress amongst farmers and pastoralists, and this impact may increase over southern Australia as a result of climate change.
Figure 7.3: The number of deaths in Victoria during the heatwave of 26 January to 1 February 2009 was much higher than the average for the comparable period in 2004-08. Source: Victorian Department of Health report on the January 2009 heatwave, Figure 10.
26 | The science of climate change
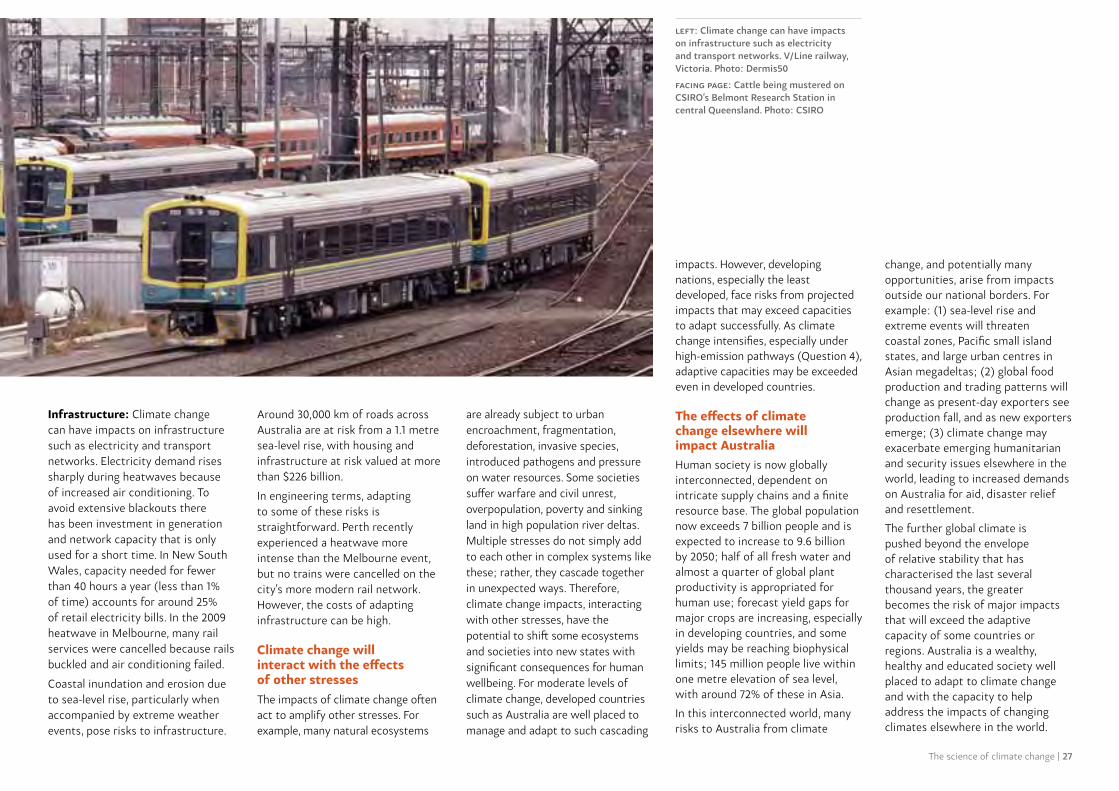
The science of climate change | 27
Infrastructure: Climate change can have impacts on infrastructure such as electricity and transport networks. Electricity demand rises sharply during heatwaves because of increased air conditioning. To avoid extensive blackouts there has been investment in generation and network capacity that is only used for a short time. In New South Wales, capacity needed for fewer than 40 hours a year (less than 1% of time) accounts for around 25% of retail electricity bills. In the 2009 heatwave in Melbourne, many rail services were cancelled because rails buckled and air conditioning failed.
Coastal inundation and erosion due to sea-level rise, particularly when accompanied by extreme weather events, pose risks to infrastructure.
Around 30,000 km of roads across Australia are at risk from a 1.1 metre sea-level rise, with housing and infrastructure at risk valued at more than $226 billion.
In engineering terms, adapting to some of these risks is straightforward. Perth recently experienced a heatwave more intense than the Melbourne event, but no trains were cancelled on the city’s more modern rail network. However, the costs of adapting infrastructure can be high.
Climate change will interact with the effects of other stressesThe impacts of climate change often act to amplify other stresses. For example, many natural ecosystems
are already subject to urban encroachment, fragmentation, deforestation, invasive species, introduced pathogens and pressure on water resources. Some societies suffer warfare and civil unrest, overpopulation, poverty and sinking land in high population river deltas. Multiple stresses do not simply add to each other in complex systems like these; rather, they cascade together in unexpected ways. Therefore, climate change impacts, interacting with other stresses, have the potential to shift some ecosystems and societies into new states with significant consequences for human wellbeing. For moderate levels of climate change, developed countries such as Australia are well placed to manage and adapt to such cascading
impacts. However, developing nations, especially the least developed, face risks from projected impacts that may exceed capacities to adapt successfully. As climate change intensifies, especially under high-emission pathways (Question 4), adaptive capacities may be exceeded even in developed countries.
The effects of climate change elsewhere will impact AustraliaHuman society is now globally interconnected, dependent on intricate supply chains and a finite resource base. The global population now exceeds 7 billion people and is expected to increase to 9.6 billion by 2050; half of all fresh water and almost a quarter of global plant productivity is appropriated for human use; forecast yield gaps for major crops are increasing, especially in developing countries, and some yields may be reaching biophysical limits; 145 million people live within one metre elevation of sea level, with around 72% of these in Asia.
In this interconnected world, many risks to Australia from climate
change, and potentially many opportunities, arise from impacts outside our national borders. For example: (1) sea-level rise and extreme events will threaten coastal zones, Pacific small island states, and large urban centres in Asian megadeltas; (2) global food production and trading patterns will change as present-day exporters see production fall, and as new exporters emerge; (3) climate change may exacerbate emerging humanitarian and security issues elsewhere in the world, leading to increased demands on Australia for aid, disaster relief and resettlement.
The further global climate is pushed beyond the envelope of relative stability that has characterised the last several thousand years, the greater becomes the risk of major impacts that will exceed the adaptive capacity of some countries or regions. Australia is a wealthy, healthy and educated society well placed to adapt to climate change and with the capacity to help address the impacts of changing climates elsewhere in the world.
left: Climate change can have impacts on infrastructure such as electricity and transport networks. V/Line railway, Victoria. Photo: Dermis50
facing page: Cattle being mustered on CSIRO’s Belmont Research Station in central Queensland. Photo: CSIRO

28 | The science of climate change
A number of factors prevent more accurate predictions of climate change, and many of these will persist While advances continue to be made in our understanding of climate physics and the response of the climate system to increases in greenhouse gases, many uncertainties are likely to persist. The rate of future global warming depends on future emissions, feedback processes that dampen or reinforce disturbances to the climate system, and unpredictable natural influences on climate like volcanic eruptions. Uncertain processes that will affect how fast the world warms for a given emissions pathway are dominated by cloud formation, but also include water vapour and ice feedbacks, ocean circulation changes, and natural cycles of greenhouse gases. Although information from past climate changes largely corroborates model calculations, this is also uncertain due to inaccuracies in the data and potentially important factors about which we have incomplete information.
It is very difficult to tell in detail how climate change will affect individual locations, particularly with respect to rainfall. Even if a global change were broadly known, its regional expression would depend on detailed changes in wind patterns, ocean currents, plants, and soils.
The climate system can throw up surprises: abrupt climate transitions have occurred in Earth’s history, the timing and likelihood of which cannot generally be foreseen with confidence.
Despite these uncertainties, there is near-unanimous agreement among climate scientists that human-caused global warming is realIt is known that human activities since the industrial revolution have sharply increased greenhouse gas concentrations; these gases have a warming effect; warming has been observed; the calculated warming is comparable to the observed warming; and continued reliance on fossil fuels would lead to greater impacts in the future than if this were curtailed. This understanding represents the work of thousands of experts over more than a century,
and is extremely unlikely to be altered by further discoveries.
Uncertainty works in both directions: future climate change could be greater or less than present-day best projectionsAny action involves risk if its outcomes cannot be foreseen and the possibility of significant harm cannot be ruled out. Uncertainty about the climate system does not decrease risk associated with greenhouse gas emissions, because it works in both directions: climate change could prove to be less severe than current estimates, but could also prove to be worse.
Even if future changes from greenhouse gas emissions are at the low end of the expected range, a high-emissions pathway would still be enough to take the planet to temperatures it has not seen for many millions of years, well before humans evolved. In this situation, there can be no assurance that significant harm would not occur.
What are the uncertainties and their implications?
above: Cooling towers at Loy Yang, a brown coal power station near Traralgon in Victoria. It is one of Australia’s biggest power stations by capacity. Photo: ©istockphoto/gumboot
Q8

The science of climate change | 29
Science has an important role in identifying and resolving uncertainties, and informing public policy on climate change All societies routinely make decisions to balance or minimise risk with only partial knowledge of how these risks will play out. This is true in defence, finance, the economy and many other areas. Societies have faced and made choices about asbestos, lead, CFCs, and tobacco. Although each case has unique aspects, all carried scientifically demonstrated but hard-to-quantify risks, and were contentious, in common with climate change.
Mechanisms have been put in place nationally and internationally to facilitate scientific input into decision making. In particular, the
international Intergovernmental Panel on Climate Change (IPCC) has prepared thorough, ‘policy-neutral but policy-relevant’ assessments of the state of knowledge and uncertainties of the science since 1990, with the most recent assessment completed in 2014. Australian scientists have made a major contribution to the quality and integrity of these international IPCC assessments.
above: Helping to test NASA’s earth surface imaging satellite Earth Observing-1 (EO-1), at Lake Frome, South Australia. EO-1 collects much more detailed information about the earth’s surface than previous satellite missions. Photo: CSIRO Atmospheric Research
left: Volcanic eruptions can exert unpredictable natural influences on climate. Photo: ©iStockphoto.com/pxhidalgo
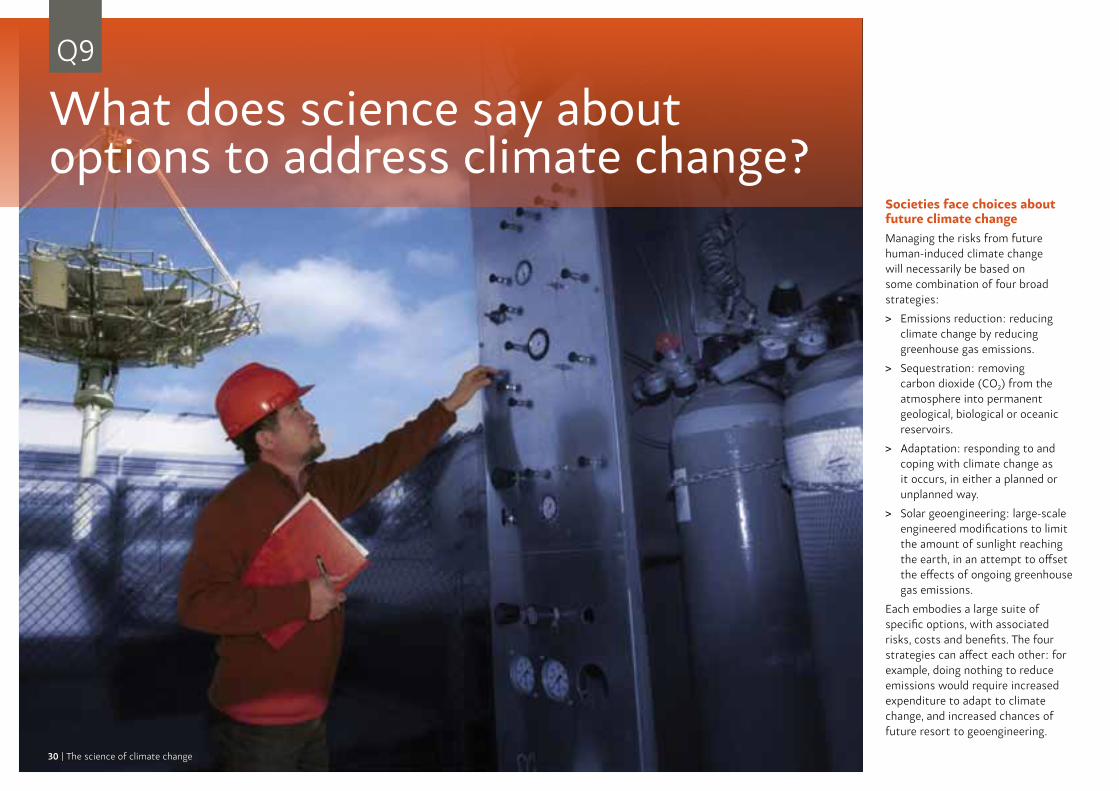
Societies face choices about future climate changeManaging the risks from future human-induced climate change will necessarily be based on some combination of four broad strategies:
> Emissions reduction: reducing climate change by reducing greenhouse gas emissions.
> Sequestration: removing carbon dioxide (CO2) from the atmosphere into permanent geological, biological or oceanic reservoirs.
> Adaptation: responding to and coping with climate change as it occurs, in either a planned or unplanned way.
> Solar geoengineering: large-scale engineered modifications to limit the amount of sunlight reaching the earth, in an attempt to offset the effects of ongoing greenhouse gas emissions.
Each embodies a large suite of specific options, with associated risks, costs and benefits. The four strategies can affect each other: for example, doing nothing to reduce emissions would require increased expenditure to adapt to climate change, and increased chances of future resort to geoengineering.
What does science say about options to address climate change?
Q9
30 | The science of climate change

The science of climate change | 31
Options for emissions reduction centre on carbon dioxideCO2 is the dominant contributor to human-induced climate change (Question 3). If the world adopts a target of keeping warming to less than 2oC above preindustrial temperatures, then future cumulative CO2 emissions would need to be capped at around 30 years worth of current emissions (Question 4). Estimates of the amount of carbon in accessible fossil fuel reserves vary, but all agree that these reserves are at least several times larger than the carbon cap for a 2oC warming limit. Therefore, such a carbon cap, or even a significantly more lenient one, can only be met if a large fraction of available fossil fuel reserves remains unburned or if the CO2 released is captured and permanently sequestered (see below).
Methane, nitrous oxide, halocarbon gases and black-carbon aerosols also have warming effects (Question 3), and reductions in their emissions would reduce the near-term
warming rate. However, their combined contributions to warming over the longer term would be much less than that of CO2, so these reductions alone could not meet a goal such as a 2oC warming limit.
There are many ways to reduce emissions of CO2 and other warming agents, including shifting energy supply away from dependence on fossil fuels; energy efficiency in the domestic, industrial, service and transport sectors; reductions in overall demand through better system design; and efficient reductions in emissions of methane, nitrous oxide, halocarbon gases and black-carbon aerosols. Uptake of all of these options is happening now, and multiple studies have shown that they can be expanded effectively.
Other options are available but have significant collateral effectsIn principle there are two interventions that could relax constraints on future emissions, but with significant uncertainties, risks, costs, and/or limitations. One would be to remove CO2 from combustion exhaust streams or from the air, and sequester it underground, in the deep ocean, or in trees or the soil. The places used to store this carbon need to hold it for many centuries. Such carbon sequestration strategies face logistical, economic and technical challenges.
The other possible intervention would be to reduce Earth’s net absorption of sunlight, for example by generating a stratospheric aerosol layer or placing shields in space. While this could offset the surface warming caused by increasing greenhouse gases, it would do nothing to stop ocean acidification, would need to be maintained in perpetuity, and would carry multiple risks of adverse
additional consequences on a global scale. Our current understanding of the climate system does not enable us to fully understand the implications of such actions.
Some climate change is inevitable and adaptation will be needed Under any realistic future emissions scenario (Question 4), some additional global warming is inevitable and will require adaptation measures. Indeed, adaptation is needed now in response to climate change that has occurred already. The more CO2 that is emitted in the next few decades, the stronger the adaptation measures that will be needed in future. There are limits to the adaptive capacities of both ecosystems and human societies, particularly in less developed regions. Thus, the decisions we make today on emissions will affect not only the future requirements for and costs of adaptation measures, but also their feasibility.
Decisions are informed by climate science, but fundamentally involve ethics and value judgementsAs our society makes choices about managing the risks and opportunities associated with climate change, there is an important role for objective scientific information on the consequences of alternative pathways. Choices also hinge on ethical frameworks and value judgements about the wellbeing of people, economies and the environment. The role of climate science is to inform decisions by providing the best possible knowledge of climate outcomes and the consequences of alternative courses of action.
facing page: Adjusting the Solar Thermal Dish at the Lucas Heights Facility, NSW, which is investigating renewable non-carbon energy options. Photo: North Sullivan Photography above:Capital Windfarm at Lake George, NSW. Photo: Claudio Goodman
For a version with full references visit www.science.org.au/climatechange
©2015 Australian Academy of Science, GPO Box 783, Canberra, ACT 2601, all rights reserved. Selected passages, tables or diagrams may be reproduced, provided the source is acknowledged.
Working Group: Lisa Alexander, Ian Allison AO (co-chair), Michael Bird, John Church FAA FTSE, Matthew England FAA, Jean Palutikof, Michael Raupach FAA FTSE (co-chair), Steven Sherwood, Susan Wijffels
Oversight Committee: Graham Farquhar AO FAA FRS, Roger Gifford, Andrew Gleadow FAA, Kurt Lambeck AO FAA FRS, Trevor McDougall FAA FRS, Graeme Pearman AM FAA FTSE, Steve Rintoul FAA, John Zillman AO FAA FTSE (chair)
Acknowledgments: Hedda Ransan-Cooper (scientific editing), Stephen Pincock (communication consultant), Louise Bell, Jules Kajtar, Jana Sillmann (figure preparation)
Also available in this series is ‘The Science of Immunisation: Questions and Answers’.
right: Rainforest, Far North Queensland. Photo: The.Rohit
Front cover—‘Wollongong Harbour’ by Robert Montgomery, CC BY, https://flic.kr/rmonty119/13611846453/ | Inside front cover—‘Pre-winter storm, Southwestern Australia’ by NASA’s Marshall Space Flight Center, CC BY-NC, https://flic.kr/nasamarshall/13782454574/ | Page 4—‘Carrum Beach’ by Neil O’Connor https://flic.kr/gifas/11994390914/ | Page 6—Untitled by Kyle D. Gahlau on Marion Doss, CC BY-NC-SA, https://flic.kr/ooocha/3061655857/ | Page 8—©iStockphoto.com/John Carnemolla | Page 10—(top right) ‘Ice core vitals’ by NASA/ Lora Koenig, CC BY, https://flic.kr/nasa_ice/5433412179/; (top left) ‘Pine tree cross section’ by LandLearn NSW, CC BY-NC-SA, https://flic.kr /photos/landlearnnsw/2987640584/ | Page 14—‘Wollongong at night—from Bulli Tops’ by Jim Vrckovski https://flic.kr/jvrckovski/4416104845/ | Page 15—‘Rainforest canopy’ by Robert Kerton, CC BY, http://www.scienceimage.csiro.au/tag/trees/i/1595/rainforest-canopy/ | Page 16—‘NASA Blue Marble 2007 East by NASA/Goddard Space Flight Center/Reto Stöckli, CC BY, https://flic.kr/gsfc/4427417620/ | Page 18—‘Cotter Dam’ by Nick Pitsas, CC BY, http://www.scienceimage.csiro.au/image/11545/cotter-dam/ | Page 19—‘The atrium’ by Sardaka, CC BY, http://en.wikipedia.org/wiki/1_Bligh_Street#mediaviewer/File:1_One_Bligh_Street2.jpg | Page 20—‘TC Carlos – Rapid Creek River Road by Charles Strebor, CC BY-NC-SA, https://flic.kr/rantz/5450621144/ | Page 22—‘Coogee Beach’ by Robert Montgomery, CC BY, https://flic.kr/rmonty119/5040576001/ | Page 24—(right) ‘Starbug in action’ by QCAT, CC BY, http://www.scienceimage.csiro.au/image/3818/starbug-in-action/ | Page 26—‘Brahman cattle’ by CSIRO, CC BY, http://www.scienceimage.csiro.au/image/10875/brahman-cattle/ | Page 29—‘Blue sheet on Lake Frome’ by CSIRO Atmospheric Research, CC BY, http://www.scienceimage.csiro.au/tag/scientific-research/i/3394/blue-sheet-on-lake-frome/ | Page 30—‘Adjusting the solar thermal dish at the Lucas Heights facility’ by North Sullivan Photography, CC BY, http://www.scienceimage.csiro.au/image/2733/adjusting-the-solar-thermal-dish-at-the-lucas-heights-facility/ | Page 31—‘Capital windfarm’ by Claudio Goodman https://www.flickr.com/claudiogoodman/15187470369/ | Back cover—‘Australia’ by The.Rohit, CC BY-NC, https://flic.kr/rohit_saxena/3335486718/


