34
The Scientific Graphics Toolkit (A Technical Overview) Donald Denbo UW-JISAO/NOAA-PMEL http://www.epic. noaa . gov /java/ sgt
| Date post: | 29-Dec-2015 |
| Category: |
Documents |
| Upload: | norman-briggs |
| View: | 222 times |
| Download: | 0 times |
The
Scientific Graphics Toolkit(A Technical Overview)
Donald DenboUW-JISAO/NOAA-PMEL
http://www.epic.noaa.gov/java/sgt
January 11, 2002 NVODS/DODS Technical Workshop
2
IntroductionThe Scientific Graphics Toolkit (SGT) is a collection of Java classes and interfaces to create graphical applications.SGT is a toolkit, not an application. Using SGT requires moderate Java programming skills.SGT does have several classes that make creating a graphical application easier, but using SGT does require producing code.With a modicum of effort a Java programmer can, using SGT, create graphical Java applications that are easy to use.SGT has had 5588 downloads to 2393 unique sites in 60 countries since March 2000 (as of Jan 7, 2002).
January 11, 2002 NVODS/DODS Technical Workshop
3
HistorySgt was developed to allow a NOAAServer user to interactively preview data and overlay plots.Originally developed using jdk 1.0.3, now uses jdk 1.1.x. Next release will require jdk 1.2 or newer.Tutorial made available October 25, 2001.SGT release dates
1.0 – March 20, 2000 2.0 – March 14, 2001 2.1 – December 14, 2001

January 11, 2002 NVODS/DODS Technical Workshop
4
SGT ApplicationsOceanShare
a collaborative tool for distributed in situ data visualization
Being customized for Fisheries-Oceanography use http://www.epic.noaa.gov/collab/ (pdf paper)
ncBrowse a netCDF file browser for local and remote netCDF files
http://www.epic.noaa.gov/java/ncBrowse/ (power point presentation)
3452 downloads to 1680 unique sites in 48 countries since February 2000 (as of Jan 7, 2002).
Climate Data Portal client A distributed in-situ data application
http://www.epic.noaa.gov/cdp/ (power point presentation)
Although the CDPclient has not been publicly released, it has had 125 downloads to 51 unique sites in 6 countries.
January 11, 2002 NVODS/DODS Technical Workshop
5
Outline
Demos and ExamplesTechnical Issues Design philosophy & Goals Using standard Java idioms Design Patterns
ArchitectureReal world applications using SGT
January 11, 2002 NVODS/DODS Technical Workshop
6
Outline
Demos and Examples (applet demo)
Technical Issues Design philosophy & Goals Using standard Java idioms Design Patterns
ArchitectureReal world applications using SGT

January 11, 2002 NVODS/DODS Technical Workshop
7
TAOMap
Plot built from basic sgt componentsUses ValueIcon, which implements DraggableUses a Point Key, which implements Moveable and Selectable
http://www.epic.noaa.gov/java/sgt/sgt_demos.shtml

January 11, 2002 NVODS/DODS Technical Workshop
8
JRealTimeDemo
Built from basic sgt components.Data class uses PropertyChangeEvents to notify sgt.Sgt then updates plot.
January 11, 2002 NVODS/DODS Technical Workshop
9
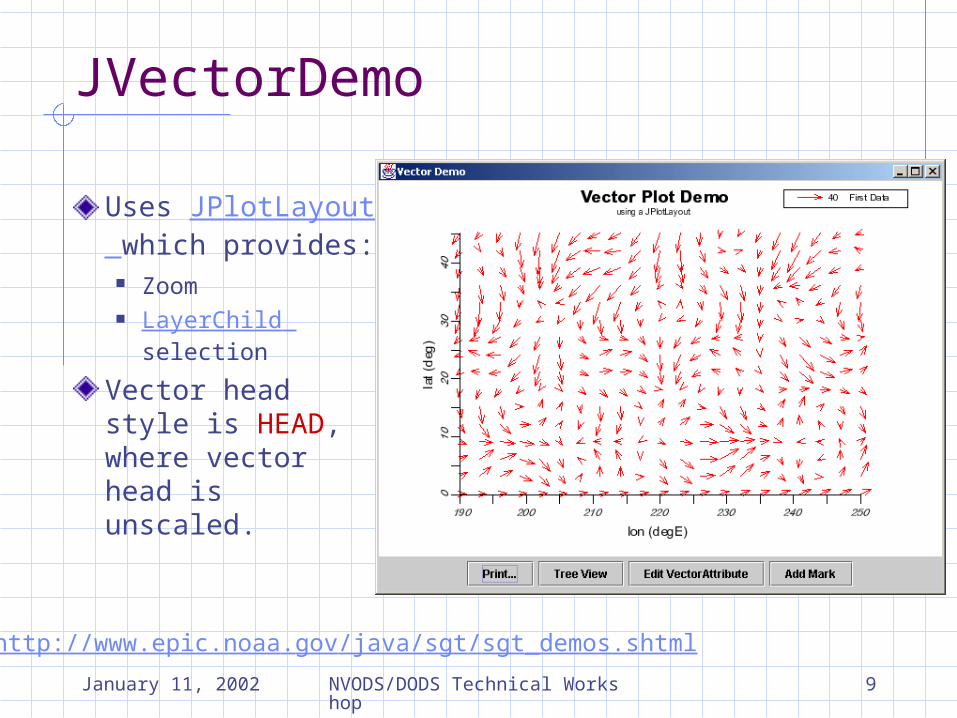
JVectorDemo
Uses JPlotLayout which provides:
Zoom LayerChild
selection
Vector head style is HEAD, where vector head is unscaled.
http://www.epic.noaa.gov/java/sgt/sgt_demos.shtml
January 11, 2002 NVODS/DODS Technical Workshop
10
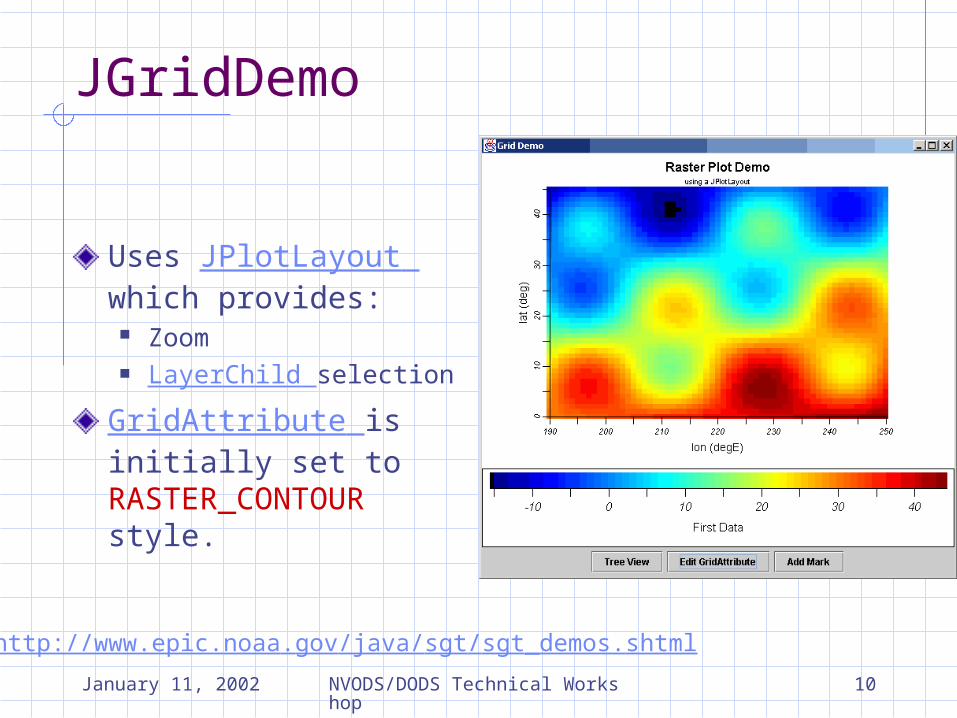
JGridDemo
Uses JPlotLayout which provides:
Zoom LayerChild selection
GridAttribute is initially set to RASTER_CONTOUR style.
http://www.epic.noaa.gov/java/sgt/sgt_demos.shtml
January 11, 2002 NVODS/DODS Technical Workshop
11
Outline
Demos and ExamplesTechnical Issues Design philosophy & Goals Using standard Java idioms Design Patterns
ArchitectureReal world applications using SGT
January 11, 2002 NVODS/DODS Technical Workshop
12
Design Philosophy & GoalsDon’t provide too much functionality in the toolkit
Require developer to disambiguate zoom request (which layer) Use interfaces for data model specification Hide as much of the internal machinery as possible
Provide utility classes to support developer Dialogs to set/edit graphics properties Plot layout class to support simple graphics Basic implementations of data model interfaces
Keep toolkit flexible and extensibleGIS style layer approachSupport several display types
Time series/Time axes X-Y plot 2-D contour and “pixel” plots Vector plot Point-Value plot
January 11, 2002 NVODS/DODS Technical Workshop
13
Using standard Java idioms(don’t reinvent the wheel)
Basic graphics toolkits AWT support (now being deprecated)
Pane is a container Printing
Swing support Scrolling Printing Repaint (refresh) Minimum, maximum, and preferred size JPane is a container
JavaBeans idiom Use set/get for parameters Use add/remove for event listeners Use set/is for boolean parameters
January 11, 2002 NVODS/DODS Technical Workshop
14
Don’t reinvent the wheel (cont…)
Events Mouse events
Trapped by SGT Object selection Object move/drag operations Zoom rectangle handling
Passed on by SGT All others…
SGT internal events (not really events!) Add/remove SGT components Modify component appearance (eg. Label, axis)
Property change events When a property changes value (eg. LineAttribute) When a value changes in a data object When the range of a data object changes
January 11, 2002 NVODS/DODS Technical Workshop
15
Design PatternsStrategy. Define a family of algorithms, encapsulate each one, and make them interchangeable.
Transform, TimeAxisStyle, CartesianRenderer
Proxy. Provide a surrogate or placeholder for another object to control access to it.
Pane, JPane
Abstract Factory. Provide an interface for creating families of related or dependent objects without specifying their concrete classes.
CartesianRenderer, GridCartesianRenderer, LineCartesianRenderer, VectorCartesianRenderer, PointCartesianRenderer
January 11, 2002 NVODS/DODS Technical Workshop
16
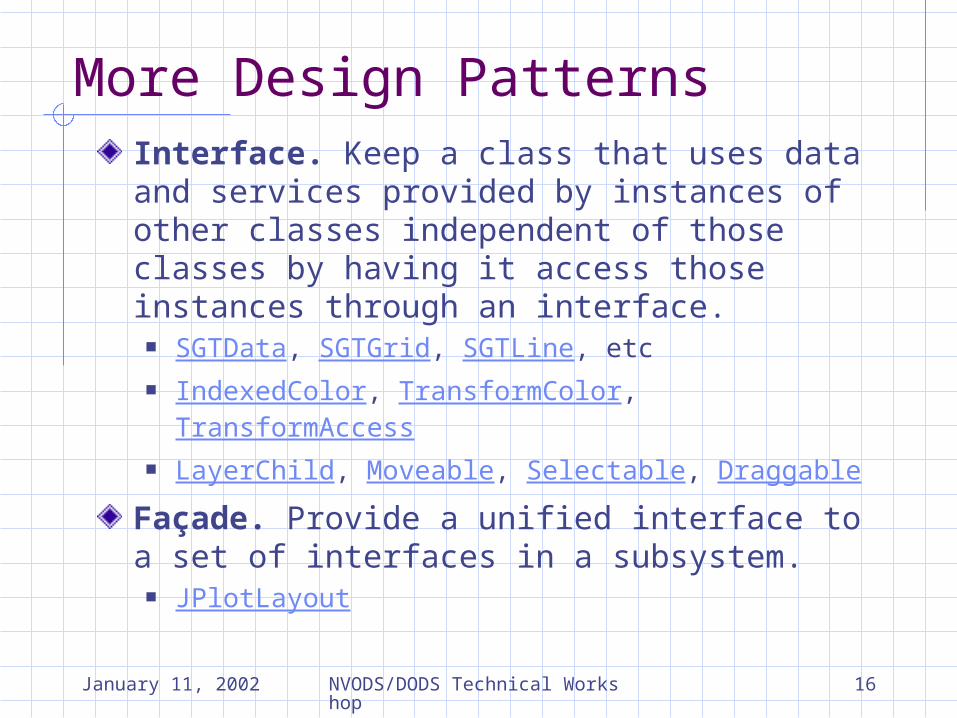
More Design PatternsInterface. Keep a class that uses data and services provided by instances of other classes independent of those classes by having it access those instances through an interface.
SGTData, SGTGrid, SGTLine, etc IndexedColor, TransformColor, TransformAccess LayerChild, Moveable, Selectable, Draggable
Façade. Provide a unified interface to a set of interfaces in a subsystem.
JPlotLayout
January 11, 2002 NVODS/DODS Technical Workshop
17
Outline
Demos and ExamplesTechnical Issues Design philosophy & Goals Using standard Java idioms Design Patterns
ArchitectureReal world applications using SGT
January 11, 2002 NVODS/DODS Technical Workshop
18
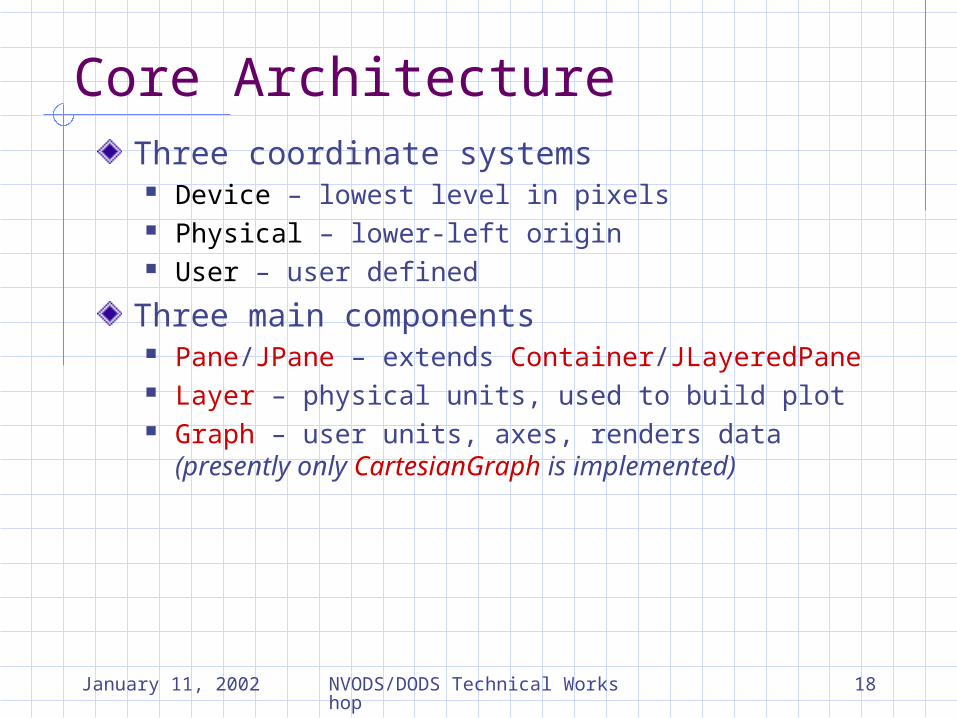
Core ArchitectureThree coordinate systems
Device – lowest level in pixels Physical – lower-left origin User – user defined
Three main components Pane/JPane – extends Container/JLayeredPane Layer – physical units, used to build plot Graph – user units, axes, renders data (presently
only CartesianGraph is implemented)
January 11, 2002 NVODS/DODS Technical Workshop
19
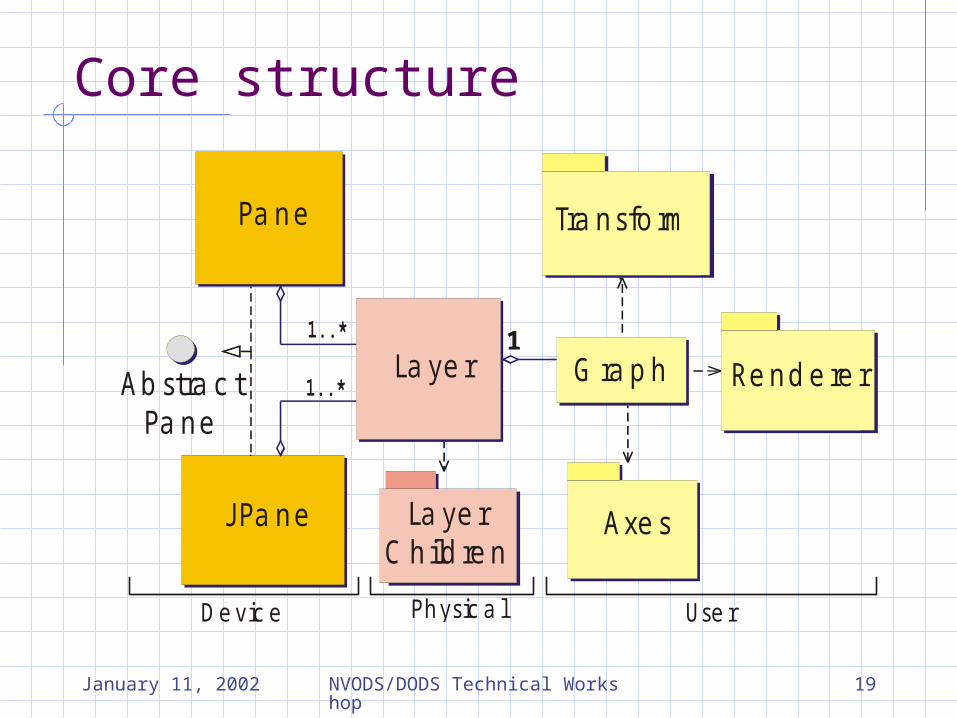
Core structure
Pa ne
J Pa ne
Ab stra c tPa ne
La ye r
La ye rC hild re n
Tra nsfo rm
Re nd e re rG ra p h
Axe s
De vic e Physic a l Use r
1
January 11, 2002 NVODS/DODS Technical Workshop
20
LayersContain a single Graph object and many LayerChild objects.Many Layers can be associated with a single PaneLayers can share AxisTransforms via their CartesianGraph objectsLayerChild objects use physical coordinates
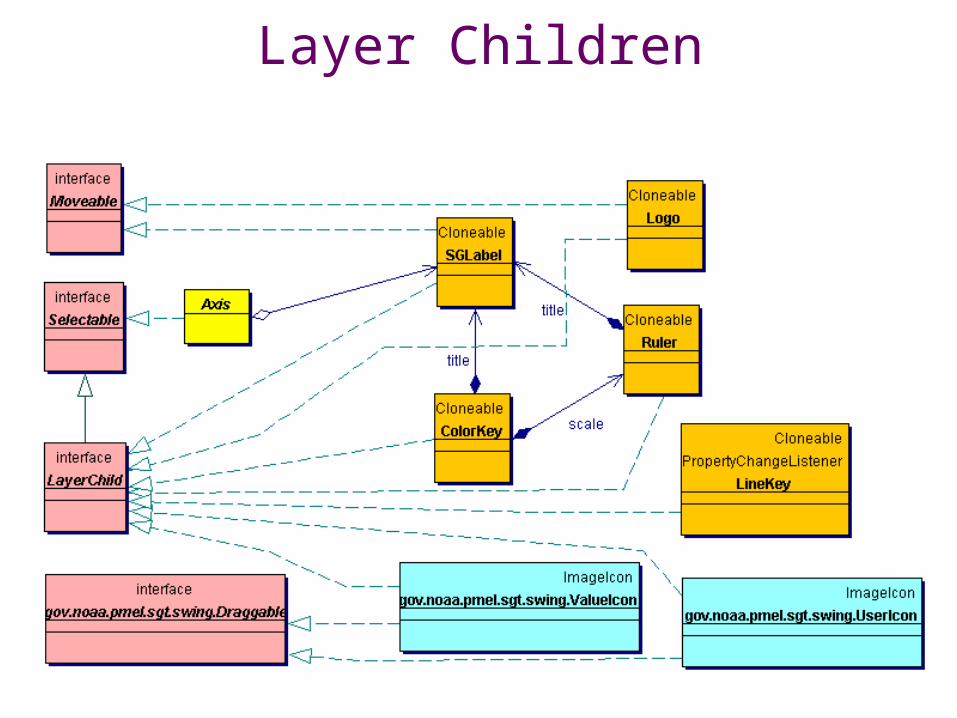
Layer Children
January 11, 2002 NVODS/DODS Technical Workshop
22
Rendering dataA CartesianGraph object aggregates:
Zero or more X or Y axes A renderer appropriate for the data type and
attribute (e.g., PointCartesianRenderer, LineCartesianRenderer, or GridCartesianRenderer)
One X AxisTransform One Y AxisTransform
AxisTransforms provide a user to physical coordinate transformation for space or time

Graph and Renderers
January 11, 2002 NVODS/DODS Technical Workshop
24
Space and Time AxesSpaceAxis provides a visual scale for the spatial user to physical coordinate transformTimeAxis creates a visual scale for the GeoDate to physical coordinate transformTimeAxis has several “styles” that can be used depending on the temporal span
Minute-Hour Hour-Day Day-Month Month-Year Year-Decade
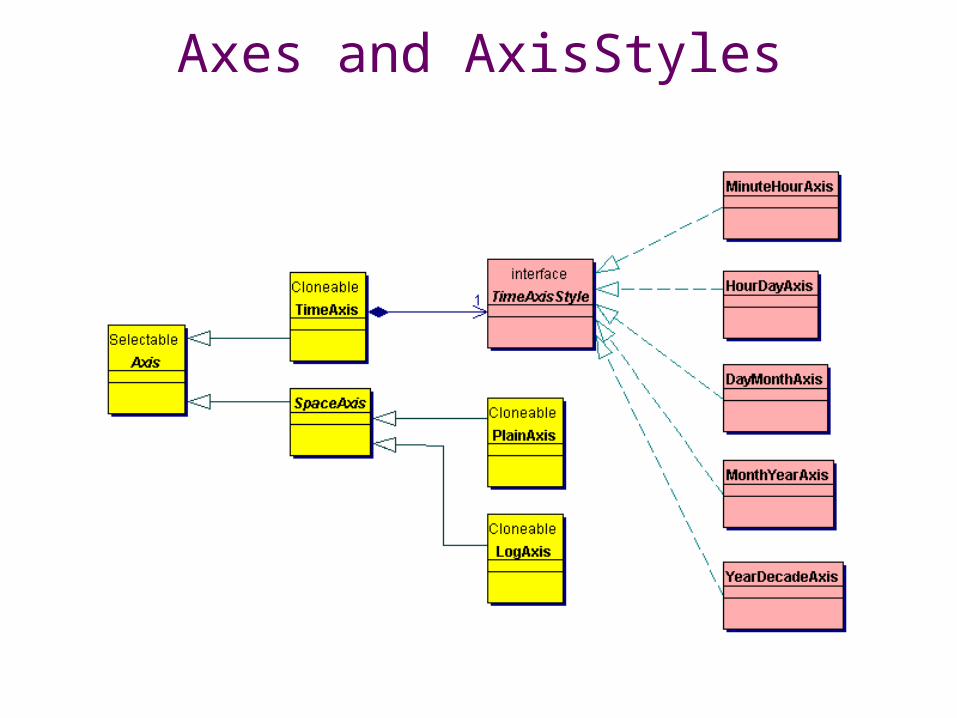
Axes and AxisStyles

January 11, 2002 NVODS/DODS Technical Workshop
26
Sgt Data ModelData model needs to
Support X-Y, contour, raster, vector, and point plots Be compact and “light-weight” Throw events to notify applications of data and/or
range changes.
Accomplished the above by Supporting “plottable” objects
One- and two-dimensional arrays Coordinate information Units and titles
Data model implemented using java interfaces
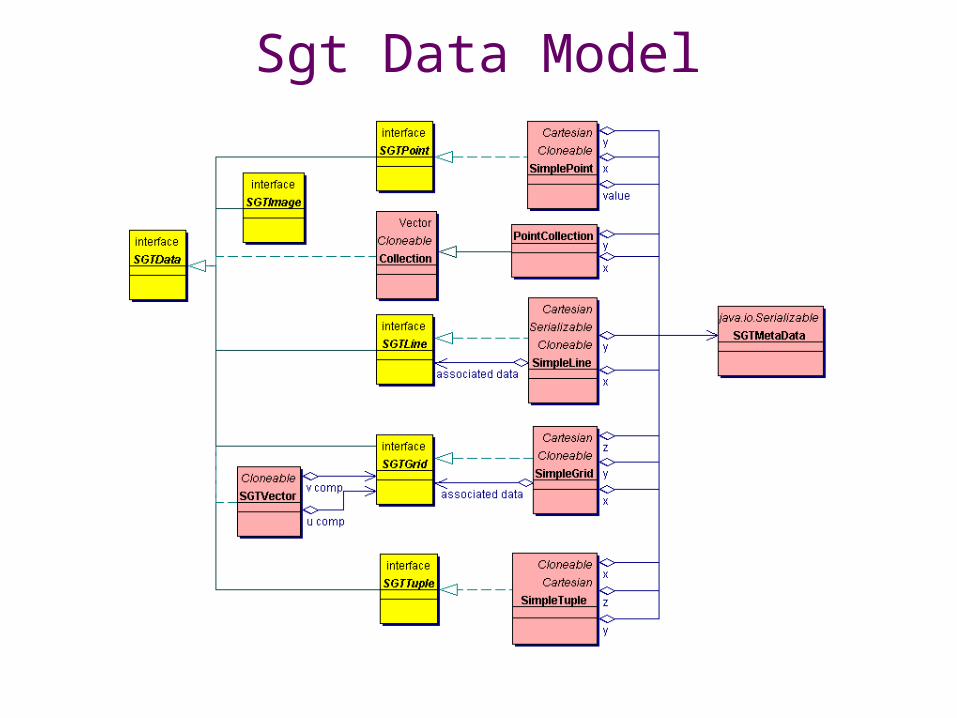
Sgt Data Model
January 11, 2002 NVODS/DODS Technical Workshop
28
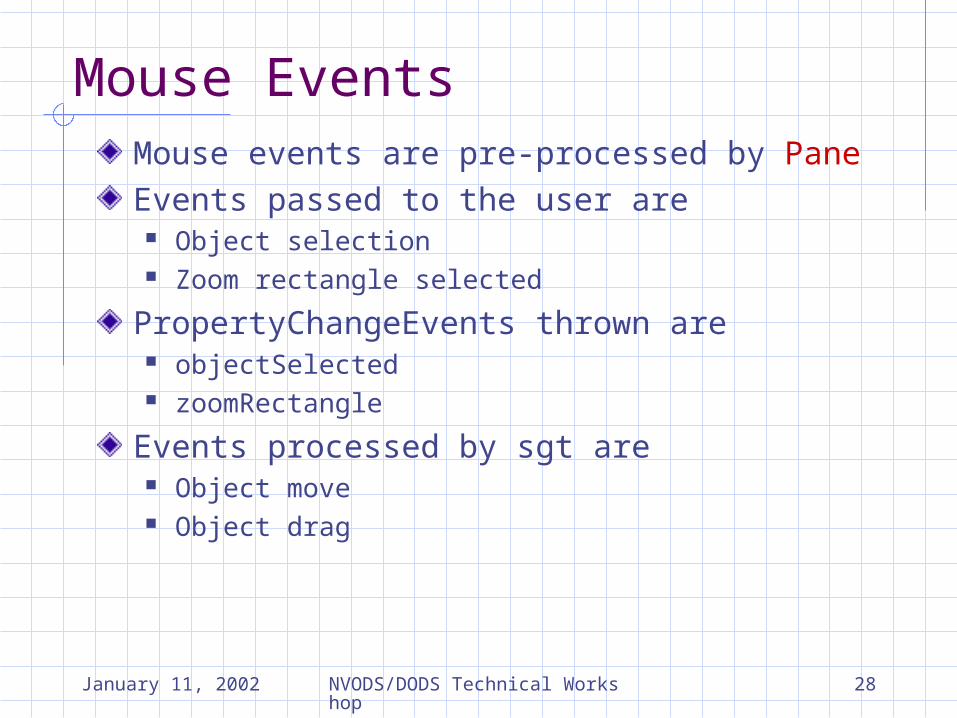
Mouse EventsMouse events are pre-processed by PaneEvents passed to the user are
Object selection Zoom rectangle selected
PropertyChangeEvents thrown are objectSelected zoomRectangle
Events processed by sgt are Object move Object drag
January 11, 2002 NVODS/DODS Technical Workshop
29
Outline
Demos and ExamplesTechnical Issues Design philosophy & Goals Using standard Java idioms Design Patterns
ArchitectureReal world applications using SGT
January 11, 2002 NVODS/DODS Technical Workshop
30
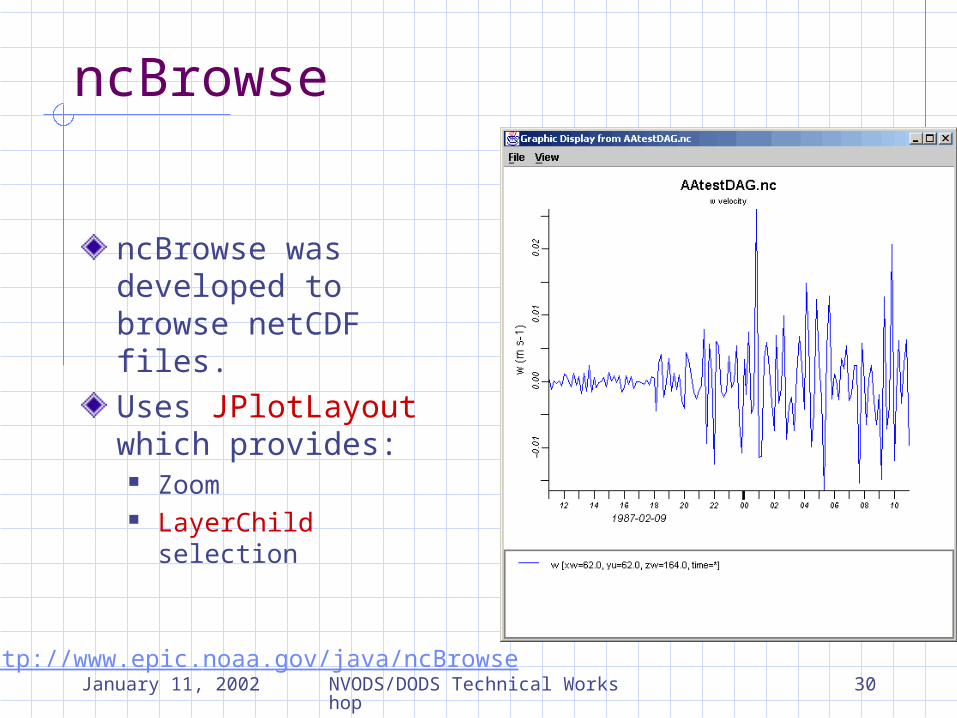
ncBrowse
ncBrowse was developed to browse netCDF files.Uses JPlotLayout which provides:
Zoom LayerChild selection
http://www.epic.noaa.gov/java/ncBrowse
January 11, 2002 NVODS/DODS Technical Workshop
31
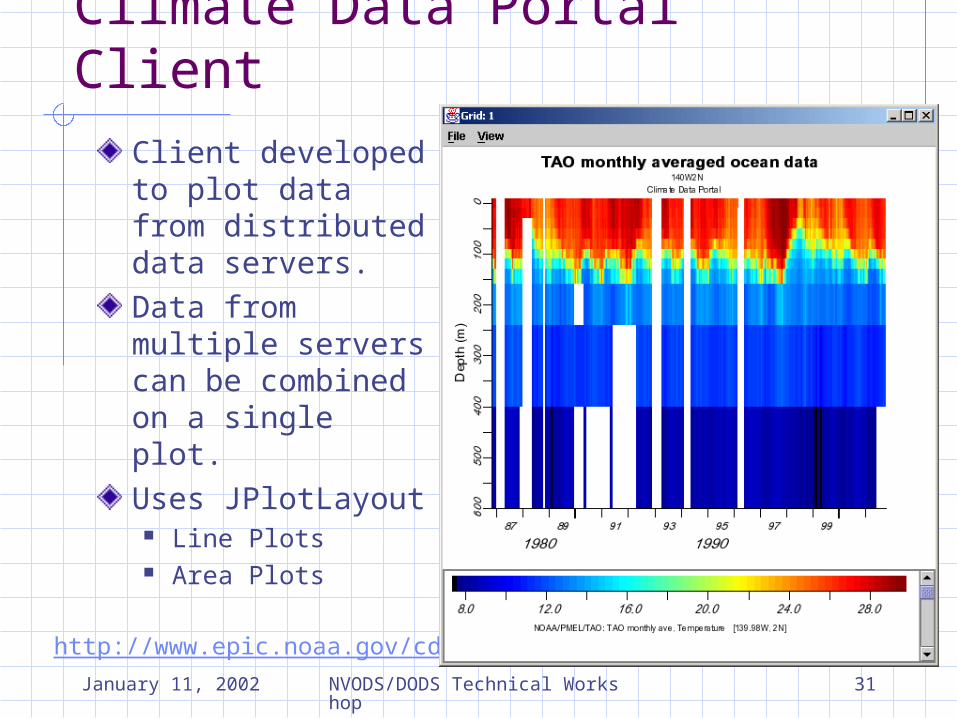
Client developed to plot data from distributed data servers.Data from multiple servers can be combined on a single plot.Uses JPlotLayout
Line Plots Area Plots
http://www.epic.noaa.gov/cdp/
Climate Data Portal Client
January 11, 2002 NVODS/DODS Technical Workshop
32
OceanShareOceanShare provides
Collaborative work environment Local and network access of data sets Access to Habanero tools (whiteboard, chat, etc.)
Implemented using LineProfileLayout Line style (highlight, mark, or solid) Line color Interactive zoom UserIcon and ValueIcon (implements LayerChild
interface)
http://www.epic.noaa.gov/collab/

January 11, 2002 NVODS/DODS Technical Workshop
33
What next?Finish GridAttributeDialog. (enables GridAttribute, contour, and ColorMap editing.)Next version (2.2) will
use Java2D to provide native support of physical to device coordinate transformation
Remove deprecated classes and drop jdk1.1 support
January 11, 2002 NVODS/DODS Technical Workshop
34
Real World Applications using SGT
SGT – Java graphics toolkit A Tutorial of the Scientific Graphics Toolkit, NOAATech
2002. “Interactive Graphics Toolkit for Java Applications and Web
Applets”, American Meteorological Society paper, January 2001.
SGT home page.
ncBrowse – netCDF file browser ncBrowse home page.
OceanShare – collaborative tool for distributed in-situ data “OceanShare: Interactive Access to Distributed In Situ Data in a Collaborative Tool Environment”, American Meteorological Society paper, January 2000.
GOIN 99 Presentation.
Climate Data Portal – distributed in-situ data access Climate Data Portal home page.


