21
©2013 ScrumInc . © 2011 Scrum Inc. The Scrum Leader’s Dashboard Transparency without the waste of traditional reporting Host: Jeff Sutherland Presenter: Alex Brown

© 2013 Scrum
Inc.
© 2011 Scrum Inc.
The Scrum Leader’s Dashboard Transparency without the waste of traditional reporting
Host: Jeff Sutherland Presenter: Alex Brown

© 2013 Scrum
Inc.
3
: Who We Are
Scrum Inc. is the Agile leadership company of Dr. Jeff Sutherland, co-creator of Scrum. We are based in Cambridge, MA.
We maintain the Scrum methodology by: • Capturing and codifying evolving best practices, • Conducting original research on organizational behavior • Adapting the methodology to an ever-expanding set of
industries, processes and business challenges
We also help companies achieve the full benefits of Scrum through our full suite of support services: • Training (Scrum Master, Product Owner, Agile Leadership, webinars, etc.) • Consulting (linking Scrum and business strategy, customizing Scrum) • Coaching (hands-on support to Scrum teams) • Publishing and new content development
Find out more at www.scruminc.com.
We run our services company using Scrum as the primary management framework, making us a living laboratory on the cutting edge of “Enterprise Scrum”
© 2013 Scrum
Inc.
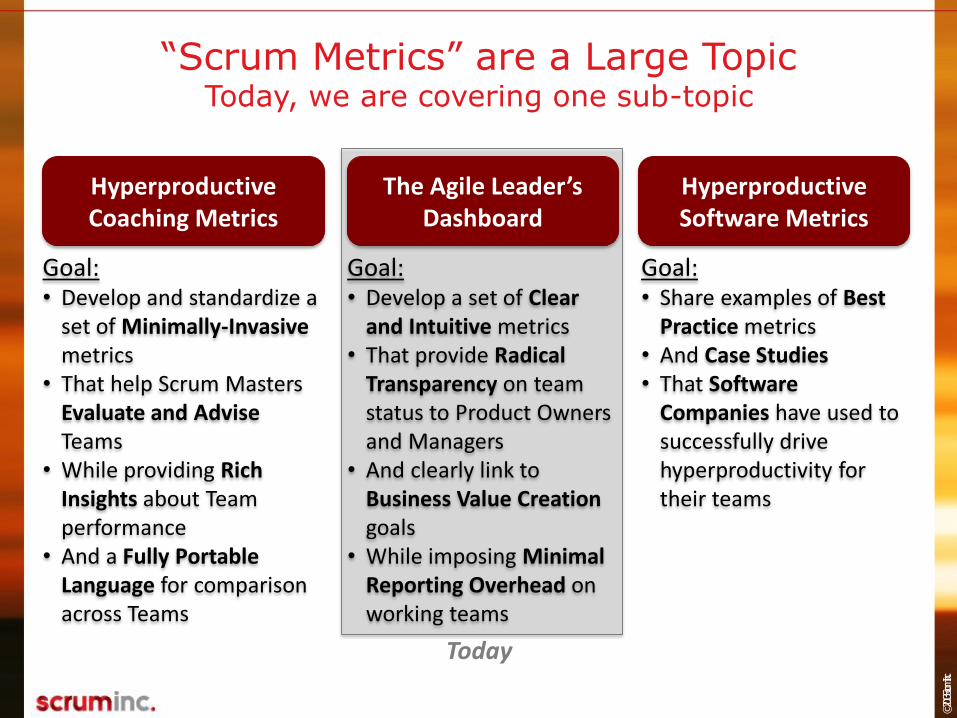
Today
“Scrum Metrics” are a Large Topic Today, we are covering one sub-topic
Hyperproductive Coaching Metrics
The Agile Leader’s Dashboard
Hyperproductive Software Metrics
Goal: • Develop and standardize a
set of Minimally-Invasive metrics
• That help Scrum Masters Evaluate and Advise Teams
• While providing Rich Insights about Team performance
• And a Fully Portable Language for comparison across Teams
Goal: • Develop a set of Clear
and Intuitive metrics • That provide Radical
Transparency on team status to Product Owners and Managers
• And clearly link to Business Value Creation goals
• While imposing Minimal Reporting Overhead on working teams
Goal: • Share examples of Best
Practice metrics • And Case Studies • That Software
Companies have used to successfully drive hyperproductivity for their teams
© 2013 Scrum
Inc.
2
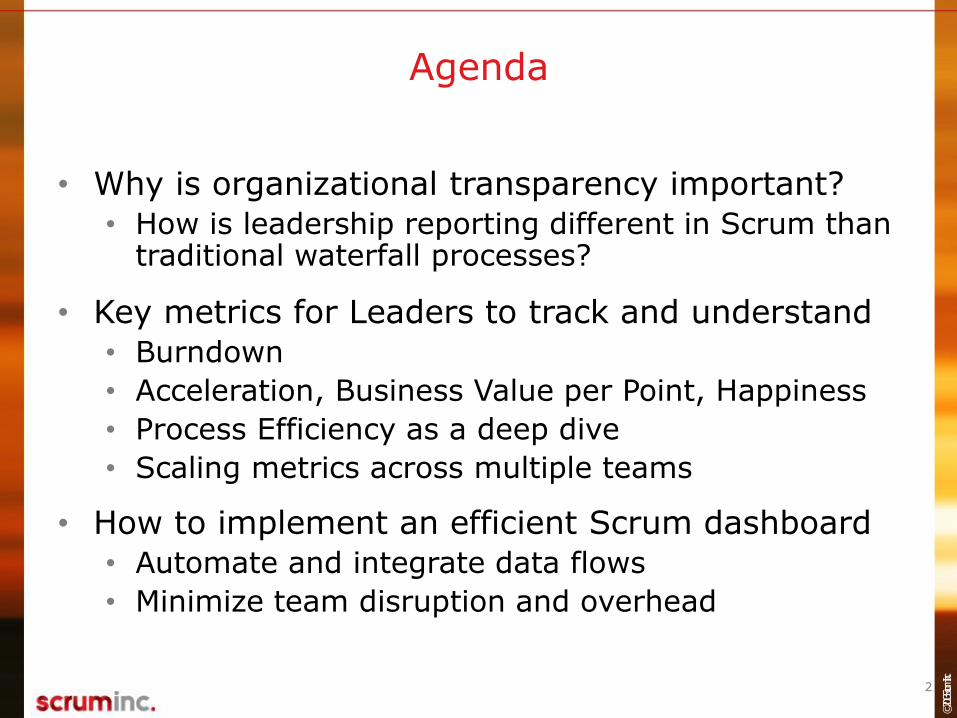
Agenda
• Why is organizational transparency important?
• How is leadership reporting different in Scrum than traditional waterfall processes?
• Key metrics for Leaders to track and understand
• Burndown
• Acceleration, Business Value per Point, Happiness
• Process Efficiency as a deep dive
• Scaling metrics across multiple teams
• How to implement an efficient Scrum dashboard
• Automate and integrate data flows
• Minimize team disruption and overhead

© 2013 Scrum
Inc.
The Three Key Roles of Organizational Leadership
Establish Shared Vision and Goals
Maintain Visibility of Current Status
& Trajectory
Support group motivation and accountability
• Define and maintain a common vision of the organization’s purpose, strategy, and how success should be measured
• Ensure that this vision is clearly understood by all employees • Leverage a shared vision to focus effort and prevent wasted
effort that does not support the organization’s end goals
• Monitor progress toward organizational goals using a combination of end-state success metrics and leading indicators that all necessary pieces are coming together
• Intervene if needed to maintain steady progress toward goals
• Establish clear and consistent incentives that encourage every member of the team to apply their talents efficiently toward desired group outcomes
• Wherever possible, avoid situations that put individual incentives in conflict with desired group outcomes
5

© 2013 Scrum
Inc.
Leaders Accomplish their Role Differently Using Scrum Versus Traditional “Waterfall” Approaches
Maintain Visibility of
Current Status & Trajectory
Leadership Role Waterfall Tools Scrum Tools
• Monthly and quarterly financial reports
• Project plans & Gantt charts
• Project road map tools • Hierarchical reporting
structure
• Team Velocity • Product and sprint backlog • Sprint and release burn
down chart • Key metrics dashboard
Sprint-level finances ROI Happiness
• Technical debt working list
6
Emphasis on measuring deviation from plan
Emphasis on tracking progress toward goals, identifying impediments, and estimating future performance
© 2013 Scrum
Inc.
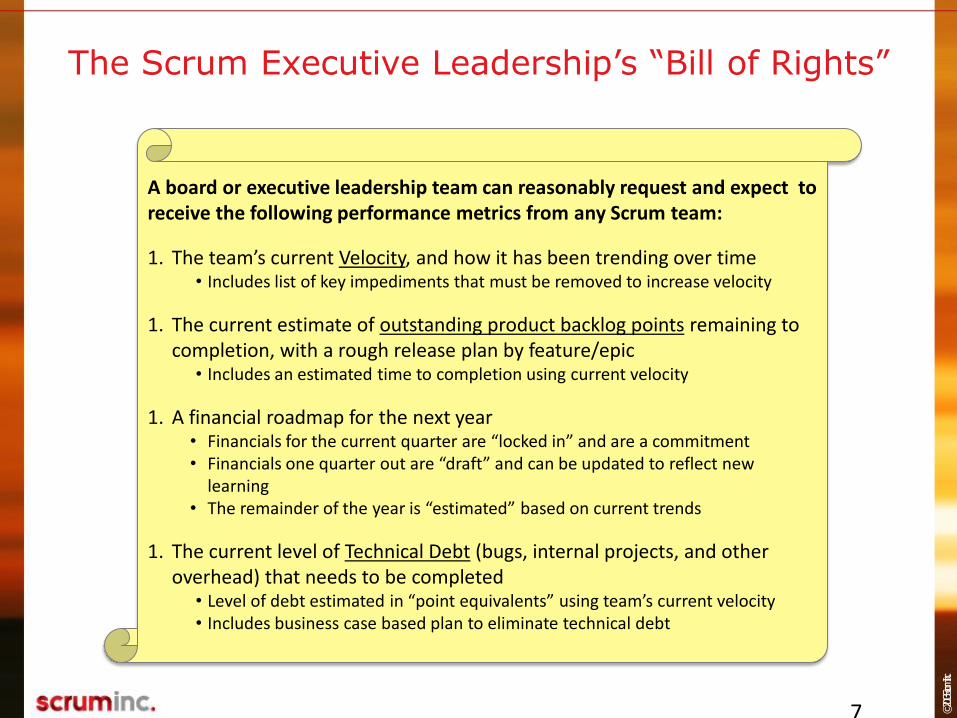
The Scrum Executive Leadership’s “Bill of Rights”
A board or executive leadership team can reasonably request and expect to receive the following performance metrics from any Scrum team:
1. The team’s current Velocity, and how it has been trending over time • Includes list of key impediments that must be removed to increase velocity
1. The current estimate of outstanding product backlog points remaining to completion, with a rough release plan by feature/epic
• Includes an estimated time to completion using current velocity
1. A financial roadmap for the next year • Financials for the current quarter are “locked in” and are a commitment • Financials one quarter out are “draft” and can be updated to reflect new
learning • The remainder of the year is “estimated” based on current trends
1. The current level of Technical Debt (bugs, internal projects, and other overhead) that needs to be completed
• Level of debt estimated in “point equivalents” using team’s current velocity • Includes business case based plan to eliminate technical debt
7
© 2013 Scrum
Inc.
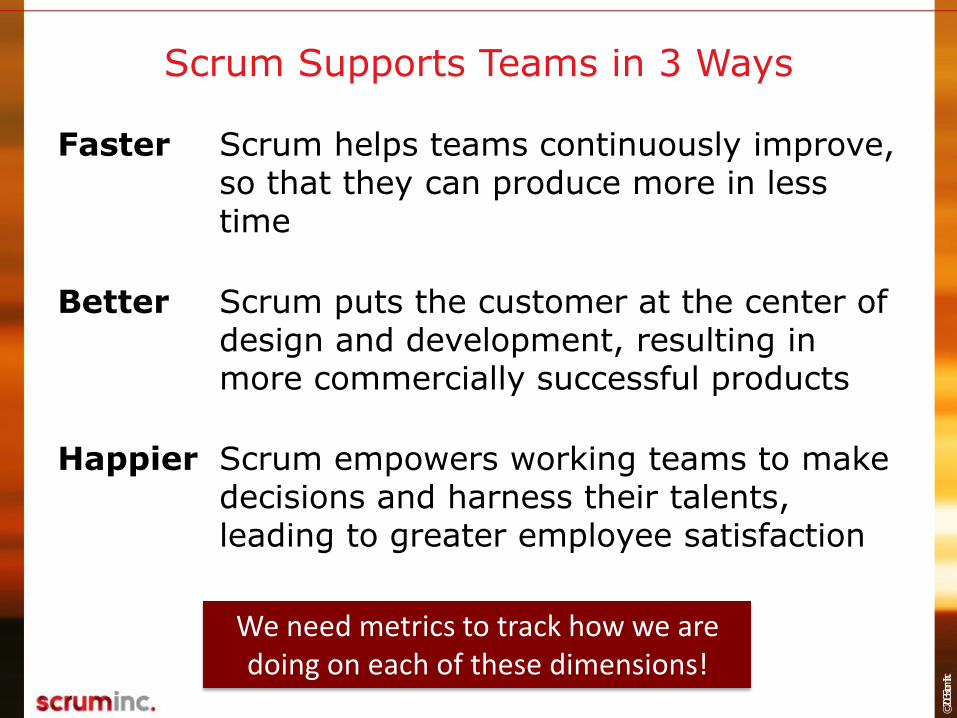
Scrum Supports Teams in 3 Ways
Faster Scrum helps teams continuously improve, so that they can produce more in less time
Better Scrum puts the customer at the center of design and development, resulting in more commercially successful products
Happier Scrum empowers working teams to make decisions and harness their talents, leading to greater employee satisfaction
We need metrics to track how we are doing on each of these dimensions!

© 2013 Scrum
Inc.
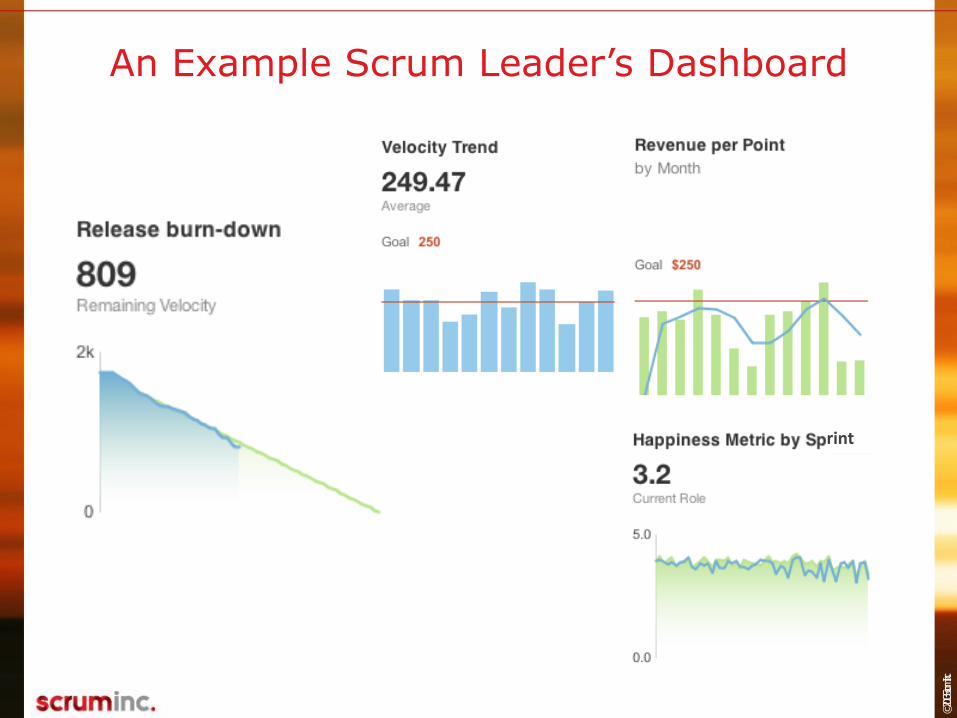
Five-Metric Dashboard to Track Progress
1. Release Burndown chart • Will we finish as expected?
2. Acceleration – Velocity over time
• How much are we producing?
3. Business value per point • Are we producing the right things?
4. Happiness metric • Are we doing it sustainably?
5. Process efficiency
• Deep dive on specific issues
Sprint
Velocity (points)
Quarter
Rev $/point
Sprint
Happiness rating
Role Company
Step 1 Step 2 Step 3 Step 4 Queue
5 20
2 10
60
3 17
6 30
+ + + + = 16
137 (12%)
Sprint
Release Backlog (points)
400

© 2013 Scrum
Inc.
Looking at Metrics Together Reveals Insight
Sprint
Velocity (points)
Quarter
Rev $/point
Sprint
Happiness rating
The Team is working well
Sprint
Velocity (points)
Quarter
Rev $/point
Sprint
Happi-ness
Team is driving velocity by focusing on easy, low-
value stories
Sprint
Velocity (points)
Quarter
Rev $/point
Sprint
Happi-ness
Team is burning out to deliver results
A B C
© 2013 Scrum
Inc.
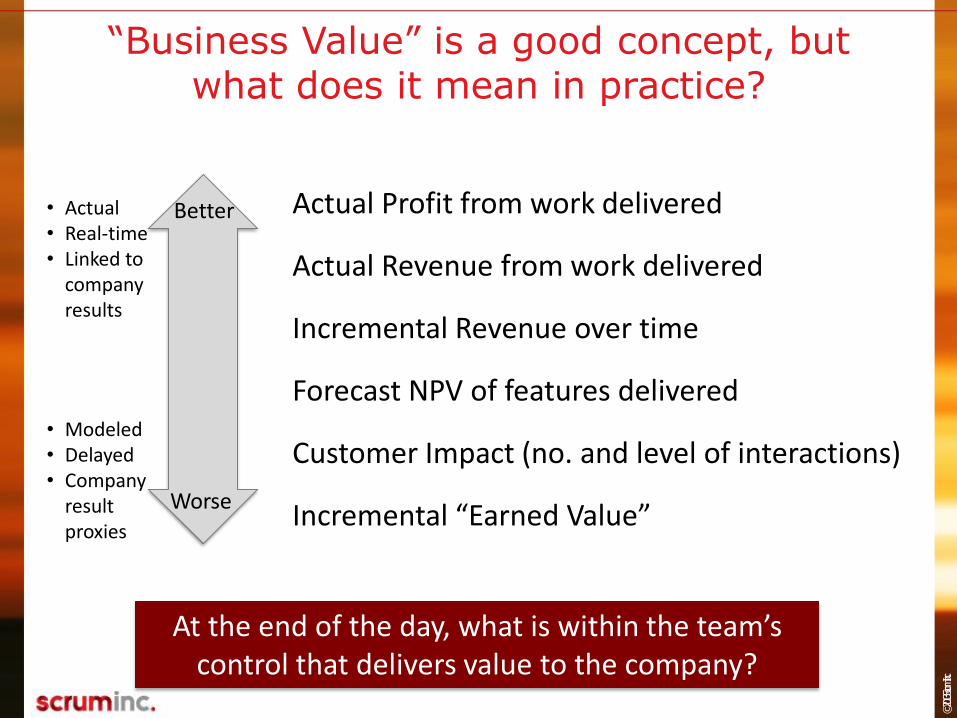
“Business Value” is a good concept, but what does it mean in practice?
At the end of the day, what is within the team’s control that delivers value to the company?
Actual Profit from work delivered
Actual Revenue from work delivered
Incremental Revenue over time
Forecast NPV of features delivered
Customer Impact (no. and level of interactions)
Incremental “Earned Value”
Better
Worse
• Actual • Real-time • Linked to
company results
• Modeled • Delayed • Company
result proxies
© 2013 Scrum
Inc.
© 1993-2012 Jeff Sutherland
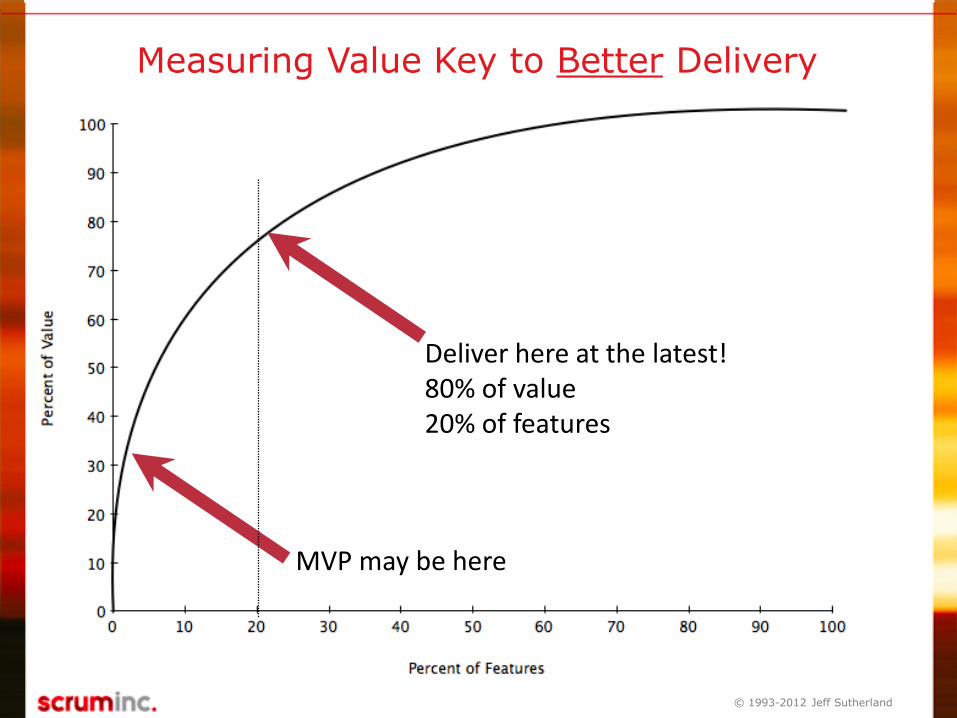
Measuring Value Key to Better Delivery
Deliver here at the latest! 80% of value 20% of features
MVP may be here

© 2013 Scrum
Inc.
What Does it Mean When BVPP Drops?
BVPP = Points (velocity)
Business Value
• Is “point inflation” occurring?
• Is the business value of each epic known?
• Is BV explicitly built into backlog prioritization?
• Are there no more high-value features left to deliver?
Improve Product Ownership process
Release product Get feedback on valuable features
Re-establish reference stories
© 2013 Scrum
Inc.
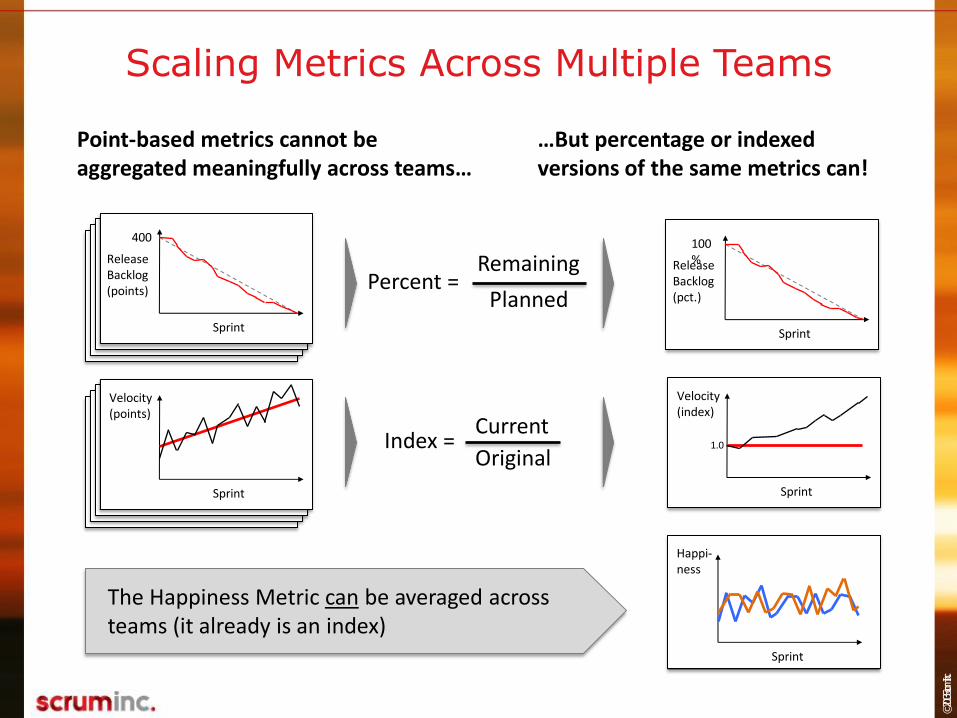
Scaling Metrics Across Multiple Teams
The Happiness Metric can be averaged across teams (it already is an index)
Sprint
Happi-ness
Point-based metrics cannot be aggregated meaningfully across teams…
…But percentage or indexed versions of the same metrics can!
Index = Current
Original
Sprint
Velocity (points)
Percent = Planned
Remaining
Sprint
Velocity (index)
1.0
Sprint
Release Backlog (points)
400
Sprint
Release Backlog (pct.)
100%

© 2013 Scrum
Inc.
Automatic Reporting Via Scrum Tools
Backlog Tool
$
Financial Data Happiness Tool
API connection
1. Tap into data the team should already collect to manage their process
2. Pull and aggregate it automatically • API interfaces • “The Cloud”
3. Make it available to everyone to drive radical transparency
• Minimizes wasted effort generating reporting
• Team gets clear feedback • Leadership gets required visibility • Creative solutions to “make work
visible” welcome!
• No additional work
Information “Radiator”
© 2013 Scrum
Inc.
An Example Scrum Leader’s Dashboard
rint

© 2013 Scrum
Inc.
Other metrics that leaders often track
• Points breakdown by category
• How are we spending our effort?
• Financial burndown vs. budget
• Are financial results on track?
• Happiness by team member
• Are there pockets of unhappiness?
• Happiness vs. velocity
• What is our current “optimal velocity?”
• Marketing/Sales pipeline
• Are our future sales on track?
© 2013 Scrum
Inc.
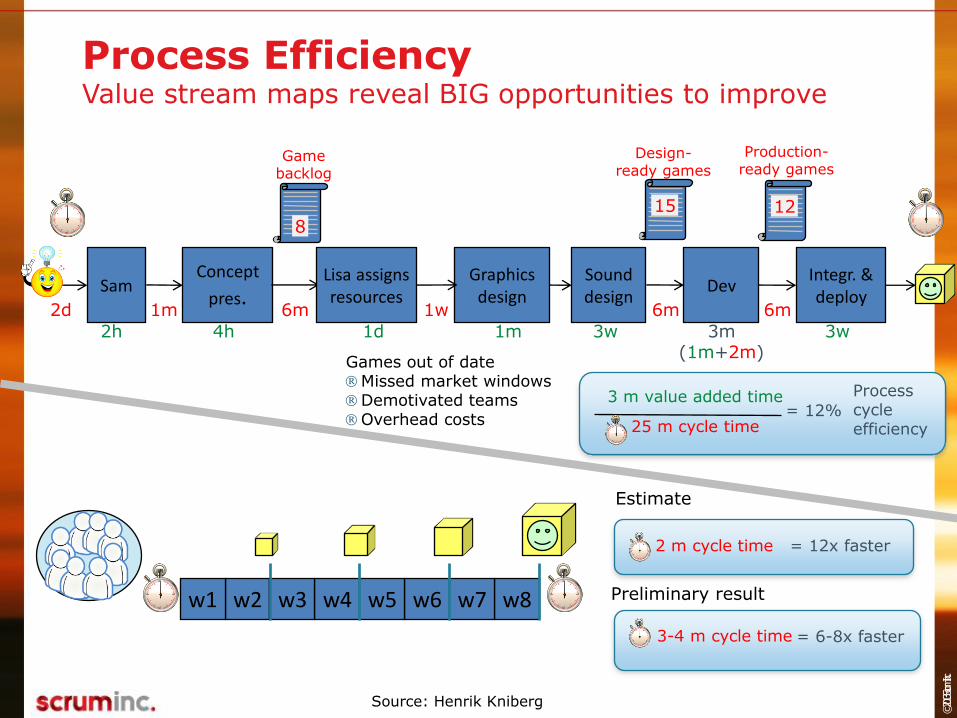
Concept
pres. 1m
4h
6m
8
Game backlog
6m
15
Design-ready games
6m
12
Production-ready games
Graphics design
1w
1m
Sound design
3w
Dev
3m (1m+2m)
Integr. & deploy
3w
Sam
2d
2h
Lisa assigns resources
1d
3 m value added time
25 m cycle time
w2 w1 w4 w3 w6 w5 w8 w7
= 12%
Process cycle efficiency
Estimate
Preliminary result
2 m cycle time = 12x faster
3-4 m cycle time = 6-8x faster
Games out of date Missed market windows Demotivated teams Overhead costs
Source: Henrik Kniberg
Process Efficiency Value stream maps reveal BIG opportunities to improve
© 2013 Scrum
Inc.
Conclusion
• It is vital that Scrum teams and leadership have visibility into current status
• Minimizes surprises, prevents disruptive overreaction late in the game, and helps teams get better
• Scrum provides a more accurate way to track actual progress than traditional tools
• Though leadership will need to learn how to use
• Leaders and the team should track at least four simple dashboard metrics on an regular basis
• Fifth “deep dive” metric also extremely helpful
• Most of this reporting can be automated to minimize team distraction
© 2013 Scrum
Inc.
© 1993-2012 Jeff Sutherland
Questions?

© 2013 Scrum
Inc. ©
2012 S
cru
m I
nc.
21
Stay Connected
Our Website • check in for announcements, new content and services, book
releases, and more! • www.scruminc.com
ScrumLab • join the conversations on our forums with the scrum community
and your class. • coming soon: articles, videos, papers on all things scrum • scrumlab.scruminc.com
Blog • scrum.jeffsutherland.com
Webinars • advance your learning with our interactive webinars. visit the
scrumlab store to view upcoming topics.
Twitter, Facebook, and G+ • @jeffsutherland, scrum and scrum inc.


