223
The sea, the great unifier, is man's only hope. Now, as never before, the old phrase has a literal meaning: we are all in the same boat. — Jacques Yves Cousteau

The sea, the great unifier, is man's only hope. Now, as never before, the old phrase has a literal meaning: we are all in the same boat.
— Jacques Yves Cousteau
Promoter Prof. Dr. C. Janssen Environmental Toxicology Unit (GhEnToxLab) Department of Applied Ecology and Environmental Ecology Ghent University Dean Prof. Dr. Ir. G. Van Huylenbroeck Rector Prof. Dr. A. De Paepe

Lisbeth VAN CAUWENBERGHE
Occurrence, effects and risks of marine microplastics
Thesis submitted in fulfilment of the requirements for the degree of Doctor (PhD) in Applied Biological Sciences
Proefschrift voorgedragen tot het bekomen van de graad Doctor in de Bio-ingenieurswetenschappen
Dutch translation of the title: Voorkomen, effecten en risico’s van mariene microplastics Reference: Van Cauwenberghe L., 2015. Occurrence, effects and risks of marine microplastics. Thesis submitted in fulfilment of the requirements for the degree of Doctor (PhD) in Applied Biological Sciences. ISBN 978-90-5989-869-1 Cover: Copyright © 2012 Studio Swine The author and promoter give the authorisation to consult and to copy parts of this work for personal use only. Any other use is limited by the Law of Copyright. Permission to reproduce any material contained in this work should be obtained from the author.
Lisbeth Van Cauwenberghe was financially supported by a personal PhD grant from the Agency for Innovation by Science and Technology
in Flanders (IWT)
This research was conducted at the Laboratory for Environmental Toxicology and Aquatic Ecology – Environmental Toxicology Unit
(GhEnToxLab), Faculty of Bioscience Engineering, Ghent University


Table of Contents
List of abbreviations p. 1
CHAPTER 1 GENERAL INTRODUCTION AND OUTLINE p. 5
PART 1: EXPOSURE ASSESSMENT
CHAPTER 2 LAND-BASED SOURCES OF MICROPLASTICS: RIVERS AND SEWAGE TREATMENT PLANTS
p. 29
CHAPTER 3 MARINE LITTER AND MICROPLASTICS ON THE BELGIAN CONTINENTAL SHELF
p. 51
CHAPTER 4 MICROPLASTICS IN DEEP-SEA SEDIMENTS p. 69
PART 2: ACCUMULATION AND EFFECT ASSESSMENT
CHAPTER 5 MICROPLASTICS IN ORGANISMS LIVING IN NATURAL HABITATS AND ASSOCIATED EFFECTS
p. 81
CHAPTER 6 MICROPLASTICS IN ORGANISMS CULTURED FOR HUMAN CONSUMPTION p. 95
CHAPTER 7 MICROPLASTIC INGESTION IN HUMANS AND ASSOCIATED EFFECTS p. 107
PART 3: AN INTEGRATED RISK ASSESSMENT
CHAPTER 8 MICROPLASTICS: AN EMERGING CONTAMINANT OF CONCERN? p. 121
CHAPTER 9 GENERAL CONCLUSIONS p. 151
References p. 175 Summary p. 193 Samenvatting p. 199 Dankwoord p. 205 Curriculum Vitae p. 209


1
List of abbreviations
B
BOD Biological Oxygen Demand BPA Bisphenol-A bw Body weight
D
DMEM Dubelcco’s Modified Eagle’s Medium DTI Daily Tolerable Intake dw Dry weight
E
EFSA European Food Safety Authority EPA Environmental Protection Agency EPS Expanded polystyrene ERA Environmental Risk Assessment
F
FAO Food and Agriculture Organisation of the United Nations
H
HC Hazardous concentration
I
IE Inhabitant equivalent
G
GES Good Environmental Status GESAMP Joint Group of Experts on the Scientific Aspects of Marine
Environmental Protection
L
LMPs Large microplastics LOEC Lowest observed effect concentration LR-SMPs Low range small microplastics

Chapter 1
2
1
M
MP Microplastic MSFD Marine Strategy Framework Directive MT Million tonnes (106 tonnes) MTT 3-(4,5-dimethylthiazol-2-yl)-2,5-diphenyltetrazolium bromide
N
NaI Sodium iodide NOEC No observed effect concentration NPCG North Pacific Central Gyre NPSG North Pacific Subtropical Gyre
O
OSPAR Oslo and Paris Conventions for the Protection of the Marine Environment of the North-East Atlantic
P PAH Polycyclic aromatic hydrocarbon PCB Polychlorinated biphenyl PCP Personal care product PE Polyethylene PEC Predicted environmental concentrations PET Polyethylene terephthalate PNEC Predicted no effect concentration POP Persistent organic pollutant PP Polypropylene PS Polystyrene PSD Particle Size Distribution PVC Polyvinylchloride
R
RCR Risk characterisation ratio
S
SD Standard deviation SMPs Small microplastics

3
SRB Sulforhodamine B SSD Species sensitivity distribution STP Sewage treatment plant
T
TC Tissue culture
TEER Trans epithelial electrical resistance
U
UNEP United Nations Environment Programme UR-SMPs Upper range small microplastics UV-A Ultraviolet A (longwave) UV-B Ultraviolet B (shortwave)
W
ww Wet weight


1 General introduction and outline

Chapter 1
6
1
1. Plastic marine pollution
The ocean is of eminent importance to mankind, and throughout history humans have been directly or indirectly influenced by the oceans. Oceans serve as sources of food and minerals, a highway for commerce and a place for recreation. Today, some 2.5 billion people, or 35% of the entire world’s population live within 100 km of the coast (Burke et al., 2011), and 50% are likely to do so in 2050 (Adger et al., 2005). Ocean pollution, however, has escalated dramatically. Typical and well known types of marine pollution include a range of threats such as oil spills, eutrophication, organic compounds (persistent organic pollutants (POPs)), heavy metals, acidification, and also anthropogenic litter (Ansari et al., 2004; Halling-Sørensen et al., 1998; Islam & Tanaka, 2004; Doney et al., 2009, Derraik, 2002). Marine anthropogenic debris is defined as “any persistent, manufactured or processed solid material discarded, disposed of or abandoned in the marine and coastal environment” (UNEP, 2009). While this definition includes all materials used in man-made applications (metal, wood, cloth, glass ...), plastics make up the vast majority.
Plastic marine debris has accumulated in marine habitats from the poles to the equator and is a very conspicuous component of marine debris: on average 60 – 80% of all marine litter is plastic (Gregory & Ryan, 1997). Although the origin of plastic marine debris is both land- and waterway-related, land-based sources are considered to have a more significant contribution since they account for over half (80%) of the world’s marine debris (GESAMP, 1990; Sheavly, 2007). Despite the widespread recognition of the problem, evidence suggests that plastic pollution of the marine environment is ever increasing (Barnes et al., 2009; Moore, 2008; Ryan et al., 2009).
1.1 Why plastic?
Plastic1 has changed the way we live. It is incredibly versatile and possesses a unique set of properties making it extremely popular for use in everyday life: it can be used at a wide range of temperatures, has low thermal conductivity, a high strength-to-weight ratio, is bio-inert, durable and above all it is cheap (Andrady, 2011; Andrady and Neal, 2009). This has led to the use of plastic in a myriad of applications, ranging from household and personal goods, clothing and packaging to construction materials. As a result, the global plastic production has grown exponentially ever since its mass production started in the 1950s, with 299 million tonnes (MT) produced worldwide in 2013 (PlasticsEurope, 2015). This rapid
1Plastic, from Greek plastikos 'to mould’, A synthetic material made from a wide range of organic polymers such as polyethylene, PVC, nylon, etc., that can be moulded into shape while soft, and then set into a rigid or slightly elastic form (Oxford Dictionary)

General introduction and outline
7
1
expansion of the use of plastics over the last half century has led to the characterisation of the present era as the “Plastic Age” (Thompson et al., 2009).
Even though the societal benefits of plastic are undeniable (Andrady and Neal, 2009), their increasing global production and use have led to the accumulation of plastics in the environment. Indeed, a large part of the plastics produced are used in single-use applications such as packaging (40% of the European plastic demand; PlasticsEurope, 2015), which results in a large amount of waste: e.g. in 2012, the EU-27 produced 25 MT of post-consumer plastic waste (PlasticsEurope, 2015). While a part of the plastic waste is properly managed (through combustion or recycling), it has been estimated that millions of tonnes of plastic waste (4.8 to 12.7 MT in 2010 alone) end up in the marine environment (Jambeck et al., 2015). Their durability makes that they persist in the environment for many years, and because of their low density they are readily dispersed by currents and wind, sometimes travelling thousands of kilometres (Kubota, 1994; Ryan et al. 2009).
1.2 Plastic degradation in the environment
Although plastics are durable, persistent materials, they are susceptible to degradation/breakdown processes albeit extremely slow. Plastics in the environment fragment as a consequence of photo-oxidative (UV induced), thermo-oxidative (temperature induced), and mechanical degradation. The chemical structure and morphology, and the presence of additives determine the rate of this degradation. Degradation of plastics is reflected in changes of material properties, such as mechanical (tensile strength, compression and impact properties) and surface (discoloration and cracking) properties, and molecular weight (Andrady, 2015).
Light-induced oxidation is the most effective degradation route for plastics in the marine environment, but evidently will only operate on plastics exposed to the light such as plastics lying on beaches or floating at the sea surface (Cooper and Corcoran, 2010). Photo-oxidation is a free-radical reaction, initiated by solar UV radiation (both UV-A (medium energy) and UV-B (high energy) wavelengths). The sunlight oxidises the chemical structure, causing bond cleavage in the long chain molecules. This reduces molecular weight, drastically affecting properties such as mechanical and tensile strength. As plastics become brittle, they can disintegrate and give rise to small fragments (Andrady, 2015). As a result, the formation of microplastics is a process of fragmentation, rather than true degradation (i.e. mineralisation).
In the marine environment, weathering and fragmentation due to photo-oxidation works in concert with thermal oxidation and mechanical weathering, induced by wave action and abrasion from sand particles (Corcoran et al., 2009; Searle, 2003; Singh and Sharma, 2008). Rates of degradation are markedly higher at higher temperatures, as the activation energy for

Chapter 1
8
1
oxidative degradation of common plastics is rather low (i.e. thermal oxidation) (Hamid and Pritchard, 1991; Tocháček and Vrátníčková, 2014). While the mechanisms of weathering and degradation are the same in the marine environment as those on land, the rate at which they proceed in the former can be significant slower than in the latter (Pegram and Andrady, 1989), as the availability of weathering agents differ between terrestrial and marine compartments (Table 1).
Table 1: Weathering agents in the marine environment. Comparison of the availability of weathering agents in different marine compartments. The land environment is added for comparison. Adapted from Andrady (2015).
Weathering agent Land Beach Water surface Deep water/Sea floor
Sunlight Yes Yes Yes No Ambient temperature High High Moderate Low Oxygen level High High High – Moderate Low Fouling (shields solar radiation) No No Yes Yes
2. What are microplastics?
2.1 Definition of size
Microplastic is a collective term used to describe a heterogeneous group of plastics ranging in size from a few microns to several millimetres in size. At present, however, there is still no universally accepted definition regarding the size of microplastics. When first described in 2004, the term microplastic was used to refer to microscopic plastic debris in the 20 μm region (Thompson et al., 2004). A motion to broaden the definition to all fragments smaller than 5 mm was made in 2009 (Arthur et al., 2009). As a result of the absence of an unequivocal, size-based definition, several different size fractions are reported throughout literature, all denoted as microplastics. As microplastics include particles up to 5 mm (Arthur et al., 2009) and both extraction and identification becomes more challenging with decreasing dimensions, authors often opt to only include plastics larger than 1 mm (e.g. Baztan et al., 2014; Jayasiri et al., 2013; McDermid and McMullen, 2004) or even > 2 mm (e.g. Heo et al., 2013; Ivar do Sul et al., 2009; Turner and Holmes, 2011). Even among those authors that include smaller microplastics (down to 1.6 μm) different upper size limits are applied: either 1 mm (Browne et al., 2011; Browne et al., 2010; Claessens et al., 2011; Vianello et al., 2013) or 5 mm (Martins and Sobral, 2011; Mathalon and Hill, 2014; Ng and Obbard, 2006; Reddy et al., 2006).
Additionally, the lower size limit reported in microplastic assessment studies is even more variable, and highly dependent on the sensitivity of the sampling and extractions techniques applied. Often, the technical constraints associated with the extraction of small microplastics (SMPs) result in the omission of this size class. However, not including the sub-1 mm
General introduction and outline
9
1
fraction can result in highly underestimated concentrations. It was demonstrated repeatedly that these SMPs represent an important fraction of all microplastics present in the environment: i.e. up to 35 to 90% of all microplastics are smaller than 1 mm (Browne et al., 2010; Eriksen et al., 2013; McDermid and McMullen, 2004; Song et al., 2014; Zhao et al., 2014).
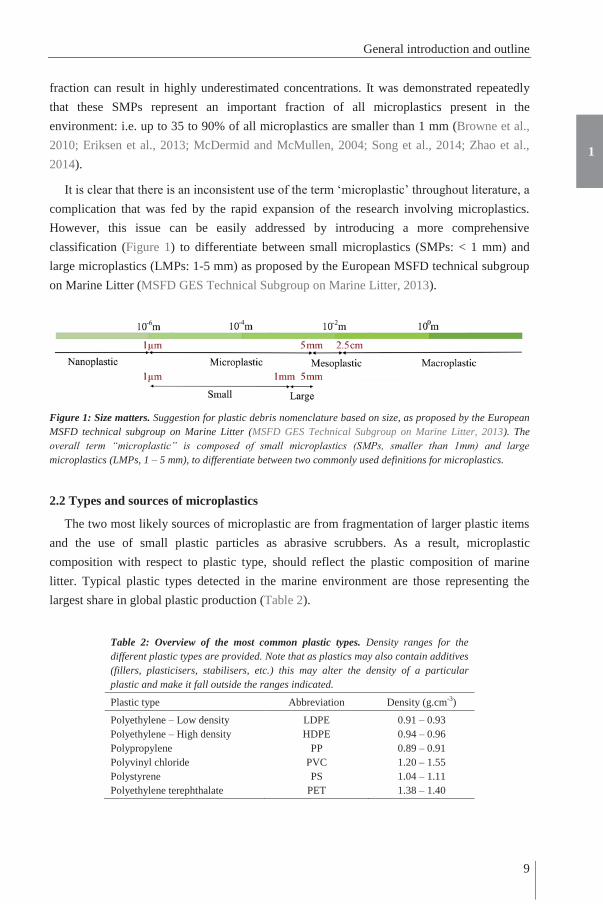
It is clear that there is an inconsistent use of the term ‘microplastic’ throughout literature, a complication that was fed by the rapid expansion of the research involving microplastics. However, this issue can be easily addressed by introducing a more comprehensive classification (Figure 1) to differentiate between small microplastics (SMPs: < 1 mm) and large microplastics (LMPs: 1-5 mm) as proposed by the European MSFD technical subgroup on Marine Litter (MSFD GES Technical Subgroup on Marine Litter, 2013).
Figure 1: Size matters. Suggestion for plastic debris nomenclature based on size, as proposed by the European MSFD technical subgroup on Marine Litter (MSFD GES Technical Subgroup on Marine Litter, 2013). The overall term “microplastic” is composed of small microplastics (SMPs, smaller than 1mm) and large microplastics (LMPs, 1 – 5 mm), to differentiate between two commonly used definitions for microplastics.
2.2 Types and sources of microplastics
The two most likely sources of microplastic are from fragmentation of larger plastic items and the use of small plastic particles as abrasive scrubbers. As a result, microplastic composition with respect to plastic type, should reflect the plastic composition of marine litter. Typical plastic types detected in the marine environment are those representing the largest share in global plastic production (Table 2).
Table 2: Overview of the most common plastic types. Density ranges for the different plastic types are provided. Note that as plastics may also contain additives (fillers, plasticisers, stabilisers, etc.) this may alter the density of a particular plastic and make it fall outside the ranges indicated.
Plastic type Abbreviation Density (g.cm-3)
Polyethylene – Low density LDPE 0.91 – 0.93 Polyethylene – High density HDPE 0.94 – 0.96 Polypropylene PP 0.89 – 0.91 Polyvinyl chloride PVC 1.20 – 1.55 Polystyrene PS 1.04 – 1.11 Polyethylene terephthalate PET 1.38 – 1.40

Chapter 1
1
10
Tabl
e 4:
Abu
ndan
ce o
f m
icro
plas
tics
in s
edim
ents
worl
dwid
e. N
on-e
xhau
stiv
e ov
ervi
ew o
f m
icro
plas
tic a
bund
ance
s de
tect
ed i
n se
dim
ents
. G
eogr
aphi
cal
loca
tion
(Loc
atio
n +
Loc
atio
n sp
ecifi
catio
n) a
re p
rovi
ded,
as
wel
l as
mic
ropl
astic
siz
e ra
nge
(par
ticle
siz
e) a
pplie
d du
ring
the
asse
ssm
ent.
As
oppo
sed
to th
e ov
ervi
ew f
or m
icro
plas
t ic a
bund
ance
in
seaw
ater
(Ta
ble
3), n
o st
anda
rdis
ed a
bund
ance
is
calc
ulat
ed h
ere.
Sta
ndar
disi
ng s
edim
ent
conc
entr
atio
ns r
equi
res
info
rmat
ion
on s
edim
ent d
ensi
ty, w
ater
con
tent
, vol
ume
sam
pled
, etc
. As
such
dat
a ar
e of
ten
not r
epor
ted,
no
stan
dard
isat
ion
can
be p
erfo
rmed
.
Loca
tion
Loca
tion
spec
ifica
tion
Parti
cle
size
M
easu
red
abun
danc
e R
efer
ence
Can
ary
Isla
nds
Bea
ch
1 –
5 m
m
<1 -
>100
g/L
B
azta
n et
al.,
201
4 H
awai
i B
each
1
– 15
mm
54
1 –
18,5
59 it
ems/
260
L M
cDer
mid
& M
cMul
len,
200
4 U
S Su
btid
al F
lorid
a Su
btid
al M
aine
0.
25 –
4 m
m
116
– 21
5 ite
ms/
L 10
5 ite
ms/
L G
raha
m &
Tho
mps
on, 2
009
Bra
zil
Bea
ch
0.5
– 1
mm
1
– 20
mm
20
0 ite
ms/
0.01
m²
100
item
s/0.
01 m
² C
osta
et a
l., 2
010
Bra
zil
Tida
l pla
in
1 m
m –
10
cm
6.36
– 1
5.89
item
s/m
² C
osta
et a
l., 2
011
Chi
le
Bea
ch
1 –
4.75
mm
<1
– 8
05 it
ems/
m²
Hid
algo
-Ruz
& T
hiel
, 201
3 N
ova
Scot
ia
Bea
ch
0.8 μm
– 5
mm
20
– 8
0 fib
res/
10 g
M
atha
lon
& H
ill, 2
014
Sing
apor
e B
each
1.
6 μm
– 5
mm
0
– 4
item
s/25
0 g
dry
Ng
& O
bbar
d, 2
006
Indi
a Sh
ip-b
reak
ing
yard
1.
6 μm
– 5
mm
81
.4 m
g/kg
R
eddy
et a
l., 2
006
Mal
aysi
a B
each
2
– 5
mm
0
– 18
pel
lets
/m2
Ism
ail e
t al.,
200
9 So
uth
Kor
ea
Hig
h tid
e lin
e 2
– 10
mm
91
3 ite
ms/
m²
Heo
et a
l., 2
013
Indi
a B
each
1
– 5
mm
10
– 1
80 it
ems/
m²
Jaya
siri
et a
l., 2
013
Sout
h K
orea
B
each
dry
seas
on
Bea
ch ra
iny
seas
on
1 –
5 m
m
8,20
5 ite
ms/
m²
27,6
06 it
ems/
m²
Lee
et a
l., 2
013
Sing
apor
e M
angr
ove
1.
6 μm
– 5
mm
36
.8 it
ems/
kg d
ry
Nor
& O
bbar
d, 2
014
Sout
h K
orea
B
each
50
μm
– 5
mm
56
– 2
85,6
73 it
ems/
m²
Kim
et a
l., 2
015
UK
B
each
Es
tuar
y Su
btid
al
1.6 μm
– 5
mm
0.
4 fib
res/
50 m
L 2.
4 fib
res/
50 m
L 5.
6 fib
res/
50 m
L
Thom
pson
et a
l., 2
004
Swed
en
Subt
idal
2 μm
– 5
mm
2
– 33
2 ite
ms/
100
mL
Nor
én, 2
007
UK
B
each
Nor
th S
ea
Bea
ch E
nglis
h C
hann
el
38 μ
m –
1 m
m
0.2
– 0.
8 fib
res/
50 m
L 0.
4 –
1 fib
res/
50 m
L B
row
ne e
t al.,
201
1
Bel
gium
H
arbo
ur
Con
tinen
tal S
helf
Bea
ch
38μm
– 1
mm
16
6.7
item
s/kg
dry
97
.2 it
ems/
kg d
ry
92.8
item
s/kg
dry
Cla
esse
ns e
t al.,
201
1
Portu
gal
Bea
ch
1.2 μm
– 5
mm
13
3.3
item
s/m
² M
artin
s & S
obra
l, 20
11
Ger
man
y Ti
dal f
lat
1.2 μm
– 5
mm
0
– 62
1 ite
ms/
10 g
Li
ebez
eit &
Dub
aish
, 201
2 Ita
ly
Subt
idal
0.
7 μm
– 1
mm
67
2 –
2175
item
s/kg
dry
V
iane
llo e
t al.,
201
3 G
erm
any
Bea
ch
< 1
mm
1.
3 –
2.3
item
s/kg
dry
D
ekiff
et a
l., 2
014

General introduction and outline
11
1
Based on their source, microplastics are classified into two types: the primary and secondary microplastics.
3.2 Microplastics in sediments
While the occurrence of industrial resin pellets on beaches were already described in the 1970s (e.g. Gregory 1977), it took another 30 years before the first reports on other types of microplastics were published. By analysing subtidal, estuarine and sandy sediments from 18 locations across the UK, Thompson et al. (2004) were the first to demonstrate the presence of μm-sized (< 1mm) microplastics in marine sediments. Soon, reports from Singapore (Ng andObbard, 2006), India (Reddy et al., 2006) Sweden (Norén, 2007) and Belgium (Claessens et al., 2011) illustrated the widespread distribution of these SMPs.
Currently, small and large microplastics are detected in sediments worldwide (Table 4). It has moreover been demonstrated that the level of microplastic pollution is increasing: sediment core analysis revealed that over the last 20 years microplastic deposition on Belgian beaches tripled (Claessens et al., 2011). Sediments are suggested to be a long-term sink for microplastics (Cózar et al., 2014; Law et al., 2010; Morét-Ferguson et al., 2010). Logically, plastics with a density that exceeds that of seawater (>1.02 g.cm-³) will sink and accumulate in the sediment, while low-density particles tend to float on the sea surface or in the water column. However, through density-modification even low-density plastics can reach the seafloor. Biomass accumulation due to biofouling can lead to an increase in density resulting in the sinking of the microplastic particles (Andrady, 2011; Reisser et al., 2013; Zettler et al., 2013). Using nitrogen as a proxy, Morét-Ferguson et al. (2010) concluded that the reported change in microplastic density is due to attached biomass. Indeed, analysis of polyethylene bags submerged in seawater for 3 weeks showed a significant increase in biofilm formation over time, accompanied by corresponding changes in the physicochemical properties of the plastic such as a decrease in buoyancy (Lobelle and Cunliffe, 2011). These studies suggest that biofouling can contribute towards the settling and eventual burial in sediments of previously buoyant plastic. Biomass accumulation on the plastic may even partly explain the recent finding that the global plastic load in the open-ocean surface is estimated to be two orders of magnitude lower than expected from estimates of plastic releases in the marine environment (Cózar et al., 2014).
Because of their small dimensions, microplastics are differently distributed in and on sediments than larger plastic debris. While the distribution of large litter items is influenced by beach orientation (up- or downwind) (Browne et al., 2010; Debrot et al., 1999), microplastic distribution is influenced by (small-scale) hydrodynamic processes. Long et al. (2015) demonstrated in a laboratory study that several (micro)algae species (Chaetoceros
neogracile and Rhodomonas salina) incorporate and concentrate microplastics into

Chapter 1
12
1
aggregates containing algal cells and exopolysaccharides, substantially increasing microplastic sinking rates. Moreover, Strand et al. (2013) demonstrated that there is a strong relationship between microplastic abundance and both the organic (%TOC) and fine fraction (< 63 μm) content in sediments, supporting the hypothesis that microplastics will accumulate in depositional areas. In the Lagoon of Venice, Vianello et al. (2013) detected the lowest microplastic concentrations in the outer Lagoon, where water currents are high (> 1 m.s-1). Consequently, the highest concentrations were encountered in the inner Lagoon which is characterised by lower hydrodynamics and a higher fine particle (< 63 μm) fraction in the sediment.
Microplastics appear to be more abundant in densely populated areas. In a study analysing sediments from 18 locations representing 6 continents, Browne et al. (2011) demonstrated a positive relationship between microplastic and human population density. Indeed, microplastics are detected in large numbers in highly populated areas, such as at locations in the North Sea (Claessens et al., 2011; Liebezeit and Dubaish, 2012; Norén, 2007; Thompson et al., 2004), in Asia (Ismail et al., 2009; Ng and Obbard, 2006; Nor and Obbard, 2014; Reddy et al., 2006) and the highly populated coast of Brazil (Costa et al., 2010; Ivar do Sul et al., 2009; Turra et al., 2014). On heavily polluted beaches, (micro)plastics (0.25 – 10 mm) can make up 3.3% of the sediment by weight, as opposed to 0.12% plastic by weight on control beaches (Carson et al., 2011). The link between microplastic pollution in sediments and human activities has also been demonstrated by Claessens et al. (2011), who detected particularly high concentrations of microplastic granules in the sediments of coastal harbours.
2.2.1 Primary microplastics Primary microplastics are most easily defined as microplastics “by design”: small plastic
particles manufactured to be of microscopic size. These primary microplastics are used in a number of domestic and industrial applications, and are likely to be transported with industrial and domestic waste water (through sewage treatment plants) to the aquatic environment.
Cosmetics and personal care products (PCPs), such as facial and body scrubs, toothpaste, shaving cream and make-up, often contain plastic particles less than 1 mm in size (Fendall and Sewell, 2009; Leslie, 2014; Zitko and Hanlon, 1991). Microplastic scrubbers have replaced natural ingredients, such as pumice and dried almonds, and their use has risen dramatically since the 1980s (Fendall and Sewell, 2009; Leslie, 2014; Zitko and Hanlon, 1991). These microplastics or so-called microbeads vary in size and shape, but also in composition. For example, polyethylene (PE) and polypropylene (PP) are commonly used as microbeads in personal care products (Leslie, 2014). It is estimated that in the United States alone, 260 tons of these microbeads are emitted into domestic wastewater on an annual basis

General introduction and outline
13
1
(Gouin et al. 2011). While these microbeads are the most well-known examples of polymers in PCPs, these materials are also used for other functions in these products, including film formation, viscosity regulation, skin conditioning and emulsion stabilisation (Leslie et al., 2014).
Small plastic particles, more specifically particles of acrylic, melamine and polyester are also used in air blasting techniques (Browne et al., 2007; Derraik, 2002; Gregory, 1996). During the air blasting process, small microplastic scrubbers are blasted at boat hulls or machinery to remove rust and paint. As these scrubbers are used repeatedly until they decrease in size and lose their cutting power, they often become contaminated with heavy metals (Derraik, 2002; Gregory, 1996).
Primary microplastics can also be found in the size range of larger microplastics (LMPs): plastic resin pellets, used as the industrial raw material for the production of user plastic. As these pellets are a commodity, their release into the environment is unintentional, and associated with industrial spillage, either during manufacture or transport (EPA, 1992).
2.2.2 Secondary microplastics Secondary microplastics are formed during the breakdown of larger plastic debris, both at
sea and on land (Ryan et al., 2009; Thompson et al., 2004). Over time, a combination of chemical, physical and biological processes reduce the structural integrity of plastic, making the plastics susceptible to fragmentation. Over prolonged periods, exposure to sunlight can result in photo-degradation of plastics, leading to bond cleavage (see Section 1.2 for more details). This weathering of plastic will make it increasingly susceptible to fragmentation due to abrasion and wave action. This process is ongoing, with fragments becoming smaller and smaller over time, until they eventually become microplastics. It is assumed that microplastics may further degrade until they are of sub-micrometre dimensions, i.e. the so-called nanoplastics. However, these have never been detected in the environment, as the lower size limit of current extraction techniques lies at 1.6 μm (Thompson et al., 2004; Ng and Obbard, 2006; Reddy et al., 2006).
Even biological processes can play an important role in the formation of microplastics. A laboratory experiment by Davidson (2012) showed that marine isopods (Sphaeroma quoianum) are capable of burrowing into expanded polystyrene (EPS) floating docks. By doing so, these isopods create and release thousands of microplastic particles (100 – 1200 μm).
Wear and tear of synthetic clothing will result in the release of microplastic fibres or microfibres into the environment (Browne et al., 2011). As they originate from the washing of synthetic garments (polyester, acrylic, nylon …), their presence in the environment is indicative of a sewage origin: an increased microfibre load (> 250%) was detected in sewage-

Chapter 1
14
1
sludge disposal sites compared to reference sites (Browne et al., 2011). Domestic washing machines indeed release considerable numbers of this type of microplastic to marine environments: up to 1900 fibres can be released into the sewage stream from washing a single piece of clothing (Browne et al., 2011).
3. Microplastic contamination of marine habitats
3.1 Microplastics in seawater
The presence of small plastic particles in the open ocean was first reported in the early 1970s, hence considerably pre-dating the use of the term “microplastic”. While sampling the pelagic community of the Sargasso Sea in the North Atlantic, Carpenter and Smith (1972) observed high quantities of small plastic pellets (2.5 – 5 mm). While this was the first ever report of micro-sized debris in the marine environment, more observations soon followed (Carpenter et al., 1972; Morris and Hamilton, 1974; Wilber, 1987; Ryan, 1988). A recent estimate suggests there are more than 5 trillion pieces of plastic, together weighing over 250,000 tonnes, afloat in the world’s seas and oceans (Eriksen et al., 2014). The vast majority of these plastics, over 92%, are microplastics (0.33 – 4.75 mm).
High microplastic concentrations are reported in both coastal and open ocean waters (Table 3). Microplastic contamination is often associated with anthropogenic influences: densely populated coasts will generally have high levels of microplastic contamination

General introduction and outline
15
1
Tabl
e 3:
Abu
ndan
ce o
f mic
ropl
astic
s in
the
wate
r co
lum
n wo
rldwi
de. N
on-e
xhau
stiv
e ov
ervi
ew o
f mic
ropl
astic
abu
ndan
ces
dete
cted
in th
e w
ater
col
umn.
Geo
grap
hica
l lo
catio
n (L
ocat
ion
+ L
ocat
ion
spec
ifica
tion)
are
pro
vide
d, a
s w
ell a
s th
e sa
mpl
ing
dept
h an
d m
icro
plas
tic s
ize
rang
e (p
artic
le s
ize)
app
lied
duri
ng th
e as
sess
men
t.
Loca
tion
Loca
tion
spec
ifica
tion
Sam
plin
g de
pth
Parti
cle
size
M
easu
red
abun
danc
e St
anda
rdis
ed a
bund
ance
R
efer
ence
M
edite
rran
ean
Nor
th W
est
Top
10 c
m
0.33
3 –
5 m
m
0.11
6 pa
rticl
es/m
2 0.
202
mg/
m2
0.01
2 pa
rticl
es/m
3
0.02
0 pa
rticl
es/m
3 C
ollig
non
et a
l., 2
012
Med
iterr
anea
n Li
guria
n Se
a Sa
rdin
ian
Sea
Top
50 c
m
0.2
– 5
mm
0.
94 p
artic
les/
m3
0.13
par
ticle
s/m
3 0.
94 p
artic
les/
m3
0.13
par
ticle
s/m
3 Fo
ssi e
t al.,
201
2
Paci
fic O
cean
N
orth
Eas
t (N
PCG
) To
p 10
cm
0.
333
- > 5
mm
33
4,21
7 pa
rticl
es/k
m2
5114
g/k
m2
0.03
3 pa
rticl
es/m
3 0.
0005
g/m
3 M
oore
et a
l., 2
001
Paci
fic O
cean
Sa
nta
Mon
ica
Bay
To
p 10
cm
0.
335
- > 4
.75
mm
3.
92 p
artic
les/
m3
0.00
3 g/
m3
3.92
par
ticle
s/m
3 0.
003
g/m
3 La
ttin
et a
l., 2
004
Paci
fic O
cean
B
erin
g Se
a To
p 10
cm
21
2 m
0.5
- > 1
0 m
m
0.00
4 –
0.19
0 pa
rticl
es/m
3
0.02
4 –
0.20
9 m
g/m
3 0.
0 –
0.00
4 pa
rticl
es/m
3
0.0
– 0.
014
mg/
m3
0.00
4 –
0.19
0 pa
rticl
es/m
3
0.02
4 –
0.20
9 m
g/m
3 0.
0 –
0.00
4 pa
rticl
es/m
3
0.0
– 0.
014
mg/
m3
Doy
le e
t al.,
201
1
Paci
fic O
cean
N
orth
Eas
t (N
PSG
) To
p 20
cm
0.
2 –
5 m
m
0.02
1 –
0.44
8 pa
rticl
es/m
2 0.
004
– 0,
090
parti
cles
/m3
Gol
dste
in e
t al.,
201
3b
Paci
fic O
cean
N
orth
Eas
t (of
fsho
re)
Brit
ish
Col
umbi
a (c
oast
al)
4.5
m
0.06
3 –
5 m
m
279
parti
cles
/m3
1710
– 7
630
parti
cles
/m3
279
parti
cles
/m3
1710
– 7
630
parti
cles
/m3
Des
forg
es e
t al.,
201
4
Atla
ntic
Oce
an
Nor
th E
ast
10 m
0.
28 –
5 m
m
0.01
– 0
.045
fibr
es/m
3 0.
01 –
0.0
45 fi
bres
/m3
Thom
pson
et a
l., 2
004
Atla
ntic
Oce
an
Car
ibbe
an
Gul
f of M
aine
30
°N
Top
25 c
m
0.33
5 - >
10
mm
14
14 p
artic
les/
km2
1534
par
ticle
s/km
2
20,3
28 p
artic
les/
km2
0.00
04 p
artic
les/
m3
0.00
04 p
artic
les/
m3
0.00
5 pa
rticl
es/m
3
Law
et a
l., 2
010
Atla
ntic
Oce
an
Goi
ana
Estu
ary
(Bra
zil)
Not
spec
ified
0.
3 –
5 m
m
0.37
– 1
3.98
par
ticle
s/10
0m3
0.00
4 –
0.14
0 pa
rticl
es/m
3 Li
ma
et a
l., 2
014
Atla
ntic
Oce
an
Wes
tern
Tro
pica
l To
p 10
cm
0.
3 - >
10
mm
0.
025
– 0.
13 p
artic
les/
m3
0.02
5 –
0.13
par
ticle
s/m
3 Iv
ar d
o Su
l et a
l., 2
014
Atla
ntic
Oce
an
Nor
th E
ast
3 m
0.
25 –
5 m
m
1710
– 7
630
parti
cles
/m3
1710
– 7
630
parti
cles
/m3
Lush
er e
t al.,
201
4 Si
ngap
ore
Sout
h W
est (
harb
our)
To
p 50
– 6
0 μm
1
m
1.6 μm
– 5
mm
0
– 2
parti
cles
/L
0 –
2 pa
rticl
es/L
0
– 20
00 p
artic
les/
m3
0 –
2000
par
ticle
s/m
3 N
g an
d O
bbar
d, 2
006
Aus
tralia
C
oast
al +
off
shor
e To
p 10
cm
0.
333
– 10
mm
0
– 48
,895
par
ticle
s/km
2 0
– 0.
005
par
ticle
s/m
3 R
eiss
er e
t al.,
201
3 C
hina
Sea
Ea
st (c
oast
al)
Yan
gtze
est
uary
To
p 10
cm
1
m
0.5
– 12
mm
0.
030
– 0.
455
parti
cles
/m3
500
– 10
,200
par
ticle
s/m
3 0.
030
– 0.
455
parti
cles
/m3
500
– 10
,200
par
ticle
s/m
3 Zh
ao e
t al.,
201
4
Chi
na S
ea
Sout
h K
orea
To
p 15
0 –
400 μm
To
p 20
cm
To
p 10
cm
0.75
μm
– 2
mm
50
μm
– 5
mm
0.
333
– 5
mm
16,2
72 p
artic
les/
m3
1,14
3 pa
rticl
es/m
3 47
par
ticle
s/m
3
16,2
72 p
artic
les/
m3
1,14
3 pa
rticl
es/m
3 47
par
ticle
s/m
3
Song
et a
l., 2
014
Nor
th S
ea
Coa
stal
Wes
t Sw
eden
0.
5 m
80
μm
– 5
mm
15
0 –
2,40
0 pa
rticl
es/m
3 15
0 –
2,40
0 pa
rticl
es/m
3 N
orén
, 200
7 N
orth
Sea
Ja
de S
yste
m
0.2
m
40 μ
m –
1 m
m
0 –
1,77
0 pa
rticl
es/L
0
– 65
0 fib
res/
L 0
– 1.
7 10
6 par
ticle
s/m
3
0 –
6.5
105 p
artic
les/
m3
Dub
aish
and
Lie
beze
it,
2013

Chapter 1
16
1
(Mediterranean Sea: Collignon et al., 2012; Singapore: Ng and Obbard, 2006). Similarly, installations such as sewage treatment plants (Dubaish and Liebezeit, 2013) and plastic production plants (Norén, 2007) constitute local point sources, resulting in a significant increase of local microplastic abundance. However, as microplastics suspended in the water column can become trapped by ocean currents, they are transported for thousands of kilometres to the central ocean gyres where they accumulate (e.g. Moore et al., 2001; Law et al., 2010). Ocean gyres are important areas of accumulation, as the rotational pattern of currents cause floating debris to be captured and moved towards the centre of the region (Brown et al., 2001). As gyres are present in all of the world’s oceans, microplastic accumulation in these gyres occurs at a global scale. One of such gyres that has received a considerable amount of attention is the North Pacific Central Gyre (NPCG), located off the coast of California (US). The NPCG was sampled for the first time at the turn of the century (Moore et al., 2001). Subsurface tows collected a high number of plastic fragments, films and line, the majority of which were smaller than 5 mm. Strikingly, a plastic-to-plankton mass ratio of 6 was detected, indicating that, in terms of weight, synthetic plastics are more dominant in this region than natural plankton (Moore et al., 2001). Microplastic abundances in the NPCG are two orders of magnitude higher than those reported in the North Pacific Subtropical Gyre (NPSG), another gyre in the same ocean (Goldstein et al., 2013b).
Temporal trends in the abundance of microplastics in seawater have rarely been investigated. Thompson et al. (2014) used archived plankton samples, collected by a continuous plankton recorder, to examine temporal changes in microplastic abundance in surface waters to the north of Scotland. This study demonstrated a significant increase in abundance from the 1960s – 1970s to the 1980s – 1990s. This trend was confirmed by Goldstein et al. (2012), who also detected an increase in microplastic abundance over time in the NPSG. However, an extensive data set spanning over 20 years and containing a collection of over 600 surface tows, did not reveal a temporal trend in microplastic abundance in the North Atlantic and Caribbean accumulation zone (Law et al., 2010). While it is clear that there is a considerable variation in microplastic abundance in space and time, we still have little understanding of the associated scales of variation and the importance of and interactions among the factors affecting their distribution (Thompson, 2015).
4. Ecological consequences of microplastic pollution
There is a growing body of evidence that small plastic debris, or microplastics, are accumulating in marine habitats worldwide. As their abundances increase, organisms inhabiting these habitats are more likely to encounter these plastics and interact with them (Figure 2). Because of their small dimensions they ‘target’ other organisms than large plastic debris, more specifically lower trophic organisms such as invertebrates. Commonly reported effects of microplastics on such invertebrates are ingestion and associated biological adverse

General introduction and outline
17
1
effects. It has also been suggested that microplastics may prove a chemical threat as sorbed environmental contaminants and chemicals added during the production process have been measured in high concentrations on plastics collected at sea.
4.1 Bioavailability of microplastics
Factors affecting the availability of microplastics to organisms are manifold. A key factor for the ingestion of microplastics by marine organisms is their size. SMPs have a similar size range of that of planktonic organisms and can thus become available for ingestion by lower trophic organisms (e.g. invertebrates) that are commonly not affected by the larger marine debris. Many of these organisms have feeding strategies characterised by the collection and sorting of particulate matter, allowing them to trap and ingest anything of appropriate size (Moore, 2008).
The eventual uptake of microplastics by these organisms will depend on the position of these particles in the water column, which is determined by the plastic’s density. Positively buoyant microplastics (i.e. density smaller than that of seawater) can be found on the sea surface and will hence be more likely encountered by planktivores and filter feeders inhabiting the upper water column. In contrast, negatively buoyant microplastics (density

18 C
hapter 1
Chapter1
Figure 2: Conceptual model of microplastic pathways and interactions with marine biota.
•
Trophic transfer
~ Sedîmentation as faecal pellets
• •
\ Tngestion
Primot:l' e nticroplaslics
• •
• •
~eaching ~V Additives
0~
Bioturbation
r"'-'
•
•
•
•
Plastic lilter
Degradation -Chemica/ - Pilysical -Microbial
• Sec,:mula1:1· microplastic:s
•
Sedimentation - Densitr - Bi(!/in;ling - Marine snow
Marine& Terrestrial
sourees

General introduction and outline
19
1
higher than that of seawater) will become available to benthic suspension and deposit feeders, as they sink to the sea floor. For the ingestion of microplastics by visual predators, such as for instance certain fish species and fish larvae, colour may also prove to be an important factor, as these organisms will only ingest microplastics that most resemble their prey (Shaw and Day, 1994).
Additionally, an increase in the abundance of microplastics, either through increased fragmentation of plastic debris or increased introduction of primary microplastics into the environment, will result in an increased bioavailability of microplastics. Higher abundance will indeed lead to an increased probability of organisms encountering microplastics.
4.2 Uptake and effects
4.2.1 Uptake of microplastics Laboratory experiments have shown that various marine invertebrates will ingest microplastics: detrivores such as amphipods (Chua et al., 2014; Thompson et al., 2004; Ugolini et al., 2013), deposit feeders such as lugworms (Besseling et al., 2013; Thompson et al., 2004; Wright et al., 2013a) and sea cucumbers (Graham and Thompson, 2009) and filter feeders such as barnacles (Thompson et al., 2004) have all been shown to ingest microplastics. Experiments focusing on particle selection demonstrated that filter feeding bivalves, such as mussels, oysters and clams, will ingest polystyrene microparticles (reviewed in Ward and Shumway, 2004). Also a wide array of zooplankton species ingest microplastics as demonstrated by Cole et al. (2013) with 16 zooplankton species ingesting microplastics ranging in size from 7 to 30 μm, and by Setälä et al. (2014) who exposed 11 zooplankton species to 10 μm microplastics. Both studies reported microplastic ingestion in all taxa studied.
Unfortunately, to date, there is limited evidence that invertebrates in the field take up (and accumulating) significant amounts of microplastics. Murray and Cowie (2011) demonstrated that the scavenging crustacean Nephrops norvegicus ingests small plastic fibres. Gut content analysis found that 83% of animals collected from the Clyde Sea contained nylon fibres most likely originating from fishing nets. Goldstein and Goodwin (2013a) examined Gooseneck barnacles (Lepas sp.) living in the North Pacific Central gyre and discovered that 35% of individuals can contain up to 30 microplastic particles (up to 6 mm). Of all individuals examined, 35% contained microplastics. More recently, three independent studies assessed the presence of SMPs in blue mussel (Mytilus edulis) cultured for human consumption (De Witte et al., 2014; Mathalon and Hill, 2014; Van Cauwenberghe and Janssen, 2014). All three studies demonstrated the presence of microplastics in these mussels, yet, due to differences in microplastic extraction protocols and microplastics identification, comparison between these

Chapter 1
20
1
studies is challenging. For example, while Mathalon and Hill (2014) only detected fibres (on average 178 per individual), Van Cauwenberghe and Janssen (2014) didn’t detected fibres but only very small particles (on average 0.36 particles.g-1).
4.2.2 Effects of microplastic ingestion Browne et al. (2008) were the first to demonstrate that, once ingested, SMPs have the
potential to translocate from the digestive tract to the circulatory system of the blue mussel Mytilus edulis. Within three days after exposure to small polystyrene microspheres (3 and 10μm; 40 particles.mL-1), microplastics were detected in the haemolymph of the organisms and persisted there for over 48 days. Smaller particles seem to undergo translocation more readily than larger ones (Browne et al., 2008). In this short-term exposure, no biological effects of ingestion and translocation were detected (Browne et al., 2008). Von Moos et al. (2012), on the other hand did detect significant effects of exposure of Mytilus edulis to SMPs (>0 – 80 μm; 2.5 g.L-1). The model microplastics accumulated in epithelial cells of the digestive system (more specifically the digestive tubules), where they induced a strong inflammatory response accompanied by histological changes, after only 3 hours of exposure. With increasing exposure periods, the measured biological effects became more severe. Short-term exposure (24 h) of the copepod Centropages typicus to 7 μm polystyrene (PS) particles (0 – 2700 particles.mL-1) had a significant adverse effect on algal ingestion (Cole et al., 2013).
Long-term exposure (28 days) of the lugworm Arenicola marina to microplastics (400 – 1300 μm, 0 – 7.4% by weight) resulted in a significant increase in weight loss with increasing microplastic concentration (Besseling et al., 2013). Similarly, lugworms exposed to 5% microplastics by weight (28 days) exhibited a significantly reduced feeding activity (Wright et al., 2013a). This reduced feeding activity, in combination with increased gut residence times and inflammation, was reflected in the energy reserves of the worms, which were reduced by up to 50% (Wright et al., 2013a). In contrast, long-term (6 week) bioassays using the isopod Idotea emarginata showed no significant effects of microplastic ingestion (beads and particles: 1 – 100 μm, 120 or 350 particles.mg-1 food; fibres: 20 – 2500 μm, 0.3g fibres.g-
1 food) on mortality, growth, and intermolt duration (Haemer et al., 2014).
Plastic ingestion even seems to have multigenerational effects. Lee et al. (2013) investigated the e ects of polystyrene microplastic ingestion (0.05, 0.5 and 6 μm, 0 – 25 μg.L-1) on the survival, development, and fecundity of the copepod Tigriopus japonicus in a two-generation chronic toxicity test. While the 0.5- and 6-μm PS beads caused a significant decrease in fecundity at all concentrations in both generations, the smallest microplastics caused an increased mortality in both the F0 and F1 generations. In the 0.5 μm treatment a significant decrease in survival in the F1 generation was measured, while no significant effect was detected in the F0 generation (Lee et al., 2013).

General introduction and outline
21
1
4.2.3 Trophic transfer of microplastics Microplastics may enter the food chain through ingestion by lower trophic organisms,
there is a potential for these microplastic to enter the food chain. Unfortunately, there is still little evidence for this phenomenon. In literature, there is only one report of trophic transfer of microplastics in native animals. Plastic particles found in the scat of seals were believed to have been ingested through the consumption of their prey (lantern fish) (Eriksson and Burton, 2003). In a laboratory setting, it was demonstrated that Norway lobsters (Nephrops norvegicus) contained microplastic fibres in their stomach, 24 hours after being fed with plastic-spiked fish meat (Murray and Cowie, 2011). In addition, the trophic transfer of microplastics from mussels (Mytilus edulis) to crab (Carcinus maenas) was demonstrated in two separate studies. Farrell and Nelson (2013) exposed live mussels to microplastics (0.5 μm) before they were fed to crabs. Microplastics were recovered from the haemolymph, stomach, hepatopancreas, ovary and gills of the crabs. The maximum amount of microspheres in the haemolymph was 0.04% of the original exposure concentration of the mussels (Farrell and Nelson, 2013). This study not only showed trophic transfer of microplastics from mussels to crabs, it also demonstrated the translocation of the SMPs to the haemolymph of the crabs after secondary exposure (i.e. exposure through its prey). Watts et al. (2014) preformed a similar experiment with somewhat larger microplastics (10 μm). While microplastics were detected in the foregut of the crabs after feeding on exposed mussels, no microspheres were detected in the haemolymph of the mussels. The authors suggest a size bias in the translocation of microplastics across the gut wall in crabs to account for the lack of translocation compared to that of Farrell and Nelson (2013) (Watts et al., 2014). Finally, the occurrence of trophic transfer in zooplankton was investigated by Setälä et al. (2014). Zooplankton exposed to microplastics (10 μm) was offered to mysid shrimps (Mysis spp.). After three hour incubation, examination of the mysid intestine showed the presence of its zooplankton prey including microspheres (Setälä et al., 2014).
4.2.4 Microplastics acting as vectors for chemicals? Not only does the ingestion of microplastics pose a direct threat to marine organisms, it is
suggested that this may also pose a chemical threat, as there is a concern that microplastics may act as vectors for sorbed contaminants (Table 5). Microplastics are able to concentrate hydrophobic contaminants (POPs): because of their hydrophobic nature, these contaminants have a greater affinity for the plastic compared to seawater. Due to their large surface area to volume ratio, microplastics can contain high levels of such contaminants: e.g. up to six orders of magnitude greater than ambient seawater have been reported (Hirai et al., 2011; Mato et al., 2001). This presents a possible route of exposure to marine organisms: organisms ingesting contaminated microplastics could accumulate these contaminants. Additionally, as these contaminants enter the food web, they might pose a risk of biomagnification, eventually threatening even human food safety.

Chapter 1
22
1
Table 5: Concentrations of organic contaminants detected in microplastics. Non-exhaustive overview of the concentrations of several compounds detected in microplastics collected from the sea surface and beaches worldwide. ∑PCB = sum of 13 (Heskett et al., 2011), 15 (Frias et al., 2010), 18 (Antunes et al., 2013; Endo et al., 2005) or 39 (Hirai et al., 2011; Rios et al., 2007) polychlorinated biphenyls congeners; ∑PAH = sum of 15 (Hirai et al., 2011), 17 (Antunes et al., 2013; Rios et al., 2011) or 23 (Fisner et al., 2013; Mato et al., 2001) polycyclic aromatic hydrocarbons; ∑DDT is the sum of DDT (dichlorodiphenyltrichloroethane), and its metabolites DDE (dichlorodiphenyldichloroethylene) and DDD (dichlorodiphenyldichloroethane).
Organic compound Location Concentration (ng.g-1 plastic)
Reference
∑PCB California 15 – 399 Hirai et al., 2011 27 – 790 Rios et al., 2007 Hawaii 55 – 980 Rios et al., 2007 10 Heskett et al., 2011 Japan 117 Mato et al., 2001 2 – 18,700 Endo et al., 2005 2 – 436 Hirai et al., 2011 Portugal 47 – 45 Frias et al., 2010 0 – 223 Antunes et al., 2013 Vietnam 3 -102 Hirai et al., 2011 ∑PAH California 39 – 656 Hirai et al., 2011 39 – 12,000 Rios et al., 2007 Hawaii 500 Rios et al., 2007 Japan 0 – 9,297 Hirai et al., 2011 Portugal 533 – 44,800 Antunes et al., 2013 Vietnam 73 – 2,024 Hirai et al., 2011 Brazil 72 – 5,344 Fisner et al., 2013 ∑DDT California 2 – 8 Hirai et al., 2011 42 – 7,100 Rios et al., 2007 Hawaii 22 Rios et al., 2007 Japan 3.1 Mato et al., 2001 0 – 198 Hirai et al., 2011 Portugal 0 – 41 Antunes et al., 2013 2 – 5 Frias et al., 2010 Vietnam 11 – 108 Hirai et al., 2011
Chronic exposure of Japanese medaka (Oryzias latipes) to naturally contaminated microplastics (< 0.5 mm) demonstrated hepatic stress and endocrine disruption measured as altered gene expression (down regulation of chloriogenin, vitellogenin and oestrogen receptor) (Rochman et al., 2013; Rochman et al., 2014). Fish fed virgin microplastics (i.e. no associated contaminants) showed similar effects, albeit less severe. Browne et al. (2013) demonstrated that Arenicola marina accumulates nonylphenol and phenanthrene when exposed to sand with 5% microplastic (PVC, 230 μm) presorbed with the contaminants. This accumulation of POPs resulted in a decreased phagocytic activity of the coelomocytes in the worms. It is, however, important to note that lugworms exposed to contaminated sand rather than contaminated plastic accumulated over 250% more phenanthrene and nonylphenol in their tissues (Browne et al., 2013).
General introduction and outline
23
1
The bioaccumulation of persistent organic pollutants (POPs) has been theoretically investigated by Gouin et al. (2011) and Koelmans et al. (2013), using a modelling approach. Both studies suggested that microplastics are only of minor importance as vectors of POPs to organisms. Koelmans et al. (2013) even predicted a decrease in contaminant body burden due to a cleaning mechanism of strong sorbent plastics, counteracting biomagnification. In a similar modelling exercise, Koelmans et al. (2014) investigated the leaching of plastic associated chemicals, i.e. additives, to marine organisms. The rationale behind this modelling approach is the fact that for additives plastic ingestion by marine organisms may be more relevant than for diffusely spread POPs as the microplastics act as a source of the additives (Koelmans et al., 2014). The results showed that ingestion of microplastics can be considered a substantial pathway for additive exposure. However, as this was a conservative analysis the authors state that associated risks would still be limited.
5. Problem formulation
During the past decade, microplastic pollution has been recognized as an important and growing environmental problem, especially in the marine environment. This type of pollution is, however, currently not regulated in terms of production, use and emissions in Europe nor in the rest of the world. Although there are an increasing number of studies available on the presence and potential effects of microplastic pollution in marine systems and on biota, so far no real risk assessment of present and future risks of microplastic to marine systems and human health has been performed. Therefore, the main aim of this thesis was to perform an integrated assessment of the environmental and human health risks associated with microplastic pollution using both data generated during this thesis as well as those available in literature.
The research questions addressed in this thesis are consequently structured according to the building blocks of a conventional (environmental) risk assessment.
1. Exposure assessment – Sources and emissions as well as measuring abundances of microplastics in the marine environment were investigated and addressed the following novel research questions:
- What is the contribution of land-based point microplastic sources to both the freshwater and marine environment?
- What is the current state of the Belgian marine environment with respect to marine litter and its degradation products?
- Microplastics are encountered in coastal areas worldwide and are floating in the open ocean, but have they also contaminated deep-sea sediments?

Chapter 1
24
1
2. Effect assessment – Accumulation and impacts of microplastic in/on (marine) biota as well as humans is assessed. The following questions were addressed:
- Will organisms ingest microplastics when present at ambient concentrations and is this ingestion deleterious to the energy metabolism of marine invertebrates inhabiting the water column and sediment?
- Are microplastics present in organisms cultured for human consumption?
- Does the consumption of microplastics constitute a risk for humans?
3. Integrated risk assessment of marine microplastic pollution: - Based on the aforementioned resolved research questions, an integrated risk
assessment was designed and performed aiming at addressing the question “Do microplastics pose a “real” risk to man and the environment?” Microplastics are considered to pose a threat to human health or the ecological systems when their environmental concentration exceeds a safety threshold. This threshold should be considered as the concertation below which no harmful effects to human health or ecological systems will occur.
Each research question is addressed in a separate chapter. A more comprehensive description of the research questions addressed is given in the following section, where the scope of this thesis is discussed in more detail.
6. Scope of this thesis in relation to research objectives and hypotheses
The first part of this thesis consists of three chapters and reflects the research performed as part of the exposure assessment of microplastic pollution in the marine environment. Here, sources and emissions of microplastics are discussed, as well as the occurrence of these plastics in different marine habitats.
While the majority of the research presented in this thesis focuses on the marine environment, Chapter 2 focusses on the freshwater environment. Rivers, connecting land and sea, play an important role as pathways through which plastic litter generated on land can reach coastal waters and eventually open oceans. Yet, they have received much less attention than the marine environment. Consequently, in this chapter we focus on the Scheldt river, Belgium. More specifically, we focus on the spatial distribution of microplastics along the river continuum, in an effort to assess and quantify the contribution of land-based point and diffuse sources of microplastic (e.g. sewage treatment plants and urbanisation) to both the freshwater and marine environment.

General introduction and outline
25
1
Chapter 3, subsequently, describes the current state of the Belgian marine environment with respect to marine litter in general, and microplastics more specifically. Former research and monitoring activities mainly focused on one specific marine compartment. As a result of this approach, the quantitative distribution of marine litter across marine compartments has long remained unclear. The study described in this chapter was designed to tackle this lack of knowledge. It presents an overall picture of marine plastic pollution and its degradation products in three compartments of the Belgian marine environment: the beach, the sea surface and the seafloor of the Belgian Continental Shelf. In this way it provides a baseline for future monitoring and research efforts of marine litter in this region.
In Chapter 4, we investigated the pristine marine habitats of the deep sea. Accumulation zones of floating plastic debris and associated microplastics are located in the open ocean areas, i.e. far from any continental margin. As sediments are often considered a sink for microplastics, we investigated whether this is also the case for deep-sea sediments. As particulate material can be rapidly exported to abyssal depths, microplastic particles should be no different. The hypothesis that micro-sized plastic particles have invaded the deep-sea as well was tested – for the first time ever – by analysing sediments from a range of deep-sea locations.
In the second part of this thesis, aspects of the accumulation of microplastics in marine biota and their effects are studied and discussed. Here, attention is not only directed towards to the accumulation and effects in marine biota, but human health issues are also considered and explored.
Chapter 5 describes how accumulation of microplastics in marine biota can occur even at environmentally relevant concentrations. In previous research, assessment of microplastic ingestion was often performed at extremely high concentrations: up to several thousand times higher than observed ambient (marine) concentration. While such an approach is often justified as needed to predict effect concentrations and assess the tested pollutant, testing at high, non-natural, concentrations does not provide any information on the current environmental situation, which is equally, if not more, important. Therefore, we examined the presence of microplastics in ‘naturally exposed’ marine organisms, i.e. organisms originating from and hence exposed in the field. Additionally, in this chapter we also tested the hypothesis that microplastic ingestion can adversely affect energy metabolism in these species. Energy metabolism was chosen as the parameter/biomarker of interest, as feeding (on plastics) does not come without a cost to these organisms and might consequently affect all aspects of the life history of these organisms. Indeed, while the inert plastic particles will not provide them with any nutrients or energy to account for the cost of ingestion.

Chapter 1
26
1
In Chapter 6 we investigate the presence of microplastics in seafood. As there is increasing scientific evidence that numerous marine species will ingest microplastics when these are present in the surrounding environment, there is a concern that these microplastics may enter the marine food chain and transfer from lower trophic level organisms to a higher level species. Taking into account that seafood is consumed in high volumes all over the world, with humans being top predators, the marine compartments of the human food web may be affected as well. We therefore assessed the presence of microplastics in bivalves cultured for human consumption. As aquaculture of seafood (including bivalves) is mainly performed in natural seawater, these organisms are exposed to any pollutant present in the seawater, including microplastics. Therefore, there is a great potential for the contamination of commercially important species with microplastics.
Chapter 7 describes how seafood contaminated with microplastics can have consequences for human food safety. Using an intestinal human cell line (Caco-2) as a model, we tested in vitro the effects of microplastic ingestion in humans. Both direct effects on the exposed cells (cytotoxicity) and transport of the ingested particles were investigated. As translocation, i.e. the transport of particles through the cell layers lining the gut wall, has already demonstrated in marine invertebrates, the translocation potential of microplastics, ingested while consuming contaminated seafood, through the human gut wall was assessed.
Finally, in the third part of this thesis, all aspects of the exposure and effect assessment are integrated into a comprehensive risk assessment. In Chapter 8, all information collected in the previous six chapters is combined with data from literature in an attempt to address the question whether microplastic contamination of the marine environment is an issue for concern. In other words, here we attempt to answer, in a quantitative manner and based on all available scientific information, the main question posed by all stakeholders (the public, regulators, industry, politicians, academia…): does microplastic pollution pose a real risk to man and the environment?

PART 1 EXPOSURE ASSESSMENT


2 Land-based sources of microplastics:
Rivers and sewage treatment plants

Chapter 2
30
2
ABSTRACT
Rivers are often considered major contributors of litter – including microplastics – to the oceans, and there are indications that they are responsible for the transport of significant amounts of microplastics to the marine environment as well. However, the freshwater environment is remarkably underrepresented in microplastic research. We therefore investigated the occurrence and distribution of microplastics in sediment of the Belgian Scheldt River. Sampling locations along a river transect were selected to represent areas influenced by various diffuse and point sources. Our results indicate that the Scheldt is heavily polluted with microplastics: abundances ranged from 0.6 to 50.1 microplastics.g-1 dry weight. As expected, microplastic concentrations in river sediment were substantially higher in the vicinity of point sources, such as a plastic production plant (21.6 – 44.1 MPs.g-1 dry) and a sewage treatment plant (STP) (35.7 – 50.1 MPs.g-1). The STP, which is discharging directly into the river, was investigated in more detail. Here, microplastic concentrations of the incoming sewage, outgoing effluent and thickened sludge were assessed. As the STP only removed half (43.6%) of the microplastics present in the sewage, large amounts of microplastics are released into the environment: a median of 12 microplastics.L-1, corresponding to an average daily discharge of 2.3 × 10⁸ microplastics for this particular STP. With this initial assessment of river sediments, we were able to identify important point sources of microplastics and demonstrate the magnitude of microplastic pollution in rivers.

Sources of microplastics: Rivers and sewage treatment plants
31
2
1. Introduction
Marine litter, especially plastic debris, has been the subject of research for many decades now. Sources of marine litter are manifold and very diverse, but land-based sources are considered to have the highest contribution to marine plastic pollution (Sheavly and Register, 2007; UNEP, 2009). Indeed, rivers play an important role as pathways, connecting land to sea, through which plastic litter generated in inland areas can reach coastal waters (Gasperi et al., 2014; Morrit et al., 2014; Rech et al., 2014). It has been established that there is a proportional relationship between the river flow rate and amount of litter transported: large rivers, characterised by high surface flow rates and the presence of bottom currents, export more litter into the marine environment than smaller rivers (Galgani et al., 2000). For example, Lechner et al. (2014) detected high abundances of plastic litter in the Danube River. They estimated that the plastic input into the Black Sea of this river is 4.2 tonnes per day, or 1,533 tonnes per year (Lechner et al., 2014). Strikingly, almost 80% of the plastics detected floating in the Danube River was large microplastics (LMPs), more specifically industrial resin pellets, indicating that rivers may also play an important role in the transport of microplastic litter.
Microplastics introduced into the freshwater environment can originate from a number of sources. Secondary microplastics, arising from degradation and weathering of macroplastics, can enter freshwater bodies and waterways as a result of urban and agricultural runoff. Norén and Naustvoll (2010) have suggested that a large fraction of microplastics detected in coastal waters seem to be related to city dust (e.g. synthetic rubber from car tyres), while wear and tear of agricultural mulch and greenhouse films are also considered important sources (Sundt et al., 2014). Industry can contribute significantly to microplastic pollution in nearby water bodies, as was demonstrated by Dubaish and Liebezeit (2013) and Norén (2007). Through the discharge of contaminated domestic sewage, both primary and secondary microplastics are introduced in the environment (Cole, et al., 2011; Fendall and Sewell, 2009). Two common, everyday practices emit microplastics into domestic sewage: the use of personal care products (PCPs) containing so-called microbeads, and the washing of synthetic clothing (Browne et al., 2011; Fendall and Sewell, 2009; Zitko and Hanlon, 1991). The use of primary microplastics in PCPs is widespread, and it has been estimated that in Europe alone 4,000 tonnes of such microbeads are used in PCPs on an annual basis, suggesting a discharge of 8 gram per capita per year (Sundt et al., 2014). Secondary microplastics in sewage arise from the weathering of synthetic clothing during the washing process (Browne et al., 2011). Washing a single garment can release more than 1,900 fibres per washing cycle (Browne et al., 2011). Sewage treatment plants (STPs) receive high amounts of microplastics originating from urban runoff (sewage system) and domestic sewage in their influent. Due to the small dimensions of these microplastics, they are not easily

Chapter 2
32
2
removed or retained by the STP processes. Consequently, sewage treatment plants (STPs) are considered to be an important source of microplastics to the freshwater environment (HELCOM, 2014; Leslie et al., 2012).
While it is becoming more and more apparent that rivers are significant contributors to the marine (micro)plastic pollution, the freshwater environment is remarkably underrepresented in microplastic research (Wagner et al., 2014). The few available studies do demonstrate the presence of large amounts of microplastics in freshwater systems. A study of the Great Lakes revealed on average 43,000 microplastics per km2 at the water surface, with elevated abundances (factor 10 higher) near densely populated cities (Eriksen et al., 2013). This trend was confirmed in the Chesapeake Bay by Yonkos et al. (2014). Additionally, an assessment of beach sediments at a subalpine lake demonstrated high abundances of degraded plastic particles (Imhof et al., 2013).
In order to address this “freshwater” knowledge gap, we assessed the occurrence and distribution of different types of microplastics present in sediments of the Scheldt river, Belgium. Sampling sites were selected to allow evaluating the influence of population density, the transport of microplastics from tributaries to the main stream, and the contribution of point sources. Point sources of microplastics investigated here were a plastic production plant and an STP which discharges its effluent directly into the Scheldt.
2. Material and Methods
2.1 Sampling sites
The Scheldt River studied here has its origin in France, flows through Belgium and reaches the North Sea near Vlissingen, The Netherlands. The total length of the Scheldt including the estuary is about 350 km and the tide influences river flow up to the city of Ghent, Belgium (180 km inland). While passing through Belgium, the Scheldt flows through highly populated as well as industrial areas.
River sediment was sampled at 4 locations (Figure 1 and Table A1). The first sampling station (R1) was located in a rural area, just before the river entered the urban area of the city of Oudenaarde. Two sampling stations were located near a sewage treatment plant (STP) in Destelbergen: S1 100 m before the discharge point of the treated sewage, while S2 was located 100 m after this discharge point. The transport of microplastics from river tributaries was investigated by sampling river sediment before and after the confluence of the Rupel river with the Scheldt: i.e. sampling stations C1 and C2, respectively. While the Rupel is only 12 km long, it collects water from 6 other rivers, thus covers a large part of the drainage basin of the Scheldt in Belgium. The last sampling location was representative of an industrial area. All three sampling stations here are located within the

Sources of microplastics: Rivers and sewage treatment plants
33
2
port of Antwerp, the biggest seaport of Belgium and the second biggest port of Europe. Here, we sampled in the vicinity of a plastic production plant (I1 and I2), and in a convex river bend (I3) further downstream.
Figure 1: Sampling stations along the Scheldt (dark blue). Sampling stations were selected to represent areas experiencing different (anthropogenic) pressures, which could result in a microplastic contamination pattern along the river continuum. Sampling stations are represented by red circles: R1 is representative of a rural area, S1 and S2 are located in the vicinity of an STP, C1 is located upstream of the confluence of the confluence of Scheldt and Rupel, while C2 is located downstream, I1 and I2 are representative for an industrial area and are located near a plastic production plant, more downstream I3 is located in a convex river bend. Green squares represent cities through which the Scheldt flows.
As the river sediment was sampled near an STP (S1 and S2) to account for microplastic pollution originating from this point source, a complete assessment of the microplastic load within this STP was also performed. Here, incoming influent, the retained sludge and discharged effluent in an STP treating 59,400 inhabitant equivalent (IE) were analysed for microplastic content. This was done in an attempt to quantify and qualify microplastic pollution entering and leaving the STP, as well as assessing the microplastic removal efficiency of the treatment process.
2.2 Contamination prevention measures
Contamination with airborne microplastics is a recurring phenomenon in microplastic research. Rigorous precautions should thus be taken during sample processing. In this study, extensive measures were adopted to avoid any contamination while handling and processing samples:

Chapter 2
34
2
(i) Contact of the samples to the air was restricted as much as possible; sample processing was performed in a closed space and samples and sieves were covered at all times.
(ii) All material and equipment used during sampling and sample processing was rinsed thoroughly (three times) before use with filtered deionised water (0.8 μm; Supor-800 Pall Corporation).
(iii) Where possible, glass and metal equipment and recipients were used. If plastic containers had to be used, contamination originating from this material was quantified and characterised. Final concentrations were corrected for the contamination originating from these recipients
(iv) All liquids used during extraction (see Section 2.3 and Section 2.4) were filtered (0.45 μm: Supor-450 Pall Corporation) before use.
(v) A 100% cotton lab coat was worn at all times, to prevent contamination with synthetic fibres originating from clothing.
2.3 Sediment sampling and microplastic extraction
2.3.1 Sediment sampling Intertidal sediment samples were collected in December 2014. At each sampling
station, three subsamples were collected, each 3 m apart and at 3 to 5 m from the river bank. In locations influenced by the tides (all stations, except R1), samples (approx. 250 cm2) were taken during low tide using a stainless steel scoop to a depth of 5 cm. At the R1 sampling station, a Van Veen grab (250 cm2 sampling surface) was used to sample river sediment (5 cm depth), as this location was outside the tidal range, and hence constantly submerged. Samples were stored in glass jars (1 L).
2.3.2 Microplastic extraction After homogenisation using a metal spoon, 3 to 5 g of wet sediment was treated with
20 mL 30% hydrogen peroxide (H2O2) to remove natural organic debris. This pre-treatment was necessary as the river sediment was found to contain high amounts of organic matter. After 24h of oxidation, the sample was diluted 1:4 (v:v) with filtered water and consecutively sieved over 35 μm and 15 μm sieves to reduce sample volume. This resulted in two size fractions for further analysis: > 35 μm and 15 – 35 μm. Microplastics were extracted from the residue collected on the sieves by density separation using a high-density salt solution (Claessens et al., 2013). Briefly, this method entailed that the solids collected on the sieves were transferred to a 50 mL centrifuge tube, and 40 mL of a NaI-solution (1.6 g.cm3), was added. This was followed by vigorous (manual) shaking and centrifugation for 5 min at 3,500×g. After centrifugation, the top layer containing the microplastics was vacuum filtered over a 5 μm membrane filter (Whatman AE98). This NaI-extraction step was repeated two to three times to ensure that

Sources of microplastics: Rivers and sewage treatment plants
35
2
all plastic particles are removed from the sediment sample. After filtration, filters were transferred to a petridish and dried at 40°C for at least 24h.
2.3.3 Sediment characterisation In order to investigate the influence of river hydrodynamics and sedimentation regime
on microplastic abundance in sediments, the organic content and granulometry of the samples was determined.
Organic content was measured (ASTM, 2014) by drying and incinerating 5 g of a well-mixed sediment sample in a high temperature oven at 550°C. This sample was first weighed in a pre-dried (100°C) porcelain cup; followed by 12h of drying in an oven set at 100°C. After drying, dry weight (∆dry) was determined with a precision of 0.01 g. The samples were subsequently placed in an oven at 550°C for 16h. After cooling down in a dessicator, the incinerated samples were weighed and dried at 550°C for an additional hour until no more changes in mass were detected (∆ox). The amount of organic matter is then calculated using Equation 1:
[Eq. 1]
Granulometric analysis was performed for each sampling station by pooling the three replicate samples collected into one sample of approx. 100 g. Five size fractions were determined: < 2 μm, 2 – 20 μm, 20 – 50 μm, 50 – 63 μm and > 63 μm. The analysis was performed at an external, accredited lab (AL-West B.V., Deventer, The Netherlands) using the sedigraph method to determine the concentration of suspended solids.
2.4 Sewage sampling and microplastic extraction
2.4.1 Sewage sampling The sewage treatment plant (STP) in Destelbergen was sampled once in November
2014, and an additional four times (every Wednesday morning at 10:00 am) during March and April 2015. At the STP, the incoming influent (i.e. sewage) and two outgoing flows, the treated sewage (i.e. the effluent) and the sewage sludge, were sampled.
The incoming sewage was sampled right after the inlet screen (aperture size 6 mm). These influent bulk samples (10 L) were collected and stored in a rinsed plastic (PP) bucket. The effluent was sampled in a similar manner: i.e. by collecting 10L bulk samples at the end of the treatment process. After sampling, bacterial growth was prevented by adding liquid bleach (< 5% NaClO). Samples were stored at 4°C until analysis.
Sewage sludge, the semi-solid material produced as a by-product during sewage treatment, was collected after the thickening stage. During the sewage process, the excess of sludge is wasted and de-watered using a table thickener. This dewatered sludge (5% dry solids), or thickened sludge, was collected in glass jars (2.6 L). These samples were

Chapter 2
36
2
stored at 4°C as well. It was not possible to collect the thickened sludge at all five sampling days, since sampling of the thickened sludge is only possible when the table thickener is active. As there is no constant supply of wasted sludge to the table thickener, the table thickener is not constantly active. Therefore, sludge sampling was performed in November 2014 and only once in March 2015.
2.4.2 Microplastic extraction aqueous samples Influent and effluent bulk samples were vigorously mixed using a magnetic stirrer, to
ensure homogenisation of the sample, before a 1L subsample was collected. This was then consecutively sieved over a 35 μm and 15 μm sieve, to obtain a volume reduction. Residues from both size fractions (i.e. > 35 μm and 15 – 35 μm) were then treated with 30% H2O2, to remove organic matter. The volume of H2O2 added was dependent on the volume of sample to be treated, and was adjusted so that a final 15% H2O2 and sample solution was obtained. After 24h, both fractions were diluted 1:1 (v:v) with filtered deionised water and sieved again. Microplastics were extracted from both residues using density separation with NaI (1.6 g.cm-3) (Claessens et al., 2013). After centrifugation, the solution containing the microplastics was vacuum filtered over a 5 μm membrane filter (Whatman AE98), and filters were transferred to a petridish and dried at 40°C for at least 24h.
2.4.3 Microplastic extraction thickened sludge samples To each 3 g sludge subsamples 20 mL of liquid bleach (< 5% NaClO) was added as
bactericidal agent. After 48h, 20 mL of 30% H2O2 was added to oxidise organic matter. After 24h, this solution was diluted 1:4 (v:v) with filtered deionised water. Subsequent extraction was performed by consecutively sieving this solution over a 35 μm and 15 μm sieve. Residues on both sieves were collected separately in a NaI solution and centrifuged for 5 minutes at 3,500×g. After centrifugation, the top layer containing the microplastics was vacuum filtered over a Whatman AE98 5 μm membrane filter. This NaI-extraction step was repeated three times to ensure that all plastic particles were removed from the sample. After filtration, filters were transferred to a petridish and dried at 40°C for at least 24h.
In order to report microplastic concentration per gram dry solids, dry weight of the sludge was determined. Four samples were oven-dried at 60 °C for 72 hours, and then weighed to determine dry solid content.
2.5 Microplastic identification and characterisation
After drying for at least 24h, filters containing the extracted microplastics were analysed using a microscope (Olympus BX41) at magnification 10×10 with a camera (Olympus UC30) mounted on top. In combination with the software CellSens®, both length (longest dimension) and width (perpendicular to length) were measured.

Sources of microplastics: Rivers and sewage treatment plants
37
2
After visually identifying potential microplastics, a final identification using micro-Raman spectroscopy was performed to confirm the anthropogenic nature of these particles. In this technique, a laser interacts with molecular vibrations in the material under investigation, resulting in an energy shift in the laser photons. This shift in energy is detected on a detector and a “fingerprint” is produced. The molecules making up the material under investigation is identified in this way. A subset of 55 microplastics, representative of the different types (fragments, spheres and fibres) and colours observed, were analysed. The Raman spectrometer (Bruker Optics ‘Senterra’ dispersive Raman spectrometer coupled with an Olympus BX51 microscope) was operated at a laser wavelength of 785 nm (diode) and high resolution spectra were recorded in three spectral windows, covering 80–2660 cm-1. The microscope had a 50x objective, with a spot size of approximately 4 micrometre. The instrument was controlled via the OPUS 6.5.6 software.
3. Results
3.1 Microplastic identification
Microplastics detected in the samples were classified into classes according to colour and shape and were analysed using micro-Raman spectroscopy to identify plastic type. None of the 55 spectra obtained matched those of common plastics present in the reference library. They did, however, match the spectra of commonly used pigments. The spectra obtained for red, blue, green and orange particles corresponded to those for pyrrol and naphthol red, phthalocyanine blue, phthalocyanine green and benzidine orange, respectively. These are synthetic pigments, commonly used in plastic colouring (Lewis, 2004). Although the particles were not directly identified as microplastics, the presence of these pigments can be considered an indirect indication for classifying these particles as microplastics.
3.2 Abundance of microplastics in a sewage treatment plant
High concentrations of microplastics were observed in all three STP compartments analysed: the influent, effluent and thickened sludge waste stream. High inter-sample (i.e. temporal) variability was noted: microplastic concentration varied from 9 to 45 MPs.L-1 in the influent and 6 to 25 MPs.L-1 in the effluent (Table 2).
The performance of the STP in microplastic removal was assessed by calculating the removal efficiency (%) based on the median incoming (influent) and outgoing (effluent) concentrations (Table 2). As influent and effluent concentrations showed high temporal variability, the removal efficiency showed similar variations over time: 33 to 54% of microplastics entering the STP are removed during the sewage treatment process (Table

Chapter 2
38
2
2). On average, over half of the microplastics (56.4%) entering the STP will be emitted into the environment, together with the effluent (average removal efficiency of 43.6%).
Table 2: Microplastic concentration measured in different STP compartments. Median microplastic concentrations (range) in influent, effluent (microplastics.L-1) and thickened sludge (microplastics.g-1 dry solids) are presented. The STP removal efficiency (%) calculated using the median influent and effluent concentrations.
Sampling date Influent
microplastics.L-1 Effluent
microplastics.L-1 Removal efficiency
Thickened sludge microplastics.g-1DS
25/11/2014 37 (35 - 41) 19 (16 - 25) 48.7% 204.2 (193.0 – 318.4) 18/03/2015 37 (23 - 41) 17 (16 - 19) 54.1% n.a. 25/03/2015 20 (18 - 45) 12 (11 -12) 40.0% 322.7 (277.8 – 339.6) 01/04/2015 15 (11 - 17) 10 (9 - 11) 33.3% n.a. 08/04/2015 12 (9 - 13) 7 (6 - 8) 41.7% n.a.
In the four week period from March to April 2015, when sampling was fixed on Wednesdays at 10:00 am, the STP of Destelbergen treated 17,000 to 20,000 m3 of waste water per day. An exceptionally high flow (over 40,000 m3) was received on 25/03/2015, as a result of heavy rainfall (Figure A.1). The high flow rate of sewage entering on 25/03/2015 resulted in double the amount of microplastics entering the STP that day (Figure 1). The daily total discharge of microplastics into the environment increased by 81%: from 2.8×10⁸ microplastics.day-1 on the first sampling day (18/03) to 5.1×10⁸ microplastics.day-1 on 25/03.
Figure 1: Daily total microplastic content in influent and effluent during a 4-week period. The daily total inflow and discharge is calculated using the median microplastic concentration (per litre) detected in both influent and effluent and the daily flow rate of sewage through the STP. Sampling occurred every Wednesday at 10am.

Sources of microplastics: Rivers and sewage treatment plants
39
2
Microplastics removed from the sewage end up the waste stream of the STP, i.e. the thickened sludge. The fraction of dry solids (DS) in this thickened sludge varied from 5.7 ± 0.2% on 25/11 and 8.4 ± 0.4% on 25/03. The STP of Destelbergen produces 742 tonnes of dry solids (DS) per year, or roughly 2 tonnes of DS per day. Based on the median microplastic load of the thickened sludge (Table 2) a removal rate of 4.1 to 6.5 × 10⁸ plastics.day-1 was calculated.
Microplastics detected in the STP were classified according to shape: fragments, fibres and microbeads were discerned. Influent consisted mainly of fragments (84.8%) while fibres and microbeads represented 10.3% and 4.9% of the detected microplastics, respectively. Although fragments were again most dominant in the effluent, there seemed to be a small decrease in their numbers (78.4%), while fibres showed in increase and represented 14.9% of microplastics in the effluent. Only a very limited number of fibres were detected in the waste stream, i.e. the thickened sludge: here, only 2.0% of the microplastics were fibres.
For all three sampling locations inside the STP, particle size distributions of the microplastics, pooled per location for the different sampling dates, were constructed (Figure 2). Because of their length, fibres were excluded from this analysis, as they would skew the data to the right. Particle size distributions for influent, effluent and thickened sludge are very similar: the majority of the particles (67 – 77%) are smaller than 55 μm.
Figure 2: Particle size distributions (PSD) of microplastics detected in the three different STP compartments in the STP. Particle size distributions are presented for microplastic particles and beads (no fibres) detected in the influent (n=335), the effluent (n=208) and the thickened sludge (n=373). Error bars represent the standard deviation between the different sampling days.

Chapter 2
40
2
3.3 Microplastics in river sediments
Microplastics were present at all sediment sampling stations and this in all but one of 24 replicates. Concentrations were generally quite high and variable between stations, but also variable between replicates (i.e. within stations). Measured concentrations ranged over two orders of magnitude: from 0.6 to 50.1 microplastics per gram of dry river sediment (Table 3). All microplastics (with the exception of one) were smaller than 1 mm. More specifically, particles were rarely larger than 115 μm and most abundant in the size classes below 55 μm: this is true for 70 – 90% of particles detected at the different sampling stations (Figure 3). Microplastic particle size distributions of the different sampling stations are similar.
Table 3: Microplastic concentrations detected in river sediment samples. Median microplastic concentrations (MPs.g-1 dry) (n=3) detected in sediment samples collected at the sampling stations along the Scheldt river.
Sampling location Station Median concentration (microplastics.g-1 dry)
Concentration range
Rural area R1 4.0 3.4 – 6.5 Sewage treatment plant S1 35.7 27.4 – 60-7 S2 50.1 43.0 – 52.6 Confluence of rivers C1 31.0 29.0 – 38.5 C2 16.2 9.8 – 20.7 Industrial area I1 21.6 18.8 – 30.8 I2 44.1 25.3 – 58.4 I3 0.6 0 – 3.1
As mentioned above, microplastic concentrations detected in the river sediment differed considerably among the different sampling locations in the Scheldt river (Table 3). While concentrations were low at the sampling location closest to the source (R1), they increased substantially along the river transect. Abundances near point sources, such as an STP or a plastic production plant, reached maxima of 60 particles-g-1dry sediment. As microplastics pollution originated from anthropogenic sources, microplastic abundance in sediments may be related to population density. Although the sampling locations R1 to I3 represent areas of different population densities, no significant correlation with microplastic abundance in sediments was detected (n=8, r² = 0.042, p = 0.6351) (Figure 4).
While the presence of local point and diffuse sources could be important factors for explaining and predicting the occurrence of microplastics, local hydrodynamics may also play an essential role in influencing microplastic distribution and abundance in sediments. As local hydrodynamics will influence the settling and re-suspension of microplastics and other particles, the fraction organic matter (%OM) and particle size distribution of

Sources of microplastics: Rivers and sewage treatment plants
41
2
sediment particles were used as proxies for local hydrodynamics. Although not significant, %OM and sediment particle fraction < 63 μm best explained the observed microplastic abundance in Scheldt river sediment (%OM: n=8, r² = 0.42, p = 0.0819; < 63 μm: n=8, r² = 0.42, p = 0.0801) (Figure 5 and Figure A.2).
Figure 3: Particle size distributions (PSD) of microplastics detected in river sediment collected along the river Scheldt transect studied. A.: PSD of pooled particles detected at station R1 (n=19), B.: PSD of pooled microplastics detected before the STP (n=211), C.: PSD of pooled microplastics detected after the STP (n= 183), D.: PSD of pooled particles detected before the confluence of Scheldt and Rupel (n=134), E.: PSD of pooled particles detected after the confluence of rivers (n=65), F.:PSD of pooled microplastics detected before the plastic production plant (n=88), G.: PSD of pooled microplastics detected in river sediments after the plastic production plant (n=163). The PSD of sampling location I3 is not included, as too little microplastics were extracted at this location.

Chapter 2
42
2
4. Discussion
Data on the occurrence and distribution of microplastics in the freshwater environment is scarce compared to that for the marine environment (Wagner et al., 2014). Yet, microplastic pollution of both environments should be seen as a whole as both are inextricably connected due to their riverine connection (Rech et al., 2014). There is a growing consensus that rivers play a critical role in the transport of (micro)plastics from inland sources to marine systems (Gasperi et al., 2014; Morrit et al., 2014; Rech et al., 2014). Although still a minority in microplastic research, there is a growing interest in microplastic pollution of freshwater systems.
Figure 4: Correlation of the population density and the concentration of microplastics detected in the river sediment. Sampling stations are indicated next to their respective data point.
Figure 5: Correlation of sediments characteristics and microplastic concentration detected in river sediment. A.: Correlation of microplastic concentration (MPs.g-1 dry) to the fine (< 63 μm) particle fraction of the sediment, B.: Correlation to the fraction of organic matter (%OM) present in the sediment. Sampling stations are indicated next to their respective data point.
4.1 Sewage treatment plants as point sources of microplastics
Microplastics were present in high concentrations in all three compartments of the STP that were sampled: the incoming influent and the discharged effluent and thickened

Sources of microplastics: Rivers and sewage treatment plants
43
2
sludge. Based on the median concentrations of microplastics in the influent and the concentration still present in the effluent after sewage treatment, an average microplastic removal efficiency of 44% was calculated (Table 2).
Similar investigations on STPs have been performed across the globe, and while incoming concentrations of microplastics are often comparable, large variations in removal efficiencies can be noted. In the Netherlands, for example, microplastic (> 0.7 μm) concentrations in the effluent were in the same order of magnitude as those detected here: on average 20 microplastics.L-1 (Leslie et al., 2012). However, influent concentrations were considerable higher in the Dutch STP. Here, on average 200 microplastics per litre were detected, resulting in a calculated removal efficiency of that particular STP of 90% (Leslie et al., 2012). In St – Petersburg (Russia), 627 microplastics larger than 20 μm (160 particles and 467 fibres) were detected per litre of wastewater entering the STP (HELCOM, 2014). After the sewage treatment process, only 54 (21 particles and 33 fibres) remained. This study hence also reported a removal efficiency of 90% (HELCOM, 2014).
The STP investigated in our study does not perform quite as well as these in the Netherlands (Leslie et al., 2012) and Russia (HELCOM, 2014). The design of the STP will play an important role in determining the microplastic removal efficiency. The STP in our study is a rather simple one by design. Apart from the 6 mm inlet screen, which will only remove macroplastics (i.e. plastics > 5 mm), no additional pre-treatment step that could result in the retention of microplastics (e.g. filtration on a sand bed) is performed. Subsequent sewage processing comprises of a secondary treatment using activated sludge for the removal of dissolved and colloidal compounds (measured as biological oxygen demand (BOD)). After residing in the sedimentation tank, to allow for the settlement of the activated sludge, the final effluent is directed towards the Scheldt River. No additional tertiary treatment steps, involving for instance filtration, are included in the treatment process. Yet, is has been demonstrated that such additional treatment of the effluent can significantly decrease the remaining microplastic concentration of the effluent. Leslie et al. (2012) demonstrated that the removal efficiency of an STP will increase to 95% when ultrafiltration (0.08 μm) of the effluent is performed. Similarly, it was demonstrated at a German STP that a final filtration of the effluent will further decrease microplastic concentrations by 97% (Mintenig et al., 2014).
As is often the case in microplastic research, the lower size limit applied during extraction and identification will influence the number of microplastics detected. This is demonstrated when comparing microplastic concentrations detected in this study, and those observed by Leslie et al. (2012) and HELCOM (2014), with those reported by other researchers. Murphy et al. (2015) detected only 0.9 microplastics.L-1 in the effluent of a Scottish STP, while in New York effluent concentrations ranged between 0.00579 and

Chapter 2
44
2
0.0468 plastics.L-1 (Chaskey et al., 2014). These concentrations are several orders of magnitudes lower than those reported here for the STP of Destelbergen. However, both studies apply lower size limits which are substantially higher than those applied here and in the previously mentioned research. While Murphy et al. (2015) reported microplastics larger than 60 μm, Chaskey et al. (2014) only collected microplastics > 125 μm. The size distributions reported in our study indicate, however, that the majority of microplastics in waste water is smaller than 55 μm (Figure 2). More specifically, over 75% of microplastics in influent and effluent are smaller than 55 μm, while 95% is smaller than 125 μm. Hence, not including the smallest size fractions in the analysis severely underestimates microplastic emissions into the environment.
Although microplastic concentrations entering and subsequently leaving the sewage treatment plant of Destelbergen vary significantly over time (Table 2), on average 4.9 × 10⁸ microplastics enter the STP per day (median). The treatment process approximately removes half of these microplastics from the sewage (Figure 3). The release into the environment, here the Scheldt, is thus still substantial: on average 2.3 × 10⁸ microplastics per day (median). The particles are successfully removed from the sewage during the treatment process, are removed as a result of co-sedimentation with the activated sludge present in the STP. Microplastic concentrations in the thickened sludge were high, 298.1 microplastics.g-1 DS, accounting for roughly 6.0 × 10⁸ per day (Table 2). As the values presented here are medians, and substantial variations in daily load and daily flow of the three streams exist, the two flows leaving the STP, i.e. the effluent and the waste flow of the thickened sludge, account for more microplastics (169%) than the incoming flow, i.e. the influent (Figure 6).
Figure 6: Mass balance of the STP of Destelbergen. An average plastic removal efficiency of 47% is obtained in this STP. This removal efficiency is based on daily loads, calculated using influent, effluent and thickened sludge microplastic concentrations and the daily flow of these streams.
The large variations in daily load and daily flow are clearly illustrated when comparing the data collected during the one month of weekly sampling (March – April 2015) (Figure 1). For example, the second sampling day in March (25/03) had the highest daily load of

Sources of microplastics: Rivers and sewage treatment plants
45
2
microplastics in the incoming sewage with double the amount of microplastics entering the STP compared to 18/03, the day with the second highest daily load. These differences can be attributed to the prevailing meteorological conditions: after a long dry period, two days of heavy raining preceded the sampling day on 25/03 (Figure A.1). As this resulted in an increased flow of incoming sewage, low microplastic concentrations were expected. Yet, no effect of dilution was observed (Table 2). This increase in total microplastics entering the STP can be attributed to so-called “first flush effects” (Lee and Bang, 2000). During long periods of dry weather, small debris and city dust (including microplastics) accumulate on the streets, and in the gutters and sewage pipes. The flow of rainwater created by heavy rainfall will sweep this city dust to the STP, resulting in an increased total microplastic load of the influent. As a result, the total amount of microplastics in the effluent increased as well: 80% more microplastics were emitted into the Scheldt that day.
The microplastics removed from the sewage end up in the thickened sludge collected at the end of the sewage treatment process. This thickened sludge is the waste product of the sewage treatment process and any excess of sludge is regularly removed from the STP. Hence, one could consider the microplastics trapped in this sludge to be permanently removed from the environment. Unfortunately, this is not always true: sludge produced at STPs can have different fates and is used in a variety of applications. In some countries the thickened sludge is combusted with energy recuperation (Werther and Ogada, 1999). In such cases, the microplastics are incinerated together with sludge, without them entering the environment. In other countries, on the other hand, the sludge is used in agriculture and other land cover applications (Mantovi et al., 2005). Some of these microplastics may eventually still end up in the surrounding freshwater or marine environment as a result of erosion and run-off.
Although STPs have often been called sources of microplastics to the environment, this statement should be put into perspective. While it is true that STPs release microplastics into the surrounding aquatic environment, they can hardly be considered the sources of these microplastics. On the contrary, STPs are actually temporal reservoirs of microplastics originating from domestic and industrial activities and urban run-off. Moreover, by removing part of the microplastics from the incoming effluent, STPs are actually preventing a large amount of microplastics from entering aquatic systems. So, instead of considering STPs to be sources of microplastics, they should better be regarded as temporal accumulation basins of microplastics that prevent part of the microplastics from entering the environment.
4.2 Microplastics in the freshwater environment
Microplastics were highly abundant in sediment of the Scheldt. The concentrations ranged from 0.6 to 50.1 microplastics.g-1 dry weight (Table 3). Based on the (limited

Chapter 2
46
2
amount of) data available on microplastic pollution in freshwater systems, the Scheldt River appears to be one of the most heavily polluted rivers with respect to microplastics (Table 4). However, as is the case for marine microplastic research, differences in sampling strategies and extraction techniques influence the comparability among studies. As is clear from Table 4, different size ranges and different units are reported.
Table 4: Microplastic concentrations detected in freshwater sediments around the world. For several freshwater systems (rivers and lake) reported microplastic concentrations and size range of microplastics is provided.
Location Particle size Microplastic concentration Reference
Lake Garda (Italy) 1 μm – 5 mm 1,108 ± 983 MPs.m-2 Imhof et al., 2013 St. Lawrence river (Canada) 0.5 – 2 mm 13,832 MPs.m-2 Castañeda et al., 2014 Rhine – Main rivers (Germany) 63 μm – 5 mm 228 – 3,763 MPs.kg-1 Klein et al., 2014 Scheldt river (Belgium) 15 μm – 5 mm 646 – 50,124 MPs.kg-1 This study
Klein et al. (2014) report between 228 and 3,763 microplastics per kg of sediment while Scheldt sediment contained 646 to 50,124 microplastics per kg of sediment. The concentrations of microplastics in the Scheldt sediment are hence an order of magnitude higher than those reported for the Rhine and Maine River in Germany (Klein et al., 2014). However, Klein et al. (2014) reported (only) microplastics larger than 68 μm, while in the Scheldt the majority of microplastics were < 55 μm (Figure 3). When excluding all particles smaller than 65μm detected in our study, microplastic abundances decrease notably: i.e. from 200 to 12,029 microplastics.kg-1 dry. While these abundances are somewhat more in the range of those reported by Klein et al. (2014), the highest concentrations (i.e. those detected near the STP) are still three times higher. The sediment of the river Scheldt thus appears to be heavily polluted with microplastics.
The results presented here show that the extent of microplastic contamination in the Scheldt is comparable to or even more extensive than that noted in marine environments. Comparable microplastic concentrations were reported for two East Frisian Islands in the North Sea (Liebezeit and Dubaish, 2012). Here, microplastic concentrations ranged from 3,600 to 49,600 particles.kg-1. However, the concentrations reported for these islands are among the highest concentrations available in literature. Belgian coastal sediments, also containing some of the highest microplastic concentrations reported (68 – 390 microplastics.kg-1 dry sediment, Claessens et al., 2011), are far less contaminated than the Scheldt sediment. Here, concentrations are up to 120 times lower than those reported for the Scheldt River.
The results of this present study show that the Scheldt represents a heavily polluted system, similar to the Rhine and Danube rivers in Germany (Klein et al., 2014; Lechner et al., 2014). Several factors may explain this contamination level and the high spatial variation (Table 3) detected. These factors are associated with local sources emitting

Sources of microplastics: Rivers and sewage treatment plants
47
2
microplastics into the adjacent freshwater bodies, and (local) hydrodynamic processes, favouring particle settlement. Here, we investigated these sources and processes to improve our understanding of microplastic occurrence and distribution in river sediments.
Local point sources, i.e. the STP and plastic production plant, are important sources of microplastics in the freshwater environment. The highest microplastic concentrations measured in Scheldt sediment were detected near these locations: at the STP concentrations ranged from 35.7 to 50.1 microplastics.g-1 dry, and at the industrial site from 21.6 to 44.1 microplastics.g-1 dry. Concentrations were substantially lower at the other locations. As previously discussed, STPs constitute important point sources of microplastics (up to millions of particles per day), as microplastic removal is far from complete. The contribution of such point sources to microplastic pollution of river sediments was also confirmed by Castañeda et al. (2014). High concentrations of microbeads (up to 136,926 beads.m-2) were detected in sediments of the St. Lawrence River (Canada) near locations receiving municipal or industrial effluents.
The contribution of river tributaries to microplastic abundances in river sediment was not demonstrated for the Scheldt River. We hypothesised that microplastic abundance in the sediment would increase after the Rupel – Scheldt confluence, as Rupel tributaries (i.e. Dender, Zenne, Dijle and Nete) pass through many urban and industrial areas (including Brussels). Therefore, it was expected that these rivers would make a substantial contribution to the microplastic contamination of the Scheldt River.This is especially true if we take into consideration that the Rupel makes up over 2/3 of the flow at the point of confluence (Schelde: 27 m3.s; Rupel: 78 m3.s; Claessens, 1988). However, no increasing trend in microplastic concentration was observed. On the contrary, microplastic concentrations decreased substantially after the river confluence: from a median concentration of 31.0 microplastics.g-1 to 16.2 microplastics.g-1.
In an attempt to explain the unexpected results, we investigated local hydrodynamic processes influencing settlement and re-suspension of particles. The presence of microplastics was most strongly related to the < 63 μm sediment fraction and the organic matter content (%OM) (Figure 5). As these sediment characteristics describe conditions that enhance particle settlement they can be used to predict areas of microplastic accumulation, as was demonstrated by Strand et al. (2013) and Vianello et al. (2013). The influence of local hydrodynamics on microplastic abundance is clearly illustrated by sampling stations I2 and I3. While both are located after the plastic production plant, microplastic concentrations differ significantly. These differences can be attributed to differences in hydrodynamics: I3 is characterised by a very small fraction of small particles and almost no organic matter, indicating the presence of forces suspending this light material. Fine sediment particles, organic matter and microplastics will hence not be

Chapter 2
48
2
allowed to settle at this location, resulting in low concentrations of all three types of particulate material.
Unfortunately, local hydrodynamics do not explain why a decrease in microplastic abundance was detected in C2 (i.e. after the river confluence), when originally an increase was expected. Both sampling location C1 and C2 present similar in composition when regarding both the fraction of organic matter (%OM) and the fraction of small sized sediment particles (% < 63 μm) (Figure 5). However, so for the sampling location after the confluence of two rivers, other factors influencing microplastic sedimentation may be at play. However, it has to be mentioned that no sampling samples in the Rupel River (i.e. before it’s confluence with the Scheldt) were included in this analysis. Therefore, no data on the contamination pattern or the sedimentation conditions in that river are available. Should the conditions for sedimentation in the Rupel be more favourable, the contribution to microplastic contamination in the Scheldt could be substantially lower than initially anticipated.
No clear relationship between the abundance of microplastics and population density was detected, in contrast to Yonkos et al. (2014) and Eriksen et al. (2013), who both detected a clear correlation between microplastic concentration in the water column of rivers and lakes and population density. This relationship was not detected here, as sampling locations were specifically chosen to represent areas influenced by diffuse and point sources of microplastics, and population density at these specific areas does not represent the presence of these specific sources.
5. Conclusions and Recommendations
From this study, it can be concluded that the Scheldt river is a highly polluted freshwater. Especially small microplastic fragments (< 100 μm) are abundantly present in the Scheldt River. Since size is a key factor concerning bioavailability of microplastics (Wright et al., 2013), this poses a potential threat to the functioning of organisms (survival, reproduction …) with potential impacts on ecosystem structure and/or functioning. As the river travels through urbanised areas, the anthropogenic pressure on the system increases resulting in higher contamination levels. Although there was no clear relationship detected between population density and microplastic abundance in river sediments, human activities will directly impact the river’s contamination level, as was demonstrated near the outflows of a sewage treatment plant and an industrial plastic plant.
We recommend for future research to include a larger number and a wider variety of samples locations when investigating the contamination pattern along the river continuum. Including a larger number of sampling locations will enable to better elucidate the impact of anthropogenic pressure on the local environment. These pressures

Sources of microplastics: Rivers and sewage treatment plants
49
2
could arise from industry and urban areas, as well as from agriculture. Hypotheses concerning the influence of river tributaries should be addressed by investigating the contamination pattern within the tributary river as well. By assessing microplastic abundances in both the tributary as well as the receiving river, contamination patterns in the receiving river could more clearly explained. Only by including sampling stations representing areas influenced by different anthropogenic pressures and characterised by differences in local environments (e.g. hydrodynamic state) will allow us to better understand microplastic contamination patterns. Once these factors have been elucidated, hot-spots of microplastic contamination can be identified. Identification of such areas will allow for the adoption of remediating and preventive measures.


3 Marine litter and microplastics on the Belgian Continental Shelf
Redrafted from:
Van Cauwenberghe, L., Claessens, M., Vandegehuchte, M.B., Mees, J., Janssen, C.R., 2013. Assessment of marine debris on the Belgian Continental Shelf. Marine Pollution Bulletin 73, 161-169. DOI: 10.1016/j.marpolbul.2013.05.026.

Chapter 3
52
3
ABSTRACT
A comprehensive assessment of marine litter in three environmental compartments of Belgian coastal waters was performed. Abundance, weight and composition of marine debris, including microplastics, were assessed by performing beach, sea surface and seafloor monitoring campaigns during two consecutive years. Plastic items were the dominant type of macrodebris recorded: over 95% of debris present in the three sampled marine compartments was plastic. In general, concentrations of macrodebris were quite high. Especially the number of beached debris reached very high levels: a median of 5,176 items per 100m were recorded. Microplastic concentrations were determined to assess overall abundance in the different marine compartments of the Belgian Continental Shelf. In terms of weight, macrodebris still dominates the pollution of beaches; while at the sea surface both macrodebris and microplastics appear to be equally important. However, in the seafloor, another trend can be detected. Here, microplastics represent a larger fraction of the pollution as microplastic weight is approximately 400 times higher than macrodebris weight.

Marine litter and microplastics on the Belgian Continental Shelf
53
3
1. Introduction
Decades ago, most of our waste was composed of organic, degradable materials. Now, our solid wastes often contain synthetic elements, plastics in particular. Plastics have a range of unique properties, making them popular for use in everyday life: they can be used at a very wide range of temperatures, provide an excellent oxygen/moisture barrier, are bio-inert, strong and though but lightweight at the same time, durable, and above all, they are cheap (Andrady, 2011; Andrady and Neal, 2009). However, some of these characteristics (durability, strength, light weight …) are properties that make plastics a major environmental contaminant (Pruter, 1987). Approximately 57 million tonnes (MT) of plastic are produced annually in Europe; globally annual production increases to 299 MT per year (PlasticsEurope, 2015). Despite this magnitude, little quantitative information is available on the quantity of plastics that eventually ends up in the marine environment. Recently, however, it was estimated that 4.8 to 12.7 MT of plastic waste entered the world’s seas and oceans in 2010 (Jambeck et al., 2015). Plastics account for the major part of marine litter as they make up 60% to 80% of the all marine debris (Derraik, 2002). The continuous input of large amounts of these materials has led to their gradual accumulation in the marine and coastal environment.
Marine debris is quite variable in type and so are its environmental and economic implications. It is aesthetically displeasing, making shorelines unattractive and forcing coastal communities to invest in beach maintenance. It can also be a nuisance to boaters and the shipping industry, and can result in damage to vessels and equipment (McIlgorm et al., 2011). The deleterious effects most widely reported are those imposed on marine biota (Derraik, 2002; Katsanevakis, 2008; Laist, 1997). Marine organisms can be entangled in nets, fishing line, ropes and other debris, which can inflict cuts and wounds or cause suffocation or drowning. Ingestion of marine litter may cause obstructions in throats or digestive tracts. Finally, marine litter can also pose a threat to human health and safety, as beach visitors can be harmed by broken glass, medical waste and syringes (Sheavly and Register, 2007).
In the last decade, it has become clear that microplastics will represent a substantial part of the total plastic pollution of the marine environment. Microplastics have already been reported in the water column and marine sediments at sites worldwide (Browne et al., 2011; Claessens et al., 2011; Martins and Sobral, 2011; Ng and Obbard, 2006; Reddy et al., 2006; Thompson et al., 2004). Laboratory experiments have shown that these particles can be ingested by polychaete worms, barnacles, amphipods and sea-cucumbers (Graham and Thompson, 2009; Thompson et al., 2004), and that even translocation to the circulatory system can occur (Browne et al., 2008). Additionally, there is the potential for plastics to sorb, transport and release chemicals, but it remains to be shown whether toxic

Chapter 3
54
3
substances can pass from plastics to these organisms and eventually to the food chain (Teuten et al., 2009).
Despite many research and monitoring actions, the (quantitative) distribution of marine litter remains unclear. There are three main reasons for this: (i) there is a lack of standard methods and units used to quantify the debris, (ii) studies focus almost always on litter in one marine compartment only (e.g. beach litter or floating litter or benthic litter), and (iii) to date, only a few studies have examined concurrently the occurrence of both macro- microplastics in these compartments (e.g. Browne et al., 2010 and Zhou et al., 2011). The objective of this study was to study simultaneously the presence of marine debris, as well as its degradation product (i.e. microplastic), in the different marine habitat compartments. This was accomplished through dedicated quantitative monitoring surveys of the seafloor, the sea surface and beaches of a single marine region, i.e. the Belgian Continental Shelf and its adjacent beaches. By doing this, we wanted to quantitatively assess the distribution of marine litter in the different environmental compartments and provide a baseline of marine debris data for future comparison.
2. Materials & Methods
Here, a detailed description is provided of the different techniques used to sample and extract both macro- and microdebris from the three marine compartments studied.
2.1 Macrodebris
2.1.1 Beached debris Along the 67 km Belgian coastline, 4 beaches were selected based on features such as
tourism pressure (high vs. low) and sedimentation regime (erosion vs. accretion) (Figure 1 and Table 1).
Table 1: Beach monitoring. Characteristics of the four Belgian beaches selected for the monitoring campaign.
Location Station Sedimentation regimea Touristic pressure
De Panne S1 Accretion Low Oostduinkerke S2 Accretion High De Haan S3 Erosion Low Zwin S4 Erosion High aDeronde (2007)
Each beach was sampled in the summer of 2010 (August), and in the spring of 2011 (April). A transect of 100 m, parallel to the water line, was established extending from the low-water mark to the dune line. Along this transect, all non-natural anthropogenic debris was collected by recorders who walked along the width of the surveyed transect. The

Marine litter and microplastics on the Belgian Continental Shelf
55
3
macrodebris was labelled and upon arrival in the lab, further processed. This involved the cleaning, weighing and identification of the collected debris according to a procedure prescribed by OSPAR (OSPAR, 2010) and UNEP (UNEP, 2009) classification lists.
2.1.2 Floating debris Floating debris in Belgian coastal waters (up to 20 km offshore) was sampled in
February and July 2011. A total of 24 samples were collected from 12 sampling stations, distributed over the coastal waters to uniformly cover an area of approximately 50 × 24 km2 (Figure 1). Samples were collected using a neuston net with a 2 × 1 m opening and 1 mm mesh size. The net was towed over a distance of 1 km, with vessel speed restricted to 1 – 2 knots (0.5 – 1 m.s-1). Any debris present in the net was labelled and, upon arrival in the laboratory, classified according to the same classification system as for the beached debris.
Figure 1: Study area on the Belgian Continental Shelf (Southern North Sea). Red circles: sampling locations for the beach monitoring campaigns (S1: De Panne; S2: Oostduinkerke; S3: De Haan; S4: Zwin). Green circles: sampling locations for floating debris monitoring (AsM01 – AsM12). Orange squares: sampling locations for seafloor debris monitoring (AM1 – AM5).

Chapter 3
56
3
2.1.3 Seafloor debris A single campaign for sampling seafloor debris on the Belgian Continental Shelf
(BCS) was conducted in September 2010 and performed according to UNEP guidelines (UNEP, 2009). Five sampling grids of 5 × 5 km were established, and per sampling grid a 800 m bottom trawl was conducted in three randomly selected sub-blocks of 1km2. For the sampling grids AM1 and AM2 only two of these sub-blocks were sampled, due to logistic problems (Figure 1). In two of the three sampling blocks (AM1 and AM3), representing 5 trawls in total, towing was performed with an otter trawl (4m width, 10mm mesh size). All other trawls (8 in total) were performed using a beam trawl (10mm mesh size, 3m width).
Each trawl sample was manually sorted and all litter was classified according to the UNEP classification list (UNEP, 2009).
2.2 Microplastics
To assess the presence of small microplastic debris (< 1mm) on the beaches (Table 1), 2L sediment samples were collected from the upper 5cm of the sediment at the low- and high-water mark. Microplastic extraction was performed using elutriation and density separation (Claessens et al., 2013). In summary: the sample was sieved through a 1mm sieve into an elutriation column. The water flow and aeration of the elutriation column were adjusted to ensure an efficient separation of the lighter particles from the heavier sand particles. The effluent containing the lighter particles, including microplastics, was retained on a 35μm mesh sieve. Sodium iodide (NaI: density of 1.6 g cm-3) was then added to the material collected on the sieve. After shaking thoroughly and subsequent centrifugation (5min at 3,500×g) the supernatant was collected. This NaI-extraction was repeated three times. The collected supernatant was finally filtered over a 5μm membrane filter (Whatman AE98, cellulose nitrate).
Sediment samples for microplastic extraction were only sampled during the second beach survey (April 2011). Extracted microplastics were classified by type: fibres (elongated filaments) and granules were discerned.
2.3 Data analysis
Marine debris concentrations (both macro- and microdebris) are represented as median values. All statistical data analyses were performed using the SAS® software (SAS 9.3). For the analysis of microplastics data, i.e. comparison between high- and low-water mark samples and different microplastic types, the non-parametric Wilcoxon-Mann-Whitney test for pairwise comparison was used (significance level = 0.05).

Marine litter and microplastics on the Belgian Continental Shelf
57
3
3. Results
3.1 Macrodebris
3.1.1 Beached debris In total 51,428 items, weighing a total of 74.19kg, were collected along the four 100 m
beach transects during the two sampling periods. Plastic items were most abundant, representing 95.5% (range: 49.7% - 98.9%) of all collected litter items. Industrial pellets constituted an important part of the recorded plastic debris, ranging from 5% to almost 92% of all beached items (average 80.9%). Overall, the number of items ranged from 339 to 21,744 items per 100m beach front, with a median of 5,167 per 100 m. In terms of weight, the amount of beached debris ranged from 1.52 to 32.9 kg per 100 m (median: 4.08kg per 100 m) (Table 2).
Abundances of beached debris during summer 2010 were high, with a median of 61 items.m-1 recorded (range: 33 – 81 items.m-1 recorded), corresponding to a weight of 38.3 g.m-1 (range: 35.1 – 43.2). Plastic debris made up 96.6% of all items collected in August 2010. Industrial resin pellets were the largest part of this plastic debris: 76 to 93% of all recorded items were pellets. When considering the total amount of beached debris recorded, pollution levels varied considerably between locations. Sampling location S2, characterised by a high tourism pressure and accretion, had the highest number of items recorded, i.e. 81 items.m-1. Location S4 (low tourism pressure and erosion) was the second most polluted beach with 70 items.m-1. In terms of weight there are no notable differences between the different locations, tourism pressure or sedimentation regime: every location represents approximately 25% of the total weight of debris collected (Table 2).
In spring 2011, lower abundances of stranded debris were observed as in 2010: ranging from 3 – 217 items.m-1 (median of 30 items.m-1). In terms of weight, however, average debris levels in 2011 were three times higher (median 121 g.m-1; range: 15.2 – 329 g.m-1). Plastic debris still constituted 94.6% of all recorded debris. In 2011, the S4 beach stood out both in terms of numbers and weight of the recorded debris. Over 21,000 items (of which 92% were pellets), representing a total weight of almost 33kg, were observed. This record weight is due to high amounts of ceramics (i.e. bricks and tiles) and heavy wood items (i.e. timber) (Table 2).
For each beach sampling campaign, a top-10 of most encountered item categories was compiled (Table 3). In 2010 and 2011, these top-10 items make up 95% of all stranded debris recorded. The majority of items were quite similar in the two sampling campaigns, and the top-4 even remains unchanged. Cutlery and straws and small plastic bags were among the most abundant items only in the summer samples. In spring these items did not show up in the top-10, but were replaced by construction materials and string.
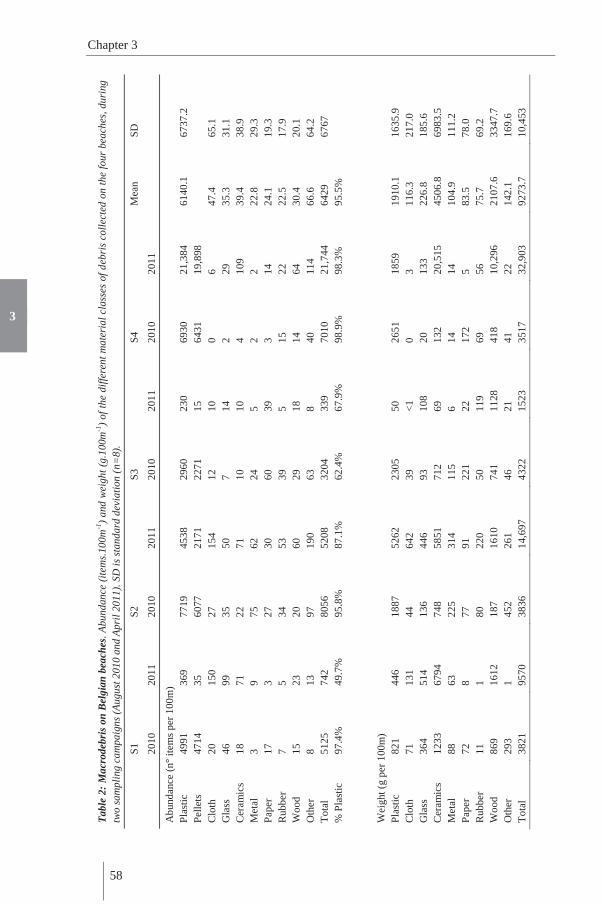
58
Chapter 3
3
Tabl
e 2:
Mac
rode
bris
on B
elgi
an b
each
es. A
bund
ance
(ite
ms.
100m
-1)
and
wei
ght (
g.10
0m-1
) of
the
diffe
rent
mat
eria
l cla
sses
of d
ebri
s co
llect
ed o
n th
e fo
ur b
each
es, d
urin
g tw
o sa
mpl
ing
cam
paig
ns (A
ugus
t 201
0 an
d A
pril
2011
). SD
is s
tand
ard
devi
atio
n (n
=8)
.
S1
S2
S3
S4
M
ean
SD
2010
20
11
2010
20
11
2010
20
11
2010
20
11
Abu
ndan
ce (n
° ite
ms p
er 1
00m
) Pl
astic
49
91
369
7719
45
38
2960
23
0 69
30
21,3
84
6140
.1
6737
.2
Pelle
ts
4714
35
60
77
2171
22
71
15
6431
19
,898
C
loth
20
15
0 27
15
4 12
10
0
6 47
.4
65.1
G
lass
46
99
35
50
7
14
2 29
35
.3
31.1
C
eram
ics
18
71
22
71
10
10
4 10
9 39
.4
38.9
M
etal
3
9 75
62
24
5
2 2
22.8
29
.3
Pape
r 17
3
27
30
60
39
3 14
24
.1
19.3
R
ubbe
r 7
5 34
53
39
5
15
22
22.5
17
.9
Woo
d 15
23
20
60
29
18
14
64
30
.4
20.1
O
ther
8
13
97
190
63
8 40
11
4 66
.6
64.2
To
tal
5125
74
2 80
56
5208
32
04
339
7010
21
,744
64
29
6767
%
Pla
stic
97
.4%
49
.7%
95
.8%
87
.1%
62
.4%
67
.9%
98
.9%
98
.3%
95
.5%
Wei
ght (
g pe
r 100
m)
Plas
tic
821
446
1887
52
62
2305
50
26
51
1859
19
10.1
16
35.9
C
loth
71
13
1 44
64
2 39
<1
0
3 11
6.3
217.
0 G
lass
36
4 51
4 13
6 44
6 93
10
8 20
13
3 22
6.8
185.
6 C
eram
ics
1233
67
94
748
5851
71
2 69
13
2 20
,515
45
06.8
69
83.5
M
etal
88
63
22
5 31
4 11
5 6
14
14
104.
9 11
1.2
Pape
r 72
8
77
91
221
22
172
5 83
.5
78.0
R
ubbe
r 11
1
80
220
50
119
69
56
75.7
69
.2
Woo
d 86
9 16
12
187
1610
74
1 11
28
418
10,2
96
2107
.6
3347
.7
Oth
er
293
1 45
2 26
1 46
21
41
22
14
2.1
169.
6 To
tal
3821
95
70
3836
14
,697
43
22
1523
35
17
32,9
03
9273
.7
10,4
53

Marine litter and microplastics on the Belgian Continental Shelf
59
3
3.1.2 Floating debris In February 2011, a total of 102 items were recorded (weighing only 1.51g) for a total
sampled area of 0.024 km². This corresponds to a median of 2,750 items.km-2 (densities on the sampled locations ranged from 500 to 13,000 items.km-2), or 55.4 g.km-2 (range: 1.3 - 113.7 g.km-2). In total, four different categories of debris were recorded with plastics being most abundant (97.1%). Of these plastic items, 49.5% was monofilament line; fragments made up 36.4% of all plastic items. Cloth (a piece of string)rubber (a rubber band) and a medical item (band aid) were the other types of debris retrieved from the neuston nets.
In July 2011, 84 items weighing 10.74g in total were recorded in the neuston trawls from all 12 locations. A median of 3250 items.km-2 were recorded, ranging from 1,000 to 9,000 items.km-2. In terms of weight, this corresponds to a median weight of 72.5 g per km² (range: 3.9 – 4,112.2 g.km-2). Again, items belonging to the category plastic were most abundant (94.1%). The most abundant plastic items were plastic fragments (50.6%), followed by sweet packets (13.9%). Three other categories were recovered from the neuston samples in July: paper (2 fragments), metal (2 pieces of foil wrapper), and one sanitary item (cotton bud stick).
Combined for the entire year 2011, a median of 3,000 items per km² was recorded. In terms of mass, this amounts to 61.1 g.km-2. Plastics dominate, with on average 95.7% of all collected litter items being plastic. There appears to be no observable trend in the presence of floating debris between the different locations and the two sampling periods.
Table 3: Top-10 collected items. Top items collected on the four beaches, for two different sampling periods: summer 2010 and spring 2011.
Ranking Summer 2010 Spring 2011 Item % of total Item % of total
1 Resin pelletsa 83.3 Resin pelletsa 79.0 2 Plastic fragments < 50cma 5.5 Plastic fragments < 50cma 5.7 3 Monofilament linea 1.9 Monofilament linea 2.9 4 Rope/cord < 50cma 1.2 Rope/cord < 50cma 2.3 5 Cigarette butts and filtersa 0.8 Bottle caps and lidsa 0.9 6 Bottle caps and lidsa 0.7 Construction material 0.9 7 Plastic cutlery and strawsa 0.5 Snack packages, lolly sticksa 0.8 8 Snack packages, lolly sticksa 0.5 Cotton bud sticks 0.7 9 Cotton bud sticks 0.5 Rope/string 0.7 10 Small plastic bagsa 0.4 Cigarette butts and filtersa 0.5
aThese items categorise as plastic according to UNEP and OSPAR

Chapter 3
60
3
3.1.3 Seafloor debris A total of 117 items, weighing in total 16.87g, were recovered from the 10.4km of
BCS sampled over a width of 3 or 4 m (see above). This corresponds to a median abundance of 2083 items.km-2, ranging from 1250 to 11,527 items.km-2 in the sampled stations. Sampling grids AM2 – AM5 appear to have similar abundances of benthic debris (ranging from 1,667 to 2,083 items.km-2), whereas the sampling grid close to the harbour of Zeebrugge (AM1) exhibits an abundance that is approximately four times higher, median of 8,594 items.km-2 (Figure 2). Weight ranged from 75 to 2,653 g.km-2. Sampling grid AM1 did not only display the highest number of benthic macrolitter, but also the highest weight of benthic debris was recorded here (median 1698 g.km-1).
Three categories of items were recorded found this sampling campaign: ‘Plastic’, ‘Cloth’ and ‘Paper’. Plastics made up the largest part of items recorded (95.7%). Second most abundant items were categorised as ‘Cloth’ (3.4%), and only one piece of cardboard box was recovered, making the share of the ‘Paper’ category only 0.9% of the total amount of items recorded.
Figure 2: Benthic marine debris recorded in 2010. A.: Mean abundance of benthic marine debris in items.km-2. B.: Mean weight of the benthic marine debris in g.km-2. Bars represent the standard deviation (AM1 – AM2: n=2; AM3 – AM5: n=3).
3.2 Microplastics
Microplastic (SMPs) concentrations in intertidal beach sediments ranged from 2 – 61 microplastics.L-1 sediment (median of 14.0 microplastics.L-1). Using an average sediment density of 1600 kg.m-3 (Fettweis et al., 2007), and 1.25 as wet sediment/dry sediment ratio (Claessens et al., 2011), a median microplastic concentration of 10.9 microplastics.kg-1 dry sediment is found. Concentrations of microplastics differ significantly between the low-water mark and high-water mark (Table 4): less microplastics are present at the low-water mark (median: 8.6 microplastics.kg-1) compared to the high-water mark (median 17.2 microplastics.kg-1) (Wilcoxon: z = 3.603; p = 0.003). While at the low-water mark, fibres and granules are present in similar

Marine litter and microplastics on the Belgian Continental Shelf
61
3
concentrations (Wilcoxon: z = -1.553; p = 0.1196), the high-water mark is clearly dominated by fibres (Wilcoxon: z = 5.675; p = < 0.001): 92.9% of all microplastics recovered here were fibres (Table 4).
Table 4: Microplastic concentrations in beach sediments. Median concentrations of the different types of microplastics (number of microplastics per kg dry sediment) at the low- and high-water mark of the different sampling locations along the Belgian coastline. Values in parentheses represent ranges (n=6).
S1 S2 S3 S4 Total
Low-water mark
Fibres 3.5
(0.8 – 5.5) 3.1
(0.8 – 5.5) 2.7
(0 – 3.9) 5.5
(3.1 – 9.4) 3.5
Granules 3.9
(0.8 – 6.3) 6.3
(1.6 – 16.4) 4.3
(2.3 – 7.0) 4.7
(3.1 – 14.8) 4.3
Total 8.6
(1,6 – 9.4) 8.2
(3.1 – 20.3) 7.4
(4.7 – 10.9) 11.3
(5.5 – 14.8) 8.6
High-water mark Fibres 18.0
(11.7 – 30.5) 14.8
(2.3 – 25.8) 16.4
(9.4 – 17.2) 10.5
(3.1 – 45.3) 16.4
Granules 0.8 (0 – 2.3)
0.0 (0 – 3.1)
0.4 (0 – 1.6)
2.0 (0 – 5.5)
0.8
Total 18.8 (11,7 – 32,8)
16.4 (5.5 – 25.8)
17.2 (9.4 – 18.0)
13.7 (4.7 – 47.7)
17.2
4. Discussion
4.1 Macrodebris
4.1.1 Beached debris A median of 40.8 kg of litter was observed per km of beach. Although this is not
nearly the highest value ever reported, it does exceed a lot of internationally reported levels of beached marine debris. On the Falkland Islands 18.3 kg.km-1 was reported by Otley & Ingham (2003), and Claereboudt (2004) found on average 29.7 kg per km beach in Oman. In Europe, 32.9 kg of beached debris per km of beach were reported for the Spanish Balearic Islands (Martinez-Ribes et al., 2007). Similar concentratiosn were reported by Gilligan et al. (1992) in the USA: they reported 45 kg.km-1 on the beaches of Georgia. Much higher quantities are found elsewhere, in Indonesia for example, Willoughby et al. (1997) estimated the weight of the beached litter to be in the range of 1000 kg.km-1, while in Curaçao litter levels reached on average 4,500 kg km-1 on windward beaches (Debrot et al., 1999).

Chapter 3
62
3
With an average of 51,665 items per km, the Belgian beaches also appear to be prominent in terms of numbers of items beached debris. On the Southern beaches of Australia, Edyvane et al. (2004) reported only 31.6 items per km, while beaches in Northern Australia had around 91.5 items km-1 (Whiting, 1998). More recently, 9,100 items per km of beach were reported by Santos et al. (2009) in the Northeast of Brazil. High numbers of beached debris were reported in Indonesia by Willoughby et al. (1997), on average 17,365 items.km-1, and on the Balearic Islands (Martinez-Ribes et al., 2007), on average 35,670 items.km-1. The highest numbers of debris recorded were noted by Debrot et al. (1999): windward beaches on Curaçao had on average 75,560 items per km of beach. While this very high concentration of marine debris in Curaçao is attributed to large amounts of plastic fragments (67% of all plastic items), along the Belgian coastline marine litter was dominated by resin pellets: 80.9% of all beached debris items. It has to be mentioned that the Belgian beaches are at least once a year completely “cleaned”, i.e. all litter beached is removed. In summer, tourist beaches can be cleaned weekly or even daily. The abundances of marine litter reported in this study have hence not accumulated over long periods of time, as might be the case in studies focusing on more remote beaches.
The most abundant material of beached items in our study was plastic, both in 2010 (96.6% of all items) as well as in 2011 (94.6% of all items) (Table 2). This dominance of plastic is very common (Gregory and Ryan, 1997; Otley and Ingham, 2003; Santos et al., 2009; Widmer and Hennemann, 2010; Willoughby et al., 1997) and is mainly due to their high persistence in the environment. Combined with a low density (which makes plastics float) they can travel long distances before they wash up on shores where they accumulate (Derraik, 2002).
Pre-production resin pellets, precursors for the production of plastic consumer products, were the most abundant type of marine debris retrieved from all four sampling stations, both in 2010 and 2011 (Table 3). Since these pellets are only used in plastic industry, their presence on Belgian beaches can only be attributed to accidental spillage during transport or storage (in nearby ports) (EPA, 1992). The numbers of resin pellets differed greatly among beaches, both in 2010 as well as in 2011. Since resin pellets are associated with industrial activities (transport and storage), different tourism pressure between beaches could not considered as an explanatory factor for these differences. Also, there appeared to be no influence of the sedimentation regime on the number of beached items. In both years, the erosion-prone beach at S4 was one of the most polluted beaches in this study.
In terms of weight, differences among beaches were only observed in 2011. Here, S4 (natural and erosion) dominated with 56% of the total weight recorded in that year. This is mainly attributed to ceramics and wooden items, weighing 20.5kg and 10.3kg,

Marine litter and microplastics on the Belgian Continental Shelf
63
3
respectively. At the other locations, many ceramics and wooden items were collected as well but the dimensions of these items were larger at S4. It seems that typical beach characteristics (sedimentation regime and tourism pressure) do not explain the variation in number and weight of marine litter observed. Sea currents and prevailing wind directions, combined with the point of entry may play a more significant role in the distribution of marine debris. Especially for low density plastics, wind appears to play a significant role in their transport (Browne et al., 2010; Debrot et al., 1999; Heo et al., 2013).
Although differences between beaches did not appear to be related to characteristics such as sedimentation regime and touristic pressure, sampling period did seem to be an important factor explaining the types of debris recorded (Table 3). The top-10 types of items recorded on beaches during summer differ from the top-10 in spring. In summer, more cigarette butts and filters are encountered on the beaches, which is consistent with studies on touristic beaches around the world (Ariza and Leatherman, 2012; Martinez-Ribes et al., 2007). Also, two types of debris that are abundantly present on beaches in summer, and less prominently in spring, are plastic cutlery and straws, and small plastic bags (such as freezer bags). These items can be associated with tourism, when people have picnics on the beach. The ceramics and wood observed in spring 2011 were associated with construction works: mainly bricks, tiles and pieces of cement, concrete and processed timber, were recorded. These items may have been lost during transport, or could have broken off from seawall constructions.
4.1.2 Floating debris The median concentration of floating marine debris in the Belgian part of the North
Sea is 3,000 items.km-2. This appears to be quite high when comparing this abundance to internationally reported values of floating marine debris. Very low concentrations of floating marine debris were encountered by Zhou et al. (2011) in the Northern South China Sea: only 4.9 items.km-2. In the coastal waters of Chile (South East Pacific Ocean) average concentrations of approximately 20 items.km-2 were observed (Hinojosa and Thiel, 2009; Thiel et al., 2003). However, in the latter studies, only visual surveys of the floating debris were performed. Doyle et al. (2011), Law et al. (2010) and Zhou et al. (2011) demonstrate that the most abundant size classes of floating debris are the smallest sizes. Because of their small size these items are easily overlooked during ship-based visual surveys, resulting in an underestimation of the abundance of floating debris. This is demonstrated by the density of floating debris reported for Belgian coastal waters by a ship-based visual study: here, a concentration of only 0.66 items.km-2 was recorded (Claessens et al., 2013a). This is almost 6,000 times lower than the median of 3,000 items.km-2 recorded in this study.

Chapter 3
64
3
Other studies, performed near marine debris accumulation sites, i.e. oceanic gyres, report much higher values. In the North Atlantic Gyre, Law et al. (2010) reported on average 7,758.7 items per km2, while Doyle et al. (2011) reported 9,599.9 items.km-2 for the Northeast Pacific. These values are two to three times higher than those observed in this study. Additionally, these two studies only reported values for plastic debris, so actual floating debris abundances will probably even be higher.
However, when comparing the abundances of floating debris reported in literature one has to keep in mind that even though most samplings occurred with a neuston net, the mesh size of these nets often differ. The studies cited here used neuston nets with mesh sizes ranging from 0.335 to 1 mm. Hence, comparison between studies is complicated.
Despite the average concentrations of debris recorded are quite high, only a low median weight of floating debris was recorded: 61 g.km-2. The type of items present in the neuston net trawl and their size provide an explanation for the low average weight. Since most of the items recovered were fragments smaller than 1cm (often even smaller than 0.5 cm), their weight also was very low, only a few milligrams or less. Additionally, the type of material also plays an important part: the majority of the items retrieved were plastic (95.7%), resulting in an overall low weight of floating marine debris when compared to the abundance.
4.1.3 Seafloor debris Benthic macrodebris on the Belgian Continental Shelf (BCS) was assessed only once
in this study. The UNEP guidelines for benthic litter assessment (UNEP, 2009) postulate that per sampling grid of 25km², three randomly chosen sub-blocks of 1km2 should be sampled by performing 800m trawls per sub-block. For this sampling campaign, this resulted in a total trawling distance of 10.4km. Since the speed of the research vessel is highly restricted during such trawls (2.9 – 4.1 knots), this sampling strategy is very time- and energyconsuming. The sampling of benthic marine litter also resulted in a lot of by-catch: especially bottom dwelling marine organisms ended up in the trawl nets. Additionally, because these trawling activities involve the towing of heavy gear over the seabed it causes large scale damage to the sea bottom, destructing habitats. Because of the abovementioned reasons, it was decided that no second sampling campaign of the BCS would be performed, since the negative impacts of this sampling strategy were too high compared to the limited amount of debris sampled.
During the single sampling campaign of the BCS (September 2010), a median of 2,083 items.km-2 was recorded. Other studies, assessing benthic marine debris by using trawl nets, found quite diverse densities. Sampling of the Mediterranean seafloor near Greece yielded between 89 to 240 items.km-² (Stefatos et al., 1999). Galgani et al. (2000) sampled the seafloor along the European coastline and results varied greatly, with
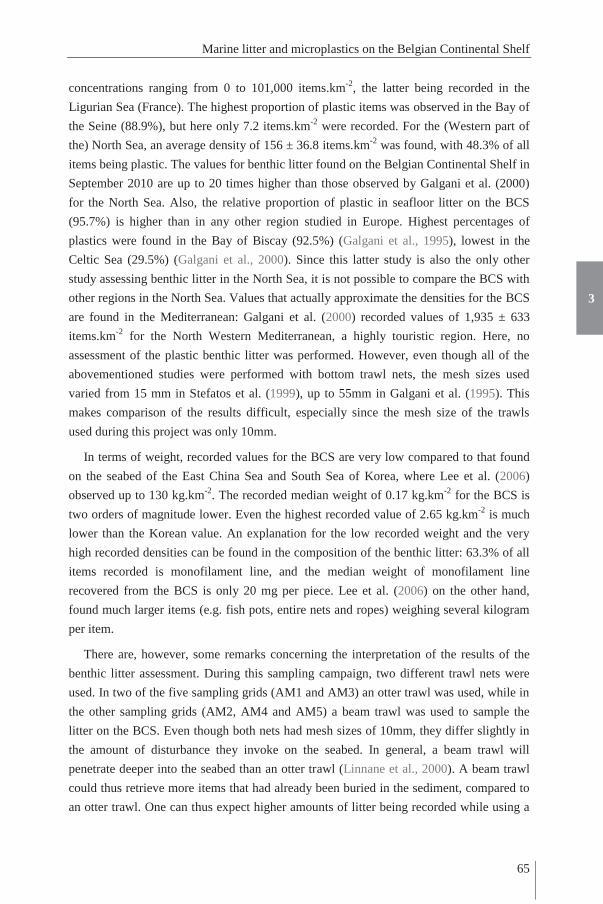
Marine litter and microplastics on the Belgian Continental Shelf
65
3
concentrations ranging from 0 to 101,000 items.km-2, the latter being recorded in the Ligurian Sea (France). The highest proportion of plastic items was observed in the Bay of the Seine (88.9%), but here only 7.2 items.km-2 were recorded. For the (Western part of the) North Sea, an average density of 156 ± 36.8 items.km-2 was found, with 48.3% of all items being plastic. The values for benthic litter found on the Belgian Continental Shelf in September 2010 are up to 20 times higher than those observed by Galgani et al. (2000) for the North Sea. Also, the relative proportion of plastic in seafloor litter on the BCS (95.7%) is higher than in any other region studied in Europe. Highest percentages of plastics were found in the Bay of Biscay (92.5%) (Galgani et al., 1995), lowest in the Celtic Sea (29.5%) (Galgani et al., 2000). Since this latter study is also the only other study assessing benthic litter in the North Sea, it is not possible to compare the BCS with other regions in the North Sea. Values that actually approximate the densities for the BCS are found in the Mediterranean: Galgani et al. (2000) recorded values of 1,935 ± 633 items.km-2 for the North Western Mediterranean, a highly touristic region. Here, no assessment of the plastic benthic litter was performed. However, even though all of the abovementioned studies were performed with bottom trawl nets, the mesh sizes used varied from 15 mm in Stefatos et al. (1999), up to 55mm in Galgani et al. (1995). This makes comparison of the results difficult, especially since the mesh size of the trawls used during this project was only 10mm.
In terms of weight, recorded values for the BCS are very low compared to that found on the seabed of the East China Sea and South Sea of Korea, where Lee et al. (2006) observed up to 130 kg.km-2. The recorded median weight of 0.17 kg.km-2 for the BCS is two orders of magnitude lower. Even the highest recorded value of 2.65 kg.km-2 is much lower than the Korean value. An explanation for the low recorded weight and the very high recorded densities can be found in the composition of the benthic litter: 63.3% of all items recorded is monofilament line, and the median weight of monofilament line recovered from the BCS is only 20 mg per piece. Lee et al. (2006) on the other hand, found much larger items (e.g. fish pots, entire nets and ropes) weighing several kilogram per item.
There are, however, some remarks concerning the interpretation of the results of the benthic litter assessment. During this sampling campaign, two different trawl nets were used. In two of the five sampling grids (AM1 and AM3) an otter trawl was used, while in the other sampling grids (AM2, AM4 and AM5) a beam trawl was used to sample the litter on the BCS. Even though both nets had mesh sizes of 10mm, they differ slightly in the amount of disturbance they invoke on the seabed. In general, a beam trawl will penetrate deeper into the seabed than an otter trawl (Linnane et al., 2000). A beam trawl could thus retrieve more items that had already been buried in the sediment, compared to an otter trawl. One can thus expect higher amounts of litter being recorded while using a

Chapter 3
66
3
beam trawl. However, this is not reflected in the abundances measured on the BCS: AM3 (otter trawl) had concentrations of microplastics within the same range as the sampling grids sampled with a beam trawl, while the other otter trawl sampling location (AM1) had the highest number of items retrieved during the entire sampling period (Figure 2). The large number of items recovered from the first sampling grid, can, however, be attributed to the proximity of the harbour of Zeebrugge. This debris could, for instance, originate from ships entering or leaving the harbour, and from spillage in the harbour.
The results obtained for the assessment of benthic marine debris using trawling might not be representative for the entire BCS. Galgani et al. (1996) noted that trawling results are incomplete since they only concern those areas in which trawling is possible. Such areas are uniform in terms of substrate and depth (UNEP, 2009). Visual surveys of benthic litter have shown that a large part of the litter is located in piles near special accumulation zones such as rocks and shipwrecks, or in channels and other depressions (Galgani et al., 1996). Trawlable areas, however, are low in such accumulation zones. The results represented here could thus be underestimations.
4.1.4 Marine debris on the Belgian Continental Shelf When comparing the three sampled marine compartments, i.e. beach, sea floor and sea
surface, it is obvious that, for the Belgian marine environment, the highest numbers and weight of marine debris in unit of surface is located on the beaches. The amount and weight of debris recovered from the surface waters and the seabed is orders of magnitudes lower than those detected on the beaches.
It is estimated that of all marine debris that enters the North Sea up to 70% will eventually sink, whereas 15% will remain floating on the sea surface and 15% is washed ashore (UNEP, 2005). The numbers of marine debris presented here do not support these figures. The amount of marine debris present in the Belgian marine environment (67 km of coastline and a total area of 1200km2) is more evenly distributed: 34% is washed ashore, 37% is floating on the sea surface and 29% can be found on the sea floor.
Additionally, the typical suggested fraction of plastics of 60-80% (Gregory and Ryan, 1997) is not confirmed by our results for the Belgian coastal waters. Here, over 95% of all recorded debris was plastic items. Floating and seafloor debris appeared to consist primarily of plastic (both 95.7%), especially monofilament pieces and plastic fragments were ubiquitous. Beached debris values were similar with 95.5% of plastics, but here plastic resin pellets dominated: over 80% of all recorded items were pellets.
4.2 Microplastics
Microplastics were present in every sample of each of the sampled beaches. The observed concentrations of microplastics, ranging from 7.4 to 18.8 microplastics.kg-1 dry sediment (median of 14.0 microplastics.kg-1), are lower than the majority of the

Marine litter and microplastics on the Belgian Continental Shelf
67
3
concentrations reported in previous studies (e.g. Browne et al., 2011; Claessens et al., 2011; Reddy et al., 2006; Thompson et la., 2004; Vianello et al., 2013). Large differences exist between the microplastic concentrations observed in this study and those reported by Claessens et al. (2011) for other sampling locations along the Belgian coastline. The microplastic concentrations obtained in the latter study (93 ± 37 microplastics.kg-1 dry sediment), are seven times higher than those observed here.
Samples from the high- and low-water mark were analysed separately, and the results show that concentrations of microplastics observed at the high-water mark are significantly higher than at the low-water mark (Table 4). The zone near the low-water mark is a highly dynamic zone: most of the time it is submerged, and therefore is subjected to a constant deposition/re-suspension cycle. The top layer of the sediment in this zone will be highly disturbed during flooding, and settled particles will hence be re-suspended. Particle transport into permeable sediments has been shown to reach down at least 1.5cm into the sediment (Rusch and Huettel, 2000). The high-water mark on the other hand, is a much calmer zone: it will only be submerged during high tide and for short periods only. Particles, such as microplastics, that settle in this zone will thus be less prone to re-suspension than particles at the low-water mark.
Even though microplastic abundances are typically characterised by large spatial variations (Claessens et al., 2011; Cole et al., 2011; Ryan et al., 2009), differences between studies, in the same region or even within the same sample location, can also be attributed to differences in extraction techniques and visual identification. Due to the rapid development of microplastic research, there is a wide variety of sampling and extraction techniques used to quantify microplastics in sediments. As a result, comparison of reported microplastic concentrations between studies is often impossible or requires additional calculations based on assumptions (e.g. sediment densities). The majority of these method inconsistencies can be related to (i) differences in the lower and upper size limit implemented, (ii) variety in sampling techniques and (iii) difference in the sensitivity of the applied extraction/identifaction technique (reviewed in Van Cauwenberghe et al., 2015). Recently, efforts have been made to increase the standardisation of microplastic research and monitoring by developing (inter)national guidelines set out in the framework of other established marine monitoring programmes such as OSPAR and EU TSG on Marine Litter (MSFD GES Technical Subgroup on Marine Litter, 2011).
As such, this proposed harmonisation will assist future, uniform microplastic abundance assessments, and allow science-based geographical comparison and time trend assessments.

Chapter 3
68
3
4.3 Macro- vs. Microplastics
Although microplastic presence is not as obvious as macrolitter, it is clear that it is an important part of the overall plastic pollution problem. For a beach of 250m wide, a median concentration of 11 microplastics per kg of dry sediment corresponds to an abundance of around 1.75 × 10⁷ particles per 100m of beach (when considering only the upper 5cm of the sediment). Based on the extractions performed in this study, microplastic concentrations on Belgian shores range from 2.5 × 10⁶ to 7.6 × 10⁷ microplastics per 100m of beach. Using an average weight of 0.005mg per microplastic particle (Claessens et al., 2011), the weight of microplastics on Belgian beaches ranges from 0.01 to 0.38 kg per 100m. Macroplastic weight recorded during this study ranges from 0.05 to 5.3 kg per 100m (Table 3). Because of the small dimensions (< 1mm) and hence weight of microplastics, and the high abundance of macroplastic on Belgian beaches, even very high abundances of microplastics result in a total weight which is over an order of magnitude lower than the total weight of the macrodebris.
Recent work determined the concentrations of microplastics in Belgian coastal waters (Van Cauwenberghe et al., 2015). Here, microplastic concentrations reaching up to 0.8 particles.L-1 were recorded (on average 0.4 particles.L-1). This means that in the top 0.5 m of the water column, concentrations of microplastics can reach concentrations of up to 4 × 10⁸ particles per km2 (on average 2 × 10⁸ particles.km-2). Using the microplastic weight of 0.005 mg particle-1, observed by Claessens et al. (2011), this results in an average microplastic weight of 2 kg per km2. Compared to the weight of macrodebris recorded (1 – 4000 g.km-2), microplastics represent a similar weight of floating marine debris.
During this project, no assessment was made of microplastics present in the sediment of the BCS. However, Claessens et al. (2011) reported microplastic concentrations in the BCS sediments. The values reported in that study are among the highest ever measured, and ranged from 72 to 270 particles per kg dry sediment or, expressed in terms of weight, 0.84 – 1.3 mg.kg-1 dry sediment. Hence, per km² there are around 9.2 × 10⁹ to 3.5 × 10¹⁰ microplastic particles present in the upper 10 cm of the seabed. This high microplastic concentration corresponds to a weight ranging from 108 to 166 kg per km2. Macroplastic on the BCS present a much lower weight: only 0.43 ± 0.70 kg.km-2 (ranging from 0.03 to 1.3 kg km-2), which is approximately 400 times lower than the microplastic weight.

4 Microplastics in deep-sea sediments
Redrafted from:
Van Cauwenberghe, L., Vanreusel, A., Mees, J., Janssen, C.R., 2013. Microplastic pollution in deep-sea sediments. Environmental Pollution 182, 495-499. DOI: 10.1016/j.envpol.2013.08.013.

Chapter 4
70
4
ABSTRACT
Microplastics are small plastic particles (< 1mm) originating from the degradation of larger plastic debris. These microplastics have been accumulating in the marine environment for decades and have been detected throughout the water column and in sublittoral and beach sediments worldwide. However, up to now, it has never been established whether microplastic presence in sediments is limited to accumulation hot spots such as the continental shelf, or whether they are also present in deep-sea sediments. Here we show, for the first time ever, that microplastics have indeed reached the most remote of marine environments: the deep sea. We found plastic particles sized in the micrometre range in deep-sea sediments collected at four locations representing different deep-sea habitats ranging in depth from 1100 to 5000 metres. Our results demonstrate that microplastic pollution has spread throughout the world’s seas and oceans, into the remote and largely unknown deep sea.

4
Microplastics in deep-sea sediments
71
1. Introduction
Microplastics have been reported in the water column and marine sediments worldwide (Claessens et al., 2011; Law et al., 2010; Moore et al., 2001; Thompson et al., 2004), from low, background concentrations of 3 particles.m-3 in water (Doyle et al., 2011) and 8 particles.kg-1 in sediment (Thompson et al., 2004), to very high, hot-spot concentrations of 102,000 particles.m-3 in water (Norén and Naustvoll, 2010) and 621,000 particles.kg-1 in sediments (Liebezeit and Dubaish, 2012). The observed sediment concentrations all originate from sites located on the continental shelf. However, accumulation zones of floating plastic debris and associated microplastics, the so-called garbage patches, are located far from any continental margin. Hence, the question arises whether the degradation products of larger marine debris are present in deep-sea sediments as well, since surface particulate material can be rapidly exported to abyssal depths (Alldredge & Silver, 1988).
Sediments are suggested to be a long-term sink for microplastics (Cózar et al., 2014; Law et al., 2010; Morét-Ferguson et al., 2010). Logically, plastics with a density that exceeds that of seawater (>1.02 g.cm-³) will sink and accumulate in the sediment, while low-density particles tend to float on the sea surface or in the water column. High-density polymers (e.g. polyvinylchloride (PVC) and polyethylene terephthalate (PET)) are therefore expected to accumulate near their point of entry in the environment. Nevertheless, underlying currents can still transport these sunken particles (Engler, 2012). Low-density plastics, such as polyethylene (PE) and polypropylene (PP), are buoyant and as a result can be transported over long distances by surface currents and accumulate in the centre of oceanic gyres (Cózar et al., 2014). However, through density-modification even low-density plastics can reach the seafloor. Biomass accumulation due to biofouling can lead to an increase in density resulting in the sinking of the microplastic (Andrady, 2011; Reisser et al., 2013; Zettler et al., 2013). Using nitrogen as a proxy, Morét-Ferguson et al. (2010) concluded that the reported change in microplastic density is due to attached biomass. Indeed, analysis of polyethylene bags submerged in seawater for 3 weeks showed a significant increase in biofilm formation over time, accompanied by corresponding changes in physicochemical properties of the plastic, such as a decrease in buoyancy (Lobelle and Cunliffe, 2011). These studies suggest that biofouling can contribute towards the settling and eventual burial in sediments of previously buoyant plastic. Biomass accumulation on plastic may even partly explain the recent finding that the global plastic load in the open-ocean surface is estimated to be two orders of magnitude lower than expected from estimates of plastic releases in the marine environment (Cózar et al., 2014).
Here, we investigate the presence of microplastics in one of the most pristine of marine environments: the deep sea. To explore the hypothesis that microplastics can sink and be

Chapter 4
72
4
incorporated in deep-sea sediments, samples from deep-sea locations worldwide were analysed for the presence of microplastics by means of a new and highly efficient extraction technique using a high density salt solution.
2. Materials & Methods
2.1 Deep sea stations
Microplastic extractions were performed on 1L sediments samples originating from several locations in the Atlantic Ocean and Mediterranean Sea ranging in depth from 1176 to 4844 m (Table 1). These deep sea systems represent different marine environments. The three sampling stations in the Atlantic sector of the Southern Ocean, off the polar front, were representative for a pristine environment, since the sea floor of this remote location is still largely unexplored and assumed void of pollution. In the Northern Atlantic Ocean, the Porcupine Abyssal Plain was sampled. This site is characterized by large seasonal variations in the flux of particulate organic matter (POM) derived from surface production (Lampitt et al., 2001). The distal lobe of the Congo Canyon (Gulf of Guinea, South Atlantic Ocean) is fuelled by organic matter delivered by one of the world’s largest rivers, the Congo River (Khripounoff et al., 2003). The last sampling location is shallower and situated off the Nile Deep Sea Fan adjacent to the Amon Mud volcano in the Eastern Mediterranean Sea. This is an area on the Egyptian margin characterized by strong sedimentation, and influenced by the burial of thick accumulations of organic-rich sediments (Felden et al., 2013).
Table 1: Sampling locations. Details on the sampling locations and sampling stations (n=11), including sample collection method.
Sampling location
Geographical location
Station number
Latitude Longitude Depth (m)
Sample collection
Polar Front Southern Ocean 1 53°0.67’S 10°3.00’E 4230
Multicorer 2 51°59.98’S 7°59.99’W 2749 3 49°33.81’S 38°24.27’W 4881
Porcupine Abyssal Plain
North Atlantic Ocean
1 48°49.60’N 16°29.68’W 4842 Multicorer 2 48°49.77’N 16°28.90’W 4843
3 48°49.41’N 16°29.85’W 4844
Distal lobe Congo Canyon
Gulf of Guinea 1 6°25.20’S 5°29.40’W 4785
ROV Victor 6000
2 6°25.20’S 5°29.40’W 4785 3 6°25.20’S 5°29.40’W 4785
Nile Deep Sea Fan
Mediterranean 1 32°22.9’N 31°43.13’E 1176
Multicorer 2 32°22.9’N 31°43.13’E 1176

4
Microplastics in deep-sea sediments
73
2.2 Sample processing
In each sampling station, a surface area of 25cm² was sampled. Immediately after recovery, the cores were cut into horizontal slices by extruding it into a ring and slicing the sediment with a metal plate. The cores were cut into 1cm-thick slices. Only the top centimetre of the sediment cores were analyzed for the presence of microplastics. The extraction was performed according to Claessens et al. (2013b), with minor modifications. Since the deep-sea sediment core samples represented only a small volume (25cm³), no volume reduction of the sample by elutriation was performed. Instead, sediment samples were wet sieved, first on a 1mm sieve and subsequently on a 35μm sieve. The fraction remaining on the 35μm sieve was used for the extraction step based on density flotation using sodium iodide (density: 1.6 g.cm-3), as described in Claessens et al. (2013b).
During analysis, fibres detected in the samples were not taken into account. As the deep-sea samples analysed here were not collected in the context of microplastic research, no contamination measures were taken during sampling and initial sample processing (i.e. slicing the cores). Therefore, it is impossible to account for any contamination with airborne microplastics and clothing-associated fibres arising from these initial processing steps. Additional contamination during microplastic extraction was prevented by performing the entire extraction process with instruments and in containers that were rinsed with filtered deionised water (0.8μm membrane filter, GelmanScience). As an additional measure, all extraction steps were performed in a clean fume hood.
2.3 Particle identification
All suspicious particles were characterised by measuring two dimensions: length (the longest dimension of the particle) and width (perpendicular to length). The particles that were classified as possible microplastics were analyzed using micro-Raman spectroscopy (Bruker Optics ‘Senterra’ dispersive Raman spectrometer coupled with an Olympus BX51 microscope) to identify plastic type. The Raman spectrometer was operated at a laser wavelength of 785nm (diode) and high resolution spectra were recorded in three spectral windows, covering 80–2660 cm-1. The microscope has 5x, 20x, and 50x objectives, with spot sizes of approximately 50, 10, and 4 micrometer, respectively. The system used a thermoelectrically cooled charge-coupled device (CCD) detector. The instrument is controlled via the OPUS 6.5.6 software.
3. Results
In three of the four locations studied, microplastic particles were recovered from the top one centimetre of the sediment samples (Figure 1). In total, five particles were identified as possible microplastics: 1 particle originating from the Nile Deep Sea Fan
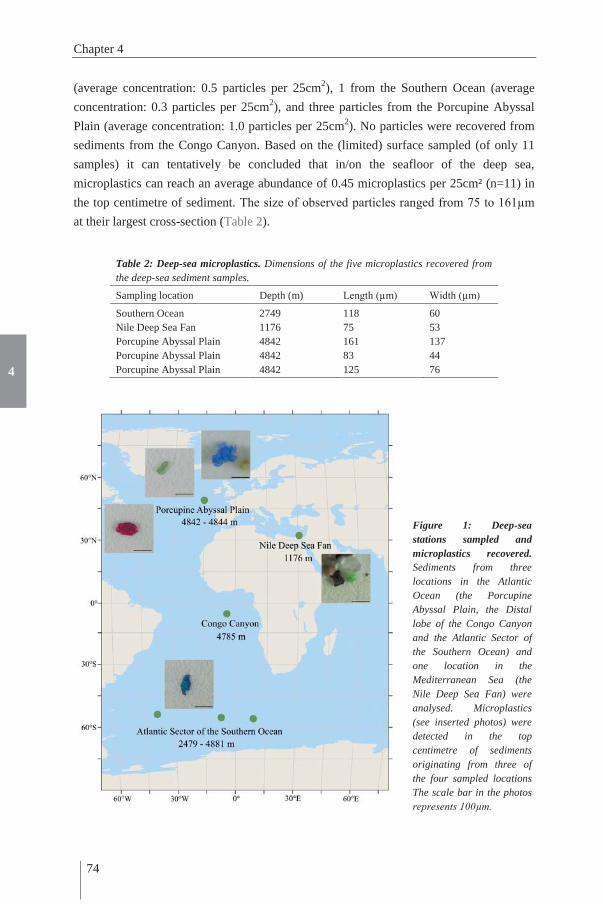
Chapter 4
74
4
(average concentration: 0.5 particles per 25cm2), 1 from the Southern Ocean (average concentration: 0.3 particles per 25cm2), and three particles from the Porcupine Abyssal Plain (average concentration: 1.0 particles per 25cm2). No particles were recovered from sediments from the Congo Canyon. Based on the (limited) surface sampled (of only 11 samples) it can tentatively be concluded that in/on the seafloor of the deep sea, microplastics can reach an average abundance of 0.45 microplastics per 25cm² (n=11) in the top centimetre of sediment. The size of observed particles ranged from 75 to 161μm at their largest cross-section (Table 2).
Table 2: Deep-sea microplastics. Dimensions of the five microplastics recovered from the deep-sea sediment samples.
Sampling location Depth (m) Length (μm) Width (μm)
Southern Ocean 2749 118 60 Nile Deep Sea Fan 1176 75 53 Porcupine Abyssal Plain 4842 161 137 Porcupine Abyssal Plain 4842 83 44 Porcupine Abyssal Plain 4842 125 76
Figure 1: Deep-sea stations sampled and microplastics recovered. Sediments from three locations in the Atlantic Ocean (the Porcupine Abyssal Plain, the Distal lobe of the Congo Canyon and the Atlantic Sector of the Southern Ocean) and one location in the Mediterranean Sea (the Nile Deep Sea Fan) were analysed. Microplastics (see inserted photos) were detected in the top centimetre of sediments originating from three of the four sampled locations The scale bar in the photos represents 100μm.

4
Microplastics in deep-sea sediments
75
All five particles had distinct colouring, as can be seen on the inserted photos in Figure 1. The presence of these pigments in the particles interfered with the Raman measurements. As a result the spectra obtained were these for the pigments present in the particles, and not those for the plastic type (Figure 2). Three different pigments were measured: copper phthalocyanine in the blue particles, polychloro copper phthalocyanine in the green particles and permanent red in the pink particle.
4. Discussion
The prevalence of microplastic in the majority of sediment samples suggest that they are ubiquitous in the deep sea, an environment that is considered to be one of the most pristine on earth. Here, we detected on average 181.8 particles.m-2 (range: 0 – 400 per m2). The highest concentration of microplastics was encountered in the sediment of the Porcupine Abyssal Plain. It is remarkable that no or only a limited numbers of microplastics were recovered from the location off the Congo and Nile rivers, since these rivers pass through countries that lack adequate waste management. Because of the small sample sizes (only two to three cores per location) and the small volumes per core, the fact that no microplastics were encountered does not necessarily imply that no microplastics are present at these locations. In addition, due to the high organic content of the samples originating from the Congo Canyon, filters contained high amounts of organic (plant) material that impeded the visual inspection for microplastics. It is thus possible that microplastics present in these samples were missed. As the sampling station in the Nile Deep Sea Fan is located near the edge of the Nile Delta Fan, a reduced riverine input is expected, hence explaining the limited number of microplastics detected here.
Since publication only a limited number of studies investigated the presence of microplastics in deep-sea sediments (Fisher at al., 2015; Woodall et al., 2014). The abundance of microplastics detected across locations reported here (0 – 400 microparticles.m-2), coincides with the concentrations detected in the Kuril-Kamchatka Trench (Fisher et al., 2015). Here, microplastic concentrations ranged from 0 to 505 microplastics per m2 in the top two centimetres of the sediment. However, as 75% of these microplastics were microfibres, microparticle concentrations ranged from 0 – 380 particles.m-2. In a similar study, Woodall et al. (2014) detected on average 13.4 microplastics per 50 cm3 (top 1 – 2 centimetre) in samples originating from Mediterranean Sea, North Atlantic and South Indian Ocean. This is much higher than the average value of 0.45 microplastics per 25cm3 (top 1cm) detected here. However, as Woodall et al. (2014) only detected microfibres and this type of microplastic was deliberately rejected from analysis in this study (as a contamination measure), the results from both studies are not comparable. Nonetheless, although the evidence for

Chapter 4
76
4
microplastic contamination in deep-sea sediments is still limited (only three studies so far), they all independently prove that substantial amounts of microplastics (both particles and fibres) have accumulated in the deep sea.
Figure 2: Microplastic identification using micro-Raman spectroscopy. A.: Microplastic particle extracted from sediment originating from the Southern Ocean at 1749m depth. B.: Raman spectrum for the extracted particle. C.: Raman spectrum for the widely used blue pigment copper phthalocyanine (blue pigment). The Raman peaks in this spectrum match with those represented in panel B. (see dotted lines).
Due to the presence of pigments in all microplastic particles, it was not possible to identify plastic type with micro-Raman spectroscopy. Instead, we identified the pigment present in the particles. Three different pigments were measured: copper phthalocyanine (blue pigment), polychloro copper phthalocyanine (green pigment) and permanent red (red pigment). These are all organic pigments with a non-natural origin, indicating the anthropogenic origin of all particles in these samples. Additionally, these pigments are

4
Microplastics in deep-sea sediments
77
most commonly used in the plastics industry (Lewis, 2004), which strengthens the assumption that these particles are microplastics.
Plastics are relatively new materials, and have only been produced for the past 60 years. Despite their young age, plastics have already invaded most marine habitats, and even the most pristine of environments, the Arctic deep sea is not been spared, as Bergmann et al. (2012) recently demonstrated. The sea floor is considered as a sink for much of the marine plastics (Goldberg, 1997), but the mechanisms by which these materials reach the deep sea floor, however, are still poorly understood (Gregory, 2009). For larger plastic debris, the heavy fouling of floating plastics is a possible mechanism, as it increases density so that they sink to the sea floor. Microplastics, on the other hand could reach the sea floor as marine snow. This marine snow is produced as a biologically enhanced aggregation of small particles (Alldredge and Silver, 1988). These micro-aggregates normally contain phytoplankton, organic debris and clay particles which adhere together through the action of extracellular polymeric material exuded by living or dead cells. Sinking rates of marine snow are estimated to range from 1 to 368 m.d-1
(Alldredge and Silver, 1988). The depths of the deep-sea sampling locations in this study could thus have been reached within a couple of days or after several years. Through the incorporation of microplastics in these micro-aggregates, even low-density plastic particles (such as polyethylene and polypropylene) that normally float on the sea surface can be transported to the seafloor.
As such, it is hard to make any prediction on the plastic type (i.e. low-density vs. high-density plastic) of the recovered microplastics. Since the extraction technique was based on flotation using a 1.6 g.cm-3 solution, we can state that the deep-sea microplastics must a have a similar or lower density. Most commercially available plastics, however, meet this specification.
In this study only a limited surface area of deepsea sediment was analysed. As the samples were not collected during dedicated microplastic sampling cruises, only a limited number of samples was available for microplastic analysis. In order to elucidate the contamination pattern of the deep see, but also the evolution of deepsea microplastic abundances, a larger number of samples, i.e. a larger surface area, need to be investigated. As was demonstrated for the Congo Canyon, high amounts of organic material can hinder microplastic detection. It is therefore advisable that during sample processing an additional oxidation step with hydrogenperoxide (H2O2) is included to ensure maximum destruction of the organic material (without damaging the plastics).
We were able to show, for the first time ever, that microplastics are present in the top sediment layer of the deep-sea floor. Up to now, however, no conclusive statements can be made on how these microscopic particles were transported from the surface to the

Chapter 4
78
4
bottom of the oceans. Yet, their presence indicates that microplastics have invaded the marine environment to an extent that they appear to be present throughout the world’s oceans and seas, including abyssal depths.

PART 2 ACCUMULATION AND EFFECT ASSESSMENT


5 Microplastics in organisms living in natural habitats
and associated effects
Redrafted from: Van Cauwenberghe, L., Claessens, M., Vandegehuchte, M.B., Janssen, C.R., 2015. Microplastics are taken up by mussels (Mytilus edulis) and lugworms (Arenicola marina) living in natural habitats. Environmental Pollution 199, 10-17. DOI: 10.1016/j.envpol.2015.01.008.
Chapter 5
82
5
ABSTRACT
We studied the uptake of microplastics under field conditions. At six locations along the French-Belgian-Dutch coastline we collected two species of marine invertebrates representing different feeding strategies: the blue mussel Mytilus edulis (filter feeder) and the lugworm Arenicola marina (deposit feeder). Additional laboratory experiments were performed to assess possible (adverse) effects of ingestion and translocation of microplastics on the energy metabolism (cellular energy allocation) of these species. Microplastics were present in all organisms collected in the field: on average 0.2 ± 0.3 microplastics.g-1 (M. edulis) and 1.2 ± 2.8 particles.g-1 (A. marina). In a proof of principle laboratory experiment, mussels and lugworms exposed to high concentrations of polystyrene microspheres (110 particles.mL-1 seawater and 110 particles.g-1 sediment, respectively) showed no significant adverse effect on the organisms’ overall energy budget. The results are discussed in the context of possible risks as a result of the possible transfer of sorbed contaminants.

5
Microplastics in organisms living in natural habitats and associated effects
83
1. Introduction
The presence of microplastics has been demonstrated for different marine compartments worldwide such as inter- and subtidal sediments (e.g. Browne et al., 2011; Claessens et al., 2011; Ng and Obbard, 2006; Reddy et al., 2006; Thompson et al., 2004) and in (sub)surface waters (e.g. Collignon et al., 2012; Ng and Obbard, 2006; Thompson et al., 2004). Because of their small dimensions, microplastics have a similar size range as planktonic organisms and other suspended particles, making them available to an array of marine invertebrates (Wright et al., 2013b) commonly not affected by larger marine debris. Many of the latter feed by collecting and sorting particulate matter, applying a feeding strategy that allows them to trap and ingest anything of appropriate size (Moore, 2008). The uptake of microplastics by these organisms will depend on a combination of parameters (i.e. size, shape and density of the plastic particle) that determine the position of these particles in the water column, and hence the availability to animals. Typically, low-density particles will float in the water column while high-density particles tend to sink and accumulate in the sediment, making them available to filter- or deposit feeders, respectively (Browne et al., 2007). Laboratory experiments have shown that various marine invertebrates (exhibiting different feeding strategies) ingest microplastics: amphipods (detrivores), lugworms (deposit feeders) and barnacles (filter feeders) (Thompson et al., 2004) as well as sea cucumbers (deposit and suspension feeders) (Graham and Thompson, 2009). Experiments focusing on particle selection demonstrated that filter feeding bivalves will ingest polystyrene microparticles (see Ward and Shumway, 2004 for more information). Once ingested, microplastics have the potential to translocate from the digestive tract to the circulatory system of the organisms. Browne et al. (2008) showed that in the marine bivalve Mytilus edulis ingested polystyrene microspheres (3 and 10μm) translocated to the circulatory system. Smaller particles seem to undergo translocation more readily than larger ones. Von Moos et al. (2012) demonstrated that small plastic particles (>0 – 80 μm) can accumulate in epithelial cells of the digestive system (more specifically the digestive tubules), where they induce adverse effects, such as a strong inflammatory response, after only 3 hours of exposure.
When assessing the ingestion and translocation of microplastics in marine invertebrates, the test organisms are usually exposed to extremely high concentrations of microplastics. For example, in laboratory experiments Thompson et al. (2004) exposed (intertidal) lugworms to 1.5 gram of microplastics per litre of sediment, corresponding to 1.17g microplastics.kg-1 dry sediment (average sediment density of 1600 kg.m-3 (Fettweis et al., 2007) and average wet/dry ratio of 1.25). These concentrations seem to be unrealistically high as Claessens et al. (2011), for example, reported an average of 0.35mg microplastics.kg-1 dry sediment for Belgian intertidal shores. In general, experimental microplastic concentrations used in uptake and translocation studies with

Chapter 5
84
5
marine species are much higher (up to 5,000 times) than realistic environmental concentrations. While such an approach is often necessary to predict effect concentrations and assess the tested pollutant (especially with regards to emerging pollutants such as microplastics), testing at high, non-natural, concentrations does not provide any information on the current environmental situation, which is equally, if not more, important. Unfortunately, to date, there is only limited evidence (Mathalon and Hill, 2014; Van Cauwenberghe and Janssen, 2014) that organisms in the field take up significant amounts of microplastics and accumulate them.
Here, we examined the presence of microplastics in ‘naturally exposed’ marine organisms. The blue mussel Mytilus edulis and the lugworm Arenicola marina, representing different feeding strategies (filter feeder vs. deposit feeder) and different marine compartments (water column vs. sediment), were studied. In addition, to test the hypothesis whether microplastic ingestion adversely affects the energy metabolism, both model species were exposed to high concentrations of microplastics in the laboratory for 14 days after which their energy status was assessed.
2. Materials & Methods
2.1 Field sampling
Biota, water and sediment were collected at 6 sampling stations along the French, Belgian and Dutch North Sea coast, in late summer of 2011 (Figure 1). Three of these stations (S3 and S5 in Belgium and S1 in France) are located close to coastal harbours where shipping and industrial activity is high. Mytilus edulis (size: 4 – 4.5 cm) were collected randomly on the local breakwaters. Additionally, two 10L water samples were taken near the breakwater using a bucket rinsed with filtered deionised water (FDW, 0.8μm membrane filter, Supor®800, GelmanSciences). Arenicola marina (size: 7 – 11 cm) were collected in the intertidal zone by means of a bait-pump or shovel. The lugworms were rinsed with filtered seawater (FSW, 0.8μm, Supor®800, GelmanSciences) in order to remove all external sediment, and subsequently transferred per 2 to a jar containing 50mL FSW. In the area in which the lugworms were sampled, six 0.5L sediment samples were collected by removing the upper 5cm with a metal scoop. A. marina was not present in all sampling stations: lugworm activity was only visible in S1, S2 and S5. Hence, sediment samples were only collected at these sampling stations.
2.2 Microplastics in environmental samples
The organisms were kept in 250mL glass jars containing 150mL FSW (mussels per 3, lugworms per 2) for 24 hours after sampling to allow complete gut clearance. During gut clearance, the FSW in which the organisms were kept was changed regularly to prevent re-uptake of egested material. Faeces were collected using a 35μm sieve. Collected

5
Microplastics in organisms living in natural habitats and associated effects
85
animal faeces were transferred to a 15mL centrifugation tube and subjected to NaI-extraction (Claessens et al., 2013b).
After the 24h-clearance period, the organisms’ soft tissues were digested as described in (Claessens et al., 2013b). In summary, the animals were left overnight in 69% nitric acid, followed by 2 hours of boiling and dilution (1:10 v/v) with warm (~80°C) FDW. The solution was subsequently filtered over a 5μm cellulose nitrate membrane filter. To correct for potential procedural contamination, blank extractions were performed simultaneously.
Sediment samples were extracted using a novel technique, comprising an initial elutriation phase followed by a NaI-extraction. The sediment sample (500mL) is washed through a 1mm sieve to remove larger debris, and subsequently transferred to the elutriation tube. An upward water flow (300 L.h-1) is created and aeration is provided to ensure maximal extraction efficiency. The effluent (containing microplastics and other lighter material) is filtered over a 35μm sieve. The material collected on this sieve is finally subjected to NaI-extraction (Claessens et al., 2013b). Prior to use, the NaI is filtered over a 0.8μm membrane filter to avoid contamination.
Figure 1: Map of the study area. Sampling locations are situated along the French-Belgian-Dutch coastline (S1: Dunkerque, S2: Middelkerke, S3: Oostende, S4: Wenduine, S5: Heist, S6: Cadzand).
Microplastics in seawater samples were extracted after the suspended material was allowed to settle for 24 hours. The overlying water was directly filtered over a 5μm membrane filter. The remaining solids were subjected to a NaI-extraction, as described earlier for sediment samples.

Chapter 5
86
5
After extraction, filters were visually analysed using a microscope (Olympus BX41 at magnification10x20). A sub-set of microparticles, selected based on appearance in order to cover the microparticle diversity detected, was analysed using a micro-Raman spectrometer (Bruker Optics ‘Senterra’ dispersive Raman spectrometer coupled with an Olympus BX51 microscope) to identify plastic type. The Raman spectrometer was operated at a laser wavelength of 785 nm (diode) and high resolution spectra were recorded in three spectral windows, covering 80 – 2660 cm-1. The microscope has 5x, 20x, and 50x objectives, with spot sizes of approximately 50, 10, and 4 micrometer, respectively. The instrument is controlled via the OPUS 6.5.6 software.
2.3 Impact of microplastic ingestion on energy metabolism
To study the translocation of microplastics, and possible associated effects, M. edulis specimens (35 ± 2 mm) were collected at S2. The organisms were kept in artificial seawater (Instant Ocean® sea salt, Aquarium Systems, France) with constant aeration, in temperature-controlled conditions (15°C), for two weeks prior to the start of the experiments. The organisms were fed on an Isochrysis, Pavlova, Tetraselmis and Thalassiosira weissflogii food supplement (Instant Algae, Shellfish Diet 1800, Reed Mariculture Inc., USA). The exposure experiment was conducted with mussels randomly assigned to one of two treatments: a control treatment (5 replicates) and exposure to microplastics (10 replicates). Mussels were placed per three in a 1L beaker filled with 400mL of artificial seawater. Stirring bars were added and the beakers were placed on magnetic stirrers (~200rpm). To the exposure treatment, polystyrene microspheres (Coulter Standard latex beads, Analis) of three different sizes were added: 10μm (50 particles.mL-1), 30μm (50 particles.mL-1) and 90μm (10 particles.mL-1), obtaining a final exposure concentration of 110 particles.mL-1. This exposure medium was renewed daily: old medium was removed, the remaining faeces were carefully washed away (without disturbing the mussels) and fresh medium was added. The experiment was performed in a temperature-controlled room (15°C), and mussels were fed daily on the same food supplement used for the two-week acclimatisation.
A. marina specimens and sediment samples were collected in the intertidal zone near the same S2 breakwater. Organisms were acclimated to laboratory conditions for two weeks prior to the microplastic experiments and were kept in 10L aquaria with a 5cm sediment layer, artificial seawater and aeration (15°C). Subsequently, lugworms were randomly assigned to either control (n=10) or exposure (n=20) treatment. The lugworms were placed individually in a glass jar (1.5L) with 700g natural sediment and 350mL artificial seawater. In the exposure treatment polystyrene microspheres (Coulter Standard latex beads, Analis, Belgium) were added to the sediment in similar concentrations as in the M. edulis exposure (10μm: 50 particles.g-1; 30μm: 50 particles.g-1; 90μm: 10

5
Microplastics in organisms living in natural habitats and associated effects
87
particles.g-1). The sediment and overlying seawater were renewed after seven days. During the experiment, 3 worms died.
At the end of the experiment (day 14), all of the control and half of the exposed mussels and lugworms were used for biomarker analysis while the remaining exposed organisms were used in a chemical digestion protocol. The latter were transferred to clean artificial seawater (without microplastics and without food) for 24h, to allow gut clearance. In this way, microplastics present in the gut were removed before acid digestion. Chemical digestion was performed in the same way as mentioned in Section 2.2.
Cellular Energy Allocation (CEA) in mussel digestive gland and complete lugworm was measured according to Verslycke and Janssen (2002) with minor modifications. Protein content was analysed using the principle of Bradford (1976), with bovine serum albumin as standard. Carbohydrates were measured with the phenol-sulphuric acid assay (DuBois et al., 1956), using glucose as a standard. Lipids were extracted according to the method of Bligh and Dyer (1959), using triptalmitin in chloroform as a reference. The measured fractions were transformed into energetic equivalents by using their respective combustion energy (Gnaiger, 1983). Energy consumption (Ec) was estimated by measuring the activity of the mitochondrial electron transport system (ETS) according to King and Packard (1975). From the ETS activity, the quantity of oxygen consumed was derived and subsequently transformed into an energetic equivalent using the specific oxyenthalpic equivalent for an average protein, carbohydrate and lipid mixture of 484 kJ.mol-1 O2 (Gnaiger, 1983). The Ea, Ec and CEA value were calculated using Equation 1, Equation 2 and Equation 3.
) [Eq. 1]
[Eq. 2]
[Eq. 3]
2.4 Data processing
Microplastic concentrations, and energy fractions, are presented as mean ± SD (standard deviation). All statistical analyses were performed using the SAS software (SAS 9.3). For the analyses of the effects of microplastics on the energy metabolism of exposed organisms, the non-parametric Wilcoxon-Mann-Whitney test for pairwise comparison was used (significance level = 0.05).

Chapter 5
88
5
3. Results
3.1 Microplastics in environmental samples
As sample processing was not performed in a laminar flow cabinet (as in Foekema et al., 2013 and Van Cauwenberghe and Janssen, 2014) contamination with airborne fibres could not be excluded. Although unlikely that all detected fibres had an airborne origin, it was decided to omit all microplastic fibres from further analyses. Therefore, the microplastic concentrations reported here could be underestimations.
Small microplastics (SMPs; <1 mm) were present in all environmental compartments analysed, i.e. animal tissue (wet weight (ww)) and faeces and in water and sediment samples (Table 1 and Figure 2). Seawater samples (n=12) had on average 0.4 ± 0.3 particles.L-1 (range: 0.0 - 0.8 particles.L-1). In beach sediments (n=18), concentrations ranged from 1.5 to 23.4 particles.kg-1 dry sediment with an average of 6.0 ± 5.7 particles.kg-1dry. M. edulis contained on average 0.2 ± 0.3 particles.g-1 tissue, with highest concentrations measured in S3 (1.1 particles.g-1). A. marina had on average 1.2 ± 2.8 particles per gram tissue (Table 3). The highest concentration of microplastics in a lugworm sample was detected in S5 (11.3 particles.g-1). Analysis of the faeces collected during the 24h clearance period resulted in average microplastic concentrations of 0.1 ± 0.2 particles.g-1 tissue in mussel faeces, while lugworm casts contained 0.3 ± 0.6 particles.g-1 tissue (Table 1).
Table 1: Microplastic concentrations in environmental compartments. Average concentration and size range (n=5 to 30 particles) of microplastics recovered from animal tissue (ww) and faeces of M. edulis or A. marina and from their respective environmental matrix (seawater or beach sediment). Values in parentheses represent the standard deviation.
Unit Average concentration Size range (μm)
M. edulis tissue particles.g-1 tissue 0.2 (0.3) 20 – 90 M. edulis faeces particles.g-1 tissue 0.1 (0.2) 15 – 500 Seawater particles.L-1 0.4 (0.3) 30 – 300 A. marina tissue particles.g-1 tissue 1.2 (2.8) 15 – 100 A. marina faeces particles.g-1 tissue 0.3 (0.6) 35 – 1000 Sediment particles.kg-1 dry 6.0 (5.7) 30 - 1175
Microparticles extracted from the organisms consisted of low-density polyethylene, high-density polyethylene and polystyrene. Some particles (more specifically blue particles) yielded a spectrum that did not correspond to that of a specific plastic type. Instead, the spectra corresponded to that for the blue pigment present in the particle: copper phthalocyanine. This synthetic pigment, indicating an anthropogenic origin for these particles, is ubiquitously used in the plastics industry (Lewis, 2004), strengthening the assumption that these particles are microplastics as well.

5
Microplastics in organisms living in natural habitats and associated effects
89
3.2 Impact of microplastics on energy metabolism
Analysis of acid digested mussels (n=5) exposed to polystyrene microspheres indicated that the smallest of these particles are being retained more easily within the animals as compared to the larger particles: on average 2.6 ± 0.4 particles.gram-1 tissue were recovered. In lugworms, however, two types of microplastics were detected: apart from 10μm-particles (9.6 ± 1.8 particles.gram-1 tissue) also 30μm-particles were detected, albeit in smaller quantities (i.e. 0.8 ± 0.7 particles.gram-1 tissue) (Table 2).
Figure 2: Microplastic concentrations detected in environmental compartments. Average microplastic concentrations detected in various environmental matrices (seawater, beach sediment, mussel tissue and faeces and lugworm tissue and faeces), sampled at different locations. Bars represent the standard deviation.
The exposure to polystyrene microspheres did not cause any significant changes in CEA of the two test species (Table 3; Wilcoxon-Mann-Whitney test: M. edulis: p=0.5309; A. marina: p=0.1384). However, in the digestive gland of mussels exposed to microplastics a 25% increase in energy consumption (Ec) was detected compared to the control organisms (Wilcoxon-Mann-Whitney test: p=0.0122). In lugworms, exposure to

Chapter 5
90
5
microplastics resulted in an 18% increase in protein content compared to the control organisms (Wilcoxon-Mann-Whitney test: p=0.0262). These increases in metabolism were, however, not accompanied by any other changes in the energy reserves, and hence no significant overall effect on the total CEA, was detected.
Table 2: Microplastic concentrations in organisms after laboratory exposure. Average concentrations of microplastics recovered from the acid digested tissue of M. edulis and A. marina exposed to polystyrene microspheres under laboratory conditions. Values in parentheses represent the standard deviation. 10μm Spheres
particles.g-1 tissue 30μm Spheres
particles.g-1 tissue 90μm Spheres
particles.g-1 tissue Total
particles.g-1 tissue
Mytilus edulis 2.6 (0.4) 0.0 (0.0) 0.0 (0.0) 2.6 (0.4) Arenicola marina 9.6 (1.8) 0.8 (0.7) 0.0 (0.0) 10.4 (1.6)
Table 3: Results biomarker analysis. Results for the CEA determination in mussels Mytilus edulis (Control n=5, Exposed n=5) and lugworms Arenicola marina (Control n=7, Exposed n=9). SD is standard deviation. P-values are given (Wilcoxon-Mann-Whitney test) (* is significant).
Unit Control ± SD Exposed ± SD p-value
Mytilus edulis EProtein J.mg-1 ww 0.656 ± 0.066 0.674 ± 0.089 1.0000 ECarbohydrate J.mg-1 ww 0.136 ± 0.040 0.132 ± 0.074 0.8345 ELipid J.mg-1 ww 3.518 ± 1.156 3.995 ± 1.316 0.4043 EC J.mg-1 ww.h-1 0.012 ± 0.002 0.015 ± 0.001 0.0122* CEA h-1 304.3 ± 76.8 269.6 ± 72.4 0.5309
Arenicola marina EProtein J.mg-1 ww 0.595 ± 0.082 0.700 ± 0.069 0.0262* ECarbohydrate J.mg-1 ww 0.011 ± 0.005 0.010 ± 0.003 0.9157 ELipid J.mg-1 ww 0.442 ± 0.208 0.399 ± 0.124 0.2443 EC J.mg-1 ww.h-1 0.007 ± 0.001 0.007 ± 0.001 0.5966 CEA h-1 150.0 ± 29.4 167.7 ± 28.6 0.1384
4. Discussion
Microplastic concentrations were assessed in different environmental compartments along an 80km stretch of coast, covering the entire Belgian coastline and adjacent areas in France and the Netherlands. Apart from sampling the usual sediment and water compartments, organisms inhabiting these compartments were collected as well and their plastic body burden assessed. Mytilus edulis was selected as model species for filter feeders inhabiting the water column, as they are common in the sampled waters, sedentary, and filter large volumes of water (Clausen and Riisgàrd, 1996). The uptake of microplastic particles from the water column by M. edulis has been demonstrated in several laboratory feeding experiments (Browne et al., 2008; Farrell and Nelson, 2013; Thompson et al., 2004; von Moos et al., 2012), but also in wild populations (Mathalon

5
Microplastics in organisms living in natural habitats and associated effects
91
and Hill, 2014; Van Cauwenberghe and Janssen, 2014). The lugworm Arenicola marina is common in sandy sediments in the intertidal zone. Lugworms feed on the organic fraction of ingested sediment and as a result process a wide range of particle sizes (Bat and Raffaelli, 1998; Retraubun et al., 1996). Because of their non-selective feeding strategy, lugworms will ingest microplastic particles present in the sediment (Besseling et al., 2013; Browne et al., 2013; Thompson et al., 2004; Wright et al., 2013a). Since only juvenile lugworms disperse to other tidal flats (Flach and Beukema, 1994), adult worms remain present in one location their entire lifetime.
The results presented here demonstrate that field-collected marine invertebrates contain microplastics. M. edulis and A. marina contained on average 0.2 ± 0.3 and 1.2 ± 2.8 particles per gram of tissue, respectively. In two recent papers, microplastics were detected in wild and aquaculture populations of Mytilus edulis and Crassostrea gigas (Mathalon and Hill, 2014; Van Cauwenberghe and Janssen, 2014). While the concentrations of microplastics in farmed mussels and oysters as reported by Van Cauwenberghe and Janssen (2014) are similar to those reported here, Mathalon and Hill (2014) report much higher concentrations of up to 178 microfibres per mussel. These plastic body burdens are several orders of magnitude higher. Yet, it is hard to compare between these studies, as Mathalon and Hill (2014) only report microfibres, while fibres were omitted from the results reported here. Mathalon & Hill (2014) also report an average contamination of approximately 100 fibres per filter.
Based on some ecological assumptions, simplified calculations on the microplastic retention efficiency were made for wild mussels and lugworms. The filtration rate of a ‘standard’ mussel is 2 L.h-1 (Clausen and Riisgàrd, 1996; Cusson et al., 2005) and assuming it can filter 12 hours per day (12h submersion during high tide), a mussel will filter nearly 24 litres of seawater per day. Based on the average concentrations of microplastics in seawater we measured (i.e. 0.4 ± 0.3 particles.L-1), a mussel will be exposed to, and potentially take up, approximately 10 particles per day. Since the mussels collected in this study were 40mm in size (corresponding to an age of 4 years (Bayne and Worral, 1980)), these organisms have potentially filtered up to 14,000 microplastics from the seawater during their lifetime. With a plastic body burden of 0.2 ± 0.3 particles per gram of tissue, the mussels in this study (average wet weight of 2.0 ± 0.7 g) hence have a plastic retention efficiency of 0.003%. Daily sediment throughput rate in lugworms varies from 4.7 to 80 cm³.ind-1 (Cadée, 1976). They can live up to 6 years (Beukema and De Vlas, 1979), and reach their reproductive phase after 2 years (De Wilde and Berghuis, 1979). Since all lugworms collected in this study had body weight > 1g (on average 3.5 ± 2.5 g), they are classified as adults (Farke et al., 1979). However, as it is impossible to know the exact age of the animals analysed, both a worst- and best-case scenario plastic retention was calculated (i.e. retention efficiency for a 2 and 6-year old worm). If we

Chapter 5
92
5
assume that a lugworm has an average sediment throughput rate of 42.4 cm³.day-1, a two-year old worm will have ingested almost 31 litres of sediment, while a six-year old worm will have ingested up to 93 litres. Using an average sediment density of 1,600 kg.m-3 (Fettweis et al., 2007) and 1.25 as average wet/dry sediment ratio, this corresponds to 40 and almost 120kg of dry sediment, respectively. Taking into consideration the average concentration of microplastics measured in the sediment (6.0 ± 5.7 particles.kg-1 dry), the exposure of an adult worm ranges from 240 to over 700 microplastics over its lifetime. With a plastic body burden of 1.2 ± 2.8 particles.g-1, lugworms in this study (average body weight of 3.5 ± 2.5 g) exhibit a plastic retention efficiency ranging from 0.59% to 1.78% over a 2 to 6 year lifespan. These calculations are, however, only preliminary, as it should be noted that these organisms (both mussels and lugworms) live in highly dynamic systems. Exposure concentrations will hence exhibit both temporal and spatial variability. Even though the calculations presented here do not take this variability into account, they are indicative of the importance of microplastic uptake in these species.
Plastic retention in these both species differs considerably. This difference can be attributed to differences in processes of particle selection. A. marina is a non-selective feeder, ingesting sediment in order to feed on the associated organic matter, notably diatoms and bacteria (Retraubun et al., 1996). M. edulis, on the other hand, is a selective filter feeder, ingesting only algae and particles of appropriate size and shape (Defossez and Hawkins, 1997; Ward and Shumway, 2004), while rejecting other particles via pseudofaeces (material cleared from suspension but rejected before ingestion (Gosling, 2003)). The laboratory exposure experiments performed with M. edulis and A. marina seem to suggest a size limit for particle retention. This size limit lays between 10 to 30 μm and 30 to 90 μm for mussels and lugworms, respectively.
The accumulation of microplastics in exposed organisms may pose severe health risks to these organisms. In order to assess health status and possible stress effects, we measured energy budgets of laboratory exposed animals (i.e. CEA; cellular energy allocation) (Kooijman and Bedaux, 1996). Exposed mussels showed increased energy consumption (respiration) compared to the control organisms. Increased respiration can be linked to increased stress as the organisms try retain physiological homeostasis (Smolders et al., 2002). This increase in energy consumption, however, was not reflected in the energy reserves of the exposed organisms: no significant decrease in proteins, lipids or carbohydrates was observed. As a consequence, no significant effect of exposure to microplastics on CEA was noted. Similarly, exposed lugworms did not exhibit an adverse effect on CEA after exposure to microplastics. Even though the test organisms were exposed to very high concentrations of microplastics, i.e. a thousand times higher than measured environmental concentrations, no significant adverse effects were observed. It should, however, be noted that this were only short-term (14 days) experiments. Recently,
5
Microplastics in organisms living in natural habitats and associated effects
93
Wright et al. (2013a) did detect a significant decrease in the energy budget of lugworms exposed to microplastics (UPVC, mean diameter: 130μm). They noticed a 50% depletion of the worms’ energy budget after a chronic exposure of 28 days. A study on the effects of nanopolystyrene (30nm) on the feeding behaviour of M. edulis showed a significant increase in pseudofaeces production and a significant decrease in filtering activity, suggesting reduced energy acquisition and possible starvation of these animals (Wegner et al., 2012). However, mussels were exposed to extremely high concentrations of nanoplastics (up to 0.3 g.L-1). Consequently, further research is still needed to examine the toxicological consequences of long-term exposure (to environmentally relevant concentrations) of organisms to microplastics.
Fragments of plastic found in marine habitats worldwide have shown to sorb persistent organic pollutants, such as PAHs, PCBs and DDT (Heskett et al., 2011; Mato et al., 2001; Rios et al., 2007). Recent laboratory work has shown that phenanthrene sorbs to particles of polyethylene, polypropylene, and polyvinylchloride, reaching concentrations up to 10 higher than their concentrations on natural sediments (Teuten et al., 2007). Therefore, microplastics could provide a possible route for the transport of contaminants into exposed organisms, and as a consequence higher trophic level organisms, including humans. Based on the findings presented in this paper combined with the available literature on sorbed contaminants, a simple (preliminary) risk assessment can be performed. Plastic particles (more specifically resin pellets) recovered from the marine environment can contain concentrations of PCBs of up to 605 ng.g-1 (Ogata et al., 2009). Assuming an average weight for microplastics of 5 μg (Claessens et al., 2011), and an average plastic body burden for mussels as reported in this study (i.e. 0.2 particles per gram tissue), mussels may take up or contain an ‘additional’ (i.e. originating from plastics only) 0.0006ng PCBs per gram of tissue. When consuming a portion of these shellfish (approx. 300 g of meat), humans will hence be exposed to an additional 0.18ng PCBs. Considering the daily tolerable intake of PCBs (i.e. 0.02 μg.kg-1 body weight) as proposed by WHO (WHO, 2003) and a total PCB load of 288ng per portion of farmed mussels (up to 0.961 ng.g-1 tissue (Rawn et al., 2006) due to exposure to contaminated seawater and sediment), this additional 0.18ng (0.06%) does not raise toxicity concerns. However, as microplastic concentrations are expected to increase in the future, their potential health risk to humans (and other ‘higher’ organisms) should be assessed on a regular basis.


6 Microplastics in organisms cultured for human consumption
Redrafted from:
Van Cauwenberghe, L., Janssen, C.R., 2014. Microplastics in bivalves cultured for human consumption. Environmental Pollution 193, 65-70. DOI: 10.1016/j.envpol.2014.06.010

Chapter 6
96
6
ABSTRACT
Microplastics are present throughout the marine environment and ingestion of these plastic particles (<1 mm) has been demonstrated in a laboratory setting for a wide array of marine organisms. Here, we investigate the presence of microplastics in two species of commercially grown bivalves: Mytilus edulis and Crassostrea gigas. Microplastics were recovered from the soft tissues of both species. At time of human consumption, M. edulis contains on average 0.36 ± 0.07 particles.g-1 (wet weight), while a plastic load of 0.47 ± 0.16 particles.g-1 ww was detected in C. gigas. As a result, the annual dietary exposure for European shellfish consumers can amount to 11,000 microplastics per year. The presence of marine microplastics in seafood could pose a threat to food safety, however, due to the complexity of estimating microplastic toxicity, estimations of the potential risks for human health posed by microplastics in food stuffs is not (yet) possible.

6
Microplastics in organisms cultured for human consumption
97
1. Introduction
Because of their small dimensions, microplastics become available for ingestion to a wide range of marine organisms. Ingestion has already been demonstrated for organisms at the base of the food chain: a large variety of planktonic organisms, such as copepods, euphausiacea (krill) and larval stages of molluscs, decapods and echinoderms (Cole et al., 2013; Hart, 1991; Lee et al., 2013) will take up microplastics while feeding, as well as other invertebrates, such as polychaetes, bivalves, echinoderms and decapods (Graham and Thompson, 2009; Murray and Cowie, 2011; Thompson et al., 2004). Microplastics can either be ingested directly or indirectly through the consumption of lower trophic level prey (Farrell and Nelson, 2013). This may result in a limited food uptake through the blockage of feeding appendages and the alimentary canal (Cole et al., 2013; Murray and Cowie, 2011). Moreover, ingested microplastics have the potential to be taken up by epithelial cells of the intestinal tract (von Moos et al., 2012) and even translocate through the intestine wall to the circulatory system (Browne et al., 2008) of exposed mussels. Microplastic ingestion does not only cause physical harm but can also act as vectors of additives incorporated during manufacture (e.g. polybrominated diphenyl ethers (PBDE)) and organic pollutants sorbed from the surrounding seawater (e.g. polychlorinated biphenyls (PCBs)) (Teuten et al., 2009) to biota. The ecological significance of this transport was recently questioned by Koelmans et al. (2013). Nevertheless, due to their persistent nature, microplastic abundance in the marine environment will only increase. The increasing scientific evidence that numerous marine (invertebrate) species ingest microplastics is an indication that these microscopic plastic particles are entering the marine food chain. Taking into consideration that the global food supply of seafood, both from capture and aquaculture production, was over 125 × 106 tonnes in 2009 (FAO, 2012), consequences for human food safety need to be considered.
Aquaculture production of seafood (both finfish and shellfish) is mainly performed in open systems, i.e. in natural seawater. During their growth, the cultured organisms are hence exposed to any pollutant present in the seawater, including microplastics. Due to the small sizes of microplastics (i.e. micrometer size range), sampling and extraction from seawater is challenging. As a result, seawater concentrations of microplastics are rather limited in scientific literature, especially when compared to sediment concentrations. Reported seawater concentrations exhibit large spatial variability, ranging from less than one fibre per m³ (Thompson et al., 2004) to several hundreds of particles and fibres per m3 (Ng and Obbard, 2006; Van Cauwenberghe et al., 2013). Even though the existing data are too limited to determine a realistic natural concentration of microplastics in seawater, the potential for ingestion by commercially important species, however, remains a cause for concern. Bivalves are of particular interest since their extensive filter-feeding activity exposes them directly to microplastics present in the water column.

Chapter 6
98
6
In this study, we investigate the presence of microplastics in seafood. To test the hypothesis that cultured bivalves contain microplastics, microplastic load of two widely farmed and commercially important species was determined: the mussel Mytilus edulis and the oyster Crassostrea gigas, with a global production of 2.1 × 10⁵ tonnes and 6.6 × 10⁵ tonnes in 2010, respectively (FAO, 2012). Any microplastic detected in these cultured animals is a particle that will end up in the human food chain. Therefore, results are discussed in the context of food safety and possible impacts on human health.
2. Materials & Methods
2.1 Animal collection
Mytilus edulis were acquired directly from a mussel farm in Germany. The organisms were of adult size (5.2 ± 0.4 cm) and were reared for several years in the North Sea. Crassostrea gigas were bought in a supermarket and originated from Brittany, France. The oysters were reared in the Atlantic Ocean, and had an average shell length of 9.0 ± 0.5 cm.
2.2 Animal husbandry and microplastic extraction
Upon arrival at the lab, half of the organisms (M. edulis: n=36; C. gigas: n=10) were prepared for a three day depuration period, while the other half (M. edulis: n=36; C. gigas: n=11) was prepared for immediate acid digestion. The organisms assigned to the former treatment were kept in 250mL glass jars (mussels per three, oysters individually) containing 200mL filtered artificial seawater (Instant Ocean; 0.8μm membrane filter, Supor®800, GelmanSciences) for three days to allow them to clear their gut. Prior to use, the glass jars were rinsed three times with filtered deionised water (0.8μm membrane filter, Supor®800, GelmanSciences). Daily, the water in the test vessels was renewed to ensure that previously egested material, including microplastic particles, would not be ingested again. During this depuration period, starvation and associated retention of particles in the animals’ guts, was prevented by daily feeding with the algae Isochrysis galbana, which was cultured in clean and sterile conditions.
After three days of depuration for the former organisms, and upon arrival at the lab for the remaining animals, the organisms were removed from their shell and soft tissue wet weight was determined. Subsequently, the soft tissues were destructed as described in Claessens et al. (2013b). In summary, the animals were left overnight in 69% nitric acid (20 mL for three mussels; 25 mL for one oyster), followed by 2 hours of boiling, and dilution (1:10 v/v) with warm (~80°C) filtered deionised water (0.8μm membrane filter, Supor®800, GelmanSciences). This solution was subsequently filtered, while still warm, over a 5μm cellulose nitrate membrane filter (Whatman AE98). After digestion, the filters were dried at 40°C for 24h, and analysed for the presence of microplastics using a

6
Microplastics in organisms cultured for human consumption
99
microscope (Olympus BX41 at magnification 200×). The length and width of the detected particles were determined and, based on the largest dimension (length), every particle was assigned to one of five distinct size classes: 5 – 10 μm, 11 – 15 μm, 16 – 20 μm, 21 – 25 μm and > 25 μm.
Contamination with airborne fibres is a recurring phenomenon in microplastic research (Davison and Asch, 2011; Foekema et al., 2013), and as a result rigorous precautions should be taken while processing samples. In this study, extensive measures were adopted to avoid any contamination while handling and processing samples. A 100% cotton lab coat was worn at all times, all equipment was rinsed three times with filtered deionised water (0.8μm membrane filter, Supor®800, GelmanSciences) before use and all sample processing was performed in a clean laminar flow cabinet. Additionally, procedural blanks (i.e. samples containing no tissue) were included in each acid destruction, to account for any possible contamination.
2.3 Particle identification
A sub-set of microparticles, selected based on appearance in order to cover the microparticle diversity detected, was analysed using a micro-Raman spectrometer (Bruker Optics ‘Senterra’ dispersive Raman spectrometer coupled with an Olympus BX51 microscope) to identify plastic type. The Raman spectrometer was operated at a laser wavelength of 785 nm (diode) and high resolution spectra were recorded in three spectral windows, covering 80–2660 cm-1. The microscope has 5x, 20x, and 50x objectives, with spot sizes of approximately 50, 10, and 4 micrometer, respectively. The instrument is controlled via the OPUS 6.5.6 software.
3. Results
3.1 Microplastic detection
Microplastics were detected in both Mytilus edulis and Crassostrea gigas (Figure 1). Due to the rigorous precautions adopted while handling and processing the samples, contamination with (airborne) microplastics was successfully prevented. Indeed, the procedural blanks were completely free of any form of contamination, both fibre- and particle-shaped.
Low numbers of microparticles were recovered from the tissue of both species tested. In Mytilus edulis the average microplastic load in the organisms without depuration was 0.36 ± 0.07 particles per gram of soft tissue (wet weight (ww)). After the three day depuration period, only 0.24 ± 0.07 particles.g-1 ww were recovered (Figure 2). The same trend was observed in Crassostrea gigas: without depuration on average 0.47 ± 0.16

Chapter 6
100
6
particles g-1 ww were found, while microplastic concentrations decreased to an average of 0.35 ± 0.05 particles per gram soft tissue (ww) after depuration (Figure 2).
Figure 1: Microplastics detected in the acid digested Mytilus edulis and Crassostrea gigas. A. Red particle recovered from Mytilus edulis; B. Green sphere detected in the soft tissue of Crassostrea gigas. Scale bar represents 50 μm.
Figure 2: Average microplastic concentration (particles.g-1 ww) in the tissues of digested organisms. Before and after a three day depuration period. Bars represent standard deviation.
3.2 Microplastic characterisation
The size class frequency distribution of the microplastics detected in the acid digested tissues is presented in Figure 3. For both species, the three day depuration period resulted in the removal of all (in M. edulis) or the majority (in C. gigas) of the largest microplastics (i.e. particles > 25 μm in length). In M. edulis the most abundant microplastics present after gut depuration were the particles ranging in size from 5 – 10 μm (50.0%), while in C. gigas, the most abundant particles were those in the size ranges 11 – 15 μm (29.6%) and 16 – 20 μm (33.3%).

6
Microplastics in organisms cultured for human consumption
101
Figure 3: Size class frequency distribution of microplastics detected in bivalves cultured for human consumption. Assignment to the size classes is based on the largest dimension of the particles. These frequency distributions represent all particles detected per treatment, not per individual. A. M. edulis without gut depuration; B. M. edulis after a three day gut depuration; C. C. gigas without gut depuration; D. C. gigas after a three day gut depuration.
Only the particles that had a red or blue colour yielded distinct Raman spectra (Figure 4). The obvious colouring of these particles is attributed to the presence of pigments, which interfered with the measurements of the plastic type. As a result the spectra obtained were these for the pigments present in the particles, and not those for the plastic type (Figure 3). Three pigments were measured: hematite (red pigment) and two types of the blue pigment copper phthalocyanine (PB 15:1 and PB 15:3).
4. Discussion
Our results show that microplastic particles are present in shellfish, more specifically bivalves, cultured for human consumption. Mytilus edulis originating from the North Sea contain on average 0.36 ± 0.07 particles g-1 tissue at time of consumption (pre-depuration values). When consuming oysters (Crassostrea gigas) cultured in the Atlantic Ocean an average of 0.47 ± 0.16 particles will be ingested per gram of soft tissue. However, due to the use of concentrated HNO3 during tissue digestion, the microplastic concentrations reported here could be underestimations. Concentrated HNO3 has a detrimental effect on (nylon) fibres, resulting in the total destruction of this type of microplastic during extraction, resulting in a microfibre extraction efficiency of 0% for this technique (Claessens et al., 2013b).

Chapter 6
102
6
Figure 4: Identification of microparticles using micro-Raman spectroscopy. A. The Raman spectrum of a red particle extracted from M. edulis tissue corresponds to that of the red pigment Hematite. B. The Raman spectra of two blue particles (particle 1 from C. gigas and particle 2 from M. edulis) correspond to that of the widely used phthalocyanine dyes PB 15.1 (red shade of blue) and PB 15:3 (green shade of blue), respectively.
Spectroscopic analysis of a subset of microplastics was performed in an effort to positively identify the detected microparticles as true microplastics. A direct identification (i.e. identification of the plastic type), however, was hindered by the presence of pigments. Processing of the tissue samples in 69% HNO3 can result in the degradation of the plastic matrix to the extent that the distinct plastic peaks in the spectrum decrease or even disappear (results not shown). This reduced ‘plastic signal’ is further obscured by the strong signal of the pigments present, hindering the identification of plastic type. Spectroscopic analysis of the blue particles resulted in spectra that correspond with those of phthalocyanine dyes, more specifically copper phthalocyanines. These are synthetic pigments, indicating an anthropogenic origin of these particles. Additionally, these pigments are most commonly used in the plastics industry (Lewis, 2004), which strengthens the assumption that these microparticles are actually microplastics. The second pigment that was positively identified using Raman

6
Microplastics in organisms cultured for human consumption
103
spectroscopy was hematite, an inorganic red pigment. This mineral iron oxide occurs naturally as a black to gray or brown to dull red mineral (Buxbaum, 1998). The particle that generated the hematite spectrum, however, was bright red indicating this was an anthropogenic particle coloured using hematite as a pigment. The hematite pigment is used in a wide array of applications, including the colouring of plastics. The detection of these pigments in the extracted particles provides with indirect evidence that these particles are of anthropogenic origin, most likely microplastics as these pigments are widely used in plastics. However, as this identification was not successful for all extracted microparticles, only for the blue and red particles, the abundances of microplastic particles reported here may be overestimations as some of the detected microparticles might not be plastic after all.
A spectroscopic alternative to micro-Raman spectroscopy is Fourier transform infrared spectroscopy (FTIR). This technique is regularly used to determine the polymer composition of microplastics from environmental samples (for a review, see Hidalgo-Ruz et al. 14). Pyrolysis gas chromatography (Pyr-GC) is a technique commonly used in polymer science to analyse the chemical composition of polymers, that has recently been introduce to microplastic research by Fries et al. (2013). It is important to systematically identify the nature (i.e. plastic type) of the microplastics present in environmental samples as some polymers have a higher intrinsic toxicity than others. Monomers leaching from certain types of plastic can cause both acute and chronic effects in organisms, including humans (e.g. vinyl chloride (Awara et al., 1998)) and styrene (ATSDR, 2010)). It is therefore important to know what fraction of microplastics in the environment consists of such toxic monomers to be able to assess the effects and risks of microplastic pollution to organisms and ecosystems.
It is not surprising that seafood contains microplastics: these organisms are cultured in natural conditions. Production of bivalves, such as oysters and mussels, is mainly performed in coastal areas, with the organisms growing on ropes suspended from rafts or on structures built above the seabed. These commercially grown mussels and oysters are not fed by the farmer; they feed on algae naturally present in the seawater. As a result these filter feeders are exposed to any pollutant present in the seawater, including microplastics and other particles, in the same way as their wild counterparts. Ingestion of microplastics of different sizes and shapes by filter feeders has already been demonstrated several times in a laboratory setting (e.g. Browne et al., 2008; Cole et al., 2013; Thompson et al., 2004; von Moos et al., 2012; Ward and Shumway, 2004), and has also been detected in wild populations (Van Cauwenberghe et al., 2015). In a recent paper, Mathalon & Hill (2014) detected microfibres in wild and farmed mussels. Farmed mussels had significant higher concentrations of microplastics compared to wild mussels: on average 178 microfibres per farmed mussel compared to an average of 126 microfibres

Chapter 6
104
6
per wild mussel in the most polluted site. These plastic body burdens are 500 times higher than the concentrations in mussels reported in this study. While the use of concentrated HNO3 in the tissue digestion has detrimental effects on fibres (Claessens et al., 2013b), Mathalon & Hill (2014) report a contamination of approximately 100 microfibres per filter.
Part of the mussels and oysters were allowed to clear their gut prior to analysis. In order to achieve gut clearance, the organisms were placed in filtered seawater for three consecutive days. Bivalve gut depuration differs greatly, depending on species, temperature and food quantity and quality (Bayne et al., 1987; Hawkins and Bayne, 1984). Typical gut depuration times vary from less than an hour in Potamocorbula amurensis (Decho and Luoma, 1991) to up to 15 hours in Mytilus edulis (Bayne et al., 1987). The three day gut clearance as practiced in this study should hence be sufficient to remove any particles present in the digestive tract. The decreased microplastic body burden observed after three days of gut depuration (Figure 2) indicates that part of the microplastics detected prior to depuration were present in the digestive tract. The majority of the microplastics, however, appear to be present in the animals on a more permanent basis, since depuration did not result in the removal of these particles. Plastic particles may be retained in the tissues (von Moos et al., 2012) and the circulatory system (Browne et al., 2008), or lodged in the digestive tract (vertebrates e.g. Denuncio et al., 2011; Lazar and Gračan, 2011; van Franeker et al., 2011; invertebrates Murray and Cowie, 2011). The specific removal of larger microplastics as a result of gut depuration might be an indication that the remaining, smaller, particles may have translocated through the gut wall and are subsequently retained in the tissues and circulatory system. Since the largest particles are removed as a result of continued feeding and associated enhanced gut-passage, smaller particles present in the digestive tract should have been egested as well. Especially when considering that in scallop, another filter feeding bivalve, it was demonstrated that larger particles are retained longer compared to smaller particles (Brillant and MacDonald, 2000). As a result, gut retention time is shorter for smaller than for larger particles.
Despite the ever increasing number of scientific reports on the occurrence of microplastics in the marine environment and associated impacts on marine life, this report is the first to report on possible consequences of marine microplastics for humans. The presence of microplastics in seafood is, through entering the human food chain, the first potential direct effect of microplastic pollution on humans. When consuming an average portion of mussels (250g wet weight) one consumes around 90 particles. An average portion of 6 oysters (100g ww) contains around 50 particles. Shellfish consumption differs greatly among countries, in Europe for instance mollusc consumption can differ over a factor of 70 between consumers and non-consumers (EFSA, 2011). European top

6
Microplastics in organisms cultured for human consumption
105
consumers can be found in Belgium (elderly), with a per capita consumption of 72.1 g.day-1, while mollusc consumers in France (adolescents) and Ireland (adults) have the lowest per capita consumption: only 11.8 g.day-1 for both countries2 (EFSA, 2011). Using the average microplastic concentration detected in this study (i.e. 0.42 particles.g1 tissue; average of M. edulis and C. gigas plastic load without depuration), an annual dietary exposure can be calculated. European top consumers will ingest up to 11,000 microplastics per year, while minor mollusc consumers still have a dietary exposure of 1,800 microplastics.year-1.
Once inside the human digestive tract, intestinal uptake of the ingested particles may occur. Translocation of various types of microparticulates across the mammalian gut has been demonstrated in multiple studies involving rodents (particle size 0.03 – 40 μm), rabbits (particle size 0.1 – 10 μm), dogs (particle size 3 – 100 μm) and humans (particle size 0.16 – 150 μm) (Hussain et al., 2001). To date, the M-cells (microfold cells) in the Peyer’s patches and other intestinal lymphatic tissue are considered the predominant site of uptake. Using 2μm latex microspheres in rodents, it was shown that intestinal translocation of microplastics is low (0.04 – 0.3 %) (Carr et al., 2012). However, contrasting reports exist on (i) the upper size limit of particles capable of being translocated and (ii) the magnitude of this type of transport (Hussain et al., 2001). Through the M-cells microplastics can enter the lymphatic system. This transport is governed by particle size: in rats, larger particles (5 – 10 μm) remained in Peyer’s patches, while smaller particles (< 5 μm) were transported systematically into the lymph (Eldridge, 1990).
Unfortunately, in current literature there are no data (neither in vivo nor in vitro) on the toxicity of (translocated) microplastics in humans. It is, however, likely that these particles can absorb luminal molecules to their surface and carry them into mucosal cells during translocation (Powell et al., 2010). In this way, the ingested microparticles have the potential to enhance gut infectivity or immune-stimulatory properties of the biological agents sorbed to their surface. Additional toxicity of microplastics potentially arises from the leaching of monomers, additives, and even associated POPs. In literature, several authors reported on concentrations of organic pollutants present in/on marine plastics, mainly resin pellets (Endo et al., 2005; Hirai et al., 2011; Mato et al., 2001; Mizukawa et al., 2013). There is even some evidence of uptake of these sorbed contaminants into the tissues of birds: both indirect evidence (Ryan et al., 1988; Tanaka et al., 2013) as well as experimental data (Teuten et al., 2009) support plastic-mediated transfer of contaminants
2 Chronic consumption for consumers only: intake statistics have been calculated based on individual average consumption over the total survey period, using each reporting day independently, and in summing eating occasions (EFSA, 2011).

Chapter 6
106
6
to seabirds. These studies, however, focus on larger pieces of plastics (several millimetres in size). Koelmans et al. (2013), however, demonstrated the low significance of this transport from microplastics (400 – 1300 μm in size) to the invertebrate Arenicola marina. Toxicity can also be expected from toxic monomers and additives. Monomers leaching from plastic can cause both acute and chronic effects in humans, such as cancer (e.g. vinyl chloride (Awara et al., 1998)) and neurological effects (e.g. styrene (ATSDR, 2010)). Widely used additives, such as phthalates and bisphenol A (BPA), are know endocrine disruptors and have a toxic impact on both wildlife (Oehlmann et al., 2009) and humans (Hugo et al., 2008), even at low, environmental relevant concentrations. Laboratory studies have shown the transfer of another type of widely used plastic additive: PBDEs or flame retardants. Ingestion of plastics leads to the accumulation of PBDEs in the tissues of lugworms and fish (Browne et al., 2013; Rochman et al., 2013). Furthermore, PBDEs present on ingested plastic, but not in natural prey items, were found in the adipose tissues of oceanic sea birds suggesting the transfer of plastic-derived chemicals to wildlife (Tanaka et al., 2013). As there is a growing body of literature on plastic-associated toxicants and their transfer to exposed wildlife, threats to human health through the consumption of microplastics present in seafood could become becoming apparent. A risk assessment, assessing the transfer of such contaminants to marine organisms and humans, described in detail in Chapter 8.
We now established that microplastics are present in mussels and oysters, but likely also other types of seafood may be a source of human microplastic intake. Currently, only a preliminary dietary exposure could be estimated. The hazard posed by microplastics will only become clearer with progresses in effect studies. Due to a lack in dedicated studies, a comprehensive assessment of the hazards associated with microplastics is hindered. As a result, estimations of the potential risks for human health posed by microplastics in food stuffs are not (yet) possible.

7 Microplastic ingestion in humans and associated effects

Chapter 7
108
7
ABSTRACT Microplastic ingestion by marine organisms can pose a threat to human health, as
commercially grown and captured seafood species can contain microplastics. Through the consumption of such (microplastic-) contaminated organisms, Europeans are annually exposed to thousands of microplastics. Here, we used a human intestinal cell line (Caco-2) to assess potential risks of microplastic ingestion in humans through the consumption of contaminated seafood. We exposed Caco-2 monolayers to high concentrations of 2μm microplastics (ranging from 5.7 × 10⁴ to 5.7 × 10⁷ particles.ml-1), in the absence and presence of bile salts (i.e. in the latter to mimic “natural” intestinal conditions) and measured microplastic translocation as well as their cytotoxic effects (MTT and SRB assay). While no cytotoxic effects were observed in the intestinal cells, we did observe the paracellular transport (i.e. not passing through the cells, but between the intercellular spaces). One hour after administering the particles, we observed a translocation of 0.02 to 0.16% of the particles and 0.08 to 0.52% after 24 hours. Based on the microplastic exposure of shellfish consuming Europeans (between 1,800 and 11,000 microplastics per year depending on consumption pattern), we calculated that 3 to 60 microplastics will translocate to the underlying circulatory system on an annual basis. However, we are still unable to assess the adverse effects of this translocation, as data are currently lacking in literature.

7
Microplastics ingestion in humans and associated effects
109
1. Introduction
Microplastics are ingested by numerous marine species. This has been demonstrated repeatedly in laboratory settings (e.g. Browne et al., 2008; von Moos et al., 2012; Cole et al., 2013; Watts et al., 2013a; Wright et al., 2014) as well as in field organisms (See Chapter 5 and Chapter 6). Indeed, ingestion of small microplastics (SMPs) under natural conditions (i.e. ambient concentrations) was confirmed for a wide variety of species, both vertebrate and invertebrate (Table 1): microplastics have been detected in bivalves (Mathalon and Hill, 2014; De Witte et al., 2014; Van Cauwenberghe and Janssen, 2014; Van Cauwenberghe et al., 2015; Vandermeersch et al., 2015), Crustacea (Murray et al., 2011; Goldstein et al., 2013a; Desforges et al., 2015; Devriese et al., 2015), polychaetes (Van Cauwenberghe et al., 2015, fish (Foekema et al, 2013; Lusher et al., 2013) and even mammals (Besseling et al., 2015; Lusher et al., 2015). Through their ingestion by these animals microplastics are introduced into marine food webs. Trophic transfer of microplastics has been demonstrated in both laboratory settings (Farrell and Nelson, 2013; Setälä et al., 2014; Watts et al., 2014) as well as in the field (Eriksson and Burton, 2003).
Table 1: Microplastic (MP) concentrations detected in field-collected organisms. Concentrations of microplastics detected in different marine vertebrate and invertebrate species or the fraction of individuals containing microplastics. All organisms investigated were collected from their natural environment, indicating natural exposure to ambient concentrations of microplastics.
Taxonomic group Species Microplastic load Reference
Bivalvia Mytilus edulis 0.26 – 0.35 fibres.g-1 ww 34 – 178 MPs.ind-1
0.36 ± 0.07 MPs.g-1 wwa 0.2 ± 0.3 MPs.g-1 ww
De Witte et al., 2014 Mathalon and Hill, 2014 Van Cauwenberghe and Janssen, 2014 Van Cauwenberghe et al., 2015
Crassostrea gigas 0.47 ± 0.16 MPs.g-1 wwa Van Cauwenberghe and Janssen, 2014 Crustacea Nephrops norvegicus 83% contain MPs Murray and Cowie, 2011
Lepas spp. 33.5% contain MPs Goldstein et al., 2013a Crangon crangon 0.64 ± 0.53 MPs.g-1 ww Devriese et al., 2015
Neocalanus cristatus Euphausia pacifia
0.026 ± 0.005 MPs.ind-1
0.058 ± 0.01 MPs.ind-1 Desforges et al., 2015
Polychaete Arenicola marina 1.2 ± 2.8 MPs.g-1 ww Van Cauwenberghe et al., 2015 Osteichthyes Pelagic + demersal 1.9 ± 0.1 MPs.ind-1 Lusher et al., 2013
1.2 – 5.4% contain MPs Foekema et al., 2013 Mammalia Mesoplodon mirrus 29 particles.ind-1 Lusher et al., 2015 Megaptera novaeangliae 16 particles.ind-1 Besseling et al., 2015 a microplastic concentration detected after gut depuration ww = wet weight ind = individual
Microplastics in the marine food web may pose a threat to human health through consumption of contaminated seafood. Human population growth and an increased standard of living have resulted in a continuous increase in global seafood consumption

Chapter 7
110
7
(FAO, 2014). Seafood production is currently annually increasing at a rate of 3.2% (outpacing even the world population growth rate of 1.6%) and in 2012 the annual per capita seafood consumption had grown to 19.2 kg (FAO, 2014). With increasing seafood consumption, humans are/will be increasingly exposed to microplastics taken up by marine organisms. However, not all microplastics ingested by marine biota will eventually end up in the human food chain: only those microplastics present in organs and tissues that are consumed by humans are of concern. Microplastics have for example been detected in the stomach and gut of various fish species (Foekema et al, 2013; Lusher et al., 2013), but as these organs are not (normally) consumed by humans, these plastics are not transferred to the human food chain. It is another matter for bivalves and small crustaceans (such as shrimp), which are consumed as a whole, including organs and tissues containing microplastics. Taking into consideration the concentration of microplastics detected in these organisms (Table 1) and the per capita annual consumption (crustaceans: 1.7 kg per capita; molluscs: 2.4 kg per capita) (FAO, 2012) , microplastic ingestion in humans constitutes over a 1000 microplastics per person per year.
Seafood containing microplastics constitutes a major source of marine microplastic uptake in humans. The presence of microplastics in seafood can lead to potential direct effects of marine microplastic pollution on humans. However, in current literature, there is very limited data available on in vivo or in vitro toxicity of microplastic ingestion in mammals, and by extension humans. As a result, it is difficult to assess to what extent microplastics pose a threat to food safety and human health. The use of human cell lines could provide an easy and rapid way to make an initial assessment of the effect of microplastic ingestion through the consumption of contaminated seafood.
The Caco-2 human cell line is a model of the human small intestinal mucosa. It was initially established from colorectal tumours (Fogh and Trempe, 1975). Upon differentiation, these cells express several morphological and bio-chemical characteristics of small intestinal enterocytes, indeed these cells: (i) grow in monolayer, (ii) exhibit a cylindrical polarized morphology, with microvilli on the apical side, (iii) have tight junctions between adjacent cells, and (iv) express small intestinal hydrolase enzyme activities (Sambuy et al., 2005).
In this study, the intestinal model cell line Caco-2 is used to assess potential risks of microplastic ingestion in humans through the consumption of contaminated seafood. Cytotoxic effects of exposure to microplastics are assessed, as well as the potential for translocation to underlying tissues.

7
Microplastics ingestion in humans and associated effects
111
2. Materials and Methods
2.1 Cell culture and microplastics
Caco-2 (ATCC HTB37) cells were cultivated in Dubelcco’s Modified Eagle’s Medium (DMEM) supplemented with Glutamax (Gibco), 10% foetal bovine serum (FBS, Greiner Bio-One) and 1% non-essential amino acids (Invitrogen). The cells were maintained at a temperature of 37°C in an atmosphere of 10% CO2. The culture medium was renewed every other day.
Cultivation of the cells and all experiments described in the following sections 2.2 – 2.3 were performed in the Department of Food Safety and Food Quality, Research Group of Food Chemistry and Human Nutrition (Ghent University).
Microplastics used during the assays were PS yellow/green fluorescent microspheres with a diameter of 2 μm (Fluoresbrite®, Polysciences Inc.). They were available as a sterile 2.5% aqueous suspension (5.68 × 10⁹ particles.mL-1).
2.2 Transport of microplastics
The potential transport of particles through the cell monolayer was investigated for non-differentiated and differentiated cells. Cells were cultured in 6-well TC-treated Transwell® plates (3.0 μm pore diameter, 4.67 cm2, PE membrane, Escolab), until a complete monolayer was formed. To assess the integrity and confluence of the monolayer, the transmembrane electrical resistance (TEER) was monitored by measuring the transmembrane resistance using an automated REMS TEER Analyzer (World Precision Instruments, UK). Results are expressed as Ohms.cm2 (Ω.cm2).
The transport study was carried out with cell monolayers cultured for either 7 (undifferentiated cells) or 21 days (differentiated cells). On day 7 after seeding (i.e. initiation of the culture), the culture medium was replaced with serum-free DMEM (exposure medium) in both the apical and sub-membranous compartment of the Transwell® plate. One third of the wells (i.e. 4 in total) were assigned to the control treatment (i.e. no microplastics). In another third of the wells, the exposure medium in the apical compartment (2 mL) was spiked with sterile fluorescent microspheres (2 μm diameter) to a final concentration of 5.7 ×10⁷ particles.mL-1. In the remaining wells, the apical exposure medium was spiked with microspheres (5.7 ×10⁷ particles.mL-1), bile salt extract (0.38 mg.mL-1) and palmitic acid (0.4 mg.mL-1). The addition of the bile salt extract and palmitic acid is performed to mimic intestinal conditions as these additional medium components facilitate the formation of micelles, which could incorporate the hydrophobic microplastics and facilitate transport. After a 10 minute incubation period, transport of the microplastics was assessed (see further for details).

Chapter 7
112
7
A similar procedure was used for the differentiated cells (i.e. 21 days after seeding). However, after the transport studies with the undifferentiated cells some cell toxicity was visually observed in the treatment with the bile salts and palmitic acid. Therefore, the bile salt extract concentration was reduced to 0.2 mg.mL-1 and the palmitic acid was completely omitted. Additionally, microplastic concentration was decreased to 1.4 × 10⁷ particles.mL-1. The kinetics of particle transport was assessed by studying the transport of the particles from the apical to the sub-membranous compartment after 10 min, 30 min, 1 hour, and 24 hours.
To determine the amount of microplastics transported through the Caco-2 monolayer, the medium sampled from the basolateral compartment was analysed using a BD AcurriTM C6 flow cytometer equipped with BD C-sampler software. Background signals were removed by gating off the forward and backward side scatter plots into green fluorescence plots. Results (expressed as number of beads per 100 μL of sample) were converted to total number of translocated particles by multiplying with the total volume of medium in the sub-membranous compartment.
2.3 Cytotoxicity of microplastic exposure
Cytotoxicity of microplastics was studied on differentiated cells only. These cells were cultured in a 48 well plate (TC-treated, 0.95 cm2) and incubated for 21 days to obtain a confluent monolayer and allow differentiation. After 21 days, the culture medium was replaced with exposure medium containing microplastics. A range of microplastic concentrations was tested: 0 particles.mL-1 (control), 5.7 × 10⁴
particles.mL-1, 5.7 × 10⁵ particles.mL-1, 5.7 × 10⁶ particles.mL-1 and 5.7 × 10⁷ particles.mL-1. Cells were exposed to the microplastics for 72 hours after which cell toxicity was assessed using two established cytotoxicity assays. The MTT assay (3-(4,5-dimethylthiazol-2-yl)-2,5-diphenyltetrazolium bromide) was used to measure mitochondrial activity (Mosmann, 1983), and the SRB assay (sulforhodamine B) was applied to measure the cellular protein content (Vichai and Kirtikara, 2006). In both the MTT and SRB assays, six biological replicates were used for each microplastic concentration.
Statistical analysis of the toxicity data was performed using the SAS software (SAS 9.4). We used the parametric ANOVA (significance level = 0.05), since variances within each test (i.e. MTT and SRB) were equal (Levene’s test: MTT p=0.190; SRB p=0.264).
3. Results & Discussion
Using the human Caco-2 cell line as a model for the epithelium of the small intestine, we investigated (1) the potential cytotoxic effects of microplastic exposure and (2) the transport (in vitro) of such particles through the intestinal epithelial monolayer.

7
Microplastics ingestion in humans and associated effects
113
3.1 Transport of microplastics through the epithelial monolayer
Transport of particles through the epithelial monolayer, also often referred to as translocation, was investigated in both undifferentiated and differentiated cells. Undifferentiated Caco-2 cells resemble those found in tumour tissues (since the Caco-2 cell line originates from colorectal tumours), whereas differentiated cells lose this phenotype and resemble healthy intestinal cells, i.e. enterocytes (Hauck and Stanners, 1991; Tremblay et al., 2006). Translocation of small microplastic particles (2 μm) through an undifferentiated monolayer was extremely high, even after only 10 minutes exposure. As a high concentration of fluorescent microspheres (5.7 ×10⁷ particles.mL-1, in 2 mL) was used, the transport of the microplastics from the apical to the basal compartment of the wells was visible with the naked eye. This was the case for both treatments including microplastics, i.e. those with and without the bile salt extracts.
This very obvious transport of the particles that were applied apically was not noted in the assays with differentiated cells. However, although not visible to the naked eye, transport of particles through the differentiated monolayer was measured using flow cytometry. In contrast to the undifferentiated cells, transport of microplastics was assessed at different time intervals: 10 min, 30 min, 1 hour, and 24 hours after application of the microspheres. Our results indicate that the transport of microplastics is already taking place within minutes after exposure (Figure 1). After 10 minutes, 0.02% of the particles have translocated to the sub-membranous compartment, i.e. the basal side of the cells. When bile extracts are present, this transport increases to 0.23% of the total amount of particles added apically. This transport continues as long as the cells are exposed to the particles: e.g. after 24h, 0.08 and 0.52% of the particles have translocated in the absence or presence of bile salts, respectively. No microplastics were detected in the sub-membranous compartment of the control treatment.
Transported microparticles follow a paracellular route, i.e. these particles are not absorbed by the cells apically and subsequently released basally, but move between the cells that make up the epithelial layer (Moyes et al., 2007; Carr et al., 2012). For this paracellular transport to take place the tight junctions – i.e. transmembrane proteins joining the membranes of two neighbouring epithelial cells together – need to loosen up to allow the passage of the particles. This loosening of the tight junctions can be observed as a decrease in the TEER values of the monolayer (Madara, 1998). Bile salts will increase paracellular permeability as they alter the integrity of the tight junction complexes, opening them up (Freel et al., 1983; Lin et al., 2007; Moghimipour et al, 2015; Shaikh et al., 2012). The decrease in TEER values detected in the treatment containing bile salts (Figure 2) confirms this change in the tight junctions of the exposed Caco-2 monolayer. The increased loosing of the tight junctions should in turn result in increased paracellular permeability. We indeed noted that microplastic transport was 6

Chapter 7
114
7
times higher in the treatment containing both microplastics and bile salts than in the treatment with the microplastics only.
Figure 1: Transport of microplastics through the differentiated Caco-2 monolayer. Expressed as the fraction (%) of the total number of particles administered that were observed in the sub-membranous compartment of the Transwell®. The results of the treatments are represented (no microplastics were detected in the control treatment): a treatment containing microplastics (MPs) at a concentration of 1.4 × 10⁷ microspheres. mL1, and a treatment containing the same microplastic concentration but with the addition of bile salt extracts. Measurements were made after 4 exposure periods as presented.
Figure 2: Transepithelial electrical resistance (TEER) of the Caco-2 monolayer. TEER values are represented for Caco-2 monolayers in the absence and presence of bile salts.

7
Microplastics ingestion in humans and associated effects
115
As mentioned above, differentiated and undifferentiated Caco-2 cells differ substantially in morphological and biochemical characteristics. This difference could explain why, in the undifferentiated cells, the majority of microplastics moved from the apical to basal compartment within minutes, while this transport was considerably lower in the differentiated cells. In differentiated cells, resembling epithelial cells, more tight junctions are formed than in the undifferentiated cells (Anderson et al., 2010), explaining why the microplastics move more easily through monolayers of the latter. While differentiated cells are an established model for mature villus enterocytes, undifferentiated cells can be regarded as an in vitro model for immature crypt enterocytes (van Dijk et al., 2002). This implies that in the crypts, invaginations of the small intestine around the villi, microplastic translocation would occur at a higher rate than elsewhere in the intestine.
We have to keep in mind that, while the intestinal epithelium is composed of an array of cell types, here we only tested one type of these cells. There are structures present in the intestine, consisting of cell types that were not tested here, that could contribute (additionally) to the translocation of microplastics. For example, the so-called M-cells in the Peyer’s Patches and other intestinal lymphatic tissue are considered predominant site of uptake for a wide range of microparticles. In vitro, des Rieux et al. (2005) reported about a thousand fold increase in the transport of particles (0.2 and 0.5 μm) when a gut epithelial cell line was co-cultured with cells that had been differentiated to posses M-cell like features.
3.2 Cytotoxicity of microplastic exposure
Two well-established cytotoxicity tests were performed on differentiated Caco-2 cells, exposed for three days to microplastic concentrations ranging from 0 to 5.7 × 10⁷ particles.mL-1. The MTT assay, which provides a measurement of the mitochondrial activity of the cells, did not indicate any adverse effect in the exposed cells at any of the microplastic concentrations tested (F=0.667, p=0.621) (Figure 3). Similarly, no effects, on the protein content (SRB assay) was observed (Figure 3) (F=2.661, p=0.056).
These results indicate that the exposure of enterocyte cells to microplastics will not result in cytotoxic effects in these cells. As the concentrations administered here were very high (ranging from 5.7 × 10⁴ to 5.7 × 10⁷) and the exposure duration long (72 hours), we are of the opinion to say that “under natural” circumstances enterocytes will most likely not experience any adverse effects of microplastic ingestion. It has to be mentioned however, that the particles used in these assays were small, spherical particles, i.e. particles without irregular shapes or sharp edges. Although no cytotoxicity was observed here, it could be suggested that exposure of cell monolayers to more irregularly shaped particles with sharp edges may damage these cells, resulting in a decreased viability.

Chapter 7
116
7
Santos et al. (2010) demonstrated, using irregularly shaped silica microparticles (1.2-75 μm), that cytotoxicity in Caco-2 cells is unlikely to be related to particle shape.
Figure 3: Cytotoxicity in Caco-2 cells after microplastic exposure. A. MTT and B. SRB assay results for differentiated Caco-2 cells after a three-day exposure to high microplastic concentrations. Error bars indicate the standard deviation on the mean (N=6).
3.3 Implications for human health and food safety
The results of the present study indicate there are no imminent cytotoxic effects in enterocytes as a result of microplastic exposure. Van Cauwenberghe and Janssen (2014) calculated that microplastic ingestion in humans will range between 50 to 90 microplastics per shellfish meal and leading to a total intake of 1,800 to 11,000 particles per year. While these numbers are striking, they represent only a negligible fraction of the microplastic concentrations and numbers tested here (which are several order of magnitude higher). Based on these results, we therefore do not expect any adverse effects of the ingestion of microplastics on the intestinal epithelium.
We did however, demonstrate that microplastics can move through the intestinal epithelial layer and hence translocate to underlying tissues and structures. Based on our results, we calculated that an individual would have to ingest between 200 and 600 particles for one microplastic to translocate. This was calculated using the translocation efficiencies (% translocated, Figure 1) observed in the presence of bile salts after 1 and 24h of exposure (average small intestine transit time is approximately 3 hours (Lawrence et al., 1996)). In European consumers (ingesting 1,800 to 11,000 microplastics per year (Van Cauwenberghe and Janssen, 2014)), 3 to 60 microplastics could translocate to underlying tissues on an annual basis.
As these particles move through the intestinal epithelium, they can end up in both the cardiovascular and lymphatic circulatory system (Carr et al., 2012). Especially mesenteric lymph nodes have been the focus of attention for detecting translocated particles in animals (e.g. Eldridge et al., 1990; Deitch et al., 1995; Dublineau et al., 2006), but microparticles have also been detected in the blood of exposed animals (Carr et al., 2012).

7
Microplastics ingestion in humans and associated effects
117
Unfortunately, to date, there is no data available on whether and how these particles can exert adverse effects on exposed individuals. Some authors suggest (e.g. Carr et al., 2012) that as these particles can circulate through the body (ingested microparticles have been detected in the liver of dogs (Volkheimer, 1975)) this could have deleterious effects if the ingested and translocated material is toxic.
4. Conclusions
In this study, we used the intestinal model cell line Caco-2 to assess potential risks of microplastic ingestion in humans through the consumption of contaminated seafood. While no cytotoxic effects were observed in the intestinal cells, we did observe translocation of the microplastics (2 μm). One hour after administering the particles (at very high concentrations), we observed a translocation of 0.02 to 0.16% of the particles and 0.08 to 0.52% after 24 hours. Based on the average concentration of microplastics in and the average consumption of shellfish in humans (Van Cauwenberghe and Janssen, 2014), we calculated that 3 to 60 microplastics will translocate to the underlying circulatory system on an annual basis. However, we are unable to assess possible adverse consequences of this translocation, as effect data are currently lacking in literature.


PART 3 THE RISK ASSESSMENT


8 Microplastics: an emerging contaminant of concern?

Chapter 8
122
8
ABSTRACT While it is often stated that microplastics pose a threat to the marine environment, this
has never been thoroughly assessed. Here, an attempt is made to perform an environmental risk assessment, combining exposure and effect data, for microplastics. Monitoring data on microplastic abundances are combined with a model predicting past, present and future concentrations of microplastics in the marine environment. Predicted environmental concentrations (PEC) for different marine regions range from 0.001 to over 90 microplastics per litre in the water column and 4 to 140,000 particles per kg of sediment by 2100. This is up to a 60-fold increase compared to present abundances. Assessing the (chronic) toxicity data available in literature permits the calculation of safe concentrations, i.e. concentrations below which adverse effects will most likely not occur (PNEC). For sediments these safe levels are situated around 540 particles.kg-1, while the PNEC in seawater is calculated as 640 particles.L-1. Combining the PECs and PNECs for sediments and seawater derived in the exposure and effect assessment allows for the evaluation of present and future risks of increasing microplastic abundances in these marine compartments. Risk characterisation ratios (RCRs) indicate that microplastics only constitute a minor risk for the marine environment, as the PECs do not exceed the PNECs. Heavily impacted sediments, however, are the exception. Here, even current microplastic levels are well above the safe level (PNEC), indicating a threat to sediment dwelling organisms in these areas. However, due to a lack of data in literature to date, these results should be interpreted with caution. Therefore, recommendations for future toxicity testing are made to strengthen the effect assessment and conclusively answer the question: are microplastics of concern to the marine environment?

8
Microplastics: an emerging contaminant of concern?
123
1. Introduction
Our knowledge of microplastic pollution in aquatic, and especially in marine environments has increased significantly over the past decade and started in 2004 with the publication by Thompson et al. (2004). Yet, the overall impact of this type of pollution on marine ecosystems is still largely unknown. While we already have a good picture of the distribution of microplastics in marine systems, the large variety of extraction and identification protocols used by the research community greatly hampers inter-study and inter-region comparison. Microplastic concentrations observed in different environmental compartments can vary over several orders of magnitude. However, it is unknown whether these differences are due to differences in the local or regional pollution patterns or differences in the sensitivities of applied methodologies. Additionally, effect assessments of microplastic exposure are not standardised, and very few of these are performed with the aim to establish a concentration-response relationship. For years, impacts of microplastic exposure have been investigated by administering extremely high (single dose) concentrations of microplastics to test organisms exposed under laboratory conditions. While this approach might be helpful in providing insights into potential (adverse) effects, testing at more relevant (i.e. ambient) concentrations and including different concentrations to establish a concentration range will provide more targeted answers for assessing present and future threats.
The environmental risk assessment (ERA) framework provides a clear and complete basis for addressing current data gaps, and allows assessing the risks of microplastic pollution to (marine) ecosystems and associated species. As we are currently unable to demonstrate whether microplastic contamination poses a risk to the marine environment, adopting this framework could provide more conclusive answers, and will help us classify microplastics in a more adequate and realistic manner, referring to their actual environmental threat.
In this chapter we have performed an environmental risk assessment of marine microplastic pollution using (1) data available in literature, (2) the new data presented in the previous chapters, and (3) some estimates and assumptions made where data are lacking. More specifically, we make predictions on how exposure to microplastics, both in marine sediments and the water column, will evolve in the coming century. Subsequently, an effect assessment for both environmental compartments is performed with the aim to establish the safe environmental concentration of microplastics i.e. below which adverse effects are not expected to occur. Combining the results of both exposure and effect assessments, the so-called risk characterisation is made as the final step to evaluate whether present and future microplastic abundances are harmful to marine biota/ecosystems.

Chapter 8
124
8
Additionally, we investigated the potential of microplastics to transport chemicals to, or from, biota as a function of increasing microplastic abundance. Indeed it is commonly suggested in microplastic literature that, next to the direct effects associated with microplastic exposure and microplastic uptake, another indirect effect is associated with microplastic exposure. As microplastics are hydrophobic, they sorb persistent organic pollutants (POPs) from the environment onto their plastic matrix. In this way, microplastics may become vectors of POPs to marine organisms. Additionally, during the plastic production process, a whole range of additives are added to the plastic to enhance or alter specific properties of the plastic. As these additives can leach from the plastic matrix, they as well can be transferred to organisms ingesting microplastics. Here, we also assess the threat of microplastics as vectors for both POPs and additives in a world with increasing microplastic concentrations.
The risk assessment presented here will, for the first time ever, combine exposure and toxicity data on microplastics scattered throughout literature and provide a first, albeit tentative, answer to the question: do microplastics pose a risk to marine ecosystems and human health?
2. Materials and methods
Two effects are commonly discerned when the impacts of microplastics on marine biota and systems are discussed: the direct effects of microplastic ingestion and the indirect effects associated with the chemicals present in/on microplastics. These two aspects of microplastic pollution are investigated here, starting with the risk assessment of the direct effects of microplastic exposure, followed by a bioaccumulation model to assess the indirect effects of microplastic ingestion.
2.1 Exposure Assessment
2.1.1 Calculating present and future environmental concentrations In order to assess whether or not microplastics constitute a threat to marine biota and
ecosystems, knowledge on environmental concentrations in the different marine compartments is required. Estimations of total floating (micro)plastic abundance are the only data currently available on global plastic distribution (Cozár et al., 2014; Eriksen et al., 2014). So far, no global estimates have been made for seafloor associated, nor beached, (micro)plastic litter. Therefore, the exposure assessment performed here will develop projections of current and future microplastic abundance based on global annual plastic production. Detailed records of past global plastic production are provided by PlasticsEurope (2013, 2015). Based on the detailed production data from the 1950s to 2013, projections of past, current and future microplastic abundances (predicted

8
Microplastics: an emerging contaminant of concern?
125
environmental concentration, PEC) were generated using the methodology described below.
Global plastic production is used as the basis for predicting environmental microplastic concentrations. Based on the data provided by Jambeck et al. (2015), assumptions were made on the fraction of that global plastic production that ends up in the environment (i.e. as marine litter): it was calculated that 1.7 to 4.7% of the annual plastic production becomes marine litter. Microplastics are formed through the degradation of this larger debris and it is known that this degradation only occurs under specific environmental conditions, i.e. especially in areas exposed to solar radiation (Andrady, 2015). Therefore, degradation was assumed to only impact floating and beached marine litter which together account for 30% of the total marine litter (UNEP, 2005). Subsequently, a degradation rate, ranging from 0.2 to 2.5% weight loss per year, was assumed (Artham et al., 2009; Sudhakar et al., 2007; Rutkowska et al., 2002). It has to be mentioned that this degradation rate range is based on three studies only (due to a lack in studies expression plastic degradation in weight loss). With increasing knowledge on plastic degradation in the environment, the uncertainty regarding this can be minimalised. Two scenarios were taken into consideration during exercise. First, we considered a worst-case scenario assuming ‘business-as-usual’. In this scenario, future projections of the the global plastic production were estimated assuming an annual production increase of 4.5%. This is the average annual increase of the last five years (2008 – 2013) of global plastic production (PlasticsEurope, 2015). The second scenario is our best-case scenario. Here we assumed an immediate stop in plastic loss and littering into the environment (starting in 2015), i.e. even if global plastic production would increase annually, none of this plastic ends up as marine litter. Projections of the total microplastic abundance (MPtot, in 106 tonnes) were then calculated using the following equation:
[Eq. 1]
As mentioned before, the basis of Equation 1 is the annual global plastic production
(PLprod, in 106 tonnes). Production data from 1950 to 2013 can be found in Table B1, while from 2014 onwards annual plastic production was calculated using an annual increase of 4.5% (PLprod,t-1 * 1.045). The fraction of plastic that turns into marine litter is represented by fML. Similarly, ffloat and fbeach represent the fractions of marine litter that remain floating or are beached, respectively, and are exposed to environmental

Chapter 8
126
8
weathering agents. This exposure to sun and oxygen results in degradation, which is represented by Degrad (% weight loss per year). Definitions, units, values (and their sources) of these parameters are described in Table B2.
As Equation 1 provides total microplastic abundance expressed in weight, a conversion to particle numbers is needed to calculate PECs that are readily evaluated with respect to (direct and indirect) effects to marine biota. In order to convert the total weight of microplastics to number of particles, microplastics were allocated to different size classes. The existing microplastic categories (see Chapter 1: “What are microplastics?”) small microplastics (SMPs; 1μm – 1 mm) and large microplastics (LMPs; 1 – 5 mm) was extended to comprise three size classes: LR-SMPs (lower range SMPs, 1 – 300 μm), UR-SMPs (upper range SMPs, 0.3 – 1mm) and the LMPs. These categories are based on commonly reported upper and lower size limits of microplastics, often influenced by sampling and extraction techniques (as discussed in Chapter 1: “What are microplastics?”). These three size classes will be used throughout the exposure and effect assessment. Per class, an average particle size was assumed: LR-SMPs 150μm, UR-SMPs 650 μm and LMPs 1500 μm. Assuming an average plastic density of 1.1 g.cm3 (calculated as the average of the densities of PVC, PE, PS, PP and nylon), the weighted average weight of one microplastic particle was calculated. Each size class was – based on literature – assumed to represent a different fraction of the total microplastic abundance: 10% of microplastics are LMPs, 25% are UR-SMPs, and the remaining 65% are LR-SMPs (Desforges et al., 2014; Nor et al., 2014; Song et al., 2014). We also assumed that these size fractions remained constant over time, and hence did not change as a result of changing degradation rates for increasingly smaller plastic particles. Because of the large differences in size between these three microplastic size classes, LMPs represent the most important fraction with regard to size: it can be calculated LMPs represent 82.6% of all microplastic weight. UR-SMPs represent 16.8% of microplastic weight, and, due to their small size, LR-SMPs represent only 0.5%.
Since microplastics are not distributed homogenously throughout the marine environment, PECs were calculated for two regions, i.e. coastal waters and the open ocean. For both regions, the highest and lowest microplastic concentration reported (for both the pelagic and benthic compartment) was retrieved from literature (Table B3). A correction factor was calculated by dividing these reported abundances by the predicted total microplastic abundance (MPtot,t). Future PECs for both the pelagic and benthic compartments, in both coastal and oceanic regions, were then calculated as the product of this correction factor and MPtot,t.
2.1.2 Accumulation in biota Accumulation in lower trophic organisms such as filter feeding bivalves and
zooplankton crustaceans, and deposit feeding lugworms was assessed. A similar exercise

8
Microplastics: an emerging contaminant of concern?
127
was made for the Atlantic cod. Future microplastic loads in these species were estimated by calculating an “accumulation factor” per species. This factor was obtained by dividing microplastic body burden as reported in literature (Table 1) by the prevailing PECs (pelagic or benthic depending on the species). Future microplastic body burdens were then calculated as the product of this accumulation factor and the future PECs. These accumulation factors should be considered a constant for each species. As the accumulation factor is dependent on species-specific characteristics, such as feeding mechanism (selective vs non-selective feeding), ingestion and egestion efficiency, internal conditions that will enhance retention of particles (e.g. smooth vs rugged gastrointestinal tract), it can be argued that the accumulation factor will not change over time.
As microplastic body burden for the zooplankton crustaceans and the fish were reported in particles per individual (Table 1), we assumed an average zooplankton weight of 0.07g (Desforges et al., 2015) and an average body weight of 3312g for the cod (Koelmans et al., 2014).
Table 1: Microplastic body burden detected in organisms exposed to ambient concentrations of microplastics, i.e. organisms that were collected from natural systems. These organisms represent different taxonomic groups, displaying different feeding strategies and representing different trophic levels. Body burdens are either expressed in particles per g wet weight (ww) or particles per individual.
Taxonomic group
Species Body burden Source
Bivalves Mytilus edulis 0.36 particles.g-1 ww Van Cauwenberghe and Janssen, 2014 Crassostrea gigas 0.47 particles.g-1 ww Van Cauwenberghe and Janssen, 2014 Polychaetes Arenicola marina 1.20 particles.g-1 ww Van Cauwenberghe et al., 2015 Crustacea Euphausia pacifica 0.03 particles.ind-1 Desforges et al., 2015 Neocalanus cristatus 0.06 particles.ind-1 Desforges et al., 2015 Osteichthyes Gadus morhua 0.13 particles.ind-1 Foekema et al., 2013
From this accumulation in lower level organisms (as discussed in the previous section), ingestion in predatory fish and humans was assessed. Trophic transfer in juvenile salmon predating on zooplankton and humans feeding on bivalves was assessed by taking into account the annual biomass intake of the prey species. For juvenile salmon, a daily uptake of 1480 individual zooplankton, i.e. to 3% of the fish body weight, was assumed (Desforges et al., 2015). For humans, three scenarios were considered: one for the average “world” individual assuming an annual intake of 2.4 kg shellfish per year (FAO, 2012), one for European top consumers (26.3 kg per year (EFSA, 2011)) and the final one for minimal European consumers (4.3 kg per year (EFSA, 201)).

Chapter 8
128
8
2.2 Effects assessment
For the effect assessment of direct effects associated with microplastic exposure and uptake, literature data on toxicity tests for both seawater and sediment were collected. From these, chronic no observed effect concentration (NOEC) and chronic lowest observed effect concentration (LOEC) were derived. If several chronic NOEC or LOEC values for different toxicological endpoints were available for a single species, the lowest value was selected. LOEC values were converted to NOEC values by dividing them by 2 (OECD, 1995). The species sensitivity distribution (SSD) of these chronic NOEC values was constructed using a log-normal model (Aldenberg and Jaworska, 2000; Aldenberg and Luttik, 2002) and with the ETX 2.1 software (van Vlaardingen et al., 2004). Goodness-of-fit tests include both the Anderson-Darling and Kolmogorov-Smirnov test for normality. The HC5 (hazardous concentration for 5% of the species) was derived from this SSD according to the method described by Aldenberg and Jaworska (2000). From this HC5, a predicted no effect concentration (PNEC) was derived by applying an assessment factor (AF) of 1-5 to the HC5 (EU-TGD, 2003).
2.3 Risk characterisation
The final step in an environmental risk assessment is the risk characterisation. Here, a risk characterisation ratio (RCR; Equation 2) is calculated as the ratio of the predicted environmental concentration (PEC) and the predicted no effect concentration (PNEC). RCRs were calculated for coastal and open ocean regions, for both seawater and sediment.
[Eq. 2]
2.4 Modelling transport of chemicals from microplastics to biota
Transport of chemicals present on/in microplastics, i.e. pollutants taken up from the environment (POPs) and additives added during the plastic production process, to marine organisms ingesting these plastics was modelled. The model described here is based on the bioaccumulation developed by Koelmans et al. (2013, 2014) and can be described as a traditional mass balance of uptake and loss processes, to which an additional term, quantifying the exchange with plastic, is added (Koelmans et al., 2013, 2014):
[Eq. 3]
In short, Equation 3 quantifies dermal uptake from water (term 1), uptake from
ingested food and exchange with ingested microplastics (term 2), and loss through

8
Microplastics: an emerging contaminant of concern?
129
elimination, egestion and growth dilution (term 3). The definition and units of model parameters are described in Table 2. While term 1 and 3 are parameterised according to the traditional bioaccumulation approach, term 2 (uptake through ingestion) is expanded to include a plastic component. In this second term, IRt represents the total mass of particles (i.e. both food and plastic) ingested per unit of time (g.g-1.d-1), while Sfood (-) and SPL (-) represent the mass fractions of the ingested food and plastic, respectively (Sfood + SPL = 1). The product afood × Cfood quantifies the concentration of contaminant or additive transferred from the food to the organism after ingestion (μg.g-1). The concentration exchanged after the ingestion of plastic is represented by a novel term: CPLR,t (μg.g-1). A detailed derivation for this parameter can be found in Koelmans et al. (2013, 2014). For this bioaccumulation model, a steady state body burden for an exposed organism can be calculated as follows (Koelmans et al., 2013, 2014):
[Eq. 4]
in which
[Eq. 5]
In Equation 4 and Equation 5, k1 and k2 are first order plastic-to-lipid and lipid-to-plastic rate constants (d-1), MPL and ML are the masses of plastic and lipid in the organism (g), and CPL is the concentration of the chemical in the plastic at time of ingestion (μg.g-
1). GRTt is the gut retention time (d) at time t, but is assumed to be constant over time (Koelmans et al., 2014). This steady state concentration hence reflects the balance between uptake (numerator) consisting of dermal uptake (kderm × CW), uptake through food (IR × Sfood × afood × Cfood) and uptake through ingested plastic (IR × SPL × k1 × CPL × APL), and loss (denominator) consisting of loss through elimination, egestion and dilution (kloss) and “cleaning” by plastic ((IR × SPL × k2 × APL) / flip).
When indirect chemical effects of microplastic pollution are discussed, two types of chemicals are discerned (Teuten et al., 2009; Cole et al., 2011; Browne et al., 2013). On the one hand there are plastic-associated contaminants that sorb to the plastic surface from the surrounding (contaminated) environment. Typically, this type of contaminants are hydrophobic POPs, e.g. PCBs, PAHs, and pesticides such as DDT (e.g. Bakir et al., 2012, 2014). On the other hand, plastic-specific chemicals, i.e. additives added during the plastic production process, are also considered. These chemicals, e.g. phthalates, bisphenol A and flame retardants, leach from the plastic to the surrounding environment, including biota. Therefore, the bioaccumulation model was applied to two model

Chapter 8
130
8
chemicals selected for each group. For the plastic-associated chemicals, the POP dichlorodiphenyldichloroethylene (DDE), a breakdown product of the pesticide DDT, was selected, while for the plastic-specific contaminants bisphenol A (BPA), a common additive used in the production of polycarbonate plastics, was selected. All scenarios considered here use realistic concentrations of both contaminants, measured on marine plastics (Mato et al., 2001; Teuten et al., 2009) and in seawater (JRC, 2010; Mato et al., 2001). These concentrations, i.e. CPL and CW, are listed in Table B5.
Table 2: Parameter symbols and units. Default values, sources of default values and calculations can be found in Table B5.
Parameter Unit
afood Absorption efficiency from food (-) CB
SS Concentration in biota at steady state (μg.g-1 DW) CB,t Concentration in biota at time t (μg.g-1 DW) Cfood Concentration in food (μg.g-1) CPL Concentration on plastic at time of ingestion (μg.g-1) CPLR,t Concentration transferred from plastic to the organism during gut passage (μg.g-1) CW Concentration in seawater (μg.L-1) flip Lipid fraction of biota (-) GRT Gut retention time (d) IR Ingestion rate (g.g-1 DW d-1) k1 Apparent first order rate constant for plastic-to-lipid transport (d-1) k2 Apparent first order rate constant for lipid-to-plastic transport (d-1) kderm Rate constant for uptake from water (L.g-1 DW d-1) kloss Loss rate constant (g.g-1 DW d-1) ML Mass of lipids in organism (g DW) MPL Mass of microplastics in organism (g) Sfood Mass fraction of food ingested (-) SPL Mass fraction of microplastic ingested (-)
The scenarios studied covered bioaccumulation of DDE and BPA in an environment with increasing microplastic abundance, as described in Section 2.1 (“Predicting future environmental concentrations”). We assumed that, due to the large excess of water and sediment compared to plastic in open systems, environmental concentrations of the chemicals remained constant over time (Gouin et al., 2011).
Using the bioaccumulation model described in Equation 4 (and the lipid content of the species of interest), steady state lipid normalized body burden was calculated for three representative marine species: the mussel Mytilus edulis, the lugworm Arenicola marina and the Atlantic cod Gadus morhua. The mussel and lugworm represent lower trophic level organisms, exposed to the increasing microplastic concentrations in seawater and sediment, respectively. Cod, on the other hand was selected as a next trophic level organism, and assumed to be feeding on mussel. The biological parameters for each of the three species, and the chemical properties of the plastic (polyethylene) and chemicals

8
Microplastics: an emerging contaminant of concern?
131
under investigation (i.e. DDE and BPA) were obtained from literature and are listed in Table B5.
3 Results and discussion
Two aspects of microplastic pollution, i.e. direct effects of ingestion and indirect effects associated with the chemical burden of microplastics, was assessed. In order to perform such risk assessment for past, future and present microplastic abundances, predictions were made, based on available and assumptions. An overview of the formulas and models, applied in the different elements of the risk assessment, can be found in Figure 1.
3.1 Exposure assessment
3.1.1 Predicted environmental concentrations While we have known for quite some time now that microplastics are present in the marine environment (Thompson et al., 2014), it was not until recently that the first global estimations for current microplastic abundances afloat in the world’s seas and oceans have been published (Cozár et al., 2014; Eriksen et al., 2014). However, as these estimations rely on the modelling of observational data, the reported abundances are limited to larger microplastics, i.e. those easily sampled at sea. Eriksen et al. (2015) reported for the period 2007 – 2013 a total microplastic weight of 3.55 × 10⁴ tonnes floating on the world’s seas and oceans. For 2010, our simulations (minima) predict a total microplastic weight (in both scenarios) of 0.87 × 10⁶ tonnes (Figure 1), which are two orders of magnitude higher. However, while our simulations yield a total microplastic weight for the entire marine environment and the entire size range of microplastics (1 μm to 5 mm), the predictions of Eriksen et al. (2015) only consider floating microplastics, ranging in size from 300 μm to 5 mm. If we assume that, similar to large sized marine litter, only 15% of all microplastics float, i.e. are at the sea surface (UNEP, 2005), and the size range 0.3 – 5 mm represents 99.5% of all microplastic weight, a total weight of 1.29 × 10⁵ tonnes is calculated under these assumptions. Hence, our minima in both scenarios projections appear to be only an order of magnitude higher than those reported and predicted by Eriksen et al. (2015). This indicates that our minimum appears to be a very good representation of the environmental abundances.
This, however, could also be perceived as an indication that we are missing most of the plastics during such sea surface surveys. Indeed, a recent study concluded that we are missing 99% of plastic that we predict is present in the environment (Cozár et al., 2014). Plastics are disappearing into sinks that might not be as easily monitored as the sea surface. Several sinks for marine plastics have been proposed. Observations of the size distribution of floating plastic debris points to the removal of floating plastic through fast

Chapter 8
132
8
fragmentation of the microplastic into very small particles (even naoplastsics) that are too small to routinely monitor. A proposed second sink is the incorporation of microplastics in the seafloor. Density altering processes such as biofouling will increase the density of the otherwise positively buoyant plastic and result in the sediment of these particles. Ingestion by marine organisms was also proposed by Cozár et al. (2014) as an important sink of marine plastic litter. The majority of plastics observed in the marine environment are in the same size interval as that of zooplankton, and it is known that (accidental) ingestion of plastics occur in a wide range of marine organisms (see Chapter 1, Section 4.3.1 for a review). Apart from these three sinks, there will still be other processes and sinks that have not been elucidated yet (Cozár et al., 2014).
Similar simulation results were obtained for the total number of microplastics (Figure B1). Our minima in 2010 for both scenarios for floating (15%) UR-SMPs and LMPs (35%) overestimate the total number of particles predicted by Eriksen et al. (2015) with only one order of magnitude (2.91 × 10¹³ particles vs. 4.85 × 10¹² particles).
According to our simulations, total microplastic abundance will increase 6 - 60-fold by 2100 compared to 2015 levels depending on the scenario. By the end of the century, the average microplastic weigth ranges from 75 (best-case) to 800 (worst-case) ×106 tonnes (Figure 1). This steep increase in microplastic weight is also reflected in the predicted environmental concentration (PEC; Figure 2). Based on literature and the therein reported concentration ranges (Table B3), upper and lower concentration boundaries for coastal and oceanic regions were calculated. Coastal microplastic concentrations in seawater (PECseawater) are higher than those in the open ocean (Figure 2A – B). In the both scenarios, simulated PECs for 2015 range from 4.7 × 10⁻⁴ to 2.1 particles.L-1 in coastal waters and 1.3 × 10⁻⁴ to 0.3 particles.L-1 in the open ocean. By 2100, in the best-case scenario, these PECseawater in coastal waters has increased to a range of 2.7 × 10⁻³ – 11.9 particles.L-1, and 7.5 × 10⁻⁴ to 2.0 particles.L-1 in the open ocean. In the business-as-usual scenario (i.e. the worst-case scenario) microplastic concentrations in coastal waters in 2100 range from 0.03 to 129.4 particles.L-1. Under these conditions, open ocean microplastics abundances are expected to reach concentrations ranging from 0.01 to 21.1 particles.L-1. Predicted environmental concentrations in coastal and oceanic (deep sea) sediments (PECbenthic) exhibit a similar pattern: microplastic concentrations are one to two orders of magnitude higher in coastal sediments (9.5 to 3.5 × 10³ particles.kg-1) compared to deep sea sediments (0.7 to 15.7 particles.kg-1) (Figure 2C – D). This trend persists with time and by 2100, our worst-case scenario predictions yield minimal concentrations of 597 particles.kg-1 and maximum concentrations of 2.2 × 10⁵ particles.kg-1 in coastal sediments (best-case: 55.1 – 2.1 × 10⁴ particles.kg-1), while deep sea sediment abundances range from 40.5 to 987.2 particles.kg-1 in the worst case scenario (best-case: 3.7 – 91.1 particles.kg-1).

133
Microplastics: emerging contaminants of concern?
8
M
arin
e lit
ter p
rodu
ctio
n (M
L pro
d)
T
otal
mic
ropl
astic
s (M
P tot
,t)
Ben
thic
mic
ropl
astic
s (M
P ben
thic)
Acc
umul
atio
n in
bio
ta (M
P bod
y bu
rden
)
Tra
nsfe
r of c
hem
ical
s (C
BSS)
Hum
an c
onsu
mpt
ion
(Inhu
man
)
Figu
re 1
: Ove
rvie
w of
the
form
ulas
and
par
amet
ers u
sed
for t
he ri
sk a
sses
smen
t of b
oth
dire
ct a
nd in
dire
ct e
ffect
s of m
icro
plas
tics.

Chapter 8
134
8
The upper and lower concentration ranges of both scenarios’ can actually be considered as the environmental concentrations in pristine and heavily polluted systems and areas. For instance, extremely high concentrations are predicted in coastal sediments under the worst case scenario (1.5 × 10⁵ particles.kg-1 by 2100), since the literature data on which these simulations were based (Table B3) were collected in an industrial harbour, near a polyethylene production plant (Norén, 2007). As a result, the upper-range PECs predicted here (Figure 2 upper red and green lines) are not representative for ‘natural’ systems, but rather highly impacted systems.
We believe that, from a risk assessment point of view, it is important to make sure microplastic concentrations are expressed in total number of particles rather than total weigth of microplastics. Direct and even indirect effects of microplastic will be dependent on the number of encounters an organism has with these particles (e.g. through ingestion).
Figure 1: Past and future projections of global microplastic abundance (in 106 tonnes) in the marine environment. A. Total microplastic weigth; B. Floating microplastics; C. Microplastics in sediments. Dotted lines represent the minima (lower) and maxima (upper), while the solid line represents an average situation (see Table B2). Historic microplastic abundances (pre-2013) are represented in grey, while future abundances (2013 – 2100) in the best-case-scenario are in green and worst-case-scenario in red.

8
8
Microplastics: an emerging contaminant of concern?
135
3.1.2 Accumulation in biota Increasing environmental concentrations of microplastics will result in an increasing
bioavailability of these microplastics to marine biota: a higher abundance will indeed lead to an increased probability of organisms encountering and subsequently interacting with (and possibly ingesting) microplastics. It is well established that, due to their small sizes, microplastics are available for ingestion by a wide array of marine biota, especially lower trophic organisms. While microplastic ingestion was already demonstrated in laboratory experiments dating back to the onset of microplastic research (Thompson et al., 2004; Browne et al., 2008), it was not until recently that the accumulation in biota exposed to ambient concentrations, i.e. organisms collected from natural systems, was demonstrated (e.g. Murray and Cowie, 2011; De Witte et al., 2014; Mathalon et al., 2014; Van Cauwenberghe and Janssen, 2014).
Figure 2: Predicted environmental concentration (PEC) for the pelagic and benthic compartmentment,predicted from 2100 to 2100. PECpelagic (microplastics.L-1) is provided for A. coastal waters and B. the open ocean. PECbenthic (microplastics.kg-1 ww) is provided for C. coastal areas and D. oceanic areas. Worst-case scenarios are represented in red, while best-case scenarios are represented in green.
Here, we calculated an “accumulation factor” (see Section 2.1.2) per species under investigation to predict future microplastic body burdens, based on the PEC. Future trends in accumulation were assessed for four taxonomic groups: polychaetes representing benthic biota, bivalves and zooplankton crustaceans representing pelagic filter feeders, and predatory fish. Anno 2015, fish show the lowest microplastic body burden, 0.00005

Chapter 8
136
8
particles.g-1 tissue (ww). A. marina, the only representative for benthic biota, exhibits the highest microplastic body burden (1.46 particles.g-1 tissue). Bivalves and zooplankton crustaceans contain respectively 0.47 and 0.77 microplastics.g-1 tissue (ww). As bioaccumulation was linked with the predicted environmental concentrations by calculating an accumulation factor, the increasing trend in the PEC (see Section 3.1.1) is reflected in the bioaccumulation predictions for 2100. Within a century, microplastic body burdens in these marine biota will have increased to 0.003 particles per gram in cod to almost 100 particles.g-1 in A. marina under the worst-case scenario (Figure 3A).
The evolution of trophic transfer was assessed for two top predators: (juvenile) salmon as a predator of zooplankton crustaceans, and man as a top predator of bivalves. The choice for bivalves as prey species for humans instead of fish was made because of the following considerations. While microplastics have been detected repeatedly in a wide array of fish species (e.g. Boerger et al., 2010; Choy and Drazen, 2013; Foekema et al., 2013; Lusher et al., 2013), the presence of microplastics in the tissue of the fish itself was never confirmed. Indeed, it is always observed in the gastro-intestinal system: a part of the fish that is not consumed by humans. Bivalves on the other hand, are consumed as a whole and contain quite high levels of microplastics (Table 2). As such they constitute an important source of microplastics to humans.
With time, there is an increase in the number of microplastics taken up by both salmon and humans as a result of an increasing accumulation in the prey species, which in turn is related to the increasing environmental concentrations (Figure 3B). Currently (i.e. anno 2015), juvenile salmon ingest over 1,200 microplastics per year through the consumption of contaminated zooplankton. By 2100, ingestion through trophic transfer will have increased in these fish to almost 80,000 microplastics per year in the worst-case scenario and 7,300 in the best-case scenario (Figure 3B).
The average person currently ingests around 1,100 microplastics per year as a result of the consumption of shellfish (Figure 3B). Europeans, being avid consumers of shellfish, ingest 2,000 to 12,000 microplastics per year, depending on their consumption pattern (Figure 3B). The increased accumulation of microplastics in bivalves by 2100 (Figure 3A) will consequently result in an increased intake by humans: i.e. an ‘average’ person will ingest 6.5 × 10³ to 7.1 × 10⁴ microplastics per year, while the consumption of Europeans will increase to 1.1 × 10⁴ - 1.3 × 10⁵ particles.y-1 for minor and almost 7.1 × 10⁴ - 7.8 × 10⁵ particles.y-1 for top consumers (Figure 3B).
3.2 Effect assessment
3.2.1 Effects of bioaccumulation We predicted that by 2100, juvenile salmon will ingest 7,300 to almost 80,000
microplastics per year, depending on the scenario. While we were able to calculate for

8
8
Microplastics: an emerging contaminant of concern?
137
Figure 3: Accumulation of microplastics in low and high trophic level organisms, as a result of the increasing environmental concentrations of microplastics compared between 2015 and 2100. A.Accumulation (in particles.g-1 ww) in low trophic level invertebrates and in a high trophic level fish species (Gadus morhua); B. Trophic transfer (particles.y-1) in high trophic level vertebrate predator species: (juvenile) salmon as a predator of copepods and humans as predators of bivalves. For humans three scenarios were assessed: the average “world” individual (World), European top consumers (EU max) and European minor consumers (EU min).Green bars indicate the accumulation under the average best-case scenario, while red bars indicate accumulation under the average worst-case scenario.

Chapter 8
138
8
bivalves, zooplankton and lugworms how much of these microplastics would accumulate in the organisms based on literature data, these data are lacking for fish. While microplastics have been detected repeatedly in a wide array of fish species (e.g. Boerger et al., 2010; Choy and Drazen, 2013; Foekema et al., 2013; Lusher et al., 2013), only microplastics present in the gastro-intestinal tract were assessed and no calculations of retention efficiency for these species were performed. So, while we can predict that the juvenile salmon will ingest 7,300 to 80,000 particles per year by 2100, we cannot make any predictions of the fraction of particles that will get lodged within the gastro-intestinal tract or even translocate to the tissues.
Additionally, due to a lack in toxicity data for fish, the impact of the increasing ingestion of microplastics as a result an increasing accumulation in prey species is hard to assess. Rochman et al. (2014) noticed an altered gene expression in female fish (Oryzias latipes) presented with a polyethylene-contaminated diet. A significant down-regulation of the choriogenin H gene, involved in the formation of egg yolk, was observed for a diet containing 10% plastic by weight (Rochman et al., 2014). For the juvenile salmon in this assessment (0.16 kg bodyweight, with a daily food uptake of 3% of its bodyweight (Desforges et al., 2015)), the current (i.e. anno 2015) microplastic ingestion rate of 1,200 microplastic per year constitutes a diet of only 0.001% plastic by weight (microplastic with average diameter of 150μm, and an average density of 1.1 g.cm-3). By 2100, the salmon’s diet in a worst-case scenario will consist of only 0.07% plastic by weight, indicating no imminent risk for these fish of the increased microplastic abundance.
The results presented in Chapter 7 (“Microplastic ingestion in humans and associated effects”) provide us with some data to assess the risks posed by microplastic ingestion to human health. We estimated that currently Europeans consuming bivalves will ingest from 2,000 to 12,000 microplastics per year (depending on the consumption pattern), and that this ingestion rate will increase to 130,000 and almost 780,000 particles per year by 2100 under worst-case conditions. The majority of particles, however, will pass through the gastro-intestinal tract without being retained. Only 0.08 to 0.52% of the ingested particles will translocate i.e. move through the intestinal epithelium to underlying tissues. This corresponds to a total of translocated particles per year ranging between 2 to 60 in 2015 and 100 to 4,000 in 2100 (worst-case scenario).
As these particles move through the intestinal epithelium, they can end up in both the cardiovascular and lymphatic circulatory system (Carr et al., 2012). Unfortunately, to date, there is no data available on whether and how such translocated particles can exert adverse effects on exposed individuals. We can, however, conclude that the consumption of microplastic contaminated seafood will not cause any adverse to the intestinal

8
8
Microplastics: an emerging contaminant of concern?
139
epithelial cells. In Chapter 7 (“Microplastic ingestion in humans and associated effects”) we demonstrated that direct exposure of such intestinal cells to high concentrations of microplastics (up to 107 particles.mL-1) will not result in any significant cytotoxic effects.
3.2.2 Effects assessment of direct effects Toxicity data, i.e. NOECs and LOECs, for marine species exposed to microplastics in
seawater and sediments are summarised in Table B4. While we are aware that this type of data is under debate for use in ecotoxicology and risk assessment (Chapman et al., 1996; Warne and van Dam, 2008), the microplastic toxicity data available in literature is of such nature that only these hypothesis-based rather than the preferred point estimate data (i.e. ECX and LCX) can be derived.
Sediment toxicity data are highly underrepresented in literature, and as a result a species sensitivity distribution (SSD) could only be constructed for the seawater toxicity data (Figure 4). The normal distribution was fitted to the log-transformed toxicity data, as this distribution was accepted at the 5% significance level for both the Anderson-Darling (AD = 0.632) and Kolmogorov-Smirnov (KS = 0.755) test for normality. Using the method of Aldenberg and Jaworska (2000), an HC5 of 3214 particles.L-1 (90% confidence interval: 3.3900 - 84261) was calculated. Subsequently, an AF of 5 was applied to the HC5. EU-TGD (2003) allows the use of an AF of 1 – 5 in the derivation of a PNEC when the SSD method is applied. Which AF should be used is determined on a case-to-case basis, and should reflect the uncertainties associated with the derivation of the HC5 (EU-TGD, 2003). Here, the quality and quantity of the toxicity data collected for microplastics (exposure through seawater, Table B4) can be considered as “low”. Indeed, toxicity from only a limited number of taxonomic groups representing a few feeding strategies and trophic levels are incorporated in the SSD. Especially data for species representing higher trophic levels, e.g. fish, are missing. Additionally, almost all of the toxicity data were collected using non-standard test methods. Therefore, the PNECpelagic was calculated by applying the highest AF to the HC5, i.e. 5, resulting in a predicted no effect concentration of 640 particles.L-1 (Table 2).
It has to be mentioned that the EU-TGD (2003) was developed for the risk assessment of chemical contaminants and stressors. Microplastics are not a chemical type of pollution but rather a non-chemical, particulate type of pollution. However, due to the complete lack in guidelines for performing an environmental risk assessment for particulate material/pollution, we opted, as an initial approach, to follow the EU-TGD (2003) guidelines for chemical stressors.

Chapter 8
140
8
Figure 4: Species sensitivity distribution (SSD) for pelagic microplastics (in particles.L-1). Labels indicate the species and the log-normal distribution is fitted. The derivation of the HC5 is indicated in red.
Microplastic toxicity data for benthic organisms were available for one species only: Arenicola marina (Table B4), hence no SSD could be constructed. Therefore, the PNEC was derived by applying an AF to the NOEC of the most sensitive endpoint (Arenicola marina: metabolic rate, 5.4 × 10⁵ particles.kg-1). EU-TGD (2003) provides a set of AFs, ranging from 10 to 1000, depending on the type and number of toxicity data available. Since only one long-term end point was available, EU-TGD (2003) recommends the use of an AF of 1000. As a result, a PNEC for marine sediments (PNECbenthic) of 540 particles.kg-1 ww is derived (Table 2).
Table 2: Overview of the predicted no effect concentrations (PNEC) for the pelagic and benthic compartment.. Compartment PNEC
Pelagic 640 particles.L-1 Benthic 540 particles.kg-1 ww
3.3 Risk characterisation of direct effects
In the risk characterisation, PECs determined in the exposure assessment and PNECs determined in the effect assessment are combined into a risk characterisation ratio (RCR) (Equation 2) to assess overall risk to the environment. When this RCR is < 1 no immediate concern (risk) for the environment is assumed, as environmental concentrations are lower than the concentration below which adverse effects will most likely not occur (i.e. the PNEC). Increasing environmental concentrations will

8
8
Microplastics: an emerging contaminant of concern?
141
subsequently result in the increase of the RCR. A RCR > 1 indicates that environmental concentrations are exceeding the safe concentration defined by the PNEC and it is concluded that a risk to the environment cannot be excluded.
Risk characterisation ratios were derived for seawater and sediment in two marine regions, based on the best- and worst-case PECs predicted for the period from 2000 – 2100 and the PNECs derived for these compartments. For the pelagic compartment, there appears to be no eminent threat of microplastic pollution in the foreseeable future (2000 – 2100), both in the best- and worst-case scenario (Figure 5A – B). Microplastic concentrations in open ocean waters and even in the more highly polluted coastal waters will not exceed the PNEC of 640 particles.L-1 limit (Table 2).
Risks for benthic compartment appear to be higher. Particularly, in highly polluted coastal sediments there seems to be a risk presenting (Figure 5C – D). In 2000, sediments concentrations in these highly polluted areas (e.g. industrial harbours) are predicted to be 2 times higher than the PNEC of 540 particles.kg-1 (Table 2). It can therefore be stated that benthic, sediment-associated organisms, such as the lugworm, living in these environments will experience the adverse effects associated with microplastic exposure. Although benthic organisms in coastal sediments in more pristine and less polluted regions are currently not at risk but might be by 2100 according to our predictions, as the worst-case scenario RCRs do approach the value of 1. RCRs derived for deep-sea sediments do not indicate risks to this environment at this moment in time. However, for the maximal concentrations in the worst-case scenario, environmental concentrations of microplastics will reach the PNEC level by 2086, indicating that, if environmental abundances continue to increase at the rate predicted, deep sea ecosystems might be at risk by the end of this century.
The RCR trends predicted and discussed here suggest there might be future risk associated with the expected increasing microplastic pollution. Especially sediments appear to be vulnerable. This should be of no surprise as it has been suggested repeatedly that sediments act as long-term sinks of microplastics (Cozár et al., 2014; Law et al., 2010; Morét-Ferguson et al., 2010). While plastics such as PVC and PET will sink as a result of their high density (>1.02 g cm3), density modification through biofouling or aggregation with organic material can result in the incorporation of even low-density plastics into sediments (Andrady, 2011; Long et al., 2015; Reisser et al., 2013; Zettler et al., 2013). These processes that increase the transport of microplastics to the seafloor are responsible for the higher abundance of microplastics detected in sediments compared to those in the water column (Figure 2).

Chapter 8
142
8
Figure 5: Evolution of the risk characterisation ratios (RCR) for pelagic and benthic compartments, from 2000 to 2100. A. Coastal region; B. Open ocean; C. Coastal areas; D. Deep sea sediments. Dark redlines represent the RCR in the worst-case scenario, while green lines represent the best case scenarios. The bright red line indicates the critical RCR level of 1: an RCR < 1 indicates no immediate concern for the environment, while a risk to the environment is present when the RCR > 1.
Sediment dwelling organisms inhabiting benthic habitats and their ecosystems should hence be the primary focus of attention when assessing environmental risks of microplastics. Yet, it is exactly for this group of species that adequate toxicity data are lacking. As previously discussed (Section 3.2.2), the PNECsediment was derived using a single toxicity test endpoint of a single species (Arenicola marina). Efforts should be made to expand our knowledge on adverse effects of microplastics on benthic biota. This should be done by performing standard toxicity test, including a (relevant) range of microplastic concentrations, on a wide array of species. These should include species representative for different feeding strategies and different trophic levels. Only by including more qualitative data in the risk assessment of microplastics will allow us to refine the PNECs and make more conclusive statements on the risks associated with increasing environmental microplastic abundances.
Although sediments appear to be of primary concern, the risks to biota inhabiting the pelagic compartment need to be characterised more thoroughly. The RCRs calculated for seawater are based on a PNEC derived from a rather small toxicity dataset. Therefore, PNEC values, although corrected using the largest AF, should be interpreted with care. In

8
8
Microplastics: an emerging contaminant of concern?
143
order to adequately assess the risks of microplastic pollution in this compartment, more standardised toxicity tests, including a wide range of organisms representing different feeding strategies and trophic levels, should be performed. Only then will we be able to more conclusively interpret risks for the marine environment.
3.4 Transport of chemicals
3.4.1 Transport from plastic to organisms In literature, the potential for microplastics to transport chemicals to the tissue of
organisms is often considered an important adverse effect associated with microplastic ingestion (Rochman et al.; 2012; Teuten et al., 2007; Teuten et al., 2009). Here, the biodynamic model developed by Koelmans et al., (2013a, 2013b, 2014) was applied to investigate the influence of increasing microplastics abundances on the bioaccumulation of POPs and additives in three different marine species: two lower trophic level invertebrate species, the mussel Mytilus edulis and the lugworm Arenicola marina, and the predatory, thus higher trophic level, Atlantic cod Gadus morhua.
The evolution of POP bioaccumulation was investigated for the model contaminant DDE, a degradation product of the, now banned, pesticide DDT. Although a worldwide ban was formalised by the Stockholm Convention (with still some limited use as disease control vector), DDT and DDE are still being measured in the environment, including plastic (Mato et al., 2001; Ogata et al., 2009; Zurcher et al., 2009). These simulations were performed for both the best- and worst-case scenario of microplastic occurrence in the marine environment. Simulating the bioaccumulation of DDE resulted in a similar outcome for the three species of interest: with increasing accumulation of microplastics, as predicted from 2000 to 2100, DDE concentrations at steady state decrease (Figure 6). This decrease is most prominent in the lugworm (Figure 6A). Here, the DDE body burden decreases by 75 - 80% with increasing microplastic accumulation, depending in the scenario. DDE concentrations in mussel and cod tissues (Figure 6B – C) show a less pronounced decrease: a reduction of only 1% (best-case) to 7% (worst-case) of the body burden was projected fot both species.
Although often claimed to be of major concern, the transport of chemical pollutants from microplastics to biota appears to be less relevant than previously thought. While it is often stated that the ingestion of microplastics containing sorbed POPs will result in an increasing body burden, our simulations seem to suggest the opposite. Here, we observed a decrease in DDE tissue concentrations in all three species of interest as a result of the increasing microplastic accumulation, from 2000 to 2100. This decreasing trend in bioaccumulation can be attributed to a cleaning effect exercised by the plastic. As the organisms are not only exposed to the contaminant through the ingestion of plastic, but also through the exposure to contaminated seawater, sediment and food, they already contain considerate levels of the chemical in their tissues. As these tissue concentrations

Chapter 8
144
8
Figure 6: Evolution of the lipid normalised steady state body burden (CLSS) of DDE (μg.kg-1 lipids) in
function of the increase in microplastic abundance predicted from 2015 to 2100. CLSS is provided for
three marine species A. Arenicola marina (μg.kg-1 lipids dw); B. Mytilus edulis (μg.kg-1 lipids dw); C. Gadus morhua (μg.kg-1 lipids ww). Red lines indicate the worst-case scenario while green lines indicate the best-case scenario. Please note the differences in the values on the Y axis.

8
8
Microplastics: an emerging contaminant of concern?
145
are considerably higher than those on the plastic, equilibrium partitioning will result in the attenuation of the existing gradient between lipid and plastic (Gouin et al., 2011; Koelmans et al., 2013). This thus results in a net transport of the chemical from the lipids to the plastic, as opposed to the assumed transport from the plastic to the lipid. Koelmans et al. (2013) demonstrated that this effect is larger at higher KOW. An increasing KOW will increase the plastic-lipid gradient as the initial lipid concentrations in biota will be higher. Since DDE has a relatively high KOW, i.e. logKOW of 7 (ATSDR, 2002; see Table B5), this cleaning effect is especially visible in the simulations presented here. Additionally, the fact that the decrease in body burden is less pronounced under best-case scenario conditions (i.e. lower microplastic concentrations) confirms the existence of a cleaning effect by microplastics.
In contrast to previously discussed DDE, steady state (lipid normalised) body burden of the plastic-specific BPA shows an increasing trend in lugworm, mussel and cod exposed to increasing concentration of microplastics. Again, this trend is less pronounced under best-case scenario conditions. As before, this effect of microplastic ingestion is most pronounced in the lugworm (Figure 7A): tissue concentrations at 2000 microplastic abundance and accumulation represent only 20% of those in 2100 for the worst-case sceanrio. Under best-case scenario conditions, this 5-fold increase in reduced to a 1.4-fold increase (Figure 7A). While an increase in BPA body burden is also noticeable in mussel and cod tissues (Figure 7B – C), this increase is very limited and only a fraction of the one observed in A. marina: in mussel and cod, increasing microplastic accumulation will bring about a body burden increase of only 0.3% and 0.2%, respectively.
With respect to BPA, microplastic does not appear to perform the cleaning function as observed for DDE. On the contrary, the increase in microplastic abundance predicted from 2015 to 2100 will result in an increasing body burden of BPA, especially in the benthic lugworm. As our predictions for both chemicals use the same plastic and biological parameters, the difference in behaviour of DDE and BPA could only be attributed to differences in chemical parameters (Table B5). Especially the large difference in KOW (DDE has a logKOW of 7 while BPA has a logKOW of 3.4) could explain the differences in behaviour observed for both chemicals of interest. Not only will a lower KOW decrease the gradient between lipid and plastic concentrations of the chemical (as discussed for DDE), it greatly influences the dermal uptake and loss rate constant (kderm and kloss (Hendriks et al., 2001), changing the dynamics of uptake, retention and loss within the animal.
For both types of chemicals, i.e. the plastic-associated DDE and plastic-specific BPA, the relative slope changes were higher in A. marina compared to M. edulis and G. morhua: while DDE concentrations decreased by over half and the BPA body burden increased by a factor 5 in the lugworm, trends for both mussel and cod were negligible in

Chapter 8
146
8
Figure 7: Evolution of the lipid normalised steady state body burden (CLSS) of BPA (μg.kg-1 lipids) in
function of the increase in microplastic abundance estimated from 2015 to 2100. CLSS is provided for
three marine species A. Arenicola marina (μg.kg-1 lipids dw); B. Mytilus edulis (μg.kg-1 lipids dw); C. Gadus morhua (μg.kg-1 lipids ww). Red lines indicate the worst-case scenario while green lines indicate the best-case scenario. Please note the differences in the values on the Y axis.

8
8
Microplastics: an emerging contaminant of concern?
147
comparison (Figure 6 – 7). A possible explanation for this remarkable difference could be attributed to differences in ecology and hence exposure between the different species. Both M. edulis and G. morhua are exposed to microplastics present in the water column, while A. marina lives in the sediment and is hence exposed to the microplastic levels present in the sediment. As discussed earlier, microplastic abundance in sediment is higher than that in the water column (Figure 2), as sediments are considered a (permanent) sink for microplastics. Additionally, the lugworm is an indiscriminate or non-selective feeder. This non-selective feeding patron will result in A. marina ingesting all particles of appropriate sizes. As a result, A. marina will ingest a higher number of particles compared to selective feeders such as M. edulis. The resulting increased exposure of benthic organisms is subsequently reflected in the accumulation of microplastics in these species compared to biota associated with the water column (Figure 3A). The effects of the bioaccumulation of chemicals are hence strengthened in the lugworm, making this an exceptional species of interest for assessing future trends and effects of microplastic exposure.
It has to be mentioned that, due to parameter uncertainties related to the chemical and plastic properties as well as biological traits of the species of interest, there will be error propagation throughout the model. As a result, model outcomes can vary considerably, depending on the parameter set applied: Koelmans et al. (2014) already demonstrated that the model predictions for lugworm will vary between 0.5 and 10 times the outcome for the default parameter set. As this uncertainty can comprise differences of 1 order of magnitude, the bioaccumulation for open systems, calculated here, can vary substantially and is therefore not statistically significant (Koelmans et al., 2014). Especially in mussel and cod, where bioaccumulation of both DDE and BPA showed only minor changes with increasing microplastic abundance, the results observed here should be interpreted with caution. The parameters that will have an import impact on the final predictions will be those characteristic of the species under investigation (gut retention time GRT), the chemical of interest (KOW) and the plastic type (k1). We therefore suggest future research to investigate the effect of these three parameters on the evolution of chemical body burden in these and other species. However, overall we can conclude, similar to Koelmans et al. (2013, 2014), that microplastic ingestion will have a marginal effect on POP and additive accumulation in marine biota.
3.4.2 Implications for human health The risks associated with the transport of chemicals from plastics to marine organisms
are assessed with respect to human health. The United Nations (FAO/WHO, 2001) have established a Daily Tolerable Intake (DTI) for DDT and its associated compounds (including DDE) of 0.01 mg per kg bodyweight (bw) per day. Individuals consuming mussels (average portion of 250 g ww meat) in 2015 will consequently ingest 0.30 μg

Chapter 8
148
8
DDE (assuming a dw-to-ww ratio of 6.6% (Ricciardi and Bourget, 1998) and a lipid fraction of 2.2% (van Leeuwen and De Boer, 2008) in mussels). For an average individual of 70 kg, the daily tolerable intake is hence not exceeded (700 μg.d-1). In 2100, the exposure to DDE of individuals consuming mussels even decreases (albeit very limited), as mussel body burdens DDE decrease with increasing microplastic abundances (Figure 6B). The intake of DDE when consuming an average portion of mussels decreases from the previously mentioned 0.30 μg DDE to 0.28 μg.
A similar exercise was performed for BPA. EFSA has recently decreased the TDI for BPA from 50 μg. kg-1 bw.d-1 to 4 μg. kg-1 bw.d-1 (EFSA, 2015). However, even with this significant increase in the tolerable daily intake of BPA, consumers of mussels will currently not exceed these safe limits. For an average individual of 70 kg, the TDI is set at 280 μg.d-1. Consuming an average portion of mussels will only result in an uptake of 3.57 ng. As mentioned above (Section 3.4.1), the predicted increase in microplastic abundance will only very slightly increase BPA concentrations in exposed mussels. This increase in BPA concentrations in mussel tissue is so minimal, the average intake of this additive through the consumption of mussels does not change: in 2100, an average portion of mussel contains 3.57 ng.
4. Conclusion
The contamination of the marine environment with microplastics has been an issue of concern for over a decade now. Worldwide, monitoring campaigns of different marine compartments and habitats revealed that microplastics are present everywhere, sometimes at extremely high concentrations. At the same time, basic laboratory trails demonstrated that a myriad of marine organisms ingest these microplastics, while some experiments even indicated that (adverse) effects are associated with this uptake. As a result, microplastics are now commonly considered as “a threat to the marine environment”. However, this statement and the classification of microplastics as “contaminants of concern” have so far been made without proper, scientific confirmation as to the real environmental risks of this contaminant type. Structured frameworks for assessing environmental risks of chemicals and pollutants exist and are used in regulatory actions of many countries. This approach has just never been applied to microplastics. Therefore, in this chapter an attempt was made to assess the environmental risks of microplastics. Combining data taken from literature and from previous chapters, together with estimations and assumptions where data was lacking, allowed, for the first time ever, to critically answer the question: do microplastics pose a risk to marine systems?
Our results suggest that microplastics are of minor concern, and present, in general, a low current and future risk to marine organisms and ecosystems. Especially floating

8
8
Microplastics: an emerging contaminant of concern?
149
microplastics (pelagic environment) appear to be a minor threat to biota inhabiting the water column: the risk characterisation indicates that these microplastics will not pose a threat to these organisms, as environmental concentrations will not exceed safe levels by 2100. A slightly different picture is observed for sediments and sediment dwelling biota. Indeed, we found that microplastic concentrations can reach very high levels in sediments, especially in highly impacted areas, such as industrial harbours. We calculated that in these areas, microplastic concentrations are currently already exceeding safe PNEC levels and thus pose an environmental risk. In more pristine areas (both in coastal areas as well as deep sea sediments), however, no risks are observed.
These results indicate that sediments should be the primary focus of attention when considering microplastic contamination and associated impacts, rather than the pelagic compartment. However, the opposite is currently true: toxicity data for pelagic organisms are currently more abundant in literature than those for benthic organisms. Shifting the research focus towards sediments will provide more conclusive answers regarding the risk of increasing microplastic levels in sediments, and will contribute to the further (comprehensive) risk assessment of microplastics. It should be stressed that the results and conclusions presented here are based on an absolute minimum of data.
However, it has to be mentioned that continuing along the present path of toxicity/effects testing will not be sufficient to conclusively resolve the matter of potential microplastic risks. Future effect assessments of microplastics should include a wider array of species, representing different taxonomic groups, different feeding strategies and different trophic levels. So far, too much focus has been put on a limited number of model species. For benthic biota, only one species has been used in toxicity testing (i.e. Arenicola marina). Additionally, we recommend developing full concentration response curves, rather than testing of 1 or 2 concentrations/doses. This will ensure the development of more useful toxicity test data such as ECX, NOECs and LOECs, which are amendable to PNEC derivation. Guidelines for performing more relevant toxicity tests are available in the form of standard test guidelines (from major international organisations such as OECD, US EPA, etc.) and should be applied where possible to ensure the robustness of results.
With regards to human health, we can state that microplastic ingestion through the consumption of contaminated shellfish will not pose significant risks. Current and future (i.e. 2015 vs. 2100) ingestion patterns in individuals consuming shellfish will not bring about significant health risks. Neither direct effects on intestinal cells nor indirect effects associated with chemicals transported from plastic to shellfish for human consumption were identified. However, it has to be mentioned that currently toxicity data regarding the (adverse) effects associated with translocated microplastics in humans (and other vertebrates) are lacking. As we estimated that, on an annual basis (in 2100), as many as

Chapter 8
150
8
4,000 microplastics can translocate from the intestine to the circulatory system, this is identified as an important lack of knowledge to assess risks posed by microplastics.
Although still preliminary, the risk assessment indicates that microplastics may not be as harmful as previously thought. Describing the situation in the marine environment as “silent spring in the sea” (Worm, 2015), referring to the devastating effects of pesticide use on biota, are therefore premature and gratuitous. Yet, the lack of apparent risk associated with this type of pollution, as determined here, should not be considered as a reason to continue our present attitude towards plastic and management of plastic litter. It would be immensely irresponsible and careless to seize the apparent (current) lack of risks associated with microplastics to give up the efforts made (and to be made) to reduce this type of pollution.

9 General conclusions and future perspectives

Chapter 9
152
9
1. Introduction
During the past decade, microplastic pollution has been recognised as an important and growing environmental problem, especially in the marine environment. This type of pollution is, however, hardly regulated in terms of production, use and emissions in Europe, nor in the rest of the world. Although there are an increasing number of studies available on the presence and potential effects of microplastic pollution in marine systems, so far no real risk assessment of present and future risks to marine systems and human health has been performed. Therefore, the main aim of this thesis was to perform a risk assessment of the environmental and human health risks associated with microplastic pollution.
This chapter is structured around the main conclusions of this dissertation. In the following sections, the results and most important conclusions are reported and discussed. Each section is dedicated to one main conclusion, which is reported with respect to the original research questions. These original research questions and hypotheses, around which each chapter was developed, are indicated by the underlined font.
2. Inland sources and rivers contribute greatly to marine microplastic pollution
While (micro)plastic pollution has often been considered a marine problem, the contribution of rivers, connecting inland sources to the sea, has received much less attention (Sheavly and Register, 2007; UNEP, 2009; Gasperi et al., 2014; Morrit et al., 2014; Rech et al., 2014). As rivers are in direct contact with land-based sources of microplastics, we addressed the contribution of such land-based sources to microplastic pollution observed in rivers and the marine environment in Chapter 2.
River sediments collected along a transect of the Scheldt River (Belgium) showed high spatial variability in microplastic abundance: microplastic concentrations ranged from 1.2 to 48.6 microplastics.g-1 dry weight. The highest abundances were detected in the vicinity of suspected point sources, i.e. a plastic production plant in the harbour of Antwerp and a sewage treatment plant (STP) near Ghent. Near these facilities, sediment microplastic concentrations were up to 10 times higher than those observed at other sampling stations (plastic plant: 23.8 – 42.6 MPs.g-1 dry; STP: 41.2 – 48.6 MPs.g-1), indicating an important contribution of these land-based point sources to environmental microplastic concentrations. In fact, at the majority of sampling locations, microplastic abundances were higher than those reported for marine compartments. The sewage treatment plant discharging directly into the river was investigated in more detail, since household and industrial applications generate microplastics that are discharged together with domestic and industrial sewage. Our findings confirm the results of previous pilot projects (Leslie et al., 2012; HELCOM, 2014): sewage contains large amounts of microplastics, which are

9
General conclusions and future perspectives
153
not completely removed during the sewage treatment process. In this particular STP, only half (44.7%) of the microplastics present in the sewage are removed, resulting in large amounts of microplastics being discharged into the environment. We measured average concentrations of 13.0 ± 6.5 microplastics.L-1 in the effluent of the STP, corresponding to a daily discharge of 2.6 × 10⁸ microplastics into the Scheldt. With this initial assessment of river sediments, we were able to identify important point sources of microplastics and demonstrate the magnitude of microplastic pollution in rivers. Although not quantified here, it can be expected that through rivers, vast amounts of microplastics (originating from inland sources) will end up in the marine environment.
→ Suggestions and recommendations for further research
As mentioned above, the freshwater environment is severely underrepresented in microplastic research. We, together with a few other studies (Imhof et al., 2013; Castañeda et al., 2014; Klein et al., 2014), have demonstrated that this neglect is unjustified. Concentrations measured in the freshwater environment are often in the same range or even higher than those observed in the marine environment. Hence, biota inhabiting rivers and other freshwater bodies might be at equal, if not higher risk, than marine biota. Further research should therefore focus more on quantifying microplastic exposure and effects in freshwater systems. Identifying point sources that emit large amounts of microplastics into the environment, such as for example STPs, could prove useful in devising management measures that will reduce the input of microplastics into the environment.
3. Microplastics are ubiquitously present in all marine habitats
Despite many research and monitoring actions, the (quantitative) distribution of marine litter and its degradation products remains unclear. This is primarily due to (1) a lack of standard methods for sampling and extraction, (2) the focus on one specific compartment per study and (3) the lack of concurrent assessments of both macro- and microplastics (e.g. Browne et al., 2010 and Zhou et al., 2011). In Chapter 3, a quantitative assessment of the distribution of marine litter and its degradation products in different environmental compartments on the Belgian Continental Shelf is performed and a baseline of marine debris data for future comparison is established. In Chapter 4, an additional marine compartment is added to the quantitative assessment of microplastics, i.e. the seafloor of the deep sea.
In order to assess the current state of the Belgian Continental Shelf (BCS), abundance, weight and composition of marine debris, including microplastics, was assessed by

Chapter 9
154
9
performing beach, sea surface and seafloor monitoring campaigns for two consecutive years. As could be expected, plastic items were the dominant type of macrodebris recorded: over 95% of litter observed in the three sampled marine compartments were plastic. In general, abundance of macrodebris was quite high, especially on beaches. Here, on average 6,429 ± 6,767 items were recorded per 100 metres of beach, corresponding to an average weight of 9.27 ± 10.45 kg per 100 m. While the composition of marine macrolitter was quite diverse on beaches (plastic representing 50 to 99% of all items observed), plastic dominated the macrodebris observed at the sea surface and on seafloor (96% in both cases). The amount and weight of debris recovered from both the surface waters and the seabed is also orders of magnitudes lower than those detected on the beaches.
Microplastics represent a substantial part of the total plastic pollution of the marine environment. Although microplastic pollution is not as obvious as macrolitter, it represents an important part of the overall plastic pollution problem. On beaches, microplastic concentrations ranged from 7.2 to 20.4 microplastics per kg of dry sediment, with significantly higher concentrations detected at the high-water mark than at the low-water mark. This difference in microplastic abundance between low- and high-water mark is attributed to differences in water dynamics between these two zones: while the low-water mark is a highly dynamic zone (subjected to a constant deposition/re-suspension cycle), the high-water mark is a much calmer zone, favouring deposition of lighter particles. In terms of weight, macroplastic (1.9 ± 1.6 kg per 100 m) still dominates the pollution of beaches, as microplastics only represent 0.02 to 0.38 kg per 100 m of beach. While at the sea surface, micro- and macroplastics represent a similar weight fraction, microplastics are more dominant at the seafloor: here, microplastics weight is approximately 400 times higher than macrodebris weight.
The results presented in Chapter 4 demonstrate that microplastic pollution has spread throughout the world’s seas and oceans, into the remote and largely unknown deep sea. The techniques used to assess microplastic abundance in Chapter 3 were applied on deep-sea sediments, in the first ever assessment of microplastic pollution of the deep sea. In this way, we established that microplastic presence in sediments is not only limited to accumulation hot spots such as the continental shelf, but that they are also ubiquitously present in some of the most remote of marine environments, the deep sea. Microplastics in the micrometre size range were observed in sediment samples collected at four locations representing different deep-sea systems ranging in depth from 1100 to almost 5000 metres. An average microplastic concentration of 0.45 microplastics per 25cm² (top centimetre of sediment) was observed. Although not investigated, it was assumed that these particles entered the deep sea as a result of density modifying processes, e.g. biofouling and the incorporation of microplastics in biologically produced micro-

9
General conclusions and future perspectives
155
aggregates or marine snow. We calculated that such microplastics could enter depths of 5 km within a few weeks.
→ Suggestions and recommendations for further research
Assessing time trends of microplastic pollution in all marine compartments requires the establishment of similar (quantitative) baselines as the one developed in Chapter 3 for the Belgian Continental Shelf. However, there is still a lack in standardisation and harmonisation hampering inter-study comparison and data transfer. It is therefore recommended that uniform sampling, extraction and identification techniques, i.e. standard methods and protocols, are developed and used. These standard methods should be adopted by the research and regulatory community. For example, extraction techniques for sediments are often based on the same principle, i.e. density separation. Yet, many variations on this principle exist and while some are more efficient in extracting different types of microplastics (i.e. differences in density), this often comes at an extra cost. The research community should therefore agree on the adoption of standard protocols, based on a consideration of both pros and cons associated with each available technique. As such, this harmonisation will assist future, uniform microplastic abundance assessments, and allow science-based geographical comparison and time trend assessments.
4. Microplastics accumulate in marine invertebrates
Because of their small dimensions, microplastics are available for ingestion by a wide range of marine organisms. Assessment of microplastic ingestion is mostly performed at extremely high concentrations: up to several thousand times higher than observed ambient (marine) concentration. While such an approach is often deemed justified as needed to predict effect concentrations and assess the tested pollutant, testing at high, environmentally unrealistic concentrations does not provide any information on the current environmental situation. Therefore, in Chapter 5 and Chapter 6, we examined the presence of microplastics in ‘naturally exposed’ marine organisms, i.e. organisms originating from and hence exposed in the field. Additionally, in Chapter 5, we also investigated whether microplastic ingestion can adversely affect organisms’ energy metabolism, as it is assumed that feeding (on plastics) does not come without a cost to these organisms.
Even at low, ambient concentrations ingestion of microplastics occurs in a wide array of marine invertebrate species possessing different feeding strategies. Lugworms, representative for sediment dwelling deposit feeders and both mussels and oysters, representative of filter feeding bivalves, ingest microplastics when present in the

Chapter 9
156
9
surrounding medium. The two species under investigation in Chapter 5, i.e. A. marina and M. edulis, were collected at six locations along the French-Belgian-Dutch coastline. Although exposed to low, natural concentrations of microplastics (i.e. 0.4 ± 0.3 microplastics.L-1 for seawater and 6.0 ± 5.7 MPs.kg-1 dry weight in sediment) microplastics were detected in all organisms collected in the field. In mussels, the average microplastic body burden was 0.2 ± 0.3 microplastics.g-1 tissue, while slightly higher body burdens were detected in lugworms (1.2 ± 2.8 particles.g-1 tissue). Preliminary calculations demonstrated that only a minor fraction of the particles ingested by these organisms in the course of their lives remain lodged inside the intestinal tract or tissue: in M. edulis the body burden detected in this study represent only 0.003% of the total amount of microplastics ingested over their lifetime, while a retention efficiency of 0.6 to 1.8% was estimated for A. marina.
A proof-of-principle laboratory experiment, performed on the same two species, was performed to assess potential (adverse) effects of microplastic exposure and ingestion on the organisms’ energy metabolism. Both mussel and lugworm individuals were exposed to microplastic contaminated seawater and sediment, respectively. Microplastic concentrations in the seawater and sediment were high, respectively 110 particles.mL-1 and 110 particles.g-1, yet no significant adverse effect on the organisms’ overall energy budget were observed.
In Chapter 6, we extended the assessment of microplastic accumulation in natural systems to include two species of economic interest: the commercially grown bivalves Mytilus edulis and Crassostrea gigas. In accordance with the findings of Chapter 5, microplastics were recovered from the soft tissues of both bivalve species grown for human consumption. At time of consumption (i.e. without additional gut depuration), M. edulis contains on average 0.36 ± 0.07 particles.g-1 (wet weight), while a plastic load of 0.47 ± 0.16 particles.g-1 ww was detected in C. gigas. These results hence indicate that, through the consumption of shellfish, microplastics will end up in the human food chain. Based on consumption data obtained from the European Food Safety Authority (EFSA), it was calculated that European shellfish consumers will ingest between 1,800 and 11,000 microplastics per year, depending on whether they are minor or top shellfish consumers.
→ Suggestions and recommendations for further research
So far, there have been few studies assessing the uptake, accumulation and associated (adverse) effects in organisms exposed to low, ambient microplastic concentrations. The overwhelming majority of research has indeed been performed at unrealistically high concentrations, i.e. several thousand times higher than those currently observed in the environment. Additionally, lab trial exposure periods are often short-to midterm, rather

9
General conclusions and future perspectives
157
than long-term. While such approaches are often claimed to be ‘proof of principle’ experiments, and deemed necessary to assess the importance of this type of pollution, it should be recognised that testing at high – environmentally unrealistic – concentrations does not provide any information on the current adverse effects on or risks to marine ecosystems. Future effect assessments of microplastics should therefore focus on mimicking more ‘natural’ exposure conditions. More specifically, there is a need for more long-term toxicity testing at environmentally relevant concentrations of naturally occurring assemblages of microplastics (i.e. different sizes, shapes and types).
5. Microplastics are of minor importance to human food safety
As the previous chapters demonstrated that microplastics accumulate in marine biota under “natural” conditions, i.e. exposed to environmental concentrations of microplastics, this could imply there a risk for human health exists. While it is possible, based on the results presented in Chapter 5 and Chapter 6, to calculate the microplastic exposure of shellfish consuming individuals, it is not possible to assess the risks this entails for human health and food safety, as toxicity data are lacking in literature. In Chapter 7, we investigated whether seafood contaminated with microplastics constitutes a risk for human food safety.
Here, we used an intestinal human cell line (Caco-2) as a model for the intestinal epithelium, and tested in vitro the effects of microplastic ingestion in humans. These cells were exposed to high concentrations of microplastic (ranging from 5.7 × 10⁴ to 5.7 × 10⁷ particles.ml-1), both in the absence and presence of bile salts (to mimic intestinal conditions). Even exposure to these very high concentrations did not result in any significant cytotoxic effects. We did, however, observe translocation (i.e. transport of the particles through the intestinal epithelium). One hour after administering the microplastics, we observed the translocation of 0.02 to 0.16% of the particles and 0.08 to 0.52% after 24 hours. We calculated that 3 to 60 microplastics will translocate to the underlying circulatory system on an annual basis. However, we are still unable to assess the adverse effects of this translocation, as data are currently lacking in literature.
→ Suggestions and recommendations for further research
The tests performed in Chapter 7 assessed the effects of microplastic exposure to the cell line Caco-2. While this is a well-established model for the intestinal epithelium, it does not mimic natural intestinal conditions: the caco-2 culture represents a monoculture, while the intestinal epithelium is composed of a wide array of cell types, each with its specific function. Some of these cell functions, which are not represented in the Caco-2

Chapter 9
158
9
culture, could either positively or negatively affect microplastic exposure of the epithelium and underlying tissues (i.e. could affect translocation). Some cells, e.g. monocytes and so-called M-cells, could increase the translocation efficiency of particles due to their transporter function, while mucus-producing cells could reduce the contact between microplastics and cells. It is therefore suggested that performing similar, standard cytotoxicity and transport test on co-cultures of cells, combining cell types to create more realistic environment for translocation. These should be tested in combination with different types of microplastics, to assess the effect of size, shape and composition, and create more “realistic” exposure scenarios.
6. Microplastics do not pose risks to marine systems and human health
During the past decade, marine microplastic pollution has been recognized as a growing environmental problem and has recently been designated as a “major threat to the marine environment”. However, this statement has so far not been substantiated with integrated and relevant scientific data. Indeed, to date, no real risk assessment of present and future risks of microplastic to marine systems and human health has been performed. Therefore, in Chapter 8 we performed an integrated assessment of environmental and human health risks associated with microplastic pollution, and provide an answer to the question: does microplastic pollution pose risks to man and the environment?
Monitoring data on microplastic abundances were combined with a model predicting past, present and future concentrations of microplastics in the marine environment. By 2100, predicted environmental concentrations (PEC) for different marine regions ranged from 0.006 to over 90 microplastics per litre in the pelagic compartment and 30 to 140,000 particles per kg in the benthic compartment. This is a 60-fold increase compared to present (anno 2015) abundances. Assessing the (chronic) toxicity data available in literature permitted the calculation of safe concentrations (PNEC), i.e. concentrations below which adverse effects will most likely not occur. For sediments, these safe levels were situated around 540 particles.kg-1, while the PNEC in seawater was calculated as 640 particles.L-1. Combining the PECs and PNECs for sediments and seawater derived in the exposure and effect assessments allowed for the evaluation of present and future risks of increasing microplastic abundances in these marine compartments. Risk characterisation ratios (RCRs) suggested that microplastics only constitute a minor risk for the marine environment. Predicted concentrations of pelagic microplastics will not exceed safe PNEC levels by the end of the century. However, in sediments microplastics can reach very high abundances, especially in highly impacted areas (e.g. industrial harbours). Here, we demonstrated that these current microplastic concentrations already exceed safe predicted no effect concentrations, indicating there is a risk for benthic biota.

9
General conclusions and future perspectives
159
With regards to human health, we can state that microplastic ingestion through the consumption of contaminated shellfish will not pose significant risks. Current and future (i.e. 2015 vs. 2100) ingestion patterns in individuals consuming shellfish will not bring about significant health risks. No direct effects on intestinal cells not indirect effects associated with chemicals transported from plastic to shellfish for human consumption were identified. However, it has to be mentioned that currently toxicity data regarding the (adverse) effects associated with translocated microplastics in humans (and other vertebrates) are lacking. As we estimated that, on an annual basis, as many as 2,200 microplastics can translocate from the intestine to the circulatory system, this is identified as an important lack of knowledge to assess risks posed by microplastics.
Although preliminary, the risk assessment presented here indicates that microplastics may not be as harmful as previously thought. Yet, we stress that the absence of an apparent risk associated with microplastic pollution should not be considered an endorsement of our present plastic management practices.
→ Suggestions and recommendations for further research
The results of the environmental risk assessment presented here indicate that the benthic compartment, rather than the pelagic compartment, should be the primary focus of attention when considering microplastic contamination and its associated (adverse) impacts. Our results indicate that (safe) PNEC levels are more frequently exceeded in sediments, both at current and future levels, than those in the pelagic compartment. Future research should therefore focus more on assessing environmental levels of microplastics in sediments and, above all, increase research efforts to expand toxicity (i.e. adverse effects) data for sediment dwelling organisms. Currently, there is a lack of such toxicity data: the risk assessment, for example, was based on the only/all data available, i.e. for one species only (Arenicola marina). Shifting the focus of research more towards sediments will provide more conclusive answers regarding the risk of increasing microplastic levels in sediments.
However, it has to be mentioned that continuing along the present path of toxicity testing will not be sufficient to conclusively resolve the matter of potential microplastic risks. Future effect assessments of microplastics should include a wider array of species, representing different taxonomic groups, different feeding strategies and different trophic levels. So far, too much focus has been put on a limited number of model species. For example, in the specific case of benthic biota only one species has been used for toxicity testing. Additionally, we recommend developing concentration-response relationships rather than testing at a single dose, as is currently frequently the practice. The research community should recognize that in order to accurately assess microplastic risks to the

Chapter 9
160
9
environment and human health, current practices are not satisfactory. In order to undeniably answer the question “does microplastic pollution pose a real risk to man and the environment”, (environmentally) relevant research questions should be defined, to develop appropriate methods and protocols and produce relevant data.
7. Future perspectives: the future of plastics
Today it is clear, we live in the plastic age (Zalasiewicz et al., 2016). Plastic plays an important part in our everyday’s life and offers great functional benefit. Yet, it has an inherent design failure: while the material can persist for very long times, it’s intended life is typically less than a year (Ellen MacArthur Foundation, 2016). Indecent behaviour (littering) and infrastructure (spills and leakage), result in the release of millions of tonnes of plastic into the environment every year (Jambeck et al., 2015). As a result, plastic is contaminating the environment worldwide. Plastic litter and microplastics are encountered in every marine compartment. This will likely not change in the future given the rate at which plastic is still being dumped, littered and lost. Although we can say without a doubt that the pollution of the marine environment with microplastics will persist and likely increase in the coming years and decades, our understanding of these future trends is limited.
Even though there are numerous societal benefits associated with the use of plastic, there is a growing recognition that these can be achieved without the plastic ending up in the environment. An increasing awareness of sustainability and pollution issues, and fluctuating oil prices (8% of the global production of fossil fuels are used in the production of plastic), create a breeding ground for new philosophies and views, both among plastic producers as well consumers. Evidence of these changes can be found in the growing demand for and production of bio- and oxo-degradable plastics, the development of a circular economy and efficient recycling techniques, and the introduction of new legislation (e.g. plastic bag bans and fees).
Innovations such as biodegradable plastics could prove an important factor in alleviating the impact of littering and leakage of plastics into the environment. Especially since they would avoid harm to the environment in the case they would escape current or future collection schemes. However, today’s degradable plastics do not measure up to the high expectations (UNEP, 2015). For example, even plastics that are marketed as biodegradable do not always do so under environmental conditions. Here, the term biodegradable refers to plastics that are industrially or home compostable, i.e. warm, humid conditions that favour the activity of fungi and bacteria that break down the material. In the marine environment, these conditions are not met. As a result, these biodegradable do not provide a solution to the environmental impacts caused by marine
9
General conclusions and future perspectives
161
litter. Another degradable plastic commonly mentioned as a solution for the plastic pollution issue, are so-called oxo-degradable (or oxo-fragmentable) plastics. These plastics easily fragment, reducing the impacts associated with macroplastic pollution (i.e. ingestion and entanglement), but result in the accelerated formation of microplastics (UNEP, 2015). Although these innovations still not present a final solution to the degradation issue of plastics, they do indicate the change in mentality that is taking place in industry at the moment. The true challenge now is to develop truly bio-degradable plastic that will not pose any harm to the environment.
However, while these innovations in the production and processing of plastics combined with a change in mentality will realize a change for the future, they will unfortunately not be able to help us get rid of the historically built standing stock of plastic and microplastic pollution. The plastic that is already present in the environment is likely to stay there for a very long time. However, reducing the inputs of plastic in the future will entail an import reduction of future risks associated with this type of pollution (see Chapter 8, best- and worst-case scenarios).


A Supportive information Chapter 2

Chapter A
164
1. Sampling locations along the river Scheldt
Table 1: Sampling locations along the Scheldt. Sampling locations were selected to represent areas experiencing different (anthropogenic) pressures, which could result in a microplastic contamination pattern along the river continuum. Per sampling location, one to three sampling stations were identified, depending on their orientation relative to a (point or diffuse) microplastic source. For each sampling station coordinates are provided.
Sampling location Sampling station
Specification of sampling station
Latitude N
Longitude E
Rural area R1 Before city 50° 50.36’ 03° 36.23’ Sewage treatment plant S1 Before discharge point 51° 03.00’ 03° 46.47’ S STP (59,400 IE) 51° 03.11’ 03° 46.46’ S2 After discharge point 51° 03.00’ 03° 46.59’ Confluence of rivers C1 Before confluence 51° 07.47’ 04° 16.54’ C2 After confluence 51° 08.71’ 04° 19.85’ Industrial area I1 Before plastic plant 51° 14.45’ 04° 22.69’ I2 After plastic plant 51°14.48’ 04° 22.05’ I3 Convex river bend 51° 15.43’ 04° 18.92’
2. Weather conditions on STP sampling days
Figure A1: Weather conditions in March and April 2015, during the 4-week consecutive sampling of the STP of Destelbergen. Average temperature (°C) and total precipitation (mm) are represented. Sampling days are indicated red: 18/03, 25/03, 01/04 and 08/04. Weather data were collected from a weather station at approximately 2.2 km from the STP.

Supportive Information Chapter 2
165
3. Pearson correlation coefficients for sediment particle size fraction
Figure A2: Correlation of particle size fraction of the sediment and the abundance of microplastics (MPs.g-1 dry weight). A.: Correlation with particle size fraction > 63 μm. B.: Particle size fraction < 50 μm. C.: Particle size fraction < 20 μm. D.: Particle size fraction < 2 μm. In each panel, Pearson correlation coefficient r² and corresponding p-values are reported.


B Supportive information Chapter 8

Chapter B
168
1. Plastic production from 1950 to 2013
Historic plastic production data (1950 to 2013) were obtained from reports published by PlasticsEurope (2013, 2015). These reports, however, do not report plastic production data for every single year up to 2013. Therefore, extrapolations between reported years had to be made. The plastic production data from 1950 to 2013 used in the prediction of future environmental concentrations are presented in the table below.
Table B1: Annual global plastic production (in 106 tonnes) from 1950 to 2013. Data were obtained from PlasticsEurope (2013, 2015). Production numbers in bold were obtained directly from the PlasticsEurope reports, while data for the other years were made by extrapolating between these reported production data.
Year Production Year Production Year Production Year Production
1950 1.7 1966 22.5 1982 70.6 1998 171.5 1951 2.3 1967 25.0 1983 74.7 1999 179.5 1952 2.9 1968 17.5 1984 78.7 2000 187.5 1953 3.4 1969 30.0 1985 82.8 2001 195.8 1954 4.0 1970 32.5 1986 86.8 2002 204.0 1955 4.6 1971 34.9 1987 90.9 2003 210.6 1956 5.2 1972 37.3 1988 94.9 2004 217.1 1957 5.8 1973 39.8 1989 99.0 2005 223.7 1958 6.3 1974 42.2 1990 107.5 2006 230.3 1959 6.9 1975 44.6 1991 115.5 2007 236.9 1960 7.5 1976 47.0 1992 123.5 2008 243.4 1961 10.0 1977 50.9 1993 131.5 2009 250.0 1962 12.5 1978 54.8 1994 139.5 2010 270.0 1963 15.0 1979 5.6 1995 147.5 2011 279.0 1964 17.5 1980 62.5 1996 155.5 2012 288.0 1965 20.0 1981 66.6 1997 163.5 2013 299.0

Supportive Information Chapter 8
169
2. Exposure assessment: predicting future microplastic concentrations
2.1 Parameters for exposure assessment modelling
Table B2: Definition and unit of model parameters for the exposure assessment. Values applied for the estimation of average abundance, as well as the ranges used in predicting the best and worst case scenario are provided. All parameter values were compiled from literature data
Parameter Definition and units Value (range) Source Degrad Fraction of plastic weight loss
through degradation (-) 0.011 (0.002 – 0.25) Artham et al., 2009;
Sudhakar et al., 2007; Rutkowska et al., 2002
fbeach Fraction of marine litter beached (-)
0.15 UNEP, 2005
ffloat Fraction of marine litter floating (-)
0.15 UNEP, 2005
fML Fraction of annual plastic production
0.032 (0.017 – 0.047) Jambeck et al., 2015
MPtot,t Total weight of microplastics present in the marine environment (106 tonnes)
Model output /
PLprod,t Global annual plastic production (106 tonnes)
1.7 in 1950 to 299 in 2013
PlasticsEurope, 2013; PlasticsEurope, 2015
2.2 Microplastic concentrations in seawater and sediment
Table B3: Upper and lower boundaries of microplastic concentrations reported in literature for coastal and oceanic areas, for both the pelagic and benthic compartment. Concentrations (in particles.L-1 and particles.kg-1 wet weight, respectively) reported here are already corrected for microplastic size, i.e. concentrations provided in this table include microplastics ranging in size from 1 μm to 5 mm (LR-SMPs: 10%; UR-SMPs: 25%; LMPs: 10%).
Region Lowest concentration
Year Reference Highest concentration
Year Reference
Coastal waters
2.5 × 10⁻⁴ particles.L-1 2010 Collignon et al., 2012
1.7 particles.L-1 2012 Desforges et al., 2014
4.2 particles.kg-1 2010 Martins & Sobral, 2010
2075 particles.kg-1 2011 Norén, 2007
Open ocean
9.5 × 10⁻⁵ particles.L-1 2010 Goldstein et al., 2013
0.3 particles.L-1 2012 Desforges et al., 2014
0.5 particles.kg-1 2012 Fisher et al., 2015
347.2 particles.kg-1 2013 Van Cauwenberghe et al., 2013

Chapter B
170
2.3 Projections of microplastic particle numbers
Figure B1: Past and future projections of global microplastic abundance (in number of particles) in the marine environment. A. Total microplastic numbers; B. Floating microplastics; C. Microplastics in sediments. Dotted lines represent the minima (lower) and maxima (upper), while the solid line represents an average situation (see Table B2). Historic microplastic abundances (pre-2013) are represented in grey, while future abundances (2013 – 2100) in the best-case-scenario are in green and worst-case-scenario in red.

Supportive Information Chapter 8
171
3. Effect assessment: Species Sensitivity Distribution and Predicted No Effect calculation
Table B4: Marine species (chronic) toxicity to microplastics data selected for the PNEC calculation. For seawater the most sensitive endpoint is provided per species is provided. For sediment, toxicity data were only available for one species, i.e. Arenicola marina. Here the geometric mean of the most sensitive endpoint is provided.
Taxonomic group
Species Most sensitive endpoint
NOEC Reference
Seawater (particles.mL-1)
Algae Pseudonitzschia delicatissima Growth 60,000 Soudant et al., 2013 Molluscs Mytilus edulis Metabolic rate 110 Van Cauwenberghe et
al., 2015 Crassostrea gigas Fertilization rate 2000 Sussarellu et al., 2013
Crustaceans Tigriopus japonicus Mortality 2.1 × 10⁵ Lee et al., 2013 Centropages typicus Respiration 75 Cole et al., 2013
Echinoderms Tripneustes gratilla Growth 100 Kaposi et al., 2014 Sediment (particles.kg-1)
Polychaetes Arenicola marina Metabolic rate 5.37 × 10⁵ Wright et al., 2013a and Van Cauwenberghe et al., 2015

Chapter B
172
4. D
efin
ition
and
uni
t of m
odel
par
amet
ers f
or e
ffec
t ass
essm
ent:
Che
mic
al tr
ansp
ort m
odel
ling
Tabl
e B5
: Def
initi
on a
nd u
nit o
f mod
el p
aram
eter
s for
che
mic
al (P
OP
and
addi
tive)
tran
spor
t. Pa
ram
eter
D
efin
ition
and
uni
ts
Mus
sel M
ytilu
s ed
ulis
Lu
gwor
m A
reni
cola
mar
ina
Cod
Gad
us m
orhu
a
a foo
d A
bsor
ptio
n ef
ficie
ncy
from
food
(-)
0.4
(Hen
drik
s et a
l., 2
001)
0.
15 (H
endr
iks e
t al.,
200
1)
0.7
(Hen
drik
s et a
l., 2
001)
C
BSS
C
once
ntra
tion
in b
iota
at s
tead
y st
ate
(μg.
g-1 D
W)
Mod
el o
utpu
t M
odel
out
put
Mod
el o
utpu
t
Cfo
od
Con
cent
ratio
n in
food
(μg.
g-1)
Estim
ated
as C
W×K
OW
×flip
D
DE:
Est
imat
ed a
s C
W×f
OC×K
OC
BPA
: Est
imat
ed a
s CW
×KP
CB
SS fo
r mus
sel (
in w
et w
eigh
t)
CLSS
Li
pid
norm
alis
ed c
once
ntra
tion
in b
iota
at
stea
dy st
ate
(μg.
g-1 D
W)
Mod
el o
utpu
t M
odel
out
put
Mod
el o
utpu
t
Cpa
rt,t
Con
cent
ratio
n of
mic
ropl
astic
s in
the
orga
nism
at t
ime
t (pa
rticl
es.g
-1 D
W)
Out
put e
xpos
ure
asse
ssm
ent
mod
ellin
g O
utpu
t exp
osur
e as
sess
men
t m
odel
ling
Out
put e
xpos
ure
asse
ssm
ent
mod
ellin
g
CPL
C
once
ntra
tion
on p
last
ic a
t tim
e of
in
gest
ion
(μg.
g-1)
DD
E: 3
.1 n
g.g-1
(Mat
o et
al.,
20
01)
BPA
: 0.1
μg.
g-1 (T
eute
n et
al.,
20
09)
DD
E: 3
.1 n
g.g-1
(Mat
o et
al.,
20
01)
BPA
: 0.1
μg.
g-1 (T
eute
n et
al.,
20
09)
DD
E: 3
.1 n
g.g-1
(Mat
o et
al.,
20
01)
BPA
: 0.1
μg.
g-1 (T
eute
n et
al.,
20
09)
CPL
R,t
Con
cent
ratio
n tra
nsfe
rred
from
pla
stic
to
the
orga
nism
dur
ing
gut p
assa
ge (μ
g.g-1
) M
odel
out
put
Mod
el o
utpu
t M
odel
out
put
CW
C
once
ntra
tion
in se
awat
er (μ
g.L-1
) D
DE:
11 p
g.L-1
(Mat
o et
al.,
20
11)
BPA
: 2.7
ng.
L-1 (J
RC
, 201
0)
DD
E: 1
1 pg
.L-1
(Mat
o et
al.,
20
11)
BPA
: 2.7
ng.
L-1 (J
RC
, 201
0)
DD
E: 1
1 pg
.L-1
(Mat
o et
al.,
20
11)
BPA
: 2.7
ng.
L-1 (J
RC
, 201
0)
f lip
Lipi
d fr
actio
n in
org
anis
ms (
-)
0.02
2 (V
an L
eeuw
en a
nd D
e B
oer,
2007
) 0.
052
(Hau
ck e
t al.,
200
7)
0.00
84 (V
an L
eeuw
en a
nd D
e B
oer,
2007
) f O
C
Org
anic
car
bon
frac
tion
sedi
men
t (-)
/
0.05
(EU
-TG
D, 2
003)
/
GR
T G
ut re
tent
ion
time
(d)
0.41
(Cal
cula
ted
for 4
5mm
she
ll le
ngth
) (H
awki
ns e
t al.,
199
0)
0.14
(Koe
lman
s et a
l., 2
013a
, b)
7 (K
oelm
ans e
t al.,
201
3a, b
)
IR
Inge
stio
n ra
te (g
.g-1
DW
d-1)
2.8
(Cal
cula
ted
for 4
5mm
shel
l 4.
7 (K
oelm
ans e
t al.,
201
3a, b
) 0.
0126
g.g
-1 W
W d
-1

Supportive Information Chapter 8
173
leng
th) (
Haw
kins
et a
l., 1
990)
(G
reen
stre
et, 1
995)
IR
PL
Mic
ropl
astic
inge
stio
n ra
te (g
.g-1
DW
d-1)
Cal
cula
ted
as M
PL/(G
RT*
Mor
g)
(Koe
lman
s et a
l., 2
014)
C
alcu
late
d as
MPL
/(GR
T* M
org)
(Koe
lman
s et a
l., 2
014)
C
alcu
late
d as
MPL
/(GR
T* M
org)
(Koe
lman
s et a
l., 2
014)
k 1
A
ppar
ent f
irst o
rder
rate
con
stan
t for
pl
astic
-to-li
pid
trans
port
(d-1)
10 (K
oelm
ans e
t al.,
201
3a, b
) 10
(Koe
lman
s et a
l., 2
013a
, b)
10 (K
oelm
ans e
t al.,
201
3a, b
)
k 2
App
aren
t firs
t ord
er ra
te c
onst
ant f
or li
pid-
to-p
last
ic tr
ansp
ort (
d-1)
Estim
ated
as k
1/KPL
IP
(Koe
lman
s et a
l., 2
013a
, b)
Estim
ated
as k
1/KPL
IP (K
oelm
ans
et a
l., 2
013a
, b)
Estim
ated
as k
1/KPL
IP (K
oelm
ans
et a
l., 2
013a
, b)
k der
m
Rat
e co
nsta
nt fo
r upt
ake
from
wat
er (L
.g-1
D
W d
-1)
DD
E: 3
.80
(Hen
drik
s et a
l.,
2001
) PB
A: 1
.59
(Hen
drik
s et a
l.,
2001
)
DD
E: 1
.60
(Hen
drik
s et a
l.,
2001
) PB
A: 0
.67
(Hen
drik
s et a
l.,
2001
)
DD
E: 0
.09
(Hen
drik
s et a
l.,
2001
) B
PA: 0
.05
(Hen
drik
s et a
l.,
2001
) K
LIP
Lipi
d-w
ater
par
titio
n co
effic
ient
A
ppro
xim
ated
as
1000
* k d
erm/(
f lip*
klo
ss)
(Koe
lman
s et a
l., 2
013a
, b)
App
roxi
mat
ed a
s 10
00*
k der
m/(
f lip*
klo
ss)
(Koe
lman
s et a
l., 2
013a
, b)
App
roxi
mat
ed a
s 10
00*
k der
m/(
f lip*
klo
ss)
(Koe
lman
s et a
l., 2
013a
, b)
k los
s Lo
ss ra
te c
onst
ant (
g.g-1
DW
d-1)
DD
E: 2
.01
(Hen
drik
s et a
l.,
2001
) PB
A: 3
0.42
(Hen
drik
s et a
l.,
2001
)
DD
E: 0
.37
(Hen
drik
s et a
l.,
2001
) PB
A: 5
.61
(Hen
drik
s et a
l.,
2001
)
DD
E: 0
.01
(Hen
drik
s et a
l.,
2001
) PB
A: 0
.96
(Hen
drik
s et a
l.,
2001
) K
OC
Sedi
men
t org
anic
car
bon-
wat
er p
artit
ion
coef
ficie
nt (-
) /
Cal
cula
ted
as
LogK
OC=L
ogK
OW
-0.4
8 (S
eth
et
al.,
1999
)
/
KP
Sedi
men
t-wat
er p
artit
ion
coef
ficie
nt (L
.kg-
1 ) /
BPA
: 35.
8 (J
RC
, 201
0)
/
KPL
IP
Lipi
d-po
lyet
hyle
ne w
ater
par
titio
n co
effic
ient
C
alcu
late
d as
KLI
P/KPL
C
alcu
late
d as
KLI
P/KPL
C
alcu
late
d as
KLI
P/KPL
Log
KO
W
Oct
anol
-wat
er p
artit
ion
coef
ficie
nt (-
) D
DE:
7.0
(ATS
DR
, 200
2 B
PA: 3
.4 (J
RC
, 201
0)
DD
E: 7
.0 (A
TSD
R, 2
002)
B
PA: 3
.4 (J
RC
, 201
0)
DD
E: 7
.0 (A
TSD
R, 2
002)
B
PA: 3
.4 (J
RC
, 201
0)
LogK
PL
Poly
ethy
lene
-wat
er p
artit
ion
coef
ficie
nt
Estim
ated
as 1
.18*
LogK
OW
-1.2
6 (K
oelm
ans e
t al.,
201
3a, b
) Es
timat
ed a
s 1.1
8*Lo
gKO
W-1
.26
(Koe
lman
s et a
l., 2
013a
, b)
Estim
ated
as 1
.18*
LogK
OW
-1.2
6 (K
oelm
ans e
t al.,
201
3a, b
) M
L M
ass o
f lip
ids i
n or
gani
sm (g
DW
) C
alcu
late
d as
Mor
g*f L
IP
Cal
cula
ted
as M
org*
f LIP
C
alcu
late
d as
Mor
g*f L
IP
Mor
g O
rgan
ism
wei
ght (
g D
W)
0.4
(Cal
cula
ted
for o
rgan
ism
of
0.6
(Bes
selin
g et
al.,
201
3)
3312
g W
W (F
oeke
ma
et a
l.,

Chapter B
174
45m
m le
ngth
) (H
awki
ns e
t al.,
19
90)
2013
)
Mpa
rt M
ass o
f one
mic
ropl
astic
par
ticle
C
alcu
late
d us
ing
an a
vera
ge
plas
tic d
ensi
ty o
f 1kg
.L-1
C
alcu
late
d us
ing
an a
vera
ge
plas
tic d
ensi
ty o
f 1kg
.L-1
C
alcu
late
d us
ing
an a
vera
ge
plas
tic d
ensi
ty o
f 1kg
.L-1
M
PL
Mas
s of m
icro
plas
tic in
org
anis
m (g
) C
alcu
late
d as
Mpa
rt*C
part*
Mor
g C
alcu
late
d as
Mpa
rt*C
part*
Mor
g C
alcu
late
d as
Mpa
rt*C
part
r par
t R
adiu
s of a
vera
ge in
gest
ed p
artic
le (m
m)
0.02
0.
2 0.
5 S f
ood
Mas
s fra
ctio
n of
food
inge
sted
(-)
Cal
cula
ted
as 1
-SPL
C
alcu
late
d as
1-S
PL
Cal
cula
ted
as 1
-SPL
S P
L M
ass f
ract
ion
of m
icro
plas
tic in
gest
ed (-
) C
alcu
late
d as
IRPL
/IR
(Koe
lman
s et a
l., 2
014)
C
alcu
late
d as
IRPL
/IR
(Koe
lman
s et a
l., 2
014)
C
alcu
late
d as
IRPL
/IR
(Koe
lman
s et a
l., 2
014)

175
REFERENCES

References
176
ADGER, W. N., HUGHES, T. P., FOLKE, C., CARPENTER, S. R., & ROCKSTRÖM, J., 2005. Social-ecological resilience to coastal disasters. Science 309, 1036–1039.
ALDENBERG, T. AND JAWORSKA, J.S., 2000. Uncertainty of the hazardous concentration and fraction affected for normal species sensitivity distributions. Ecotoxicology and Environmental Safety 46, 1-18.
ALDENBERG, T., LUTTIK, R., 2002. Extrapolation factors for tiny toxicity data sets from species sensitivity distributions with known standard deviation, in: Posthuma, L., Suter, G.W. (Eds.), The use of species sensitivity distributions in ecotoxicology. SETAC Press, Pensacola, Florida.
ALLDREDGE, A.L., SILVER, M.W., 1988. Characteristics, dynamics and significance of marine snow. Progress in Oceanography 20, 41-82.
ANDERSON, C.A., COOKSON, A.L., MCNABB, W.C., PARK, Z., MCCANN, M.J., KELLY, W.J., ROY, N.C., 2006. Lactobacillus plantarum MB452 enhances the function of the intestinal barrier by increasing the expression levels of genes involved in tight junction formation. BMC Microbiology 10, 316.
ANDRADY, A.L., NEAL, M.A., 2009. Applications and societal benefits of plastics. Philosophical Transactions of the Royal Society B: Biological Sciences 364, 1977-1984.
ANDRADY, A.L., 2011. Microplastics in the marine environment. Marine Pollution Bulletin 62, 1596-1605. ANDRADY A.L., 2015. Persistence of plastic litter in the oceans. In: M. Bergman, et al. (eds.), Marine
Anthropogenic Litter. Springer International Publishing, pp. 57-72. ANSARI, T.M., MARR, I.L., TARIQ, N., 2004. Heavy metals in marine pollution perspective – A mini review.
Journal of Applied Science 4, 1-20. ANTUNES, J.C., FRIAS, J.G.L., MICAELO, A.C., SOBRAL, P., 2013. Resin pellets from beaches of the
Portuguese coast and adsorbed persistent organic pollutants. Estuarine Coastal and Shelf Science 130, 62 – 69.
ARIZA, E., LEATHERMAN, S.P., 2012. No-smoking policies and their outcomes on U.S. beaches. Journal of Coastal Research 28, 143-147.
ARTHAM, T., SUDHAKAR, M., VENKATESAN, R., MADHAVAN NAIR, C., MURTY, K.V.G.K., DOBLE, M., 2009. Biofouling and stability of synthetic polymers in sea water. International Biodeterioration & Biodegradation 63, 884-890.
ARTHUR, C., BAKER, J., BAMFORD, H., 2009. Proceedings of the International Research Workshop on the occurrence, Effects and Fate of Microplastic Marine Debris. NOAA Technical Memorandum NOS-OR&R-30, p. 49.
ASTM D2974, 2014. Standard test methods for moisture, ash, and organic matter of peat and other organic soils. ASTM International, West Conshohocken, PA, p. 4.
ATSDR, 2002. Toxicological profile for 4,4-DDT, 4.4-DDE, and 4,4-DDD. Agency for Toxic Substances and Disease Registry, US Public Health Service, Department of Health and Human Services, Atlanta, GA, p. 497.
ATSDR, 2010. Toxicological Profile for Styrene. Agency for Toxic Substances and Disease Registry, US Public Health Service, Department of Health and Human Services, Atlanta, GA, p. 283.
AWARA, W.M., EL-NABI, S.H., EL-GOHARY, M., 1998. Assessment of vinyl chloride-induced DNA damage in lymphocytes of plastic industry workers using a single-cell gel electrophoresis technique. Toxicology 128, 9-16.
BAKIR, A., ROWLAND, S.J., THOMPSON, R.C., 2012. Competitive sorption of persistent organic pollutants onto microplastics in the marine environment. Marine Pollution Bulletin 64, 2782-2789.
BAKIR, A., ROWLAND, S.J., THOMPSON, R.C., 2014. Transport of persistent organic pollutants by microplastics in estuarine conditions. Estuarine, Coastal and Shelf Science 140, 14-21.
BARNES, D.K.A., GALGANI, F., THOMPSON, R.C., BARLAZ, M., 2009. Accumulation and fragmentation of plastic debris in global environments. Philosophical Transactions of the Royal Society B: Biological Sciences 364, 1985-1998.

References
177
BAT, L., RAFFAELLI, D., 1998. Sediment toxicity testing: a bioassay approach using the amphipod Corophium volutator and the polychaete Arenicola marina. Journal of Experimental Marine Biology and Ecology 226, 217-239.
BAYNE, B.L., HAWKINS, A.J.S., NAVARRO, E., 1987. Feeding and digestion by the mussel Mytilus edulis L. (Bivalvia: Mollusca) in mixtures of silt and algal cells at low concentrations. Journal of Experimental Marine Biology and Ecology 111, 1-22.
BAYNE, B.L., WORRAL, C.M., 1980. Growth and production of mussels Mytilus edulis from two populations. Marine Ecology Progress Series 3, 317-328.
BAZTAN, J., CARRASCO, A., CHOUINARD, O., CLEAUD, M., GABALDON, J.E., HUCK, T., JAFFRÈS, L., JORGENSEN, B., MIGUELEZ, A., PAILLARD, C., VANDERLINDEN, J.-P., 2014. Protected areas in the Atlantic facing the hazards of micro-plastic pollution: First diagnosis of three islands in the Canary Current. Marine Pollution Bulletin 80, 302-311.
BERGMANN, M., KLAGES, M., 2012. Increase of litter at the Arctic deep-sea observatory HAUSGARTEN. Marine Pollution Bulletin 64, 2734-2741.
BESSELING, E., WEGNER, A., FOEKEMA, E.M., VAN DEN HEUVEL-GREVE, M., KOELMANS, A.A., 2013. Effects of microplastic on fitness and PCB bioaccumulation by the lugworm Arenicola marina (L.). Environmental Science & Technology 47, 593-600.
BESSELING, E., FOEKEMA, E.M., VAN FRANEKER, J.A., LEOPOLD, M.F., KÜHN, S., BRAVO REBOLLEDO, E.L., HESSE, E., IJZER, J., KAMMINGA, P., KOELMANS, A.A., 2015. Microplastic in a macro filter feeder: Humpback whale Megaptera novaeangliae. Marine Pollution Bulletin 95, 148-252.
BEUKEMA, J.J., DE VLAS, J., 1979. Population parameters of the lugworm, Arenicola marina, living on tidal flats in the Dutch Wadden Sea. Netherlands Journal of Sea Research 13, 331-353.
BLIGH, E.G., DYER, W.J., 1959. A rapid method of total lipid extraction and purification. Canadian Journal of Biochemistry and Physiology 37, 911-917.
BOERGER, C.M., LATTIN, G.L., MOORE, S.L., MOORE, C.J., 2010. Plastic ingestion by planktivorous fishes in the North Pacific Central Gyre. Marine Pollution Bulletin 60, 2275-2278.
BRADFORD, M.M., 1976. A rapid and sensitive method for the quantification of microgram quantities of protein, utilizing the principle of protein-dye binding. Analytical Biochemistry 72, 248-254.
BRILLANT, M.G.S., MACDONALD, B.A., 2000. Postingestive selection in the sea scallop, Placopecten magellanicus (Gmelin): the role of particle size and density. Journal of Experimental Marine Biology and Ecology 253, 211-227.
BROWN, E., COLLING, A., PARK, D., PHILLIPS, J., ROTHERY, D., WRIGHT, J., 2001. Ocean Circulation. Buterworth-Heinemann Ltd, Oxford, p. 286.
BROWNE, M.A., CRUMP, P., NIVEN, S.J., TEUTEN, E., TONKIN, A., GALLOWAY, T.S., THOMPSON, R.C., 2011. Accumulation of microplastic on shorelines worldwide: Sources and sinks. Environmental Science & Technology 45, 9175-9179.
BROWNE, M.A., DISSANAYAKE, A., GALLOWAY, T.S., LOWE, D.M., THOMPSON, R.C., 2008. Ingested microscopic plastic translocates to the circulatory system of the mussel, Mytilus edulis (L.). Environmental Science & Technology 42, 5026-5031.
BROWNE, M.A., GALLOWAY, T.S., THOMPSON, R.C., 2007. Microplastic - An Emerging Contaminant of Potential Concern? Integrated Environmental Assessment and Management 3, 559-561.
BROWNE, M.A., GALLOWAY, T.S., THOMPSON, R.C., 2010. Spatial Patterns of Plastic Debris along Estuarine Shorelines. Environmental Science & Technology 44, 3404-3409.
BROWNE, M.A., NIVEN, S.J., GALLOWAY, T.S., ROWLAND, S.J., THOMPSON, R.C., 2013. Microplastic moves pollutants and additives to worms, reducing functions linked to health and biodiversity. Current Biology 23, 2388-2392.
BURKE, L., REYTAR, K., SPALDING, M., PERRY, A., 2011. Reefs at risk revisited. World Resources Institute (WRI), Washington, p. 130.

References
178
BUXBAUM, G., PFAFF, G., 2005. Industrial inorganic pigments, 3rd, Completely revised and extended edition. Weinheim: Wiley-VCH Verlag GmbH & Co, p. 315.
CADÉE, G.C., 1976. Sediment reworking by Arenicola marina on tidal flats in the Dutch Wadden Sea. Netherlands Journal of Sea Research 10, 440-460.
CARPENTER, E.J., ANDERSON, S.J., HARVEY, G.R., MIKLAS, H.P., PECK, B.B., 1972. Polystyrene Spherules in Coastal Waters. Science 178, 749-750.
CARPENTER, E.J., SMITH, K.L., 1972. Plastics on the Sargasso Sea Surface. Science 175, 1240-1241. CARR, K.E., SMYTH, S.H., MCCULLOUGH, M.T., MORRIS, J.F., MOYES, S.M., 2012. Morphological aspects
of interactions between microparticles and mammalian cells: intestinal uptake and onward movement. Progress in Histochemistry and Cytochemistry 46, 185-252.
CARSON, H.S., COLBERT, S.L., KAYLOR, M.J., MCDERMID, K.J., 2011. Small plastic debris changes water movement and heat transfer through beach sediments. Marine Pollution Bulletin 62, 1708-1713.
CASTAÑEDA, R.A., AVLIJAS, S., SIMARD, M.A., RICCIARDI, A., 2014. Microplastic pollution in St. Lawrence River sediments. Canadian Journal of Fisheries and Aquatic Sciences 71, 1767-1771.
CHAPMAN, P.M., CALDWELL, R.S., CHAPMAN, P.F., 1996. A warning: NOECs are inappropriate for regulatory use. Environmental Toxicology and Chemistry 15: 77-79.
CHASKEY, E., HIRSCH, T., DRAKE, T., EHMANN, K., CHU, Y., 2014. Microplastic pollution: a comparative survey of wastewater effluent in New York. Center for Earth and Environmental Science Student Posters, Book 8.
CHOY, C.A., DRAZEN, J.C., 2013. Plastic for dinner? Observation of frequent debris ingestion by pelagic predatory fishes from the central North Pacific. Marine Ecology Progress Series 485, 155-163.
CHUA, E.M., SHIMETA, J., NUGEGODA, D., MORRISON, P.D., CLARKE, B.O., 2014. Assimilation of Polybrominated Diphenyl Ethers from Microplastics by the Marine Amphipod, Allorchestes Compressa. Environmental Science & Technology 48, 8127-8134.
CLAEREBOUDT, M.R., 2004. Shore litter along sandy beaches of the Gulf of Oman. Marine Pollution Bulletin 49, 770-777.
CLAESSENS, J., 1988. Het hydraulisch regime van de Schelde. Water, 43, 163-169. CLAESSENS, M., DE MEESTER, S., VAN LANDUYT, L., DE CLERCK, K., JANSSEN, C.R., 2011. Occurrence and
distribution of microplastics in marine sediments along the Belgian coast. Marine Pollution Bulletin 62, 2199-2204.
CLAESSENS, M., VAN CAUWENBERGHE, L., GOFFIN, A., DEWITTE, E., BRAARUP CUYCKENS, A., MAELFAIT, V., VANHECKE, V., MEES, J., STIENEN, E.W.M., JANSSEN, C.R., 2013a. Assessment of Marine Debris on the Belgian Continental Shelf: Occurence and Effects (AS-MADE). Belgian Science Policy 2009, Brussels, p. 68.
CLAESSENS, M., VAN CAUWENBERGHE, L., VANDEGEHUCHTE, M.B., JANSSEN, C.R., 2013b. New techniques for the detection of microplastics in sediments and field collected organisms. Marine Pollution Bulletin 70, 227-233.
CLAUSEN, I., RIISGÀRD, H.U., 1996. Growth, filtration and respiration in the mussel Mytilus edulis: no evidence for physiological regulation of the filter-pump to nutritional needs. Marine Ecology Progress Series 141, 37-45.
COLE, M., LINDEQUE, P., FILEMAN, E., HALSBAND, C., GOODHEAD, R., MOGER, J., GALLOWAY, T.S., 2013. Microplastic ingestion by zooplakton. Environmental Science & Technology 47, 6646-6655.
COLE, M., LINDEQUE, P., HALSBAND, C., GALLOWAY, T.S., 2011. Microplastics as contaminants in the marine environment: A review. Marine Pollution Bulletin 62, 2588-2597.
COLLIGNON, A., HECQ, J.-H., GALGANI, F., VOISIN, P., COLLARD, F., GOFFART, A., 2012. Neustonic microplastic and zooplankton in the North Western Mediterranean Sea. Marine Pollution Bulletin 64, 861-864.
References
179
COOPER, D.A., CORCORAN, P.L., 2010. Effects of mechanical and chemical processes on the degradation of plastic beach debris on the island of Kauai, Hawaii. Marine Pollution Bulletin 60, 650-654.
CORCORAN, P.L., BIESINGER, M.C., GRIFI, M., 2009. Plastics and beaches: A degrading relationship. Marine Pollution Bulletin 58, 80-84.
COSTA, M.F., IVAR DO SUL, J.A., SILVA-CAVALCANTI, J.S., ARAÚJA, M.C.B., SPENGLER, A., TOURINHO, P.S., 2010. On the importance of size of plastic fragments and pellets on the strandline: A snapshot of a Brazilian beach. Environmental Monitoring and Assessment 168, 299-304.
COSTA, M.F., SILVA-CAVALCANTI, J.S., BARBOSA, C.C., PORTUGAL, J.L., BARLETTA, M., 2011. Plastics buried in the inter-tidal plain of a tropical estuarine ecosystem. Journal of Coastal Research SI 64, 339-343.
CÓZAR, A., ECHEVARRIA, F., GONZALEZ-GORDILLO, J.I., IRIGOIEN, X., ÚBEDA, B., HERNÁNDEZ-LÉON, S., PALMA, A.T., NAVARRO, S., GARCÍA-DE-LOMAS, J., RUIZ, A., FERNÁNDEZ-DE-PUELLES, M.L., DUARTE, C.M., 2014. Plastic debris in the open ocean. PNAS 111, 10239-10244.
CUSSON, M., TREMBLAY, R., DAIGLE, G., ROUSSY, M., 2005. Modeling the depuration potential of blue mussels (Mytilus spp.) in response to thermal shock. Aquaculture 250, 183-193.
DAVIDSON, T.M., 2012. Boring crustaceans damage polystyrene floats under docks polluting marine waters with microplastic. Marine Pollution Bulletin 64, 1821-1828.
DAVISON, P., ASCH, R.G., 2011. Plastic ingestion by mesopelagic fishes in the North Pacific Subtropical Gyre. Marine Ecology Progress Series 432, 173-180.
DE WILDE, P.A.W.J., BERGHUIS, E.M., 1979. Laboratory experiments on growth of juvenile lugworms, Arenicola marina. Netherlands Journal of Sea Research 13, 487-502.
DE WITTE, B., DEVRIESE, L., BEKAERT, K., HOFFMAN, S., VANDERMEERSCH, G., COOREMAN, K., ROBBENS, J., 2014. Quality assessment of the blue mussel (Mytilus edulis): Comparison between commercial and wild types. Marine Pollution Bulletin 85, 146-155.
DEBROT, A.O., TIEL, A.B., BRADSHAW, J.E., 1999. Beach Debris in Curaçao. Marine Pollution Bulletin 38, 795-801.
DECHO, A.W., LUOMA, S.N., 1991. Time-courses in the retention of food material in the bivalves Potamocorbula amurensis and Macoma balthica: significance to the absorption of carbon and chromium. Marine Ecology Progress Series 78, 303-314.
DEITCH, E.A., XU, D., NARUHN, M.B., DEITCH, D.C., LU, Q., MARINO, A.A., 1995. Elemental diet and IV-TPN-induced bacterial translocation is associated with loss of intestinal mucosal barrier function against bacteria. Annals of Surgery 221, 299-307.
DEFOSSEZ, J.-M., HAWKINS, A.J.S., 1997. Selective feeding in shellfish: size-dependent rejection of large particles within pseudofaeces from Mytilus edulis, Ruditapes philippinarum and Tapes decussatus. Marine Biology 129, 139-147.
DEKIFF, J.H., REMY, D., KLASMEIER, J., FRIES, E., 2014. Occurence and spatial distribution of microplastics in sediments from Norderney. Environmental Pollution 186, 248-256.
DENUNCIO, P., BASTIDA, R., DASSIS, M., GIARDINO, G., GERPE, M., RODRÍGUEZ, D., 2011. Plastic ingestion in Franciscana dolphins, Pontoparia blainvillei (Gervais and d'Orbigny, 1844), from Argentina. Marine Pollution Bulletin 62, 1836-1841.
DERONDE, B., 2007. The sediment dynamics along the Belgian shoreline, studied with airborne imaging spectroscopy and LIDAR (Doctoral thesis). Ghent University, Department Geology and Soil Science, Ghent, Belgium, p. 215.
DERRAIK, J.G.B., 2002. The pollution of the marine environment by plastic debris: a review. Marine Pollution Bulletin 44, 842-852.
DESFORGES, J.P.W., GALBRAITH, M., DANGERFIELD, N., ROSS, P.S., 2014. Widespread distribution of microplastics in subsurface seawater in the NE Pacific Ocean. Marine Pollution Bulletin 79, 94-99.

References
180
DESFORGES, J.-P., GALBRAITH, M., ROSS, P., 2015. Ingestion of Microplastics by Zooplankton in the Northeast Pacific Ocean. Archives of Environmental Contamination and Toxicology, in press.
DES RIEUX, A., RAGNARSSON, E.G.E., GULLBERG, E., PREAT, V., SCHNEIDER, Y.J., ARTURSSON, P., 2005. Transport of nanoparticles across an in vitro model of the human intestinal follicle associated epithelium. European Journal of Pharmaceutical Sciences 25, 455-465.
DEVRIESE, L.I., VAN DER MEULEN, M.D., MAES, T., BEKAERT, K., PAUL-PONT, I., FRÈRE, L., ROBBENS, J., VETHAAK, A.D., Microplastic contamination in brown shrimp (Crangon crangon, Linnaeus 1758) from coastal waters of the Southern North Sea and Channel area. Marine Pollution Bulletin, in press.
DO SUL, J.A.I., SANTOS, I.R., FRIEDRICH, A.C., MATTHIENSEN, A., FILLMANN, G., 2011. Plastic Pollution at a Sea Turtle Conservation Area in NE Brazil: Contrasting Developed and Undeveloped Beaches. Estuaries and Coasts 34, 814-823.
DONEY, S.C., FABRY, V.J., FEELY, R.A., KLEYPAS, J.A., 2009. Ocean acidification: The other CO2 problem. Annual Review of Marine Science 1, 169-192.
DOYLE, M.J., WATSON, W., BOWLIN, N.M., SHEAVLY, S.B., 2011. Plastic particles in coastal pelagic ecosystems of the Northeast Pacific ocean. Marine Environmental Research 71, 41-52.
DUBAISH, F., LIEBEZEIT, G., 2013. Suspended microplastics and black carbon particles in the Jade system, southern North Sea. Water, Air & Soil Pollution 224, 1352.
DUBLINEAU, I., GRISON, S., GRANDCOLAS, L., BAUDELIN, C., TESSIER, C., SUHARD, D., FRELON, S., COSSONNET, C., CLARAZ, M., RITT, J., PAQUET, P., VOISIN, P., GOURMELON, P., 2006. Absorption, accumulation and biological effects of depleted uranium in Peyer’s patches in rats. Toxicology 227, 227-239.
DUBOIS, M., GILLES, K.A., HAMILTON, J.K., REBERS, P.A., SMITH, F., 1956. Colorimatric method for determination of sugars and related substances. Analytical Chemistry 28, 350-356.
EDYVANE, K.S., DALGETTY, A., HONE, P.W., HIGHAM, J.S., WACE, N.M., 2004. Long-term marine litter monitoring in the remote Great Australian Bight, South Australia. Marine Pollution Bulletin 48, 1060-1075.
EFSA, 2011. Use of the EFSA Comprehensive European Food Consumption Database in Exposure Assessment. EFSA Journal 9, 2097.
EFSA, 2015. Scientific opinion on the risks to public health related to the presence of bisphenol A (BPA) in foodstuffs: Executive summary. EFSA Journal 13, 3978.
ELDRIDGE, J.H., 1990. Controlled release in the gut-associated lymphoid tissues. I. Orally administered biodegradable microsphere target the Peyer's patches. Journal of Controlled Release 11, 205-214.
ELLEN MACARTHUR FOUNDATION, 2016. The New Plastic Economy. Rethinking the future of plastics. Ellem MacArthur Foundation, p. 120.
ENDO, S., TAKIZAWA, R., OKUDA, K., TAKADA, H., CHIBA, K., KANEHIRO, H., OGI, H., YAMASHITA, R., DATE, T., 2005. Concentration of polychlorinated biphenyls (PCBs) in beached resin pellets: Variability among individual particles and regional differences. Marine Pollution Bulletin 50, 1103-1114.
EPA, 1992. Plastic Pellets in the Aquatic Environment: Sources and Recommendations. Final Report. US EPA Oceans and Coastal Protection Division, p. 117.
ERIKSEN, M., LEBRETON, L.C.M., CARSON, H.S., THIEL, M., MOORE, C.J., BORERRO, J.C., GALGANI, F., RYAN, P.G., REISSER, J., 2014. Plastic Pollution in the World's Oceans: More than 5 Trillion Plastic Pieces Weighing over 250,000 Tons Afloat at Sea. PLoS ONE 9, e111913.
ERIKSEN, M., MASON, S., WILSON, S., BOX, C., ZELLERS, A., EDWARDS, W., FARLEY, H., AMATO, S., 2013. Microplastic pollution in the surface waters of the Laurentian Great Lakes. Marine Pollution Bulletin 77, 177-182.

References
181
ERIKSEN, M., MAXIMENKO, N.A., THIEL, M., CUMMINS, A., LATTIN, G.L., WILSON, S., HAFNER, J., ZELLERS, A.F., RIFMAN, S., 2013. Plastic pollution in the South Pacific subtropical gyre. Marine Pollution Bulletin 68, 71-76.
ERIKSSON, C., BURTON, H., 2003. Origins and biological accumulation of small plastic particles in fur seals from Macquarie Island. Ambio 32, 380-384.
EU-TGD, 2003. Technical guidance Document on Risk Assessment - Part II. Institute for Health and Consumer Protection, Luxembourg, p. 337.
FAO, 2012. FAO Yearbook – Fisheries and Aquaculture Statistics. Food and Agriculture Organization of the United Nations, Rome, p. 76.
FAO, 2014. The state of world fisheries and aquaculture 2014. Food and Agriculture Organization of the United Nations, Rome, p. 223.
FAO/WHO, 2001. Pesticide residues in food - 2000. Evaluations. Part II: Toxicology. Joint FAO/WHO Meeting on Pesticide Residues.
FARKE, H., DE WILDE, P.A.W.J., BERGHUIS, E.M., 1979. Distribution of juvenile and adult Arenicola marina on a tidal mud flat and the importance of nearshore areas for recruitment. Netherlands Journal of Sea Research 13, 354-361.
FARRELL, P., NELSON, K., 2013. Trophic level transfer of microplastics: Mytilus edulis (L.) to Carcinus maenas (L.). Environmental Pollution 177, 1-3.
FELDEN, J., LICHTSCHLAG, A., WENZHÖFER, F., DE BEER, D., FESEKER, T., POP RISTOVA, P., DE LANGE, G., BOETIUS, A., 2013. Limitations of microbial hydrocarbon degradation at the Amon Mud Volcano (Nile Deep Sea Fan). Biogeosciences Discussions 10, 335-370.
FENDALL, L.S., SEWELL, M.A., 2009. Contributing to marine pollution by washing your face: Microplastics in facial cleansers. Marine Pollution Bulletin 58, 1225-1228.
FETTWEIS, M., DU FOUR, I., ZEELMAEKERS, E., BAETEMAN, C., FRANCKEN, F., HOUZIAUX, J.-S., MATHYS, M., NECHAD, B., PISON, V., VANDENBERGH, N., VAN DEN EYNDE, D., VAN LANCKER, V., WARTEL, S., 2007. Mud Origin, Characterisation and Human Activies (MOCHA), Final Scientific Report, Belgian Science Policy Office, p. 59.
FISHER, V., ELSNER, N.O., BRENKE, N., SCHWABE, E., BRANDT, A., 2015. Plastic pollution of the Kuril-Kamchatka Trench area (NW Pacific). Deep Sea Research II 111, 399-405.
FISNER, M., TANIGUCHI, S., MOREIRA, F., BÍCEGO, M.C., TURRA, A., 2013. Polycyclic aromatic hydrocarbons (PAHs) in plastic pellets: Variabillity in the concentration and composition at different sediment depths in a sandy beach. Marine Pollution Bulletin 70, 219-226.
FLACH, E.C., BEUKEMA, J.J., 1994. Density-governing mechanisms in populations of the lugworm Arenicola marina on tidal flats. Marine Ecology Progress Series 115, 139-149.
FOGH, J., TREMPE, G., 1975. New human tumor cell lines. In: Human Tumor Cells In Vitro (J. Fogh, ed.), Plenum, New York, pp. 115-141.
FOEKEMA, E.M., DE GRUIJTER, C., MERGIA, M.T., VAN FRANEKER, J.A., MURK, A.J., KOELMANS, A.A., 2013. Plastic in North Sea fish. Environmental Science & Technology 47, 8818-8824.
FOSSI, M.C., PANTI, C., CUERRANTI, C., COPPOLA, D., GIANNETTI, M., MARSILI, L., MINUTOLI, C., 2012. Are baleen whales exposed to the threat of microplastics? A case study of the mediterranean fin whale (Balaenoptera physalus). Marine Pollution Bulletin 64, 2374-2379.
FREEL, R.W., HATCH, M., EARNEST, D.L., GOLDNER, A.M., 1983. Role of tight-junctional pathways in bile salt-induced increases in colonic permeability. The American Journal of Physiology 245, G816-G823.
FRIAS, J., SOBRAL, P., FERREIRA, A.M., 2010. Organic pollutants in microplastics from two beaches of the Portuguese coast. Marine Pollution Bulletin 60, 1988-1992.
FRIES, E., DEKIFF, J.H., WILLMEYER, J., NUELLE, M.T., EBERT, M., REMY, D., 2013. Identification of polymer types and additives in marine microplastic particles using pyrolysis-GC/MS and scanning electron microscopy. Environmental Science Processes & Impacts, 15, 1949-1956.

References
182
GALGANI, F., BURGEOT, T., BOCQUÉNÉ, G., VINCENT, F., LEAUTÉ, J.P., LABASTIE, J., FOREST, A., GUICHET, R., 1995. Distribution and abundance of debris on the continental shelf of the Bay of Biscay and in Seine Bay. Marine Pollution Bulletin 30, 58-62.
GALGANI, F., LEAUTE, J.P., MOGUEDET, P., SOUPLET, A., VERIN, Y., CARPENTIER, A., GORAGUER, H., LATROUITE, D., ANDRAL, B., CADIOU, Y., MAHE, J.C., POULARD, J.C., NERISSON, P., 2000. Litter on the Sea Floor Along European Coasts. Marine Pollution Bulletin 40, 516-527.
GALGANI, F., SOUPLET, A., CADIOU, Y., 1996. Accumulation of debris on the deep sea floor off the French Mediterranean coast. Marine Ecology Progress Series 142, 225-234.
GASPERI, J., DRIS, R., BONIN, T., ROCHER, V., & TASSIN, B., 2014. Assessment of floating plastic debris in surface water along the Seine River. Environmental Pollution 195, 163–166.
GESAMP, 1990. The state of the marine environment. Reports and Studies No. 39, UNEP, p. 128. GILLIGAN, M.R., PITTS, R.S., RICHARDSON, J.P., KOZEL, T.R., 1992. Rates of accumulation of marine debris
in Chatham County, Georgia. Marine Pollution Bulletin 24, 436-441. GNAIGER, E., 1983. Calculation of energetic and biochemical equivalents of respiratory oxygen
consumption., in: Gnaiger, E., Forstner, H. (Eds.), Polarographic Oxygen Sensors. Aquatic and Physiological Applications. Springer Verlag, Berlin, pp. 337-345.
GOLDBERG, E.D., 1997. Plasticizing the seafloor: An overview. Environmental Technology 18, 195-201. GOLDSTEIN, M.C., GOODWIN, D.S., 2013a. Gooseneck barnacles (Lepas spp.) ingest microplastic debris in
the North Pacific Subtropical Gyre. PeerJ, 10.7717/peerj.184. GOLDSTEIN, M.C., ROSENBERG, M., CHENG, L., 2012. Increased oceanic microplastic debris enhances
oviposition in an endemic pelagic insect. Biology Letters 8, 817-820. GOLDSTEIN, M.C., TITMUS, A.J., FORD, M., 2013b. Scales of spatial heterogeneity of plastic marine debris
in the Northeast Pacific Ocean. PLoS ONE 8, e80020. GOSLING, E.M., 2003. Bivalve Molluscs: Biology, Ecology and Culture. Oxford, UK: Blackwell Publishing
Ltd, p. 455. GOUIN, T., ROCHE, N., LOHMANN, R., HODGES, G., 2011. A Thermodynamic Approach for Assessing the
Environmental Exposure of Chemicals Absorbed to Microplastic. Environmental Science & Technology 45, 1466-1472.
GRAHAM, E.R., THOMPSON, J.T., 2009. Deposit- and suspension-feeding sea cucumbers (Echinodermata) ingest plastic fragments. Journal of Experimental Marine Biology and Ecology 368, 22-29.
GREENSTREET, S.P.R., 1995. Estimation of the daily consumption of food by fish in the North Sea in each quarter of the year. Scottish Fisheries Report, Number 55. Scottish Office of Agriculture, Aberdeen, p. 89.
GREGORY, M.R., 1977. Plastic pellets on New Zealand beaches. Marine Pollution Bulletin 8, 82-84. GREGORY, M.R., 1996. Plastic ‘scrubbers’ in hand cleansers: a further (and minor) source for marine
pollution identified. Marine Pollution Bulletin 32, 867–871. GREGORY, M.R., 2009. Environmental implications of plastic debris in marine settings-entanglement,
ingestion, smothering, hangers-on, hitch-hiking and alien invasions. Philosophical Transactions of the Royal Society B: Biological Sciences 364, 2013-2025.
GREGORY, M.R., RYAN, P.G., 1997. Pelagic plastic and other seaborne persistent synthetic debris: a review of Southern Hemisphere perspectives, in: Coe, J.M., Rogers, D.B. (Eds.), Marine debris - Sources, Impacts and Solutions. New York: Springer-Verlag, pp. 49-66.
HAEMER, J., GUTOW, L., KOEHLER, A., SABOROWSKI, R., 2014. The fate of microplastics in the marine isopod Idotea emarginata. Environmental Science & Technology 48, 13451-13458.
HALLING-SØRENSEN, B., NORS NIELSEN, S., LANZKY, P.F., INGERSLEV, F., HOLTEN LÜTZHØFT, H.C., JØRGENSEN, S.E., 1998. Occurrence, fate and effets of pharmaceutical substaces in the environment – A review. Chemosphere 36, 357-393.

References
183
HAMID, S.H., PRITCHARD, W., 1991. Mathematical modelling of weather-induced degradation of polymer properties. Journal of Applied Polymer Science 43, 651–678.
HART, M.W., 1991. Particle Captures and the Method of Suspension Feeding by Echinoderm Larvae. The Biological Bulletin 180, 12-27.
HAUCK, W., STANNERS, C.P., 2006. Control of carcinoembryonic antigen gene family expression in a differentiating colon carcinoma cell line, Caco-2. Cancer Research 51, 3526–3533.
HAUCK, M., HENDRIKS, A.J., HUIJBREGTS, M.A.J., KOELMANS, A.A, VAN DEN HEUVEL-GREVE, M.J., MOERMOND, C.T.A., VELTMAN, K., VETHAAK, A.D., 2007. Including sorption to black carbon to modelling bioaccumulation of polycyclic aromatic hydrocarbons: Uncertainty analysis and comparison with field data. Environmental Science & Technology 41, 2738-2744.
HAWKINS, A.J.S., BAYNE, B.L., 1984. Seasonal variation in the balance between physiological mechanisms of feeding and digestion in Mytilus edulis (Bivalvia: Mollusca). Marine Biology 82, 223-240.
HAWKINS, A.J.S., NAVARRO, E., IGLESIAS, J.I.P., 1990. Comparative allometries of gut-passage time, gut content and metabolic fecal loss in Mytilus edulis and Cerastoderma edule. Marine Biology 105, 197-204.
HELCOM, 2014. BASE project 2012-2014: Preliminary study on synthetic microfibers and particles at a municipal waste water treatment plant. Baltic Marine Environment Protection Commission, p. 17.
HENDRIKS, A.J., VAN DER LINDE, A., CORNELISSEN, G., SIJM, D.T.H.M., 2001. The power of size, Part 1: Rate constants and equilibrium ratios for accumulation of organic substances related to octanol-water partition ration and species weight. Environmental Toxicology and Chemistry 20, 1399-1420.
HEO, N.W., HONG, S.H., HAN, G.M., HONG, S., LEE, J., SONG, Y.K., JANG, M., SHIM, W.J., 2013. Distribution of small plastic debris in cross-section and high strandline on Heungnam Beach, South Korea. Ocean Science Journal 48, 225-233.
HESKETT, M., TAKADA, H., YAMASHITA, R., YUYAMA, M., ITO, M., GEOK, Y.B., OGATA, Y., KWAN, C., HECKHAUSEN, A., TAYLOR, H., POWELL, T., MORISHIGE, C., YOUNG, D., PATTERSON, H., ROBERTSON, B., BAILEY, E., MERMOZ, J., 2011. Measurement of persistent organic pollutants (POPs) in plastic resin pellets from remote islands: Towards establishment of background concentrations for International Pellet Watch. Marine Pollution Bulletin 64, 445-448.
HIDALGO-RUZ, V., THIEL, M., 2013. Distribution and abundance of small plastic debris on beaches in the SE Pacific (Chile): A study supported by a citizen science project. Marine Environmental Research 87-88, 12-18.
HINOJOSA, I.A., THIEL, M., 2009. Floating marine debris in fjords, gulfs and channels of southern Chile. Marine Pollution Bulletin 58, 341-350.
HIRAI, H., TAKADA, H., OGATA, Y., YAMASHITA, R., MIZUKAWA, K., SAHA, M., KWAN, C., MOORE, C., GRAY, H., LAURSEN, D., ZETTLER, E.R., FARRINGTON, J.W., REDDY, C.M., PEACOCK, E.E., WARD, M.W., 2011. Organic micropollutants in marine plastics debris from the open ocean and remote and urban beaches. Marine Pollution Bulletin 62, 1683-1692.
HUGO, E.R., BRANDEBOURG, T.D., WOO, J.G., LOFTUS, J., ALEXANDER, J.W., BEN-JONATHAN, N., 2008. Bisphenol A at environmentally relevant doses inhibits adiponectin release from human adipose tissue explants and adipocytes. Environmental Health Perspectives 116, 1642-1647.
HUSSAIN, N., JAITLEY, V., FLORENCE, A.T., 2001. Recent advances in the understanding of uptake of microparticulates across the gastrointestinal lymphatics. Advanced Drug Delivery Reviews 50, 107-142.
IMHOF, H.K., IVLEVA, N.P., SCHMID, J., NIESSNER, R., LAFORSCH, C., 2013. Contamination of beach sediments of a subalpine lake with microplastic particles. Current Biology 23, R867-R868.
ISLAM, S. & TANAKA, M., 2004. Impacts of pollution on coastal and marine ecosystems including coastal and marine fisheries and approach for management: A review and synthesis. Marine Pollution Bulletin 48, 624-649.

References
184
ISMAIL, A., ADILAH, N.M.B., NURULHUDHA, M.J., 2009. Plastic pellets along Kuala Selangor-Sepang coastline. Malaysian Applied Biology 38, 85-88.
IVAR DO SUL, J.A., COSTA, M.F., FILLMANN, G., 2014. Microplastics in the pelagic environment around oceanic islands of the Western Tropical Atlantic Ocean. Water, Air & Soil Pollution 225, 2004.
IVAR DO SUL, J.A., SPENGLER, Â., COSTA, M.F., 2009. Here, there and everywhere. Small plastic fragments and pellets on beaches of Fernando de Noronha (Equatorial Western Atlantic). Marine Pollution Bulletin 58, 1236-1238.
JAMBECK, J.R., GEYER, R., WILCOX, C., SIEGLER, T.R., PERRYMAN, M., ANDRADY, A., NARAYAN, R., LAW, K.L., 2015. Plastic waste inputs from land into the ocean. Science 347, 768-771.
JAYASIRI, H.B., PURUSHOTHAMAN, C.S., VENNILA, A., 2013. Quantitative analysis of plastic debris on recreational beaches in Mumbai, India. Marine Pollution Bulletin 77, 107-112.
JRC, 2010. European Union Risk Assessment Report: 4,4'-Isopropylidenediphenol (Bisphenol-A) - Part 1 Environment, Aschenberger, K., Munn, S., Olsson, H., Pakalin, S., Pellegrini, G., Vegro, S., Paya Perez, A.B. (Eds.), JRC Scientific and Technical Reports. Joint Research Centre - Institute for Health and Consumer Production, Luxembourg, p. 204.
KAPOSI, K.L., MOS, B., KELAHER, B., DWORJANYN, S.A., 2014. Ingestion of microplastics has limited impact on a marine larva. Environmental Science & Technology 48, 1638-1645.
KHRIPOUNOFF, A., VANGRIESHEIM, A., BABONNEAU, N., CRASSOUS, P., DENNIELOU, B., SAVOYE, B., 2003. Direct observation of intense turbidity current activity in the Zaire submarine valley at 4000 m water depth. Marine Geology 194, 151-158.
KIM, I.-S., CHAE, D.-H., KIM, S.-K., CHOI, S., WOO, S.-B., 2015. Factors Influencing the Spatial Variation of Microplastics on High-Tidal Coastal Beaches in Korea. Archives of Environmental Contamination and Toxicology, 1-11.
KING, F., PACKARD, T., 1975. Respiration and the activity of the respiratory electron transport system in marine zooplankton. Limnology and Oceanography 20, 849-854.
KLEIN, S., WORCH, E., KNEPPER, T.P., 2014. Occurrence and distribution of microplastics in river shore sediments of the Rhine-Main area in Germany. Environmental Science & Technology 49, 6070-6076.
KOELMANS, A.A., BESSELING, E., WEGNER, A., FOEKEMA, E.M., 2013a. Plastic as a carrier of POPs to aquatic organisms: A model analysis. Environmental Science & Technology 47, 7812-7820.
KOELMANS, A.A., BESSELING, E., WEGNER, A., FOEKEMA, E.M., 2013b. Correction to plastic as a carrier of POPs to aquatic organisms: A model analysis. Environmental Science & Technology 47, 8992-8993.
KOELMANS, A.A., BESSELING, E., FOEKEMA, E.M., 2014. Leaching of plastic additives to marine organisms. Environmental Pollution 187, 49-54.
KOOIJMAN, S.A.L.M., BEDAUX, J.J.M., 1996. Analysis of toxicity tests on fish growth. Water Research 30, 1633-1644.
KUBOTA, M., 1994. A mechanism for the accumulation of floating marine debris North of Hawaii. Journal of Physical Oceanography 24, 1059-1064.
KUKULKA, T., PROSKUROWSKI, G., MORET-FERGUSON, S., MEYER, D.W., LAW, K.L., 2012. The effect of wind mixing on the vertical distribution of bouyant plastic debris. Geophysical Research Letters 39, L07601.
LAIST, D.W., 1987. Overview of the biological effects of lost and discarded plastic debris in the marine environment. Marine Pollution Bulletin 18, 319-326.
LAIST, D.W., 1997. Impacts of marine debris: entanglement of marine life in marine debris including a comprehensive list of species with entanglement and ingestion records, in: Coe, J.M., Rogers, D.B. (Eds.), Marine Debris - Sources, Impacts and Solutions. New York: Springer-Verlag, pp. 99-139.

References
185
LAMPITT, R.S., BETT, B.J., KIRIAKOULAKIS, K., POPOVA, E.E., RAGUENEAU, O., VANGRIESHEIM, A., WOLFF, G.A., 2001. Material supply to the abyssal seafloor in the Northeast Atlantic. Progress in Oceanography 50, 27-63.
LATTIN, G.L., MOORE, C.J., ZELLERS, A.F., MOORE, S.L., WEISBERG, S.B., 2004. A comparison of neustonic plastic and zooplankton at different depths near the southern California shore. Marine Pollution Bulletin 49, 291-294.
LAW, K.L., MORET-FERGUSON, S., MAXIMENKO, N.A., PROSKUROWSKI, G., PEACOCK, E.E., HAFNER, J., REDDY, C.M., 2010. Plastic Accumulation in the North Atlantic Subtropical Gyre. Science 329, 1185-1188.
LAWRENCE, X.Y., CRISON, J.R., AMIDON, G.L., 1996. Compartmental transit and dispersion model analysis of small transit flow in humans. International Journal of Pharmaceutics 140, 111-118.
LAZAR, B., GRAČAN, R., 2011. Ingestion of marine debris by loggerhead sea turtles, Caretta caretta, in the Adriatic Sea. Marine Pollution Bulletin 62, 43-47.
LECHNER, A., KECKEIS, H., LUMESBERGER-LOISL, F., ZENS, B., KRUSCH, R., TRITTHART, M., GLAS, M., SCHLUDERMANN, E., 2014. The Danube so colourful: A potpourri of plastic litter outnumbers fish larvae in Europe's second largest river. Environmental Pollution 188, 177-181.
LEE, D., CHO, H., JEONG, S., 2006. Distribution characteristics of marine litter on the seabed of the East China Sea and the South Sea of Korea. Estuarine Coastal and Shelf Science 70, 187-194.
LEE, J.H., BANG, K.W., 2000. Characterization of urban stormwater runoff. Water Research 34, 1773-17808.
LEE, K.-W., SHIM, W.J., KWON, O.Y., KANG, J.-H., 2013. Size-dependent effects of micro polystyrene particles in the marine copepod Tigriopus japonicus. Environmental Science & Technology 47, 11278-11283.
LESLIE, H., MOESTER, M., DE KREUK, M. & VETHAAK, D., 2012. Verkennende studie naar lozing van microplastics door rwzi's. H2O 14/15, 45-47.
LESLIE, H.A., 2014. Review of microplastics in cosmetics. Report R14/29, IVM Institute for Environmental Studies, p. 33.
LEWIS, P.A., 2004. Organic Colorants, in: Charvat, R.A. (Ed.), Coloring of Plastics: Fundamentals. Hoboken, New Jersey: John Wiley & Sons, pp. 100-126.
LIEBEZEIT, G., DUBAISH, F., 2012. Microplastics in Beaches of the East Frisian Islands Spiekeroog and Kachelotplate. Bulletin of Environmental Contamination and Toxicology 89, 213-217.
LIMA, A.R.A., COSTA, M.F., BARLETTA, M., 2014. Distribution patterns of microplastics within the plankton of a tropical estuary. Environmental Research 132, 146-155.
LIN, H., GEBHARDT, M., BIAN, S., KWON, K.A., SHIM, C.K., CHUNG, S.J., KIM, D.D., 2007. Enhancing effect of surfactants on fexofenadine. HCl transport across the human nasal epithelial cell monolayer. International Journal of Pharmaceutics 330, 23–31.
LINNANE, A., BALL, B., MUNDAY, B., VAN MARLEN, B., BERGMAN, M., FONTEYNE, R., 2000. A review of potential techniques to reduce the environmental impact of demersal trawls, Irish Fisheries Investigation (New Series). Marine Institute Dublin, p. 39.
LOBELLE, D., CUNLIFFE, M., 2011. Early microbial biofilm formation on marine plastic debris. Marine Pollution Bulletin 62, 197-200.
LONG, M., MORICEAU, B., GALLINARI, M., LAMBERT, C., HUVET, A., RAFFRAY, J., SOUDANT, P., 2015. Interaction between microplastics and phytoplankton aggregates: Impacts on their respective fates. Marine Chemistry 175, 39-46.
LUSHER, A.L., MCHUGH, M., THOMPSON, R.C., 2013. Occurrence of microplastics in the gastrointestinal tract of pelagic and demersal fish from the English Channel. Marine Pollution Bulletin 67, 94-99.
LUSHER, A.L., BURKE, A., O’CONNOR, I., OFFICER, R., 2014. Microplastic pollution in the Northeast Atlantic Ocean: Validated and opportunistic sampling. Marine Pollution Bulletin 88, 325-333.

References
186
LUSHER, A.L., HERNANDEZ-MILIAN, G., O'BRIEN, J., BERROW, S., O'CONNOR, I., OFFICER, R., 2015. Microplastic and macroplastic ingestion by a deep diving, oceanic cetacean: The True's beaked whale Mesoplodon mirus. Environmental Pollution 199, 185-191.
Madara, J.L., 1998. Regulation of the movement of solutes across tight junctions. Annual Review of Physiology 60, 143-159.
MANTOVI, P., BALDONI, G., TODERI, G., 2005. Reuse of liquid, dewatered, and composted sewage sludge on agricultural land: effects of long-term application on soil and crop. Water Research 39, 289-296.
MARTINEZ-RIBES, L., BASTERRETXEA, G., PALMER, M., TINTORE, J., 2007. Origin and abundance of beach debris in the Balearic Islands. Scientia Marina 71, 305-314.
MARTINS, J., SOBRAL, P., 2011. Plastic marine debris on the Portuguese coastline: A matter of size? Marine Pollution Bulletin 62, 1649-1653.
MATHALON, A., HILL, P., 2014. Microplastic fibers in the intertidal ecosystem surrounding Halifax Harbor, Nova Scotia. Marine Pollution Bulletin 81, 69-79.
MATO, Y., ISOBE, T., TAKADA, H., KANEHIRO, H., OHTAKE, C., KAMINUMA, T., 2001. Plastic resin pellets as a transport medium for toxic chemicals in the marine environment. Environmental Science & Technology 35, 318-324.
MCDERMID, K.J., MCMULLEN, T.L., 2004. Quantitative analysis of small-plastic debris on beaches in the Hawaiian archipelago. Marine Pollution Bulletin 48, 790-794.
MCILGORM, A., CAMPBELL, H.F., RULE, M.J., 2011. The economic cost and control of marine debris damage in the Asia-Pacific region. Ocean & Coastal Management 54, 643-651.
MINTENIG, S., INT-VEEN, I., LÖDER, M., GERDTS, G., 2014. Mikroplastik in ausgewählten Kläranlagen des Oldenburgisch-Ostfriesischen Wasserverbandes (OOWV) in Niedersachsen. OOWV, p. 41.
MIZUKAWA, K., TAKADA, H., ITO, M., GEOK, Y.B., HOSODA, J., YAMASHITA, R., SAHA, M., SUZUKI, S., MIGUEZ, C., FRIAS, J., ANTUNES, J.C., SOBRAL, P., SANTOS, I.R., MICAELO, C., FERREIRA, A.M., 2013. Monitoring of a wide range of organic micropollutants on the Portuguese coast using plastic resin pellets. Marine Pollution Bulletin 70, 296-302.
MOGHIMIPOUR, E., AMERI, A., HANDALI, S., 2015. Absorption-enhancing effects of bile salts. Molecules 20, 14451-14473.
MOORE, C.J., 2008. Synthetic polymers in the marine environment: A rapidly increasing, long-term threat. Environmental Research 108, 131-139.
MOORE, C.J., MOORE, S.L., LEECASTER, M.K., WEISBERG, S.B., 2001. A Comparison of Plastic and Plankton in the North Pacific Central Gyre. Marine Pollution Bulletin 42, 1297-1300.
MORÉT-FERGUSON, S., LAW, K.L., PROSKUROWSKI, G., MURPHY, E.K., PEACOCK, E.E., REDDY, C.M., 2010. The size, mass, and composition of plastic debris in the western North Atlantic Ocean. Marine Pollution Bulletin 60, 1873-1878.
MORRIS, A.W., HAMILTON, E.I., 1974. Polystyrene spherules in the Bristol Channel. Marine Pollution Bulletin 5, 26-27.
MORRITT, D., STEFANOUDIS, P.V., PEARCE, D., CRIMMEN, O.A., CLARK, P.F., 2014. Plastic in the Thames: A river runs through it. Marine Pollution Bulletin 78, 196-200.
MOSMANN, T., 1983. Rapid colometric assay for cellular growth and survival: application to proliferation and cytotoxicity assays. Journal of Immunological Methods 65, 55-63.
Moyes, S.M., Smyth, S.H., Shipman, A., Long., S., Morris, J.F., Carr, K.E., 2007. Parameters influencing intestinal epithelial permeability and microparticle uptake in nitro. International Journal of Pharmaceutics 337, 133-141.
MSFD GES TECHNICAL SUBGROUP ON MARINE LITTER (TSG-ML), 2011. Technical recommendations for the implementation of MSFD requirements. European Commission, Brussels, p. 93.
MSFD GES TECHNICAL SUBGROUP ON MARINE LITTER (TSG-ML), 2013. Monitoring Guidance for Marine Litter in European Seas, Draft Report. European Commission, Brussels.

References
187
MURPHY, F., EWINS, C., QUINN, B., 2015, Waste water treatment plants as a source of microplastics in the aquatic environment. SETAC Europe 25th Annual Meeting, 4 – 7 May, Barcelona: Abstract nr 209.
MURRAY, F., COWIE, P.R., 2011. Plastic contamination in the decapod crustacean Nephrops norvegicus (Linnaeus, 1758). Marine Pollution Bulletin 62, 1207-1217.
NG, K.L., OBBARD, J.P., 2006. Prevalence of microplastics in Singapore’s coastal marine environment. Marine Pollution Bulletin 52, 761-767.
NOR, N.H.M., OBBARD, J.P., 2014. Microplastics in Singapore's coastal mangrove system. Marine Pollution Bulletin 79, 278-283.
NORÉN, F., 2007. Small plastic particles in coastal Swedish waters. KIMO Sweden Report, p. 11. NORÉN, F., NAUSTVOLL, L.-J., 2010. Survey of microscopic anthropogenic particles in Skagerrak.
Commissioned by KLIMA - Og Forurensningsdirektoratet, Oslo, Norway, p. 22. OECD, 1995. Guidance document for aquatic effects assessment. Organisation for economic cooperation
and development, Paris, France, p. 116. OEHLMANN, J., SCHULTE-OEHLMANN, U., KLOAS, W., JAGNYTSCH, O., LUTZ, I., KUSK, K.O.,
WOLLENBERGER, L., SANTOS, E.M., PAULL, G.C., VAN LOOK, K.J.W., TYLER, C.R., 2009. A critical analysis of the biological impacts of plasticizers on wildlife. Philosophical Transactions of the Royal Society B: Biological Sciences 364, 2047-2062.
OGATA, Y., TAKADA, H., MIZUKAWA, K., HIRAI, H., IWASA, S., ENDO, S., MATO, Y., SAHA, M., OKUDA, K., NAKASHIMA, A., MURAKAMI, M., ZURCHER, N., BOOYATUMANONDO, R., ZAKARIA, M.P., DUNG, L.Q., GORDON, M., MIGUEZ, C., SUZUKI, S., MOORE, C., KARAPANAGIOTI, H.K., WEERTS, S., MCCLURG, T., BURRES, E., SMITH, W., VAN VELKENBURG, M., LANG, J.S., LANG, R.C., LAURSEN, D., DANNER, B., STEWARDSON, N., THOMPSON, R.C., 2009. International Pellet Watch: Global monitoring of persistent organic pollutants (POPs) in coastal Waters. 1. Initial phase data on PCBs, DDTs, and HCHs. Marine Pollution Bulletin 58, 1437-1446.
OSPAR, 2010. Guideline for Monitoring Marine Litter on the Beaches in the OSPAR Maritime Area, OSPAR Commission, p. 83.
OTLEY, H., INGHAM, R., 2003. Marine debris surveys at Volunteer Beach, Falkland Islands, during the summer of 2001/02. Marine Pollution Bulletin 46, 1534-1539.
PEGRAM, J.E., ANDRADY, A.L., 1989. Outdoor weathering of selected polymeric materials under marine exposure conditions. Polymer Degradation and Stability 26, 333–345.
PLASTICSEUROPE, 2013. Plastics - the Facts 2013. An analysis of European latest plastics production, demand and waste data. Plastics Europe: Association of Plastic Manufacturers, Brussels, p. 40.
PLASTICSEUROPE, 2015. Plastics - the Facts 2014/2015. An analysis of European plastics production, demand and waste data. PlasticsEurope: Association of Plastic Manufacturers, Brussels, p. 34.
POWELL, J.J., FARIA, N., THOMAS-MCKAY, E., PELE, L.C., 2010. Origin and fate of dietary nanoparticles and microparticles in the gastrointestinal tract. Journal of Autoimmunity 34, J226-J233.
PRUTER, A.T., 1987. Sources, quantities and distribution of persistent plastics in the marine environment. Marine Pollution Bulletin 18, 305-310.
RAWN, D.F.K., FORSYTH, D.S., RYAN, J.J., BREAKELL, K., VERIGIN, V., NICOLIDAKIS, H., HAYWARD, S., LAFFEY, P., CONACHER, H.B.S., 2006. PCB, PCDD and PCDF residues in fin and non-fin fish products from the Canadian retail market 2002. Science of the Total Environment 359, 101-110.
RECH, S., MACAYA-CAQUILPÁN, V., PANTOJA, J.F., RIVADENEIRA, M.M., JOFRE MADARIAGA, D., THIEL, M., 2014. Rivers as a source of marine litter – A study from the SE Pacific. Marine Pollution Bulletin 82, 66-75.
REDDY, M.S., BASHA, S., ADIMURTHY, S., RAMACHANDRAIAH, G., 2006. Description of the small plastics fragments in marine sediments along the Alang-Sosiya ship-breaking yard, India. Estuarine Coastal and Shelf Science 68, 656-660.

References
188
REISSER, J., SHAW, J., WILCOX, C., HARDESTY, B.D., PROIETTI, M., THUMS, M., PATTIARATCHI, C., 2013. Marine plastic pollution in waters around Australia: Characteristics, concentrations, and pathways. PLoS ONE 8, e80466.
RETRAUBUN, A.S.W., DAWSON, M., EVANS, S.M., 1996. The role of the burrow funnel in feeding processes in the lugworm Arenicola marina (L.). Journal of Experimental Marine Biology and Ecology 202, 107-118.
RICCIARDI, A., BOURGET, E., 1998. Weight-to-weight conversion factors for marine benthic macroinvertebrates. Marine Ecology Progress Series 163, 245-251.
RIOS, L.M., MOORE, C., JONES, P.R., 2007. Persistent organic pollutants carried by Synthetic polymers in the ocean environment. Marine Pollution Bulletin 54, 1230-1237.
ROCHMAN, C.M., HOH, E., HENTSCHEL, B.T., KAYE, S., 2012. Long-Term Field Measurement of Sorption of Organic Contaminants to Five Types of Plastic Pellets: Implications for Plastic Marine Debris. Environmental Science & Technology 47, 1646-1654.
ROCHMAN, C.M., HOH, E., KUROBE, T., TEH, S.J., 2013. Ingested plastic transfers hazardous chemicals to fish and induces hepatic stress. Scientific Reports 3, 3263.
ROCHMAN, C.M., KUROBE, T., FLORES, I., TEH, S.J., 2014. Early warning signs of endocrine disruption in adult fish from the ingestion of polythylene with and without sorbed chemical pollutants from the marine environment. Science of the Total Environment 493, 656-661.
RUSCH, A., HUETTEL, M., 2000. Advective particle transport into permeable sediments - evidence from experiments in an intertidal sandflat. Limnology and Oceanography 45, 525-533.
RUTKOSWKA, M., HEIMOWSKA, A., KRASOWSKA, K., JANIK, H., 2002. Biodegradability of polyethylene starch blends in sea water. Polish Journal of Environmental studies 11, 267-274.
RYAN, P.G., 1988. The characteristics and distribution of plastic particles at the sea-surface off the southwestern Cape Province, South Africa. Marine Environmental Research 25, 249-273.
RYAN, P.G., CONNELL, A.D., GARDNER, B.D., 1988. Plastic ingestion and PCBs in seabirds: Is there a relationship? Marine Pollution Bulletin 19, 174-176.
RYAN, P.G., MOORE, C.J., VAN FRANEKER, J.A., MOLONEY, C.L., 2009. Monitoring the abundance of plastic debris in the marine environment. Philosophical Transactions of the Royal Society B: Biological Sciences 364, 1999-2012.
SAMBUY, Y., DE ANGELIS, I., RANALDI, G., SCARINO, M.L., STAMMATI, A., ZUCCO, F., 2005. The Caco-2 cell line as a model of the intestinal barrier: Influence of cell and culture-related factors on Caco-2 cell functional characteristics. Cell Biology and Toxicology 21, 1-26.
SANTOS, I., FRIEDRICH, A., IVAR DO SUL, J., 2009. Marine debris contamination along undeveloped tropical beaches from northeast Brazil. Environmental Monitoring and Assessment 148, 455-462.
SANTOS, H.A., RIIKONEN, J., SALONEN, J., MÄKILÄ, E., HEIKKILÄ, T., LAAKSONEN, T., PELTONEN, L., LEHTO, V.P., HIRVONEN, J., 2010. In vitro cytotoxicity of porous silicon microparticles: effect of the particle concentration, surface chemistry and size. Acta Biomaterialia 6, 2721-2731.
SETÄLÄ, O., FLEMING-LEHTINEN, V., LEHTINIEMI, M., 2014. Ingestion and transfer of microplastics in the planktonic food web. Environmental Pollution 185, 77-83.
SETH, R., MACKAY, D., MUNCKE, J., 1999. Estimating the organic carbon partition coefficient and its variability for hydrophobic chemicals. Environmental Science & Technology 33, 2390-2394.
SHAIKH, M.S.I., DERLE, N.D., BHAMBER., R., 2012. Permeability enhancement techniques for poorly permeable drugs: A review. Journal of Applied Pharmaceutical Science 2, 34-39.
SHAW, D.G., DAY, R.H., 1994. Colour- and form-dependent loss of plastic micro-debris from the North Pacific Ocean. Marine Pollution Bulletin 28, 39-43.
SHEAVLY, S., 2007. National Marine Debris Monitoring Program: Final Program Report, Data Analysis and Summary. Prepared for U.S. Environmental Protection Agency by Ocean Conservancy, Grant number X83053401-02., p. 76.

References
189
SHEAVLY, S., REGISTER, K., 2007. Marine Debris & Plastics: Environmental Concerns, Sources, Impacts and Solutions. Journal of Polymers and the Environment 15, 301-305.
SINGH, B., SHARMA, N., 2008. Mechanistic implications of plastic degradation. Polymer Degradation and Stability 93, 561-584.
SMOLDERS, R., BERVOETS, L., BLUST, R., 2002. Transplanted zebra mussels (Dreissena polymorpha) as active biomonitors in an effluent-dominated river. Environmental Toxicology and Chemistry 21, 1889-1896.
SONG, Y.K., HONG, S.H., JANG, M., KANG, J.-H., KWON, O.Y., HAN, G.M., SHIM, W.J., 2014. Large Accumulation of Micro-sized Synthetic Polymer Particles in the Sea Surface Microlayer. Environmental Science & Technology 48, 9014-9021.
SOUDANT, P., SUSSARELLU, R., FABIOUX, C., HÉGARET, H., LE GOÏC, N., LAMBERT, C., LONG, M., DANIEL, J.Y., QUILLIEN, V., QUÉRÉ, C., EPELBOIN, Y., MINGANT, C., PETTON, B., BAUD, D., QUÉAU, I., LE SOUCHU, P., MINER, P., DESBRUYERES, E., HUELVAN, C., LE DELLIOU, H., LE GALL, M.M., SEVERE, A., MAZURAIS, D., ZAMBONINO, J., POUVREAU, S., ROBERT, R., CORPOREAU, C., BOUDRY, P., HUVET, A., 2013. Micro-plastics, an emerging threat for cultivated bivalves? Presented at Aquaculture 2013, 21-25 February, Nashville, Tennessee.
STEFATOS, A., CHARALAMPAKIS, M., PAPATHEODOROU, G., FERENTINOS, G., 1999. Marine Debris on the Seafloor of the Mediterranean Sea: Examples from Two Enclosed Gulfs in Western Greece. Marine Pollution Bulletin 38, 389-393.
STRAND, J., LASSEN, P., SHASHOUA, Y., ANDERSEN, J.H., 2013. Microplastic particles in sediments from Danish waters. Poster at ICES Annual Conference, 23-27 September, Reykjavik, Iceland.
SUDHAKAR, M., TRISHUL, A., DOBLE, M., SURESH KUMAR, K., SYED JAHAN, S., INBAKANDAN, D., VIDUTHALAI, R.R., UMADEVI, V.R., SRIYUTHA MURTHY, P., VENKATESAN, R., 2007. Biofouling and biodegradation of polyolefins in ocean waters. Polymer Degradation and Stability 92, 1743-1752.
SUNDT, P., SCHULZE, P.-E., SYVERSEN, F., 2014. Sources of microplastics pollution to the marine environment. Norwegian Environment Agency Miljødirektoratet, Project M-321, p. 86.
SUSSARELLU, R., SOUDANT, P., LAMBERT, C., FABIOUX, C., CORPOREAU, C., LAOT, C., LE GOÏC, N., QUILLIEN, V., DANIEL, J.Y., BOUDRY, P., LONG, M., MINGANT, C., PETTON, B., MAES, T., VETHAAK, D., ROBBENS, J., HUVET, A., 2013. Microplastics: effects on oyster physiology at adult and larval stages, Presented at ICES Annual Conference, 23-27 September, Reykjavik, Iceland.
TANAKA, K., TAKADA, H., YAMASHITA, R., MIZUKAWA, K., FUKUWAKA, M., WATANUKI, Y., 2013. Accumulation of plastic-derived chemicals in tissues of seabirds ingesting marine debris. Marine Pollution Bulletin 69, 219-222.
TEUTEN, E.L., ROWLAND, S.J., GALLOWAY, T.S., THOMPSON, R.C., 2007. Potential for plastics to transport hydrophobic contaminants. Environmental Science & Technology 41, 7759-7764.
TEUTEN, E.L., SAQUING, J.M., KNAPPE, D.R.U., BARLAZ, M.A., JONSSON, S., BJORN, A., ROWLAND, S.J., THOMPSON, R.C., GALLOWAY, T.S., YAMASHITA, R., OCHI, D., WATANUKI, Y., MOORE, C., PHAM, H.V., TANA, T.S., PRUDENTE, M., BOONYATUMANOND, R., ZAKARIA, M.P., AKKHAVONG, K., OGATA, Y., HIRAI, H., IWASA, S., MIZUKAWA, K., HAGINO, Y., IMAMURA, A., SAHA, M., TAKADA, H., 2009. Transport and release of chemicals from plastics to the environment and to wildlife. Philosophical Transactions of the Royal Society B:Biological Sciences 364, 2027-2045.
THIEL, M., HINOJOSA, I., VÁSQUEZ, N., MACAYA, E., 2003. Floating marine debris in coastal waters of the SE-Pacific (Chile). Marine Pollution Bulletin 46, 224-231.
THOMPSON, R.C., 2006. Plastic debris in the marine environment: consequences and solutions, in: Krause, J.C., von Nordheim, H., Bräger, S. (Eds.), Marine Nature Conservation in Europe. Federal Agency for Nature Conservation, Stralsund, Germany, pp. 107-115.
THOMPSON, R.C., OLSEN, Y., MITCHELL, R.P., DAVIS, A., ROWLAND, S.J., JOHN, A.W.G., MCGONIGLE, D., RUSSELL, A.E., 2004. Lost at sea: Where is all the plastic? Science 304, 838-838.

References
190
THOMPSON, R.C., SWAN, S.H., MOORE, C.J., VOM SAAL, F.S., 2009. Our plastic age. Philosophicla Transactions of the Royal Society B: Biological Sciences 364, 1973-1976.
THOMPSON, R.C.; 2015. Microplastics in the marine environment: Sources, Consequences and Solutions. In: M. Bergman, et al. (eds.), Marine Anthropogenic Litter. Springer International Publishing, pp. 185-200.
TOCHÁČEK, J., VRÁTNÍČKOVÁ, Z., 2014. Polymer life-time prediction: The role of temperature in UV accelerated ageing of polypropylene and its copolymers. Polymer Testing 36, 82–87.
TREMBLAY, E., AUCLAIR, J., DELVIN, E., LEVY, E., MÉNARD, D., PSHEZHETSKY, A.V., RIVARD, N., SEIDMAN, E.G., SINNETT, D., VACHON, P.H., BEAULIEU, J.F., 2006. Gene expression profiles of normal proliferating and differentiating human intestinal epithelial cells: A comparison with the Caco-2 cell model. Journal of Cellular Biochemistry 99, 1175–1186.
TURNER, A., HOLMES, L., 2011. Occurrence, distribution and characteristics of beached plastic production pellets on the island of Malta (central Mediterranean). Marine Pollution Bulletin 62, 377-381.
TURRA, A., MANZANO, A.B., DIAS, R.J.S., MAHIQUES, M.M., BARBOSA, L., BALTHAZAR-SILVA, D., MOREIRA, F.T., 2014. Three-dimensional distribution of plastic pellets in sandy beaches: shifting paradigms. Scientific Reports 4, 4435.
UGOLINI, A., UNGHERESE, G., CIOFINI, M., LAPUCCI, A., CAMAITI, M., 2013. Microplastic debris in sandhoppers. Estuarine, Coastal and Shelf Science 129, 19-22.
UNEP, 2005. Marine Litter, an analytical overview. UNEP, Nairobi, p.58. UNEP, 2009. Marine litter: A global challenge. UNEP, Nairobi, p. 232. UNEP, 2009. UNEP/IOC Guidelines on Survey and Monitoring of Marine Litter, Regional Seas Reports
and Studies No.186, IOC Technical Series No. 83, p. 131. UNEP, 2015. Biodegradable plastics and marine litter: misconceptions, concerns, and impacts on marine Environments. UNEP, Nairobi, p. 38. VAN CAUWENBERGHE, L., VANREUSEL, A., MEES, J., JANSSEN, C.R., 2013. Microplastic pollution in deep-
sea sediments. Environmental Pollution 182, 495-499. VAN CAUWENBERGHE, L., JANSSEN, C.R., 2014. Microplastics in bivalves cultured for human consumption.
Environmental Pollution 193, 65-70. VAN CAUWENBERGHE, L., CLAESSENS, M., VANDEGEHUCHTE, M.B., JANSSEN, C.R., 2015. Microplastics are
taken up by mussels (Mytilus edulis) and lugworms (Arenicola marina) living in natural habitats. Environmental Pollution 199, 10-17.
VAN CAUWENBERGHE, L., DEVRIESE, L., GALGANI, F., ROBBENS, J., JANSSEN, C.R., 2015. Microplastics in sediments: A review of techniques, occurrence and effects. Marine Environmental Research, 111, 5-17.
VANDERMEERSCH, G., VAN CAUWENBERGHE, L., JANSSEN, C.R., MARQUES, A., GRANBY, K., FAIT, G., KOTTERMAN, M.J.J., DIOGÈNE, J., BEKAERT, K., ROBBENS, J., DEVRIESE, L., 2015. A critical view on microplastic quantification in aquatic organisms. Environmental Research, in press.
Van Dijk, J.E., Huisman, J., Koninkx, J.F.J.G., 2002. Structural and functional aspects of a healthy gastrointestinal tract. In: Blok, M.C., Vahl, H.A. et al. (Eds.), Nutrition and health of the gastrointestinal tract. Wageningen Academic Publishers, The Netherlands, p. 71-91;
VAN FRANEKER, J.A., BLAIZE, C., DANIELSEN, J., FAIRCLOUGH, K., GOLLAN, J., GUSE, N., HANSEN, P.L., HEUBECK, M., JENSEN, J.K., LE GUILLOU, G., OLSEN, B., OLSEN, K.O., PEDERSEN, J., STIENEN, E.W.M., TURNER, D.M., 2011. Monitoring plastic ingestion by the northern fulmar Fulmarus glacialis in the North Sea. Environmental Pollution 159, 2609-2615.
VAN LEEUWEN, S.P.J., DE BOER, J., 2008. Brominated flame retardants in fish and shellfish - Levels and contribution of fish consumption to dietary exposure of Dutch citizens to HBCD. Molecular Nutrition & Food Research 52, 194-203.

References
191
VAN VLAARDINGEN, P.L.A., TRAAS, T.P., WINTERSEN, A.M., ALDENBERG, T., 2004. ETX 2.0 - A program to calculate hazardous conentrations and fraction affected based on normally distributed toxicity data. RIVM, Expert Centre for Substances, p. 68.
VERSLYCKE, T., JANSSEN, C.R., 2002. Effects of a changing abiotic environment on the energy metabolism in the estuarine mysid shrimp Neomysis integer (Crustacea: Mysidacea). Journal of Experimental Marine Biology and Ecology 279, 61-72.
VIANELLO, A., BOLDRIN, A., GUERRIERO, P., MOSCHINO, V., RELLA, R., STURARO, A., DA ROS, L., 2013. Microplastic particles in sediments of Lagoon of Venice, Italy: First observations on occurrence, spatial patterns and identification. Estuarine, Coastal and Shelf Science 130, 54-61.
VICHAI, V., KIRTIKARA, K., 2006. Sulforhodamine B colorimetric assay for cytotoxicity screening. Nature protocols 1, 1112-1116.
VOLKHEIMER, 1975. Hematogenous dissemination of ingested polyvinyl chloride particles. Annals of the New York Academy of Science 246, 164-171.
VON MOOS, N., BURKHARDT-HOLM, P., KOEHLER, A., 2012. Uptake and effects of microplastics on cells and tissues of the blue mussel Mytilus edulis L. after experimental exposure. Environmental Science & Technology 46, 11327-11335.
WAGNER, M., SCHERER, C., ALVAREZ-MUÑOZ, D., BRENNHOLT, N., BOURRAIN, X., BUCHINGER, S., FRIES, E., GROSBOIS, C., KLASMEIER, J., MARTI, T., RODRIGUEZ-MOZAZ, S., URBATZKA, R., VETHAAK, A.D., WINTHER-NIELSEN, M., REIFFERSCHEID, G., 2014. Microplastics in freshwater ecosystems: what we know and what we need to know. Environmental Sciences Europe 26, 12.
WARD, J.E., SHUMWAY, S.E., 2004. Separating the grain from the chaff: particle selection in suspension- and deposit-feeding bivalves. Journal of Experimental Marine Biology and Ecology 300, 83-130.
WARNE, M.S.J., VAN DAM, R., 2008. NOEC and LOEC data should no longer be generated or used. Australasian Journal of Toxicology 14, 1-5.
WATTS, A.J.R., LEWIS, C., GOODHEAD, R.M., BECKETT, S.J., MOGER, J., TYLER, C.R., GALLOWAY, T.S., 2014. Uptake and Retention of Microplastics by the Shore Crab Carcinus maenas. Environmental Science & Technology 48, 8823-8830.
WEGNER, A., BESSELING, E., FOEKEMA, E.M., KAMERMANS, P., KOELMANS, A.A., 2012. Efects of nanopolystyrene on the feeding behavior of the blue mussel (Mytilus edulis L.). Environmental Toxicology and Chemistry 31, 2490-2497.
WERTHER, J., OGADA, T., 1999. Sewage sludge combustion. Progress in Energy and Combustion Science 25, 55-116.
WHITING, S.D., 1998. Types and sources of marine debris in Fog Bay, Northern Australia. Marine Pollution Bulletin 36, 904-910.
WHO, 2003. Polychlorinated biphenyls: Human health aspects. Concise International Chemical Assessment Document 55. World Health Organization, Geneva, p. 64.
WIDMER, W.M., HENNEMANN, M.C., 2010. Marine Debris in the Island of Santa Catarina, South Brazil: Spatial Patterns, Composition, and Biological Aspects. Journal of Coastal Research 26, 993-1000.
WILBER, R.J., 1987. Plastics in the North Atlantic. Oceanus 30, 61-68. WILLOUGHBY, N.G., SANGKOYO, H., LAKASERU, B.O., 1997. Beach litter: an increasing and changing
problem for Indonesia. Marine Pollution Bulletin 34, 469-478. WORM B., 2015. Silent spring in the sea. PNAS 112, 11752-11753; WRIGHT, S.L., ROWE, D., THOMPSON, R.C., GALLOWAY, T.S., 2013a. Microplastic ingestion decreases
energy reserves in marine worms. Current Biology 23, R1031-R1033. WRIGHT, S.L., THOMPSON, R.C., GALLOWAY, T.S., 2013b. The physical impact of microplastics on marine
organisms: A review. Environmental Pollution 178, 483-492.

References
192
YONKOS, L.T., FRIEDEL, E.A., PEREZ-REYES, A.C., GHOSAL, S., ARTHUR, C.D., 2014. Microplastics in Four Estuarine Rivers in the Chesapeake Bay, U.S.A. Environmental Science & Technology 48, 14195-14202.
ZALASIEWICZ, J., WATERS, C.N., IVAR DO SUL, J.A., CORCORAN, P.L, BARNOSKY, A.D. ,CEARRETA, A., EDGEWORTH, M., GAŁUSZKA, A., JEANDEL, C., LEINFELDER, R., MCNEILL, J.R., STEFFEN, W., SUMMERHAYES, C., WAGREICH, M., WILLIAMS, M., WOLFE, A.P., YONAN, Y, (2016). The geological cycle of plastics and their use as a stratigraphic indicator of the Anthropocene. Anthropocene (in press).
ZETTLER, E.R., MINCER, T.J., AMARAL-ZETTLER, L.A., 2013. Life in the “Plastisphere”: Microbial Communities on Plastic Marine Debris. Environmental Science & Technology 47, 7137-7146.
ZHAO, S., ZHU, L., WANG, T., LI, D., 2014. Suspended microplastics in the surface water of the Yangtze Estuary System, China: First observations on occurrence, distribution. Marine Pollution Bulletin 86, 562-568.
ZHOU, P., HUANG, C., FANG, H., CAI, W., LI, D., LI, X., YU, H., 2011. The abundance, composition and sources of marine debris in coastal seawaters or beaches around the northern South China Sea (China). Marine Pollution Bulletin 62, 1998-2007.
ZITKO, V., HANLON, M., 1991. Another source of pollution by plastics: Skin cleaners with plastic scrubbers. Marine Pollution Bulletin 22, 41-42.
ZURCHER, N.A., 2009. Small plastic debris on beaches in Hong Kong: an initial investigation. Master thesis submitted at Hong Kong University, Hong Kong, p. 75.

193
SUMMARY

Summary
194
Plastics are present in every aspects of our everyday life. The combination of properties such as its versatility, light weight, strength and durability, have made plastic a very popular material for use in a myriad of applications. Their widespread use has driven the annual global production from 1.7 million tonnes (MT) in the 1950s to 299 MT in 2013. Although the societal benefits of plastic are undeniable, there are serious environmental concerns associated with it. One aspect of this is microplastic pollution. Plastics are present in the environment in a wide variety of sizes, but the smallest form is called microplastic, and comprises a heterogeneous mixture of plastic particles ranging in size from several millimetres to a few micrometres. These microplastics are present in the environment as ‘microplastics by design’, so-called primary microplastics, or arise from the degradation of larger plastic litter. While the former are typically resin pellets and microbeads associated with industrial spillages and the use of cosmetics, the latter (or secondary microplastics) are formed through the action of degrading forces such as UV radiation and physical abrasion. Another important source comprises fibres originating from synthetic clothing.
The presence of these microplastics has been demonstrated in different marine compartments worldwide such as inter- and subtidal sediments and in (sub)surface waters. Because of their small dimensions, microplastics have a similar size range as planktonic organisms and other suspended particles, making them available to an array of marine invertebrates commonly not affected by larger marine debris. The potential for ingestion and potential associated (adverse) effects have resulted in the recognition of microplastics as contaminants of concern. This type of pollution is, however, scarcly regulated in terms of production, use and emissions neither in Europe nor in the rest of the world. Although there is an increasing number of studies available on the presence and potential effects of microplastic pollution and it is likely that the amount of microplastics in the oceans will continue to increase in the future, so far no real risk assessment of present and future risks of microplastic to marine systems and human health has been performed. Therefore, the main aim of this thesis was to perform a assessment of the environmental and human health risks associated with microplastic pollution using both data generated during this thesis as well as those available in literature.
While the main theme of this dissertation was the marine environment, we started off in the freshwater environment, more specifically a river, as they are often considered major contributors of microplastics to the marine environment. In Chapter 2, we therefore investigated the occurrence and distribution of microplastics in sediment of the Belgian Scheldt river. These sediments showed high spatial variability in microplastic abundance, with the highest concentrations detected in the vicinity of suspected point

Summary
195
sources, i.e. a plastic production plant in the harbour of Antwerp and a sewage treatment plant (STP) near Ghent. Near these facilities, sediment microplastic abundances were up to 10 times higher those observed at other sampling stations, indicating an important contribution of these land-based point sources to environmental microplastic abundances. In fact, at the majority of sampling locations, microplastic abundances were higher than those reported for marine compartments. The sewage treatment plant (STP) discharging directly into the river was investigated in more detail, since a lot of household and industrial applications will generate microplastics that are discharged together with the domestic and industrial sewage. Our findings confirm the results of previous pilot projects: sewage contains large amounts of microplastics, which are insufficiently removed during the sewage treatment process. As a result, large amounts of microplastics are discharged into the environment on a daily basis. With this initial assessment of river sediments, we were able to identify important point sources of microplastics and demonstrate the magnitude of microplastic pollution in rivers.
In Chapter 3, a comprehensive assessment of marine litter in three environmental compartments of Belgian coastal waters was performed to establish a baseline for future marine litter monitoring and research. Although microplastic pollution is not as obvious as macrolitter, it represents an important part of the overall plastic pollution problem. While at Belgian beaches macroplastics are dominant with respect to total weight, this relationship shifts towards a dominance of microplastic at the sea surface and especially on the seafloor. On the beach, the weight of macroplastic litter is over an order of magnitude higher than that of microplastics. On the Belgian Continental Shelf (BCS), micro- and macroplastics represent the same weight fraction at the sea surface, while on the seafloor there is a kilogram of macroplastics for every 400 kg of microplastics.
In Chapter 4, the techniques used to assess microplastic abundance in Chapter 3 were applied on deep-sea sediments, in the first ever assessment of microplastic pollution of the deep sea. In this way, we established that microplastic presence in sediments is not only limited to accumulation hot spots such as the continental shelf, but that they are also ubiquitously present in some of the most remote of marine environments, the deep sea (up to 4800 m depth). Microplastic concentrations observed here were substantially lower than those observed on the BCS. Nonetheless, our findings demonstrate that microplastic pollution has spread throughout the world’s seas and oceans, and has reached remote and largely unknown environments such as the deep sea
In the first part of this dissertation, we demonstrated that microplastics are ubiquitously present in the marine environment, and this a wide variety of marine compartments and systems. Because of their small dimensions (ranging from a few

Summary
196
micrometres up to five millimetres) microplastics represent a collection of particles that are of particular, biological, interest: since they are within the same size range as small particulate matter, they can be taken up by marine biota, especially invertebrates. These invertebrates often represent the lower levels of marine food webs, and are hence of great importance to marine systems.
In Chapter 5, we studied the uptake of microplastics under field conditions, i.e. in organisms exposed to ambient microplastic concentrations. The two species under investigation, the blue mussel Mytilus edulis and the lugworm Arenicola marina, represented two different feeding strategies: while the bivalve species is a filter feeder, the polychaete was representative of a deposit feeding strategy. Although exposed to environmental concentrations of microplastics, which are thousands of times lower than those used in laboratory trails investigating microplastic ingestion in these species, microplastics were detected in all organisms collected in the field. The observed microplastic body burdens in these animals were, however, relatively low (less than 1 particle per gram of tissue). Yet, the accumulation of microplastics in these animals could result in the transfer of these particles to higher trophic level organisms.
In a subsequent proof-of-principle laboratory experiment the potential (adverse) effects of microplastic exposure and ingestion on the organisms’ energy metabolism (cellular energy allocation) was assessed. Although organisms were exposed to high concentrations of microplastics, no significant adverse effects on the organisms’ overall energy budget were observed.
As seafood, including shellfish such as mussels, is consumed by humans worldwide, the presence of marine microplastics in “naturally exposed” species indicates a risk to human health and food safety. In Chapter 6, we therefore extended the assessment of microplastic accumulation in natural systems to include two species of economic interest: the commercially grown bivalves Mytilus edulis and Crassostrea gigas. In accordance with the findings of chapter 5, microplastics were recovered from the soft tissues of both bivalve species grown for human consumption. These results hence indicate that, through the consumption of shellfish, microplastics will end up in the human food chain. Based on consumption data obtained from the European Food Safety Authority (EFSA), it was calculated that European shellfish consumers will ingest between 1,800 and 11,000 microplastics per year, depending on whether they are minor or top shellfish consumers.
The implications of this presence of microplastics in seafood, i.e. whether there truly is a risk to human food safety, were investigated in the Chapter 7. Assessing possible (adverse) effects of microplastic ingestion to humans consuming contaminated seafood, was achieved using the intestinal cell line Caco-2. While no cytotoxic effects were observed in the intestinal cells exposed to microplastics, we did observe translocation of

Summary
197
the particles. Already in the first hour after administering the microplastics, a small fraction could be observed on the basal side of the cells, indicating transport of the particles through the epithelial monolayer. Based on the average concentration of microplastics in and the average consumption of shellfish in humans, we calculated that 3 to 60 microplastics will translocate to the underlying circulatory system on an annual basis. However, we are still unable to assess the adverse effects of this translocation, as data are currently lacking in literature.
Finally, all aspects of microplastic pollution investigated in the previous chapters were integrated into a risk assessment. Indeed, while it is often stated that microplastics pose a risk to the marine environment, this has never been thoroughly assessed. The risk assessment, performed in Chapter 8, suggests that current microplastic levels (i.e. anno 2015) are of minor concern to marine systems. Concentrations of pelagic microplastics do not appear to constitute any risk to biota living in the water column. However, in sediments, microplastics can reach very high levels, especially in highly impacted coastal areas (e.g. industrial harbours). Here, we demonstrated that these current microplastic concentrations already exceed safe, predicted no effect concentrations (PNEC), indicating there is a risk for biota inhabiting these sediments. By the end of the century, we predict an 60-fold increase in total microplastic abundances. While we see this increase in all marine compartments studied, only highly impacted sediments (this time both coastal and deep-sea sediments) will exceed the predicted safe level by 2100.
With regards to human health, we can state that microplastic ingestion through the consumption of contaminated shellfish will not pose significant risks. Current and future (i.e. 2015 vs. 2100) ingestion patterns in individuals consuming shellfish will not bring about significant health risks. Neither direct effects on intestinal cells nor any indirect effects associated with chemicals transported from plastic to shellfish for human consumption were identified. However, it has to be mentioned that currently toxicity data regarding the (adverse) effects associated with translocated microplastics in humans (and other vertebrates) are lacking.
Although still very preliminary, the risk assessment presented here gives the indication that microplastics may not be as harmful as previously thought. Yet, we stress that the lack of an apparent risk associated with microplastic pollution should never be considered a safe conduct to continue our present attitude towards plastic and plastic management. It would be immensely irresponsible and negligent to seize the apparent (current) lack of adverse impacts associated with microplastics to give up on the efforts made and to be made to reduce this type of pollution.


199
SAMENVATTING

Samenvatting
200
Plastics maken deel uit van ons alledaagse leven. Een gunstige combinatie van eigenschappen zoals hun veelzijdigheid, sterkte, lichte gewicht en duurzaamheid maken van plastic een zeer populair materiaal voor een groot aantal toepassingen. Het wijdverspreide gebruik van plastic heeft de jaarlijkse globale productie gedreven, van 1.7 miljoen ton in de jaren ’50 tot 299 miljoen ton in 2013. Hoewel de voordelen van plastic niet te ontkennen zijn, is er een serieuze vervuilingsproblematiek mee gemoeid. Eén specifiek aspect van deze vervuiling zijn de microplastics. Plastic in het milieu kan een weide range aan groottes aannemen en de kleinste vorm hiervan zijn de zogenaamde microplastics. Deze omvatten een heterogene mengeling van verschillende plastic partikels die variëren in grootte van enkele millimeters tot een paar micrometer. Deze microplastics zijn aanwezig in het milieu als primaire (“microplastics-by-design”) of secundaire microplastics. Deze laatste ontstaan door de degradatie van groter plastic afval, onder de invloed van degraderende krachten zoals UV-straling en wrijving. De primaire microplastics daarentegen omvatten voornamelijk industriële pellets en “microbeads” die in het milieu terechtkomen door industriële verliezen en via huishoudelijk afvalwater.
De aanwezigheid van deze microplastics in het milieu werd reeds meerdere malen aangetoond voor verschillende mariene compartimenten: de inter- en subtidale sedimenten en de waterkolom. Door hun kleine afmetingen – microplastics vallen in dezelfde grootteorde als plankton en ander gesuspendeerd materiaal – zijn ze beschikbaar voor opname door een breed scala aan mariene invertebraten die over het algemeen niet beïnvloed worden door groot marien afval. De opname van microplastics en de daarmee geassocieerde (negatieve) effecten hebben ervoor gezorgd dat microplastics erkend worden als een “opkomende en zorgbarende contaminant”. De productie, het gebruik en de emissies van microplastics zijn, helaas, amper gereguleerd, zowel in Europa als andere delen van de wereld. Er is een steeds toenemend aantal studies beschikbaar die het voorkomen en de potentiele effecten van microplastic vervuiling beschrijven. Bovendien is het zeer waarschijnlijk dat het aantal microplastics in de oceanen in de toekomst enkel zal toenemen. Toch werd er tot nu toe nog nooit een grondige risico analyse (van huidige en toekomstige risico’s) van microplastic vervuiling uitgevoerd. Vandaar dat het hoofddoel van deze dissertatie het realiseren van zo een risico analyse was, gebruik makend van zowel de data die gedurende dit onderzoek gegenereerd werden als deze beschikbaar in de literatuur.
Hoewel het hoofdthema van deze thesis microplastics in het mariene milieu is, begonnen we in het zoetwater milieu, gezien wordt aangenomen dat rivieren een belangrijke bijdrage leveren aan mariene microplastic vervuiling. In Hoofdstuk 2 hebben we dan ook het voorkomen en de verspreiding van microplastics in het sediment van de

Samenvatting
201
Schelde (België) onderzocht. Deze sedimenten vertoonden een grote ruimtelijke variabiliteit, waarbij de hoogste concentraties aangetroffen werden in de nabijheid van vermoedelijke puntbronnen, namelijk een plastic producerend bedrijf in de haven van Antwerpen en een rioolwaterzuiveringsinstallatie (RWZI) in de buurt van Gent. In de nabijheid van deze installaties vertoonde het sediment concentraties die tot 10 maal hoger lagen dan deze waargenomen op de andere staalname locaties. De microplastic concentraties aangetroffen in deze rivier zijn bovendien beduidend hoger dan deze waargenomen in mariene sedimenten. De RWZI, die rechtstreeks in de Schelde loost, werd ook meer in detail onderzocht, aangezien heel wat industriële en huishoudelijke toepassingen microplastics genereren die dan via het afvalwater in de RWZI terechtkomen. Onze resultaten lijken deze van eerdere pilootprojecten te bevestigen: rioolwater bevat hoge concentraties aan microplastics, dewelke maar in zeer beperkte mate tijdens het waterzuiveringsproces verwijderd worden. Als een gevolg hiervan worden dagelijks miljoenen microplastics in het milieu geloosd. Met deze initiële evaluatie van rivier sedimenten konden we belangrijke microplastic bronnen identificeren en de omvang van microplastic vervuiling in rivieren aantonen.
In Hoofdstuk 3 werd een uitgebreide analyse van het mariene afval in drie compartimenten van het Belgisch mariene milieu uitgevoerd. Het doel hiervan was het vastleggen van een “baseline” voor toekomstig monitoring en onderzoek. Hoewel de aanwezigheid van microplastics niet zo overduidelijk is als dat van groot plastic afval, vertegenwoordigt het wel een belangrijk deel van de totale plastic vervuiling. Op Belgische stranden zijn macroplastics dominant, maar deze relatie verschuift naar een dominantie van microplastics aan het wateroppervlak en vooral op de zeebodem. Op het strand is het gewicht van macroplastic een grootteorde groter dan dat van microplastics. Op het Belgisch Continentaal Plat (BCP) vertegenwoordigen macro- en microplastics hetzelfde gewicht aan het watervlak. Echter, op de zeebodem vind je voor elke kilogram macroplastic zo’n 400 kg aan microplastics.
In Hoofdstuk 4 werd, voor het eerst ooit, de aanwezigheid van microplastics in de diepzee (tot 4800 m diepte) onderzocht. Met dit onderzoek wisten we aan te tonen dat microplastic vervuiling niet enkel gelimiteerd is tot hot spots, zoals het continentaal plat, maar dat microplastics ook alomtegenwoordig zijn in enkele van de meest afgelegen mariene systemen, de diepzee. De microplastic concentraties die we hier aantroffen waren wel aanzienlijk lager dan deze geobserveerd op het Belgisch Continentaal Plat. Deze resultaten tonen aan dat microplastics zich verspreid hebben doorheen de zeeën en oceanen, en zo reeds verafgelegen, grotendeels ongekende gebieden zoals de diepzee bereikt hebben.

Samenvatting
202
In het eerste deel van deze dissertatie konden we aantonen dat microplastics alomtegenwoordig zijn in het mariene milieu, en dit in een grote verscheidenheid aan mariene compartimenten en systemen. Door hun kleine afmetingen (variërend van enkele micrometers tot millimeters) vertegenwoordigen microplastics een verzameling partikels van bijzonder, biologisch, belang: aangezien ze zich in dezelfde grootteorde als klein particulair materiaal bevinden kunnen ze opgenomen worden door mariene biota, meer specifiek invertebraten. Deze invertebraten vertegenwoordigen vaak de lagere niveaus in het mariene voedsel web en zijn dus van groot belang voor mariene systemen.
In Hoofdstuk 5 onderzochten we de opname van microplastics in natuurlijke omstandigheden, dit wil zeggen, in organismen blootgesteld aan omgevingsconcentraties van microplastics. Twee soorten werden hiervoor onderzocht: de gewone mossel Mytilus edulis, die in de waterkolom leeft, en de wadpier Arenicola marina, die in het sediment terug te vinden is. Hoewel deze organismen in het milieu blootgesteld worden aan lage, natuurlijke concentraties (duizenden malen lager dan de concentraties die tijdens laboratorium testen gebruikt worden) werden microplastics in alle veldorganismen aangetroffen. De geobserveerde weefselconcentraties in deze dieren waren echter laag (minder dan 1 partikel per gram weefsel). Echter, deze accumulatie van microplastics in mariene organismen kan resulteren in de transfer van de partikels naar organismen hoger in de voedselketen.
In een daaropvolgend laboratorium experiment werden de potentiele (negatieve) effecten van de opname van microplastics op het energie metabolisme van deze twee soorten onderzocht. Hoewel de organismen werden blootgesteld aan hoge microplastic concentraties, werden er geen significante effecten op het totale energie budget van deze dieren opgemeten.
Aangezien zeevruchten, waaronder ook schelpieren zoals mossels, wereldwijd door mensen geconsumeerd worden, bestaat de kans dat de aanwezigheid van microplastics in deze “natuurlijk blootgestelde” organismen een risico voor de menselijke gezondheid vormen. In Hoofdstuk 6 werd daarom het voorkomen van microplastics in economisch belangrijke soorten onderzocht. De soorten waarin we in dit onderzoek geïnteresseerd waren zijn de mossel Mytilus edulis en de oester Crassostrea gigas. In overeenstemming met de resultaten uit het vorige hoofdstuk werden microplastics teruggevonden in de weefsels van beide soorten, gekweekt voor menselijke consumptie. Deze resultaten tonen aan dat, door de consumptie van schelpdieren, microplastics in de menselijke voedselketen terecht komen. Op basis van consumptie data van de European Food Safety Authority (EFSA) konden we berekenen dat Europese consumenten van schelpdieren jaarlijks tussen de 1,800 en 11,000 microplastics, afhankelijk van hun consumptiepatroon, zullen opnemen.

Samenvatting
203
De gevolgen van de aanwezigheid van microplastics in zeevruchten, meer bepaald het potentiële risico voor de voedselveiligheid, werd onderzocht in Hoofdstuk 7. Mogelijke (negatieve) effecten van de opname van microplastics op de menselijke gezondheid werden onderzocht met behulp van een menselijke intestinale cellijn genaamd Caco-2. Hoewel geen cytotoxische effecten gemeten werden in de intestinale cellen, werd er wel translocatie (dit is het transport van de microplastics doorheen de epitheliale monolaag) vastgesteld. Reeds in het eerste uur na de toediening worden microplastics aan de basale zijde van de cellen aangetroffen. Gebaseerd op de gemiddelde concentratie aan microplastics en de gemiddelde consumptie van schelpdieren werd berekend dat jaarlijks 3 tot 60 partikels zullen transloceren van de darm naar de onderliggende weefsels. Echter, de mogelijke effecten van dit transport op de menselijke gezondheid kunnen jammer genoeg nog niet ingeschat worden, wegens het ontbreken van toxiciteit data in de literatuur.
Alle aspecten van microplastic vervuiling die onderzocht werden in de vorige hoofdstukken, werden vervolgens geïntegreerd in een risico analyse. Deze risico analyse, uitgevoerd in Hoofdstuk 8, suggereert dat de huidige (anno 2015) microplastic concentraties in het mariene milieu slechts een gering risico inhouden. Concentraties van pelagische microplastics lijken geen risico in te houden voor biota die in de waterkolom leven. Echter, microplastics kunnen hoge concentraties bereiken in sedimenten, vooral in zwaar getroffen kustwateren zoals industriële havens. Voor deze sedimenten konden we aantonen dat huidige microplastic concentraties het vastgestelde veilige niveau overschrijden. Dit leidt tot de conclusie dat er reeds in 2015 een risico bestaat voor organismen die dit type van sediment bewonen. Tegen het einde van deze eeuw, in 2100, voorspellen we een toename in microplastic abundantie van 60 maal de huidige concentraties. Hoewel deze toename in alle mariene compartimenten zal plaatsvinden, zal ze enkel in het sediment van zwaar getroffen gebieden (dit maal zowel in kustwateren als in de diepzee) het veilige niveau overschrijden.
Voor de menselijke risico analyse kunnen we stellen dat de opname van microplastic via de consumptie van gecontamineerde zeevruchten geen significant gevaar vormt en ook niet zal vormen tegen 2100. Huidige en toekomstige consumptie patronen van individuen die schelpdieren consumeren zullen niet resulteren in risico’s voor de gezondheid. We verwachten geen directe effecten van blootstelling aan intestinale cellen noch indirecte effecten van de blootstelling aan chemicaliën geassocieerd met de plastic partikels. Het moet echter wel vermeld worden dat er nog steeds een groot tekort is aan toxiciteit data om de potentiële (negatieve) effecten van translocatie van opgenomen microplastics te beoordelen.

Samenvatting
204
Hoewel deze risico analyse nog steeds zeer preliminair is, geven de resultaten wel aan dat microplastics niet zo schadelijk zijn als eerder aangenomen. We leggen er wel de nadruk op dat het schijnbaar ontbreken van risico’s geassocieerd met microplastics nooit als een vrijgeleide beschouwd mag worden om onze huidige ingesteldheid rond plastic en plastic afval te behouden. Het zou onverantwoord en onachtzaam zijn om de reeds gemaakte en de nog te maken inspanningen voor het terugdringen van deze vorm van vervuiling op te geven.

205
DANKWOORD

Dankwoord
206
Ik heb lang (veel te lang) nagedacht over hoe ik dit dankwoord zou beginnen: ik wilde
een originele en inspirerende openingszin. Maar mijn inspiratie wilde niet meewerken en ik kwam steeds weer uit bij dezelfde clichés. Uiteindelijk heb ik de strijd opgegeven, want, als je er langer over nadenkt, wat is er eigenlijk mis met clichés? Niets. Het zijn net clichés, omdt ze steeds een kern van waarheid bevatten. En mijn openingscliché bevat wel meer dan enkel een kern van waarheid, het is de waarheid. Een, of misschien zelfs dé, universele wet van het doctoraatsonderzoek: “een doctoraat schrijf je nooit alleen”. Ook al staat mijn naam op de kaft van dit boek, vele anderen hebben mee bijgedragen, elk op hun eigen manier. Met ideeën, goede raad, steun en een luisterend oor.
Laat ik beginnen bij het begin, en een woordje van dank neerpennen voor de twee mensen die, als puntje bij paaltje komt, dit werkt mogelijk gemaakt hebben: Prof Colin Janssen en Dr Michiel Claessens. Beide hebben een belangrijke rol gespeeld in het tot stand komen van dit werk. Prof Janssen natuurlijk als het brein achter dit alles, en Michiel als diegene die de eerste stappen in dit microplastic onderzoek zette. Zijn eerste stappen hebben voor mij de weg geopend naar de “wondere wereld der microplastics”. Jammer genoeg heb ik zelf niet lang met Michiel heb kunnen samenwerken: zijn doctoraat liep ten einde toen ik met het mijne begon. Maar vooral die eerste maanden, toen hij zelf net een nieuwe job was begonnen, was hij een grote hulp voor mij. En Colin was natuurlijk zoveel meer dan enkel het wetenschappelijk mastermind achter dit project. Als promotor van dit onderzoek wist hij mij steeds weer uit te dagen en te motiveren om het onderste uit de kan te halen. Jij leidde mij door alle stappen van het onderzoek en verschafte mij de inzichten die ik nodig had om op eigen benen verder te gaan. Je gaf blijk van een rotsvast vertrouwen, het vertrouwen dat ik soms zelf miste. Dit alles heeft erg veel voor mij betekent, en ervoor gezorgd dat ik uiteindelijk toch wel trots ben op hetgeen ik gedurende die 4 jaar gepresteerd heb. Bedankt!
Mijn collega’s, die eigenlijk vrienden zijn, verdienen ook een vermelding in dit deeltje van mijn doctoraat. Mijn bureaugenootjes David, Olivier, Tara en natuurlijk Maarten, die mij er in die laatste maanden meermaals doorgesleurd hebben, met toffe babbels en ontspannende middagloopjes in het park. Maarten, jij bent een fantastische vriend die ik aan dit 4-jarige avontuur overgehouden heb! David, Karel van aan de overkant, en Charlotte, wij hebben 10 jaar lang hetzelfde traject afgelopen, beginnend bij de bachelor Biologie, en ik kijk er naar uit dit traject samen met jullie af te ronden. Charlotte, heel veel succes met je verdediging binnekort, en David en Karel heel veel succes met de laatste loodjes! Natuurlijk zijn er zoveel meer mensen die elk op hun manier een bijdrage

Curriculum vitae
207
hebben geleverd. Nancy, altijd paraat om te helpen met elk technisch en minder technisch probleem. Ik heb je misschien een paar grijze haren bezorgd (zo was er het labowagen-incident), maar je eewige glimlach en welwillendheid om te helpen zullen mij altijd bijblijven. Emmy, Leen, Gisèle, Jolien en Marc die ook steeds klaarstonden met praktische raad en daad. Michiel V, die inviel voor Michiel C, en mijn allereerste papers tot in de kleinste details nalas. Veerle die af en toe eens, in tijden van hoge nood een Chocotoff binnensmeet. Marianne en Sigrid, waar ik steeds terecht kon met administratieve vragen en als mijn bloedsuiker eens wat lager stond. Aan idereeen die deel uitmaakt van GhEnToxLab en AECO (veel te veel namen om allemaal op te noemen), jullie zijn zoveel meer dan zomaar ex-collega’s, en ik wil jullie allemaal bedanken voor de 4 fantastische jaren. Aan jullie allemaal: Bedankt!
En dan een speciaal woord van dank voor mijn familie. Bedankt voor jullie steun de afgelopen jaren, jullie oprechte intersse in mijn onderzoek en het soms vooral niét informeren naar de voortuitgang van mijn doctoraat. Mama, papa, Jolijntje en Jonathan, ik prijs mij gelukkig met jullie onvoorwaardelijke en niet aflatende liefde en steun. De vanzelfsprekendheid waarmee jullie mij steeds met raad en daad bijstaan en meeleven met alle belangrijke en minder belangrijke momenten in mijn leven is gewoon fantastisch. Bedankt!
En natuurlijk, Jens. Bedankt voor alle steun, van begin tot einde. Maar belangrijker is het vertrouwen dat je in me had toen het bij mezelf ontbrak. Zonder jouw steun en liefde was ik nooit zover gekomen. We zijn nu samen een nieuw avontuur begonnen, en ik geniet van elke seconde met jou samen in Amsterdam. Bedankt!
Tenslotte; ik weet dat velen dit deel van mijn doctoraat als eerste (en misschien zelfs als enige) lezen, en zich dan stiekem afvragen: “word ik genoemd?”. Mezelf kennende, weet ik dat ik zeker mensen vergeten ben, mensen die ik niet had willen vergeten. Dat je deze paragraaf nu leest, maak de kans groot dat je een van die mensen bent. Daarom, bij deze, speciaal voor jou: Bedankt!
Lisbeth


Curriculum vitae
209
CURRICULUM VITAE

Curriculum vitae
210
Personalia
Lisbeth Van Cauwenberghe Born 24th of April 1987, Gent (Belgium)
Education
2005-2008 Ghent University Bachelor of Science in Biology. Bachelor Dissertation: “Morphological study of the variation in individual and environmental quality in a population of great tits (Parus major)”
2008-2010 Ghent University Master of Science in Biology. Master Dissertation: “Small populations and inbreeding: effects on the dispersion and viability in a population of mites (Tetranychus urticae)”
2010-2011 Ghent University Subsequent Master of Science in Environmental Management and Sanitation. Master Dissertation: “Ingestion of microplastics by the mussel Mytilus edulis: study of the biological effects”
Professional employment
2011-2015 Ghent University PhD candidate (IWT scholarship) in Applied Biological Sciences. Department of Applied Ecology and Environmental Biology, Faculty of Bioscience Engineering
2015-Present Perrett Laver Senior Research Associate Higher Education and Research, Amsterdam
Publications
Peer-reviewed publications (A1)
Claessens, M., Van Cauwenberghe, L., Vandegehuchte, M.B., Janssen, C.R., 2013. New techniques for the detection of microplastics in sediments and field collected organisms. Marine Pollution Bulletin 70, 227-233.
Van Cauwenberghe, L., Claessens, M., Vandegehuchte, M.B., Mees, J., Janssen, C.R., 2013. Assessment of marine debris on the Belgian Continental Shelf. Marine Pollution Bulletin 73, 161-169.

Curriculum vitae
211
Van Cauwenberghe, L., Vanreusel, A., Mees, J., Janssen, C.R., 2013. Microplastic pollution in deep-sea sediments. Environmental Pollution 182, 495-499.
Van Cauwenberghe, L., Janssen, C.R., 2014. Microplastics in bivalves cultured for human consumption. Environmental Pollution 193, 65-70.
Van Cauwenberghe, L., Claessens, M., Vandegehuchte, M.B., Janssen, C.R., 2015. Microplastics are taken up by mussels (Mytilus edulis) and lugworms (Arenicola
marina) living in natural habitats. Environmental Pollution 199, 10-17.
Van Cauwenberghe, L., Devriese, L., Galgani, F., Robbens, J., Janssen, C.R., 2015. Microplastics in sediments: A review of techniques, occurrence and effects. Marine Environmental Research 111, 5-17.
Vandermeersch, G., Van Cauwenberghe, L., Janssen, C.R., Marques, A., Granby, K., Fait, G., Kotterman, M.J.J., Diogène, J., Bekaert, K., Robbens, J., Devriese, L., 2015. A critical view on microplastic quantification in aquatic organisms. Environmental Research 143, 46-55.
Other publications
Claessens, M., Van Cauwenberghe, L., Goffin, A., Dewitte, E., Braarup Cuyckens, A., Maelfait, V., Vanhecke, V., Mees, J., Stienen, E.W.M., Janssen, C.R., 2013. Assessment of Marine Debris on the Belgian Continental Shelf: Occurrence and Effects (AS-MADE). Belgian Science Policy 2009, Brussels, p. 68.
Van Cauwenberghe, L., De Rijcke, M., Borgå, K., Costa, M., de Lucia, G., Fossi, M.C., Galgani, F., Gerdts, G., Gomiero, A., Grøsvik, B.E., Halsband, C., Hanus, J., Herman, R., Herzke, D., Koelmans, A., Law, K.L., Leslie, H., Maes, T., Matiddi, M., Norén, F., Officer, R., Parmentier, K., Robbens, J., Salaverria, I., Schneider, R., Sobral, P., Thomas, K., Thompson, R., Mees, J., Janssen, C.R., 2015. Environmental (and human health) risk approach as an integrated framework to study the occurrence and effects of microplastics in the marine environment. Workshop report. VLIZ Special Publication, Oostende, p. 38.
Platform presentations (presenting author)
Van Cauwenberghe, L., Claessens, M., Janssen, C.R., 2012. Selective uptake of microplastics by a marine bivalve (Mytilus edulis). Presented at 12th VLIZ Young Marine Scientists’ Day 2012, 24 February 2012, Brugge, Belgium.
Van Cauwenberghe, L., Vandegehuchte, M.B., Claessens, M., Janssen, C.R., 2012. Occurrence of mciroplastics in mussels and lugworms collected along the French-

Curriculum vitae
212
Belgian-Dutch coast. Presented at SETAC Europe 22nd Annual Meeting/6th SETAC World Congress, 20-24 May 2012, Berlin, Germany.
Van Cauwenberghe, L., Claessens, M., Janssen, C.R., 2013. Selective uptake of microplastics by a marine bivalve (Mytilus edulis). Presented at 18th National Symposium on Applied Biological Sciences, 8 February 2013, Ghent, Belgium.
Van Cauwenberghe, L., Claessens, M., Vandegehuchte, M.B., Janssen, C.R., 2014. Microplastics are taken up by invertebrates living in natural habitats. Presented at MICRO International Workshop: Fate and impact of microplastics in marine ecosystems, 13-15 January 2014, Plouzané, France.
Van Cauwenberghe, L., Vanderniepen, P., Dierick, M., Van Hoorebeke, L., Janssen, C.R., 2013. Micro-CT as a novel and innovative technique in microplastic research. Presented at SETAC Europe 23rd Annual Meeting, 12-16 May 2013, Glasgow, United Kingdom.
Janssen, C.R., De Rycke, M., Van Cauwenberghe, L., 2014. Marine pollution along the East African coast: Problems and challenges. Presented at International workshop - Sustainable use of coastal and marine resources in Kenya: From research to societal benefits, 27-29 October 2014, Mombasa, Kenya.
Van Cauwenberghe, L., Claessens, M., Janssen, C.R., 2014. Microplastics in field collected and cultured bivalves. Presented at SETAC Europe 24th Annual Meeting, 11-15 May 2014, Basel, Switzerland.
Van Cauwenberghe, L., Claessens, M., Vandegehuchte, M.B., Mees, J., Janssen, C.R., 2014. Assessment of marine debris on the Belgian Continental Shelf. Presented at MICRO International Workshop: Fate and impact of microplastics in marine ecosystems, 13-15 January 2014, Plouzané, France.
Van Cauwenberghe, L., Janssen, C.R., 2014. Microplastics in shellfish cultured for human consumption. Presented at Mikroplastik in de Umwelt Konferenz, 1 July 2014, Cologne, Germany.
Van Cauwenberghe, L., Janssen, C.R., 2014. Microplastics in the marine environment and impacts on human consumption. Presented at 8th International Conference on Bio-based Materials, 14 April 2015, Cologne, Germany.
Van Cauwenberghe, L., Vanreusel, A., Mees, J., Janssen, C.R., 2014. Microplastics… One league under the sea! Presented at 14th VLIZ Young Marine Scientists’ Day 2014, 7 May 2014, Brugge, Belgium.
Van Cauwenberghe, L., Van Echelpoel, W., De Gussem, K., De Gueldre, G., Vandegehuchte, M.B., Janssen, C.R., 2015. Unraveling the sources of marine

Curriculum vitae
213
microplastics: your daily contribution? Presented at 15th VLIZ Young Marine Scientists’ Day 2015, 20 February 2015, Brugge, Belgium.
Poster presentations (presenting author)
Van Cauwenberghe, L., Claessens, M., Janssen, C.R., 2012. Selective uptake of microplastics by marine bivalve (Mytilus edulis). Presented at SETAC Europe 22nd Annual Meeting/6th SETAC World Congress, 20-24 May 2012, Berlin, Germany.
Van Cauwenberghe, L., Claessens, M., Vandegehuchte, M.B., Janssen, C.R., 2012. Occurrence of microplastics in Mytilus edulis and Arenicola marina collected along the French-Belgian-Dutch coast. Presented at 12th VLIZ Young Marine Scientists’ Day 2012, 24 February 2012, Brugge, Belgium.
Van Cauwenberghe, L., Vandegehuchte, M.B., Claessens, M., Janssen, C.R., 2012. Plastic waste in Belgian coastal waters and field collected marine invertebrates. Presented at LITTORAL 2012 – Coasts of Tomorrow, 27-29 November 2012, Ostend, Belgium.
Van Cauwenberghe, L., Vandegehuchte, M.B., Claessens, M., Janssen, C.R., 2013. Selective uptake of microplastics by marine bivalve (Mytilus edulis). Presented at 17th Pollutant Responses in Marine Organisms (PRIMO) Congress, 5-8 May 2013, Faro, Portugal.
Van Cauwenberghe, L., Claessens, M., Janssen, C.R., 2014. Microplastics on our plate, also in our shops... Presented at 14th VLIZ Young Marine Scientists’ Day 2014, 7 May 2014, Brugge, Belgium.
Van Cauwenberghe, L., Vanreusel, A., Mees, J., Janssen, C.R., 2014. Microplastic pollution in deep-sea sediments. Presented at MICRO International Workshop: Fate and impact of microplastics in marine ecosystems, 13-15 January 2014, Plouzané, France.
Van Cauwenberghe, L., Van Echelpoel, W., De Gussem, K., De Gueldre, G., Vandegehuchte, M.B., Janssen, C.R., 2015. Microplastics in a biological wastewater treatment plant and the receiving freshwater environment in Flanders, Belgium. Presented at SETAC Europe 25th Annual Meeting, 3-7 May 2015, Barcelona, Spain.
Awards
Tom Feijtel Best Poster Award at the SETAC Europe 22nd Annual Meeting/6th SETAC World Congress 20-24 May 2012, Berlin, Germany for the paper “Selective

Curriculum vitae
214
uptake of microplastics by a marine bivalve (Mytilus edulis)” Van Cauwenberghe, L., Vandegehuchte, M.B., Claessens, M., Janssen, C.R.
Second place Best Platform Presentation at the 12th VLIZ Young Marine Scientists’ Day 2012, 24 February 2012, Brugge, Belgium with the presentation “Selective uptake of microplastics by a marine bivalve (Mytilus edulis)” Van Cauwenberghe, L., Claessens, M., Janssen, C.R.
Second place Best Platform Presentation at the 15th VLIZ Young Marine Scientists’ Day 2015, 20 February 2015, Brugge, Belgium with the presentation “Unravelling the sources of marine microplastics: your daily contribution?” Van Cauwenberghe, L., Van Echelpoel, W., De Gussem, K., De Gueldre, G., Vandegehuchte, M.B., Janssen, C.R.
Memberships of scientific communities
Member of the Society of Environmental Toxicology and Chemistry (SETAC) since 2012.
Educational activities: Tutoring master students
Hanne De Graeve, 2011-2012. Microplastics in het mariene milieu: Vectoren voor toxische stoffen? Master in de Bio-ingenieurswetenschappen: Milieutechnologie, Faculty of Bioscience Engineering, Ghent University. Promotor: Colin R. Janssen; Tutor: Lisbeth Van Cauwenberghe.
Wout Van Echelpoel, 2012-2013. Micro-CT als innovatieve visualisatietechniek van microplastics in mariene organismen. Master in de Bio-ingenieurswetenschappen: Milieutechnologie, Faculty of Bioscience Engineering, Ghent University. Promotor: Colin R. Janssen; Tutor: Lisbeth Van Cauwenberghe.
Piepezi Priso Mbape, 2013-2014. Occurrence of microplastics in organisms and sediments originating from two hot-spot locations: The Ebro (Spain) and Tagus (Portugal) Estuary. Master in Environmental Sanitation, Faculty of Bioscience Engineering, Ghent University. Promotor: Colin R. Janssen; Tutor: Lisbeth Van Cauwenberghe.
Maureen Eyoug Enow, 2013-2014. Occurrence of microplastics in organisms and sediments originating from two hot-spot locations The Po estuary (Italy) and Southern North Sea (Belgium). Master in Environmental Sanitation, Faculty of Bioscience Engineering, Ghent University. Promotor: Colin R. Janssen; Tutor: Lisbeth Van Cauwenberghe.

Curriculum vitae
215
Wilson Nyandong tendong, 2013-2014. Microplastics and associated contaminants: Bioavailability in the gut? Master in Environmental Sanitation, Faculty of Bioscience Engineering, Ghent University. Promotor: Colin R. Janssen; Tutor: Lisbeth Van Cauwenberghe.
Wout Van Echelpoel, 2013-2014. Microplastics in a biological wastewater treatment plant and the surrounding freshwater environment: A quantitative approach. Master in Technology for Integrated Water Management, Faculty of Bioscience Engineering, Ghent University. Promotor: Michiel B. Vandegehuchte, Greet De Gueldre; Tutor: Lisbeth Van Cauwenberghe.
Pieter Cauberghe, 2013-2015. Microplastics in a biological wastewater treatment plant and the surrounding freshwater environment: Assessment of physicochemical properties. Master in Technology for Integrated Water Management, Faculty of Bioscience Engineering, Ghent University. Promotor: Colin R. Janssen, Greet De Gueldre; Tutor: Lisbeth Van Cauwenberghe.
Niels De Troyer, 2014-2015. Occurrence of microplastics in the Scheldt river. Master in de Bio-ingenieurswetenschappen: Milieutechnologie, Faculty of Bioscience Engineering, Ghent University. Promotor: Colin R. Janssen; Tutor: Lisbeth Van Cauwenberghe.
Michiel Lecomte, 2014-2015. De verwijdering van microplastics in rioolwaterzuiveringsinstallaties: een case-study voor Vlaanderen. Master in de Bio-ingenieurswetenschappen: Milieutechnologie, Faculty of Bioscience Engineering, Ghent University. Promotor: Colin R. Janssen; Tutor: Lisbeth Van Cauwenberghe.
Maarten-Jan Aelbrecht, 2015-2015. Microplastics in Belgische kustwateren: voorkomen in commerciële vissoorten. Master in de Bio-ingenieurswetenschappen: Milieutechnologie, Faculty of Bioscience Engineering, Ghent University. Promotor: Colin R. Janssen, Pieter Boets; Tutor: Lisbeth Van Cauwenberghe.


