32
The Search For Clean Air Continues Educational Supplement for the Video The Search for Clean Air For Educators and Youth Leaders
The Search For Clean Air Continues Educational Supplement for the Video The Search for Clean Air
For Educators and Youth Leaders
ACKNOWLEDGMENTS
PROJECT COORDINATOR: Harriett S. Stubbs, Ph.D., North Carolina State University
CONTRIBUTORS: We thank the following persons for their contributions to this publication.
Jon R. Luoma, Norman D. Anderson, Edward W. Hessler, Marsha Knittig, Mary Lou Klinkhammer, Harriett S. Stubbs, General Learning Corporation, Air and Waste Management Association, The Acid Rain Foundation, Inc., The U.S. Forest Service
EDITOR: Margaret J. Newbold
GRAPHIC DESIGN: Claudia Fulshaw Design
REVIEWERS: We thank the following persons for their comments and review of this publication:
Teachers in the SCl-LINK/ GLOBE-NET Project; Norman D. Anderson, Ph.D., North Carolina State University; Robert I. Bruck, Ph.D., North Carolina State University; Walter Heck, Ph.D., U.S. Department of Agriculture;
Mr. Edward Hessler, Minnesota Environmental Sciences Foundation, Inc.; Anne Howe, Ph.D., University of Maryland; Linda Little, Ph.D., Environmental Consultant; Mr. Hugh Morton, Clean Air Awareness Films;
Ms. Ann Pope, U.S. Environmental Protection Agency; William Spooner, Ph. D., N,C. Department of Public Instruction; Ms. Anne Taylor, N.C. Department of Environment, Health, and Natural Resources
SUPPORT: We thank the following for partial support for the development and publication of these materials:
North Carolina Department of Public Instruction; North Carolina Department of Environment, Health and Natural Resources; College of Education and Psychology, North Carolina State University; NCSU Education and Psychology Foundation
© 1995 North Carolina State University
IN NO EVENT SHALL NORTH CAROLINA STATE UNIVERSITY (NCSU) OR ANY OF ITS EMPLOYEES WHO HAVE BEEN INVOLVED IN THE CREATION, PRODUCTION, OR DELIVERY OF THIS PUBLICATION BE LIABLE FOR ANY DAMAGES WHATSOEVER
(INCLUDING WITHOUT LIMITATION, DAMAGES FOR LOST PROFITS, BUSINESS INTERRUPTION, OR OTHER PECUNIARY LOSS) ARISING OUT OF THE USE OF OR INABILITY TO USE THE MATERIALS INCLUDED IN THIS PUBLICATION
EVEN IF NCSU HAS BEEN ADVISED OF THE POSSIBILITY OF SUCH DAMAGES.
3,000 copies of this document have been printed at a cost of $1.98 per copy.

Educational Supplement THE SEARCH FOR CLEAN AIR CONTINUES
Table of Contents
Introduction............. What is Air Pollution? The Pollutants Pollutants' Effects
Visibility and Particulate Matter........ Ozone Acid Deposition, Forest Decline
Effects on Human Health
2 3 4
5 6 7 8
What You Can Do, Introduction to Activities........... 9
Activities For Classroom & Informal Learning Centers
Activity 1 - Air Matters : 10-11
Activity 2 -'Concentrating on a Scale 12
Activity 3 - Smog and Temperature Inversion 13
Activity 4 - Investigating Tropospheric Ozone 14-15
Activity 5 - Trees & Forest Decline 16-17
Activity 6 - Vehicle Exhaust 18-19
Activity 7 - Every Breath You Take 20-21
Activity 8 - The World through the Eyes of the Cartoonist ... 22-23
Activity 9 - Wheeling Into the Future 24-25
Activity 10 - Energy 26-27
Glossary 28 Ordering Information Inside Back Cover
"People climb to
the top of
mountains to
look out,
to see as far as
the eye can see,
to see the
wonderful
earth ... "
The Search for Clean Air Video
This publication is printed on 50% recycled paper including 10% post-consumer waste.

"In the USA, the
response was
simple: build
taller smokestacks,
to let winds
disperse the
pollution. But this
only set the stage
for an invasion of
dirty air in
previously unspoiled
places."
The Search for Clean Air Video
INTRODUCTION
Teachers attending the SCI-LINK/GLOBE-NET workshop at Grandfather Mountain, sponsored in 1993 by the National Science Foundation and in 1994 by the Z. Smith Reynolds Foundation, viewed The Search For Clean Air. These teachers requested the use of this video for their classes and agreed to assist in the design of ancillary classroom activities to supplement the video.
The Search for Clean Air, a one hour video narrated by Walter Cronkite and produced by Hugh Morton of Clean Air Films, Inc., aired on WUNC TV (North Carolina) and received outstanding scientific and artistic reviews. The video was shown natiopally on PBS, Spring 1995. The documentary portrays a scientific odyssey with visits to five countries analyzing the effects of air pollution on people, materials, and natural ecosystems. The permanent loss of human lung functions coupled with irreparable damage to natural ecosystems is graphically displayed in this thought provoking documentary. The production of the video was supported by UNC TV Foundation, The Z. Smith Reynolds Foundation, and other private sources.
The Search for Clean Air won the CINE Golden Eagle Award, the highest award for documentary, non-theatrical productions in the United States. Much of the video was filmed at Grandfather Mountain which (at this time) is the only privately held International Biosphere site as designated by the United Nations.
These educational materials are a joint effort of the SCI-LINK/ GLOBE-NET Master Teachers; Air Resources Research
Consortium; North Carolina Department of Public
Instruction; the Office of Environmental Education, North Carolina Department of Environment,
Health and Natural Resources; Mr. Hugh Morton; faculty members of North Carolina State University; and others.

WHAT IS AIR POLLUTION?
An answer is more difficult than it might seem. We may think of soot, or smoke, or foul odors - "dirty air" - as pollution, but some of the worst kinds of air pollution are both invisible and odorless. While such chemicals as sulfur dioxide, nitrogen oxides, and ozone can pollute our air, many of the compounds we think of as air pollutants have always been part of our atmospheric mixture, and in proper concentrations are vital to life on earth. Plants need some sulfur and nitrogen from the atmosphere, and ozone high in the stratosphere shields the earth from harmful radiation. These compounds become pollutants only when their levels increase too much or in the wrong place.
Air pollution steadily increased as the Industrial Revolution advanced in the nineteenth century. Today, large power plants, smelters, and refineries are indeed major sources of many kinds of air pollution. There are also numerous small sources that, cumulatively, add millions of tons of pollutants to our atmosphere: household furnaces, automobiles, dry cleaners, gas stations, farms, and road construction sites. Almost every large-scale human activity - industry, agriculture, transportation - alters the chemistry of our atmosphere.
This video explores some aspects of the complex phenomenon called "air pollution." It looks at diverse topics such as effects on human health, acid deposition, forest decline, and visibility, all of which have air pollution as a common thread.
There are natural sources of atmospheric chemicals, such as erupting volcanoes that emit large amounts of sulfur dioxide. However, humanmade pollution is far greater - in North America, we emit about 20 times more sulfur dioxide and 10 times more nitrogen oxides than all natural sources on the continent combined.
Although nitrogen and oxygen account for 99.9 percent of the molecules in unpolluted air, there are small amounts of many other gases present even in a clean, unpolluted atmosphere. These other gases include argon, carbon dioxide, helium, hydrogen, krypton, methane, neon, nitrogen oxides, radon, sulfur dioxide, xenon and organic vapors. Large amounts of water are also present as water vapor in liquid form (rain and cloud droplets) and as solid ice particles.
Combustion is the greatest source of air pollution. We burn fossil fuels such as coal and oil for energy. Many metal smelting operations burn sulfide ores at high temperatures to remove the sulfur. In some parts of the world, huge tracts of forest are cleared by burning.
Pollutants combine with others to form new pollutants. As they swirl and mix in the atmosphere, many pollutants can combine with other chemicals to form new compounds. For example, ozone forms when nitrogen oxides and volatile organic compounds react with each other in the presence of sunlight. Another secondary pollutant, acid deposition, forms when sulfur dioxide and nitrogen oxides react with water and other atmospheric chemicals to form acids.
Atmospheric pollutants eventually complete the cycle from the skies to the earth. Some pollutants are washed from the skies by rain and other precipitation. Other pollutants reach the ground as dry particles or gases. These pollutants may fall to the earth hundreds of miles from their source.
The effects of this pollution on living things vary. Some sulfur and nitrogen compounds may help fertilize plants. Although ecosystems and individual plants and animals may be able to tolerate some pollution, pollution deposited from the atmosphere can harm crops, forests, animals, and humans, as well as buildings and other structures.
SOURCE: Luoma, Jon R. The Air Around Us. The Acid Rain Foundation, Inc. 1988.
"Combustion
of fossil fuels
is the
greatest
source of
air pollution."
The Search for Clean Air Video
Fossil tuelburningis by far the largest· source of air pollutioll inthe world. Power plants, factories, and other industrial facilities bum coal, oil,and gas. Automobiles, buses and trucks burn gasoline, but pollution also comes from sources as diverse as pesticide spraying, dry cleaning operations, and road construction.
THE POLLUTANTSWHERE THEY COME FROM
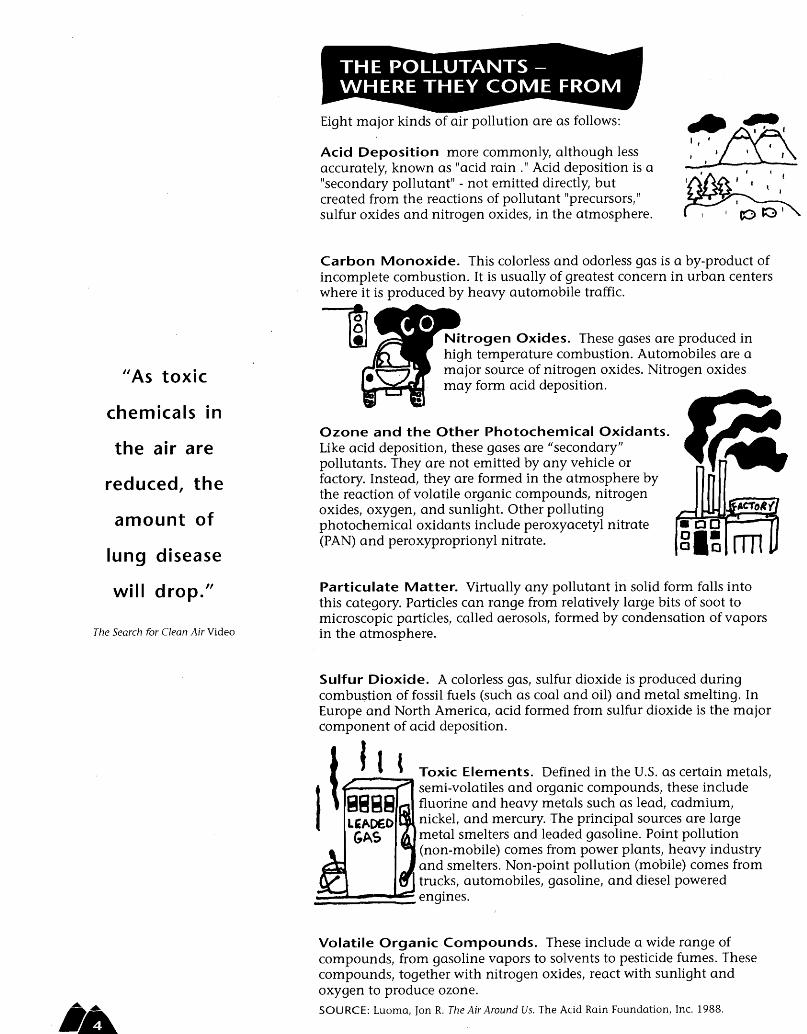
Eight major kinds of air pollution are as follows:
Acid Deposition more commonly, although less accurately, known as "acid rain." Acid deposition is a "secondary pollutant" - not emitted directly, but created from the reactions of pollutant "precursors," sulfur oxides and nitrogen oxides, in the atmosphere.
~£I I I I ,
~
'll I J I
\ I
I\ I'PO~
"As toxic
chemicals in
the air are
reduced, the
amount of
lung disease
will drop."
The Search for Clean Air Video
Carbon Monoxide. This colorless and odorless gas is a by-product of incomplete combustion. It is usually of greatest concern in urban centers where it is produced by heavy automobile traffic. ,
Nitrogen Oxides. These gases are produced in high temperature combustion. Automobiles are a major source of nitrogen oxides. Nitrogen oxides may form acid deposition.
Ozone and the Other Photochemical Oxidants. Like acid deposition, these gases are"secondary" pollutants. They are not emitted by any vehicle or factory. Instead, they are formed in the atmosphere by the reaction of volatile organic compounds, nitrogen oxides, oxygen, and sunlight. Other polluting photochemical oxidants include peroxyacetyl nitrate (PAN) and peroxyproprionyl nitrate.
Particulate Matter. Virtually any pollutant in solid form falls into this category. Particles can range from relatively large bits of soot to microscopic particles, called aerosols, formed by condensation of vapors in the atmosphere.
Sulfur Dioxide. A colorless gas, sulfur dioxide is produced during combustion of fossil fuels (such as coal and oil) and metal smelting. In Europe and North America, acid formed froln sulfur dioxide is the major component of acid deposition.
_--_ Toxic Elements. Defined in the U.S. as certain metals, semi-volatiles and organic compounds, these include fluorine and heavy metals such as lead, cadmium, nickel, and mercury. The principal sources are large metal smelters and leaded gasoline. Point pollution (non-mobile) comes from power plants, heavy industry and smelters. Non-point pollution (mobile) comes from trucks, automobiles, gasoline, and diesel powered
=~:::=:~engines.
Volatile Organic Compounds. These include a wide range of compounds, from gasoline vapors to solvents to pesticide fumes. These compounds, together with nitrogen oxides, react with sunlight and oxygen to produce Olone.
SOURCE: Luoma, Jon R. The Air Around Us. The Acid Rain Foundation, Inc. 1988.

VISIBILITY & PARTICULATE MATTER
A layer of smoggy haze over cities and across rural vistas is one of the most widely noticed effects of air pollution. The visual experience is instantaneous. Unlike health effects, visual effects are neither cumulative nor averaged over time. Clear days are an important aesthetic resource for everyone, as well as a souce of commercial value for tourism and real estate.
Many visitors to U.S. national parks and wilderness areas find beautiful views obscured by haze that reduces contrast, washes out colors and renders distant landscape features indistinct or invisible. Today the average visual range in most of the western United States, including national parks and wilderness areas, is about 60 to 100 miles. That is one-half to two-thirds of the visual range that would exist without air pollution. In most of the eastern United States, including the parklands, the average visual range is less than 20 miles, one-fifth of the natural visual range.
Visibility is not a local effect. It is a function of pollution concentrations throughout the field of view, not just in the observer's immediate vicinity. Most of the haze in wilderness areas comes from wind-blown pollution from many sources spread over hundreds of miles.
Particulate matter (PM) is solid matter or liquid droplets from smoke, dust, fly ash, or condensing vapors that can be suspended in the air for long periods of time. It represents a broad class of chemically diverse
particles of varying sizes. PM results from all types of combustion - incomplete burning of diesel fuel in buses, trucks and cars, wood fireplaces and stoves, and byproducts of fossil fuel-burning power plants.
Haze in the west and east differs in important ways. Eastern haze is six times more intense because of higher pollution levels. In relatively clean areas, such as in many western parks and wilderness areas, small increases in air pollution can decrease visibility noticeably. As a consequence, visibility in these areas is "particularly vulnerable" to air pollution.
Controlling haze to improve visibility could help alleviate other air pollution problems. Substances that combine to form regional haze also contribute to undesirable effects such as human respiratory problems and acid rain.
SOURCE: Protecting Visibilty in National Parks and Wilderness Areas, National Research Council, National Academy Press, and Sloane, Christine, and Warren H. White, Visibility: An evolving issue, Environmental Science Technology, Vol. 20, No.8, 1986.
"There's a sequence
of events that
result from chronic
ozone damage.
Ponderosa Pine
and Jeffrey Pine
are killed by insects
because they've
been weakened
by ozone."
The Search for Clean Air Video

"Southern California
Edison paid
consumers to
buy light bulbs
that use one-fifth
the energy of
conventional ones."
The Search for Clean Air Video
OZONE
In the stratosphere, ozone (03) protects human, plant, and animal life from the harmful effects of ultraviolet light from the sun. In the lower atmosphere, paradoxically, 03 can have adverse effects on plants, animals, and human health.
Newspapers and other media warn that the ozone hole has appeared again over Antarctica. In the southern regions of South America school children are not allowed outside during recess for fear that they will be harmed by ultraviolet radiation. Chemical compounds used in refrigerators, air conditioners, aerosol spray cans, and cleaning solutions have contributed to the depletion of the protective ozone layer in the stratosphere.
In the United States students in Los Angeles and other metropolitan areas stay inside during some school days. In this case the concern is not the depletion of the ozone layer, but that there is too much ozone in the air people breathe. This ozone is a secondary pollutant, which means it
\ / is not emitted directly into the atmo........0 sphere, but that it is produced by photo- '- chemical reactions. The chemical
,/ ,t" reactions involve hydrocarbons and VOC + NOx"'StltlU6Hf: 03 other volatile organic compounds (VOC), _ _ " nitrogen oxides (NOx =NO + NOZ), and
,.. LO"'.~ ~1'MDSfh6; sunlight. It takes only a few parts per fl-..:.' billion of ozone to cause peoples' eyes to ~ hurt and for some individuals to have~ breathing problems.
The health, economic, and ecological impacts of excess ozone concentration can be substantial. The Office of Technology Assessment of the U.S. Congress (OTA, 1988) estimated that high 03 concentrations cost the United States $1 - 5 billion annually in reduced crop yields and excess human health costs. Recent research suggests that pollution from the United States and other industrially developed nations may be contributing significantly to a global increase in tropospheric 03 concentrations. Because 03 is an effective "greenhouse gas" when present in the upper troposphere, this 03 increase may, in turn, be contributing to global warming.
Because 03 cannot beformed without VOC and NOx, these two classes of compounds are often referred to as ozone precursors. The precursors are, for the most part, primary pollutants, emitted directly into the atmosphere from a combination of natural and anthropogenic sources. In theory, high concentrations of 03 can be decreased through limiting emissions of VOC, NOx, or both. In practice however, implementation of a strategy that actually results in lower 03 concentrations has proven to be problematic. After more than 15 years of progressively tighter controls on emissions of ozone precursors (especially VOC) little documented progress has been achieved. As of August 1992, there were 97 ozone non-attainment areas in the United States and an estimated 70 million people living in these 97 areas.
SOURCE: U.S. Environmental Protection Agency. 1992. National Air Quality Emissions Trend Report.

ACID DEPOSITION
Before the 1970's, the term "acid rain" was almost unknown. Since 1979, however, it has moved to the forefront as a major air and water pollution concern. Scientists prefer the more accurate term "acid deposition," since acidity can travel from the skies to the earth in many forms: rain, snow, sleet, fog, or even as tiny particles or a gas.
Some acid deposition facts: Rain and other precipitation tend to be naturally acidic. This mild acidity is caused by the normal interaction of water, carbon dioxide and other substances in the atmosphere, producing a weakly acidic solution. Other naturally-present substances can further alter the chemistry of "normal" rainsulfur dioxide from a volcano can increase the acidity, wind-blown dust containing calcium compounds can help reduce the acidity by neutralizing it. "Normal" rain acidity varies, but may be as low as about 5.0 on the pH scale.
Unnaturally high amounts of acid deposition in North America are caused primarily by emissions of two types of pollutants: sulfur dioxide and nitrogen oxides. About two-thirds of this acid deposition in the eastern United States is associated with sulfur dioxide, the remainder with the nitrogen-containing compounds. In the West, half or more of the acidity is associated with nitrogen oxides.
FOREST DECLINE
A recent public concern about air pollution is that it is causing widespread damage to forests in Europe, and perhaps in the United States. The problem has been particularly severe in central Europe since 1980. This decline in the health of forests is affecting several tree species, including hardwoods and softwoods. Although forest decline is not a new phenomenon, no multiple-species decline of this magnitude has ever before been recorded. American researchers have also documented forest declines on and around mountains in the Appalachians, from Vermont to North Carolina.
There is not conclusive proof that the forest damage has come from air pollution, although some important clues point in that direction. Other possible causes include disease, insects, or climate factors (such as drought), but many scientists think that air pollution is at least a contributing factor in this general forest decline in Europe. One possible explanation: chronic exposure to air pollution may be weakening the trees, making them more susceptible to drought, cold, pests, or disease.
SOURCE: Luoma, Jon R. The Air Around Us. The Acid Rain Foundation, Inc. 1988.
"Of all the
environmental
concerns facing
the Mt. Mitchell
State Park and
Great Smoky
Mountain National
Park, perhaps the
most difficult to
convey to the
public is air
pollution's effects
on plant life."
The Search for Clean Air Video

---
EFFECTS ON HUMAN HEALTH
Six pollutants measured by the U.S: Environmental Protection Agency (EPA) have proven or suspected effects on human health.
liThe elements
of air, water
and soil in our
environment
cannot be
separated - what
we do to each
affects the
others."
The Search for Clean Air Video
Carbon Monoxide. Carbon monoxide interferes with the blood's ability to deliver oxygen to body tissues and tends to weaken heart contractions. High levels of carbon monoxide are considered harmful to everyone, but especially to those with heart disease, respiratory disorders, and anemia, and to cigarette smokers (who already inhale doses of carbon monoxide while smoking). Research indicates that even low levels of carbon monoxide can have minor but measurable effects on vision and alertness.
Lead. Lead can accumulate in the blood, the bones, and the soft body tissues when inhaled. The body cannot easily remove lead so it eventually harms the kidneys, nervous system, and blood-forming organs. Infants and small children are susceptible to brain and nervous system damage.
Nitrogen Oxides. Like many of the other air pollutants, nitrogen oxides can irritate the lungs. They can help cause such respiratory ailments as pneumonia and bronchitis and can lower the body's resistance to respiratory infections.
,1/ ....0~
Ozone. Ozone can cause severe irritation of the nose and throat. It can impair lung function, and be especially harmful to those with chronic lung diseases, as well as those with asthma or heart and circulatory system conditions. In combination with sulfur dioxide, it has more severe health effects than either pollutant would have alone.
Particulates. Inhaled particulates can irritate the respiratory system lungs, throat, and nasal passages. Repeated and prolonged exposure to some types of particulates appears to increase the likelihood of chronic respiratory disease.
Sulfur Dioxide. Sulfur dioxide has been linked to increased respiratory ailments. Studies have shown increased death rates among sufferers of heart and lung illnesses during periods when there is high sulfur dioxide content in the atmosphere. Once sulfur dioxide is emitted from a smokestack it tends to react with various chemicals to form other sulfur-containing compounds, including microscopic aerosols of sulfates and sulfites. Research suggests that some of these compounds may be more harmful to human health than sulfur dioxide alone.
s {
D 00 ~ 00 tOO : 00 ~ 00 N
'~A

WHAT YOU CAN DO TO PREVENT AIR POLLUTION
While it is true that large factories, power plants, and other industrial facilities are the greatest sources of air pollution, many activities of individuals add up to make a significant contribution of air pollution to the atmosphere. To help control pollution, you can: ~"<
~ f2.t'1 / 1V rAt,Conserve Energy in the Home.
off'You can conserve by using more efficient appliances, installing thermostats that turn your furnace down while you're away (and automatically up before you return) and by improving your insulation.
Less electricity used means lowered emissions from the electrical power plant that serves your home. Burning less fuel in your furnace means lowered emissions from your own chimney. Energy conservation can often have the side benefit of saving money.
Recycle Materials. Don't throwaway magazines and papers. Recycle these or donate them to your local library, doctor's office or nursing home. Reuse goods whenever possible! Recycle bottles, aluminum cans, cardboard, and plastic containers.
Limit Emissions From Your Automobile. The best way to limit automobile emissions is to avoid driving by walking, carpooling, or using public transportation. Another important tactic is to keep your car tuned and maintained properly including maintaining proper air pressure in your tires. It will increase your mileage and the longevity of your car, and lower your car's pollutant emissions.
Continue Your Education. Learn more about the problem, and become well informed. Read books, pamphlets, and newspapers. Ask questions of knowledgeable individuals. Sp.'1f.
o,,~,
Get Involved. p.. \ Many conservation, consumer, and health organizations monitor and participate in federal and state government regulatory processes - from rule making to enforcement. Contact elected officials to express your views, and attend public hearings or sessions of your legislature, county commission, or city council.
"Humans could
be the deciding
factor in pushing
ecosystems
over the brink."
The Search for Clean Air Video
INTRODUCTION TO ACTIVITI ES
The following activities are to serve as models for classroom'teachers as well as informal educators in community programs. There are not recommendations for specific grade level applications. You may modify the activities to make them more appropriate for your· classroom or group.
We thank the many organizations who have given us permission to adapt their materials for inclusion in this booklet to accompany the Search for Clean Air video.
SOURCE: Luoma, Jon R. The Air Around Us. The Acid Rain Foundation, Inc. 1988.
Activity 1 - AIR MATTERS
BACKGROUND The atmosphere receives substances from nature and humans. It also delivers these substances back to nature and humans. Some of these substances are particles such as dust, soot, and ash. This group of atmospheric pollutants is often referred to as particulates. The deposit of particulates depends on their size, physical state, reactivity, and the characteristics of the animate or inanimate surfaces receiving them. The possible effects of particulates on plants are not well known.
MATERIALS
00 o , C) Seeds
.·~r: Soil/vermiculate
'fj tJ Pots (or potted plants)
~ Paint brushes
~ Beakers
Plant mister or medicine droppers
"Salt and pepper" shakers- Data Sheet:c: PARTICULATE
~ PROJECTfJ
"Back in about 1306, Queen Eleanor, Queen of England, had a terrible attack of bronchitis, and was v~ry sick. It was obvious to her that it was caused by the air pollution coming from the city walls below the castle. She spoke to Edward the First, who was writing the English common law. He then passed the first set of environmental ordingnces in order to reduce the amount of air pollution affecting human health."
The Search for Clean Air Video.
OBJECTIVE Design an investigation to find out the effects of dust, a particulate air pollutant, on the growth ofplants.
TEACHER'S TIP The particulate matter can be from almost anywhere. Urge students to be careful in collecting particulates. (You will want to know about allergies.) Diesel fuel soot particles should be avoided because they carry a variety of absorbed toxic, carcinogen, and mutagen compounds, e.g., benzo(a)pyrene.
PROCEDURES 1. Introduce this lesson by asking a question about some seeds or a
group of small but well leaved plants (4-6 plants/team). Will these plants grow more slowly in a dusty environment or a non-dusty environment? You could also state a hypothesis. Invite responses and encourage discussion about designing experiments to find the answers.
2. Distribute copies of the PARTICULATE PROJECT Data Sheet and divide the class into small teams. Review, discuss and clarify the background as well as the assignment. Minimize instructions and let the students begin the experiment. Their questions will come as they run into problems. Inform the students that you want to review the work they plan to do.
3. Avoid watering leaves. Water soil only.

Particul t P . a e rOJect Data Sh
Th~: ~
1. Decide what kind of d you are going to collect it~~~h~~C:;: 9.oilng to add to plants and h=== ena s should be fine ow and where
rather than coarse.)
2. Identify other vari bl . experiment. a es whIch may influence pI t
an growth dUring the
3. Identify and choose . expenmental variables.
• Independ .ent vanable (th - e one you are going to change).
• ~ependent variable_ how
~~g:~~~~~~~~:b~ble?Inc~~~~t~~~~r:a~~~g~~~'p~ or levels of the e measurements? .. ow to quantify the
• Controlled variables'
same). Everything el~; ~~~~a~li~sh~~~~constant (the ones you keep th uence the dependent variable/
4. Size of sample (h _ ow many plants/treatment group).
5. W~en to collect data. (Ho ThIS also includes wh w often do you measure th
en you are going to stop th e d~pendent variable? e expenment.) .
6. Develop a suitable tabl --- 7. Set up and do th ~(s) before data collecti b . 8. Prepare a re e expenment. on egms.
a. Title port that contains:
b. Statement of problem H c. Procedures - Ypothesis to be noted d. Observations (Use tabl e. Interpretations (Inti es, x-Y graphs, histograms
of errors.. .in controf~~~C~)-Error analysis too...sou~hen appropriate) f Fments of dependent va:~b~pendentand fixed varia~~:sanddmagnitudes . urther experiments th es. an measure_
ese results suggest
FOllOW-UP QUESTIONS • What inference can we make? What reasons do you have for saying
that? • Does anyone have a different view? • How would the results vary if ... ? • What if you were to coat the underside of the leaves? Both sides of the
leaves? What if you were to use oil to help make the particles stick or a flour, water and particulate mixture?
• What other experiments does this investigation suggest? • How would you describe the leaves? Normal, wilted, curled, spotted,
yellowed, browned, etc? • Suppose an experiment or all of them indicated no effects. What do
you know? Why do you believe it?
EXTENSIONS 1. Coat the entire plant with particulates. 2. Coat both sides of leaves. 3. Coat only the top sides of leaves. 4. Coat only the bottom sides of leaves. 5. Compare the leaves of trees of the same species, one growing in a
dusty environment and one growing in a less dusty environment.
SOU RCE: Hessler, Edward, W. Air Pollution and Forests. The Acid Rain Foundation, Inc. 1990.
You can R1ake a difference!
Take a shower instead of a bath!
Turn off the water when brushing your
teeth or shaving!
Set up a recycling program!
Be informed on issues affecting
your local, statewide, and national community!
Think Globally and Act Locally!

MATERIALS For each group:
~Copy of the data ~collectingsheet
,p Copies of the pH scale
Different types of pH('\fin testing paper (wide U'fJ and short range) and (::::::::) color chart or pH
meter
; E3 Paper cups for \J distributing solutions
~ Labeled solutions ~ (such as lemon juice, ~ vinegar, citric acid, orange ~ juice, baking soda solution, ~ soda pop, lime water, salt ~ water, rain, melted snow, ~ distilled water, tap water, ~ antacid solution)
Note: Colorless solutions are the easiest to test.
SAFETY PRECAUTIONS 1. Use only identified
solutions for testing.
2. Do not include dangerous solutions such as sulfuric and hydrochloric acid or full strength ammonia.
3. Tell students not to drink or taste any of the solutions.
4. Do not have any food near testing stations.
Activity 2 - CONCENTRATING ON A SCALE
OBJECTIVE During this activity} students will: 1. Test the pH of a variety of solutions 2. Place their findings on the pH scale
In this activity students will work with pH paper} a variety of solutions} and the pH scale to understand acids and bases. Results will not be scientifically exact and may vary from group to group. Variation may result from age of pH paper} color perception} and strength of solutions.
PREPARATION Label a paper cup for each solution to be tested. Pour about 1 cm of solution into its labeled container. Have at leastias many solutions as student groups. Arrange solutions} pH paper and color charts at several "testing stations}} in the classroom.
PROCEDURE Begin by asking students these questions about pH values: 1. How is the pH of a liquid measured? 2. What is the range of the pH? 3. What is the range of acids? Of bases? What is neutral on the pH
scale?
Divide students into groups of 4-6 and distribute the data collection sheets and pH scale worksheet.
Demonstrate the steps the students will be taking to test the solution. 1. Dip a strip of pH paper into the solution. Stress the importance of a
new strip with each solution. 2. Match the wet pH paper to the color chart immediately. 3. Record the results on the data collection sheet. 4. Write the name of the solution in the proper place on the pH scale
worksheet.
Explain to the students that they will move as a group from station to station with their data sheet and pH scale worksheet.
EXTENSIONS • Use solutions of rocks crushed
with a hammer. Compare. Example: granite, limestone.
• Use unlabeled solutions. Can students identify solution by pH? Or other properties?
SOURCE: Stubbs, Harriett, Mary Lou Klinkhammer, and Marsha Knittig, Acid Rain Curriculum Grades 4-8.

Activity 3 - SMOG AND TEMPERATURE INVERSION
BACKGROUND "December 3, 1952, was a beautiful day in London. The weather
forecasters reported that a cold front had passed during the night. At noon, the temperature reached 6°C. The air was slightly damp, and the sky was full of clouds. A cold wind blew in from the North Sea. Blowing southward across all England, it pushed smoke from factories ahead of it.
On December 4, the wind speed lessened. Several low layers of darkgray clouds covered the sky. The noon temperature was 4°C and the air more moist. The smell of smoke penetrated into buildings as doors and windows were opened. Winds in London were not strong enough to carry away the smoke pouring from the chimneys.
By noon of the following day, the temperature was 1°C and the air heavy with moisture. Because of the high humidity and cold temperature, a fog reduced visibility. Movement in the city became difficult. Airplane flights were canceled. Very few people tried to drive. Even walking was hazardous. The wet, quiet fog that covered the countryside was loaded with smoke and soot particles. London was the captive of a great smog - a mixture of smoke and fog. These conditions existed from December 5 to December 9.
There was no escaping the polluted air. It crept into every room. It irritated eyes and skin, and brought on severe coughing. Hospitals were jammed with people. During the five days of the fog and in the week following, about 4,000 more people than usual died from lung conditions worsened by smog.
On December 9, fresh air began blowing in from the south. On December 10, the smog was pushed away by a breeze coming from the north Atlantic.
The smog crisis in London in 1952 is an extreme example of air pollution. "*
OBJECTIVES Students participating in this activity will learn that these air pollution conditions result from a combination of weather conditions and human output of pollutants into the atmosphere. They will also learn how this combination takes place.
PROCEDURE SMOG ACYl
1. Choose appropriate ~uPpose no . VlTy SHEET mversion wmd is blowiquestions from the and othe; a!ld the air is ng ~Uring a te temperatu a1~ Pollutants fkot10nless. Whmperatureworksheet as a re 1nversion? 1 ely to collect ~re ~re smoke
springboard for Assume th unng a London ~at you are the S
class discussion or of facto; ould you rec mog COntrol O' front appY furnaces be s;.:mmend that th lTector for
as a written exercise: roaches? ut down when e thousands WOUld yo ever a cold be . u recom
Proh1bited wh mend that all eneVer a motor v h'
WOUld 0 cold front a e 1cle tra[fjccreated~ u recommend th Pproaches? drops to ;er the entire cityat artificial br
near zero lever~ whenever theee~es be SOURCE: Smoggy London WOUld you . wmd speed Town, in Environmental turned off wh~~~~endt0at all horn Science: Probing the Natural Wh an alT-pollut' e f~rnaces b
Yare sm JOn cns' eWorld/Level III. Silver regions than09 ~onditions le 1S OCCurs? Burdett, General Learning m mdUstrial ce~t~~~~uent in farming Corporation, Morristown, NJ.1972.
*NOTE: When the cold front passed over London in early December 1952, it produced a temperature inversion that prevented vertical air mixing. Since there was no wind to blow the pollutants away, pollutants remained in the colder air layer near the earth's surface. Thus the pollutants began to collect in the breathing space of people.
Altitude Temp. Altitude Temp. (meters) (C) (meters) (C)
150 25 1200 5 300 23 1350 2 450 21 1500 0 600 20 1650 -3 750 16 1800 -5 900 11 1950 -9
1050 9 2100 -12
3. Use the grid to graph the data from the table above.
Altitude (meters)
2100
1800
1500
1200
900
600
300
Temperature (C)
-25 -20 -15 -10 -5 0 5 10 15 20 25

MATERIALS
eSheets of paper to make signs (8-1/2 by 11 inch paper)
~,q Magic markers for J...(f printing chemical
symbols on signs
1l Punch for making® small holes in signs
() String for hanging ( ) signs around the
students' necks
I!J Flashlight to ~ represent ultraviolet
radiation.
Activity 4 - INVESTIGATING TROPOSPHERIC OZONE
OBJECTIVE The formation and decomposition of ozone can be illustrated many ways in the classroom. Styrofoam balls, marshmallows, gum drops and numerous other objects can be used to represent atoms of oxygen and other elements. Letting students represent oxygen and other elements in chemical reactions puts them center stage in the ozone story.
PROCEDURES I. Figure 1 shows how a student can represent an oxygen atom and how
groups of students can be arranged to represent molecules of diatomic oxygen and ozone.
",,\oa.£.C.UL.E' of O,ATOMIC Ot.'fGfN -02
Fo
Igure 1
FOLLOW UP QUESTIONS • How many atoms of oxygen are there in a molecule of diatomic
oxygen? • How many atoms of oxygen are there in a molecule of ozone?
CHALLENGES • Have students make signs for the elements of carbon, hydrogen,
nitrogen, and oxygen. • With students representing these four elements, can they arrange
themselves to form some of the compounds found in air?
CO (Carbon monoxide) CO2 (Carbon dioxide)
CH4
(Methane) H20 (Water)
NO (Nitric oxide) N20 (Nitrogen dioxide)
Figure 2
OZONe - 03
II. Figure 2 shows how ultraviolet radiation can break down a molecule of diatomic oxygen to form two atoms of oxygen. These atoms of oxygen in turn combine with other molecules of diatomic oxygen to form ozone.

FOLLOW UP QUESTIONS • How is diatomic oxygen represented in the chemical equation at the
bottom of Figure 2? • How is ozone represented in the chemical equation? • How many molecules of diatomic oxygen are required to form two
molecules of ozone?
CHALLENGES • Write an equation to show how ozone breaks down to form diatomic
oxygen. • Have students representing ozone and diatomic oxygen demonstrate
this reaction of ozone changing into diatomic oxygen.
III. Much of the ozone in the troposphere is a result of sunlight (ultraviolet radiation) on mixtures of nitrogen oxides (NO and NO) and volatile hydrocarbons (VOCs), such as methane. This series of rather complicated chemical reactions can be demonstrated in a general way as shown in Figure 3.
Figure 3
~T\JO'NT 6~6VPS
02. ..... 02.-.lNPUT 02 --.
(f<£At.fAtJis ) GH.. -+ NO ......Nez. ..
9LI\GK00AR.O o~
PA rt.1" t"" 0 '"
Have groups ofstudents represent molecules of NO, NOz' CH4
(methane, which is an example of a VOC) and Oz. These students then enter a space where they cannot be seen by other class members (hallway, storeroom, behind a portable chalkboard). A student shines a flashlight on these "student" molecules to represent the sunlight shining on a mixture of nitrogen oxides and VOCs. The student groups"react" to form new combinations, including ozone. Other possible molecules include COz' HzO, and Nz. These new groups of students representing ozone and other molecules then appear so class members can see them.
FOLLOW UP QUESTIONS • What is the source of energy that results in the formation of ozone
in the troposphere? • What is the source of the nitrogen oxides and VOCs?
CHALLENGES • What is smog? • What happens to the ozone formed by the action of sunlight on
smog?
You can Rlake a difference!
Separate your food waste and other
organic materials from the rest of your garbage
recycle and compost!
Turn off lights in rooms not being used!
Save energy when you go on vacation - turn down the thermostats
for air conditioner, furnace, and hot water!
Use drapes or thermal curtains to keep heat
from escaping through windows!
Instead of using a gasoline- powered leaf
blower - RAKE!
Don't wash sidewalks off with water - SWEEP!
RESOURCES: Anderson, Norman D. Investigating Science Using Your Whole Body. New York: McGraw Book Company, 1975.
Ebert, David A. "Whole Body Ozone Chemistry," in Ozone: A Sourcebook for Teaching About 03 in the Troposphere and Stratosphere. Dubuque, Iowa: Kendall-Hunt Publishing Company, 1995.

Activity 5 - TREES AND FOREST DECLINE
t MATERIALS
8 Tree core or ~ incre~ent corel ~ tree nngs
/r) Tree Core ~ Activity Sheet
~ Tree Ring ~ Activity Sheet
®StemflowJ.t:t Activity Sheet
~fu Throughfall Activity Sheet
~Q Optional: ~ magnifier, ruler
rf~ S\-\EE'ORE AC'-'" d use it
'-REE C . on a table an /tree nng
nt core h increrne ore?
A. l'lace t e . 9 station. t the tree c . a learn1n tice abou
as OU nO rne things y. s
What are SO observatlon. 1. 11 of yourList a
1. ch2 'dth of eai ~a~~~m~~~~
. d rneasure (1he p1tt: he largesttable an yoU can. What 1S t
2. 1-Aa\<.e a accurately as zero~ingJ'hring as ore is t e ?
f the tree c ? Largest . the core. o h core. . 9 1n ring in. t e srnallest nn . . ..That 1S th~e f rings 1n"V ber 0 atesrnallest .ne the nurn \,>e as accur
d deterrn1. rernents. table an SO rnrn 1nc
3. 1-Aa\<.e a 2srnrn or O. each O. . s begin to as yoU can. .:) do the tree nn~ the tree core
. t (or p01n~S r the center w sure are 4. A.t what .po~~ze? (1he P~~~ou decide? Bo
hange 1n . \ Bow 1 C h zero nngl'is t e you?
BACKGROUND Tree rings are time keepers and environmental keepers of the past. Each tree core represents the chronology of the growth rate of a tree for its entire life cycle. The wood next to the bark (dark colored plug) is the most recent year's tissue; the oldest wood (when the tree first started growing) is near the center of the core. Tree cores are referred to as increment cores by the forest scientist. Each one of the distinct bands on the core represents one year of radial growth and is called the growth increment.
Scientists use tree rings in many different ways. The rings record information about past water and climatic conditions. They also provide information about vegetative usage and environmental effects, such as the degree of competition as the tree grows. Recently, researchers have found the rings to be useful in studies of heavy metal pollution and in examining relationships between air pollution and growth.
A scientist who uses increment cores to study tree growth patterns is called a dendrochronologist. He uses the cores to assess natural and human induced environmental int1uences on tree growth. During certain periods of time the tree has large increments (3-5mm). The core may also show periods of growth "suppression." These small rings may represent periods of drought, competition from other surrounding trees, or the impact of environmental stress.
Scientists have noted that there is a strong correlation between anthropogenic pollution deposition and growth suppression and indeed visible tree damage in spruce and fir ecosystems in both central Europe and the Appalachian Mountains. However, much more research will be needed to establish "cause and effect" relationships.
High altitude ecosystems are bathed in cloud moisture 7 of every 10 days throughout the year. Atmospheric chemists have indicated that pollutant concentrations at cloud base, where tree crowns intercept, are 5-10 times higher than concentrations found in rain or snow. This may account for the elevated concentrations of heavy metals,
TREE RIN G ACTIVITY S
Place the' HEET mcrement
as a learning station.core/tree ring on a tabl e and Use it
Ask stUdents th . 1 Wh ese kmds f . at do you not' 0 questions:
stump? lee When you exami 2. Have you ever co ne the top of a tree
stumps? How mpared two differ . If someone we:e they alike 7 H ent kmds of tree k mentIons th . . ow Were th d' nows another n e nngs, ask wh ey Ifferent?
referred to as" ame for them. (Th ether anyone Is there any 19r?wth rings" or "a ey are sOmetimes height . re atlonship betw nnual rings")
, envlTonm een the ri . ~hYare trees so en~al factors, orage 7 n9sand tree HIstorians?" metlmes referred to '"
as Nature's
After you have d' stUdents the co Iscussed the stum . increment bore~e ~r in.crement cofe)w:ih the class, Show how it Works. The
s ow It to the stude~ts you have an extracting a core y should know that it .and describe poles, or timber) - a sample - of WOod f IS a tool for
s . rom trees (logs,

such as lead, copper, and zinc, and other toxicants and nutrients that are being measured at these mountain tops.
PREPARATION Obtain tree cores or cross sections of trees for your class.
PROCEDURE Choose appropriate questions from the Tree Core and Tree Ring Activity Sheets as a springboard for class discussion or as a written exercise.
EXTENSIONS When students have completed their investigation, conclude the lesson with a class discussion.
What are some variables influencing the interpretation of tree core data? What do you know as a result of your work in this investigation? What is some additional evidence you would like to have?
Additional Activites to measure pH of rain in different ways: Stemflow and Throughfall Activities
'STEMFLOW TEAM(S)
TEAM MEMBERS_~_-----------,
THROUGHFAll TEAM(s)TEAM MEMBERS
Time Collectors ----,Date --~-
Time pH RecordedPlace -------
A. Materials Date Aluminum foil Time COllectors
• String . d . Place 2 containers: cottage cheese/yogurt (nnse m Time pH Recorded distilled water and air dried) A. Materials• pH indicating paper, range - 3.0 to 8.5, accuracy
• Aluminum foil- 0.5 units
4 Containers: cottage chee . • wa~er ~nd air dried) se/yogUrt (nnsed in distilled
B Procedures . pH IndIcating a . • Use the materials to design an expenment to units p per, range - 3.0 to 8 5 . ,accuracy - 0.5measure the pH of rain that flows down a tree
B.(trunk). Procedures
• Use these materials to desi n .C. Prediction . the pH of rain that falls th;o a~ expenment to measure . . ug the leaves of a tree
• The pH of stemflow rainwater wIll be: greater than, less than, the same as the pH of c. fu~~~ . rainfall in an open area.
• The pH of throughfall rai less than, the pH of rainf~raterwill be: greater than
In an open area. '
D. Write a report describing what you did and what you learned.
E. Challenges (Same for both Throughfall and Stemflow activities)
For this section you will need additional materials. You should be able to "solve" the challenge using either standard laboratory materials and/or commonly found materials.
How much dirt is present in your sample? What procedures could you use so that you could make comparisons?
SOURCE: Edward W. Hessler, Air Pollution and Forests, 1990. The Acid Rain Foundation, Inc.

MATERIALS FOR TEACHER USE
~ Socks, new white
~ tube
Motor vehicles ~ (variety of cars, lrztJ trucks, buses, etc.)
@'v) Oven mitts or ~.. heavy gloves
"/ Marker pen
~ Masking tape or ~ small tags with -;.0, safety. pins forU labels
@ Rubber bands
h 6 6 Distilled water
~! pH paper/meter
Activity 6 - VEHICLE EXHAUST
CAUTIONS FOR TEACHERS: 1. Teachers will collect particulate matter from vehicles or contact a
local auto mechanics inspection station for material. White socks will be marked, then taken to the classroom, opened and examined by students.
2. The experiment should never be conducted in a closed building.Set the emergency brake on each vehicle. Use oven mitts or gloves when putting socks on and taking them off. Teachers should stand away from the automobiles during the test. Exhaust tailpipes emit carbon monoxide gas and can cause burns. Do not touch the tailpipe until car has cooled for five minutes.
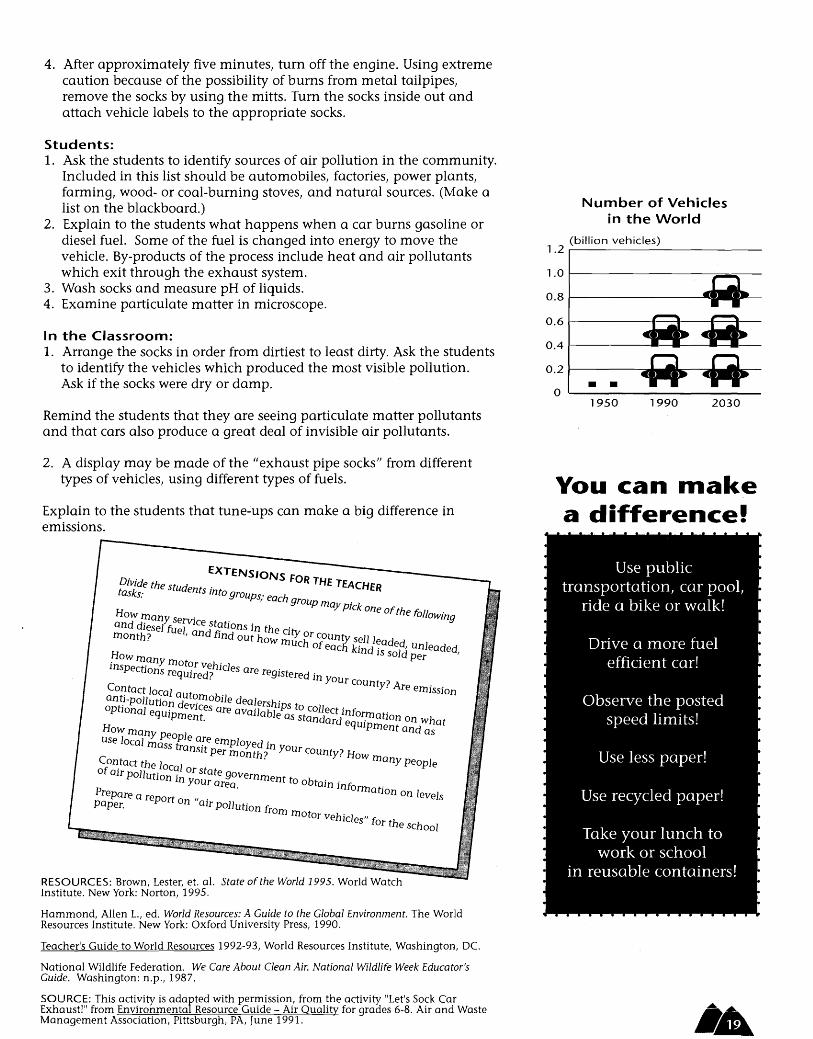
BACKGROUND In 1986 there were almost 500 million vehicles operating world-wide. If the present growth rate continues, by the year 2030 there will be one billion vehicles. As the number of vehicles on the road grows, so does atmospheric pollution. Presently more than half of the air pollution in North America is the direct result of mobile sources. Emissions from motor vehicles contribute to five of the six major air pollutants: lead, carbon monoxide, nitrogen oxides, ozone, and airborne particulate matter.
Air pollution produced by motor vehicles is being reduced in many ways. In the United States the Environmental Protection Agency (EPA) sets manufacturers' emission standards for motor vehicles through federal vehicle emission control programs. State and local governments have implemented programs such as vehicle maintenance inspections, inspections to check for the presence of pollution control devices, and incentives to encourage the use of public transportation. New technologies to reduce motor vehicle pollution are actively being developed. Increased fuel economy, more efficient burning of gasoline, vehicle design changes, and vehicle fuel from sources other than petroleumbased substances will all be part of future air pollution control.
OBJECTIVES Students will: 1. Describe different sources of air pollution and the effects of
air pollution. 2. Describe air pollution from motor vehicles. 3. Understand the role of the US Environmental Protection Agency in the
federal vehicle control programs and what has been accomplished under this program.
PROCEDURES Teacher or Mechanic Instructions: 1. Pre-select vehicles (choose vehicles that use a variety of fuels) to test
exhaust fumes. Cars using unleaded gasoline and diesel fuels are the most common. Vehicles using leaded gasoline or alternative fuels such as alcohol or methane will provide variation.
2. Make a label for each sock that includes the following vehicle information: model, make, engine type, and model year.
3. Place a white tube sock over the tailpipe of each vehicle and then start the engines. CAUTION: Be sure no one is standing near the vehicles before starting the engines. NOTE: If the socks do not fit snugly over the tailpipes, secure them with rubber bands.
4. After approximately five minutes, turn off the engine. Using extreme caution because of the possibility of burns from metal tailpipes, remove the socks by using the mitts. Turn the socks inside out and attach vehicle labels to the appropriate socks.
Students: 1. Ask the students to identify sources of air pollution in the community.
Included in this list should be automobiles, factories, power plants, farming, wood- or coal-burning stoves, and natural sources. (Make a list on the blackboard.)
2. Explain to the students what happens when a car burns gasoline or diesel fuel. Some of the fuel is changed into energy to move the vehicle. By-products of the process include heat and air pollutants which exit through the exhaust system.
3. Wash socks and measure pH of liquids. 4. Examine particulate matter in microscope.
In the Classroom: 1. Arrange the socks in order from dirtiest to least dirty. Ask the students
to identify the vehicles which produced the most visible pollution. Ask if the socks were dry or damp.
Remind the students that they are seeing particulate matter pollutants and that cars also produce a great deal of invisible air pollutants.
2. A display may be made of the "exhaust pipe socks" from different types of vehicles, using different types of fuels.
Explain to the students that tune-ups can make a big difference in emissions.
EXTENSIONS F Divide the stud . OR THE TEACHER tasks: ents Into groups; each
group may pick one of How many s . the following and diesel fu efVIce stations in th . month? e, and find out ho: CIty or county sell1e d
much of each kind .a ed, unleaded How IS sold per ' insp m.any motor vehi 1
ectlOns required? c es are registered' . In Your COUnt ')
Contact local a t y. Are emission anti-pollution du ~mobile dea1ersh' optional equipme:A~es are availab1~P~st~t c01d1ect information
. an ard equipm on whatHow many peop1 ent and as
use local mass tra~%ep~~~~~~~in Your county? How Contact the local . many people of air Pollution in ~os~~te government to obt. .
area. aIn Inform . Prepare a report 0 " . atlOn on levels paper. n aIr Pollution fro
m motor vehicles" f< or the school
RESOURCES: Brown, Lester, et. a1. State of the World 1995. World Watch Institute. New York: Norton, 1995.
Hammond, Allen L., ed. World Resources: A Guide to the Global Environment. The World Resources Institute. New York: Oxford University Press, 1990.
Teacher's Guide to World Resources 1992-93, World Resources Institute, Washington, DC.
National Wildlife Federation. We Care About Clean Air. National Wildlife Week Educator's Guide. Washington: n.p., 1987.
SOURCE: This activity is adapted with permission, from the activity "Let's Sock Car Exhaust!" from Environmenta Resource Guide - Air Quality for grades 6-8. Air and Waste Management Association, Pittsburgh, PA, June 1991.
Number of Vehicles in the World
(billion vehicles)1.2 .--------------
• • o
0.8 1------------«4....-
1.0 I----------------::;;==_
0.6 /--------1---1-----1"---1
0.4 /-------1 __-_1----1.
1950 1990 2030
You can make a difference!
Use public transportation, car pool,
ride a bike or walk!
Drive a more fuel efficient car!
Observe the posted speed limits!
Use less paper!
Use recycled paper!
Take your lunch to work or school
in reusable containers!

MATERIALS
• Graph paper
roab Overheadprojector
Mean Year S02 Concentration Templice, Wolkerova St. The Czech Republic
~g.m-3
170
150
100
50 - - - - - --AAiTHMETi'C"MEAN
WHO Recommended Limit
- - - - - ~EQM"E"ffiicALMEAN
1970 1975 1980 1985 1990
SOURCE: The World Health Organization
Activity 7 - EVERY BREATH YOU TAKE
BACKGROUND Monitoring air quality and providing information to the general public is done for two major reasons. First, studies have shown a relationship between the severity of air pollution and health. Accurate, timely, and easily understandable iriformation about daily levels of air pollution allows susceptible people to modify their activities and to take temporary measures to protect themselves. Second, government agencies are required to take steps that will prevent air pollution from reaching harmful levels.
For many years, cities developed and used their own indices for reporting air pollution levels to the public. Because no two of these were exactly the same, in 1976, the Environmental Protection Agency (EPA), in cooperation with the Council on Environmental Quality (CEQ) and other agencies, developed the Pollutant Standards Index (PSI).
PSI prOVides a standardized way to report daily air pollution. PSI converts the levels of pollutants in a community to a number on a scale of a to 500. The index is based on established ambient air quality standards. These monitor the levels of carbon monoxide, nitrogen dioxide, sulfur dioxide, particulate matter, and ozone.
OBJECTIVES Students will: 1. Monitor air quality in two communities. 2. Collect air quality data from a state agency. 3. Graph results from data collected. 4. Draw conclusions about air quality in the local area using data
collected.
PREPARATION 1. Make a transparency showing the nation's air quality standards
using "U.S. National Ambient Air Quality Standards." Show the transparency to the students, explaining that these standards are enforced nationally and that indices used to report air quality information to the public were derived from these standards. (You may wish to make photocopies for the students instead of using a transparency.)
2. Give each student a copy of the "U.S. Pollutant Standards Index." Discuss the information given on the index, pointing out its usefulness to people, especially those with health conditions that make them particularly susceptible to air quality problems.
PROCEDURES A. Divide the class into three groups.·
1. Have one group contact the local agency responsible for air quality to determine where the nearest air quality monitoring stations are located. Have the students collect and record PSI readings each day for two weeks. Students should also record the type(s) of pollution (sulfur dioxide, ozone, etc.) each day. NOTE: You may wish to contact your local television station, radio station, or newspaper to determine if they obtain daily PSI readings. Air quality information is often included in weather reports.
2. Have the second group identify the nearest larger city and the local agency in that region responsible for air quality. Have them contact the agency to obtain information on the PSI, collecting and recording index readings and type(s) of pollution each day for two weeks. If your students live in a metropolitan area, have them identify a less populated area to monitor the air quality.

3. Have the third group contact the state agency and obtain statewide information on air quality for the past year. Ask for quarterly (seasonal) readings, rather than daily readings. Have the students determine the type(s) of air pollution for each quarter.
B. Once the students have obtained the information, each group should draw two graphs of their data: (1) PSI index value and (2) PSI air quality level.
C. Have each group present their findings to the class. Have the students draw conclusions from the information.
1. Does the day of the week, or the season of the year make a difference in pollution levels? If yes, for which pollutants?
2. Compare the results of air quality in their town with the more (or less) populated area.
3. What was the most common type(s) of pollution? Does it change by day or by season?
U.S. National Ambient Air Quality Standards
Pollutant and (micrograms per cubic meter) Time Period* Primary** Secondary***
Total suspended particles Annual 75 60 24-hour 260 150
PM 10 particles Annual 50 50 24-hour 150 150
Sulfur dioxide Annual 80 24-hour 365 3-hour 1,300
Nitrogen dioxide Annual 100 100
Carbon Monoxide 8-hour 10,000 10,000 1-hour 40,000 40,000
Ozone 1-hour 235 235
Lead 3-month 1.5
* Short-term standards (24 hours and less) are not to be exceeded more than once a year. Long-term standards are maximum permissable concentrations that are never to be exceeded.
** Set to protect human health. *** Set to protect public welfare.
Standards
U.S. Pollutant Standards Index
Index Value
Air Quality Level
Health Effect
Descriptor
500
400
300
Significant Harm
Emergency
Warning
Hazardous
Very Unhealthful
200 Alert
Unhealthful 100
50
NAAQS
50% of Moderate
0
NAAQS
Good
SOURCE: Guidelines for Public Reporting of Daily Air Quality - Pollutant Standards Index, EPA, 1976.
SOURCE: "How Clean Is Our Air?" Tennessee Valley Authority, April, 1990.
EXTENSION Discuss with the students ways they as individuals and as a part of a family can help reduce air pollution.
RESOURCES: Tennessee Valley Authority. How Clean Is Our Air? (by William J. Parkhurst and Barry L. Barnard). Knoxville: n.p., 1990.
U.S. Environmental Protection Agency. Measuring Air Quality: The New Pollutant Standards Index. OTA, 11/8. Washington: GPO, 1978.
Guideline for Public Reporting of Daily Air Quality-Pollutant Standards Index (PSI). Office of Air Quality Planning Standards, EPA/450/2/76/013. Research Triangle Park, NC: GPO,1976.
SOU RCE: This activity is adapted with permission from the activity "Every Breath You Take" from Environmental Resource Guide - Air Quality for grades 6-8. Air and Waste Management Association, Pittsburgh, PA, June 1991.
You can l11ake a difference!
Install the most efficient tire available
on the market! This improves fuel economy by 1 to 3 miles per gallon.
Make sure your tires are properly inflated!
Make double-sided photocopies; use
reverse side of paper!
Buy food and other products wrapped in the least amount of packaging possible!
Buy non-aerosol sprays!
Buy food in reusable containers!
MATERIALS
~ Collection of ~ tal cartoons
Overhead projector
Copyright Information: As a rule, copyrighted material used for nonprofit educational purposes can be reproduced if these gUidelines are followed: 1. Single copies for use in one course. 2. If multiple copies are used, make only one for each student. Copy only one cartoon from each book or magazine issue, and use it for just one course. If you wish to go beyond these gUidelines, write to the copyright holder or publisher and ask permission to use them in specific ways. Usually, permission will be readily granted.
Activity 8 - THE WORLD THROUGH THE EYES OF THE CARTOONIST
BACKGROUND Cartoons show many different points of view about various topics, and can stimulate thinking about values, science, and society.
OBJECTIVES Students participating in this activity should be able to identify values expressed or implied in cartoons, compare cartoonists' values with their own; describe the issues, people, or events pictured; recognize that cartoons are more likely to show problems than solutions; and appreciate the editorial function of cartoons.
TEACHER TIPS 1. Encourage your students to add cartoons to the class collection.
Cartoons can be found in newspapers, especially on editorial pages and in magazines. When students cut out or photocopy cartoons, make sure they include the name and date of the source publication.
2. Editorial cartoons differ from cartoons for entertainment in that they express an opinion or special point of view about a person or issue in the news. They are most often found on the editorial pages of newspapers. Some characteristics of editorial cartoons are exaggeration of size or reality; personification of institutions such as government, banks, etc., caricature, double message (one obvious, the other hidden); emphasis on a single topic; problems shown rather than solutions; bias; stereotypes; symbols; currently newsworthy; and humor, satire, and ridicule.
PROCEDURES 1. Make sure everyone can see the cartoons (individual copy, or over
head). Ask the students about the cartoons and their ideas about how attitudes and biases are expressed. Do the facts agree with the cartoonist's Viewpoints?
2. After viewing the cartoons and asking for comments on them, conclude the lesson with a general discussion, using these kinds of questions: .
An opinion supports a viewpoint only when expressed by a person who is in a position to know, observe, and interpret the facts about the given topic. If he is in such a position, why? If ~ot, who is?
Is the cartoon subject a social problem that has arisen because of scientific discoveries?
Is this problem a social problem that is likely to be solved because of scientific discoveries?
3. Put this statement on the board and ask for students' opinions:
The way to learn about an environmental problem is from a: a. cartoon b. newspaper article c. magazine article d. scientific report e. television documentary

.ose the statement also contalned these choices: Supp f 11 of the above
. ~one of the above 7
g. 7 Why or why not. Would this change your 0 riginal answer.
EXTENSIONS .'11ustrate it using a cartoon, Pick a topic. Can you 1 7 Share It. WI'th someone else in your group.
CARTOON ACTIVITY SHEET
Choose appropriate questions as a springboard for ciass discuSSionor as a written exercise:
with it?What is the main point the cartoonist is making? Do you agree
What is the enVironmental Subject of the cartoon? What is themain problem or issue associated with it?
What are the biases and assumptions of the cartoonist? What is hein favor of, or not in favor of?
What is the message? Do you agree or dlsagree? Do you suppose a sages?person from a totally different culture would get the same meso
Is there a double message? One that is obVious and one that ishidden? What are these?
After you have examined a colieetion of cartoons, decide whatissue/issues they deal with. Check the boxes which apply:business health ecological
political scientific economic social
pollutionIeli why you made the choices you did. Can you group ali thecartoons under this set of categories?
What environmental factors can you find?
What ideas or feelings do you bring to the cartoon that couldinfluence the way you "read" it?
Summarize the cartoon. First, in one sentence, then in one word.
You can make a difference!
Whenever possible, buy returnable bottles
and cans!
Give gifts that keep on giving such as:
an experience, a low-flow shower head,
a tree!
Weatherize your house add insulation to the doors, windows, attic
floors and ceilings!
Borrow or rent items you don't use often and
maintain and repair the items you own!
SOURCE: Hess 1er, Edwar . . reness Curriculum, Grades 6-12.1985.d W Acid PrecipitatIOn Awa .&

MATERIALS
Individual copies of the same futures wheel ~ Large sheets of paper (36" x 36")
Marking pen for each group
Activity 9 - WHEELING INTO THE FUTURE?
OBJECTIVE During this activity, students will:
1. Learn how to develop a futures wheel* 2. Create a futures wheel to explore the effects of (an air quality topic)
Students will explore the effects of (an air quality topic) beyond the initial impact on aquatic and land ecosystems.
PROCEDURE The futures wheel is a teaching tool that encourages students to think creatively in exploring the implications of a particular topic. There are no right answers. It is not a decision making tool.
Period One 1. Divide the students into groups of four to six, and have each group
select a recorder. 2. The recorder writes the (air quality topic) of the futures wheel in the
center of the paper and circles it. 3. The group asks the question "What might happen if ?" They give
three to five responses to the question and the recorder writes them around the center circle. All responses are to be written down without discussion or evaluation. These are first order connections. They should be circled and connected to the center circle with one line.
4. Then ask "What might happen 'if...?" of the first order connections - and place those responses around each of the first order connections.
Circle them ond connect these second order connections to the first ones with a double line.
5. Continue with the third order connections. Depending on the topic and the ability of the students, the wheels could be carried out to fifth order connections. However, third order is a good level for beginning experiences.
6. Try to think of both positive and negative connections. They may be labeled good (+), bad (-), or neither (n).
Period Two When you feel the students understand the basic process of developing a futures wheel, have them begin a futures wheel for the purpose of exploring (another environmental topic). Divide the students into groups and give each group one of the large sheets of paper. The recorder should label the center circle with the chosen "environmental topic." The question for the first order connections should be "What might happen if .... continues?" Give hints.on the process as you monitor the groups.
When the groups have carried their wheels out to the designated order or reached the time limit, discuss the results as a class:
1. Ask each group to share their most creative "spoke" and/or an especially threatening "spoke."
2. Questions: Are the effects of the "environmental topic" narrow or broad? What can we say about the "environmental topic" when it is extended in a futures wheel?
Display the wheels and allow students to look for similarities and differences.

EXTENSIONS • Regroup the students and develop another futures wheel. Are these
more complete than the first ones? Are they more creative? • Ask the students to develop a futures wheel at home with their family.
Invite the students to bring these wheels to school to display.
Futures Whee'
*The futures wheel was developed by Jerry Glen, a Professor at 'the University of Massachusetts. Joel Barker, Infinity Ltd, St. Paul, has enhanced and refined its use. You can l11a,ke SOURCE: Stubbs, Harriett S, Mary. Lou Klinkhammer, and Marsha Knittig,' a difference!Acid Rain Curriculum Grades 4-8.
Hessler, Edward W. Acid Rain Curriculum. Grades 6-12. 1985
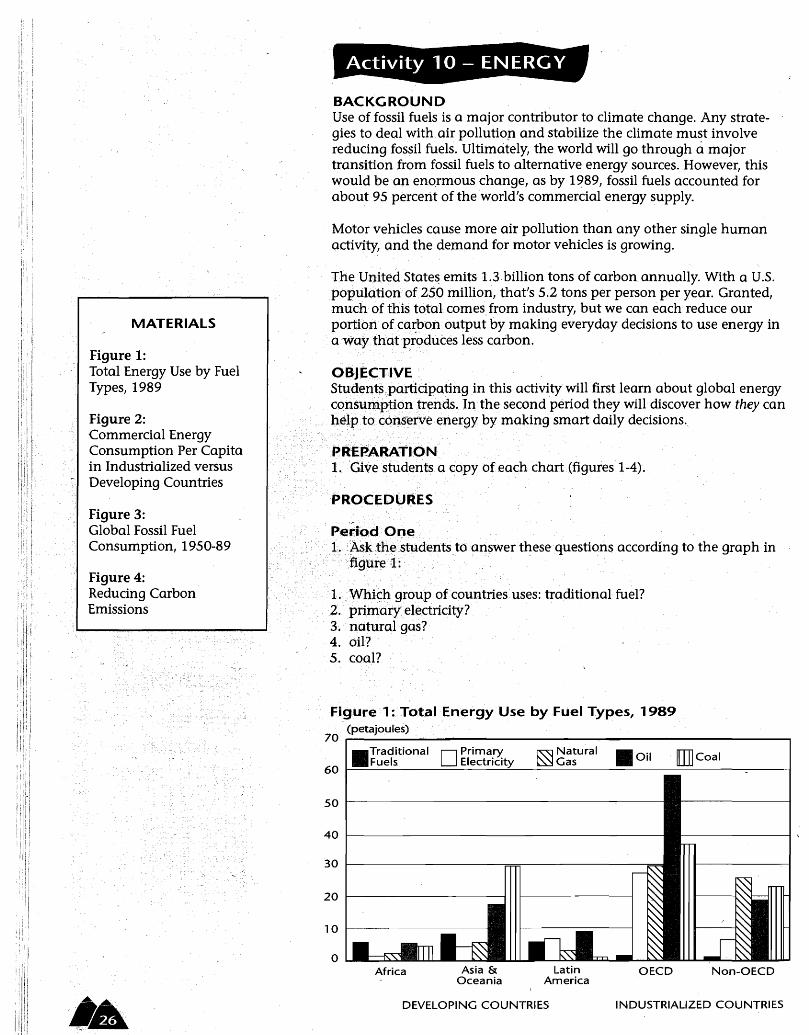
plim~aIYelettricity?
natural gas? oil? coal?
PRO'CEDlJRES
o
P~dodO.FJ~
figurel:
(petajoules) 70 .-----........
30 I----------------p=-----------==
IIITraditional 60 Electricity
50 1---------------------,---
40 1----------------------
10 1-----------
20 1-------------1
Figure 4: Reducing Carbon' Emissions
}.
Figure 3: . Global Fossil Fuel
•.... Consumption, 1950-89
: Developing Countries
MATERIALS
Figure 1: .....
Total Energy Use by Fuel Types, 1989
.' Figure 2: ". Commercial Energy
Consumption Per Capita in Industrialized versus
Activity 10 - ENERGY
BACKGROUND Use of fossil fuels is a major contributor to climate change. Any strategies to deal with air pollutiop and stabilize the climate must involve reducing fossil·fuels. Ultimately, the world will go through amajor transition from fossil fuels to alternative energy sources. However, this would bean enormous change, as by 1989, fossil fuels accounted for about 95 percent of the world's commercial energy supply.
Motor vehicles cause more air pollution than any other single human activity, and the demand for motor vehicles is growing.
The United States. emits 1.3 billion tons of carbon annually. With a U.S. populQtionof250 million, that's 5.2 tons per person per year. Granted, much of'this total comes from industry, but we can each reduce our portion ofcarbon output by making everyday decisions to use energy in awoy.tbatptoduces less carbon.
OBJECTIVE Studentspgrticipatingin this activity will first learn about global energy cQnSl1IllP~i():rltrends. Inthesecondperiod they will discover how they can help .. tocoqser~e·energy by making smart daily decisions.
PREF!ARATION 1. GiVe students a copy bfeath chart (figures 1-4}.
1. ;.i\sK.thestudentstoanswer these questions according to the graph in
Wllich groupofcountriesuses: traditional fuel?
Figure 1: Total Energy Use by Fuel Types, 1989
........- ........----------........----------,D Primary ~ Natural III Oil . mJ CoalFuels ~Gas
Africa Asia &: Latin OECD Non-OECD Oceania America
DEVELOPING COUNTRIES INDUSTRIALIZED COUNTRIES

• ••• • • • • •• • • •••••
-- - -- - ----------
Are there similarities and differences in the energy used by these countries? Can you state these in your own words?
6. Describe a similarity betWeen Organization for Economic Cooperation and Development (OECD) and non-OECD industrialized countries.
7. Is there a difference between OECD and non-OECD industrialized countries?
8. How are African, Asian, and Latin American countries similar? 9. Describe one difference among African, Asian, and Latin American
countrIes. 10. Is there a similarity between developing and industrialized countries? 11. Are there differences between developing and industrialized countries?
Period Two 1. Form small groups and discuss how each student can conserve
energy. Discuss their findings with other groups.
General rule ofthumb: Ifyou save 1 kilowatt-hour, that represents a savings of0.4 pounds ofcarbon not released into the atmosphere.
Figure 2: Commercial Energy Consumption Per Capita in Industrialized Versus Developing Countries
(petajoules) 200
150
--World • • • D~veloping 100
50
o
• •• • • •••• • • • • • • -- Industrialized
I-- - --'1970 1975 1980 1985 1990
SOURCE: United Nations Statistical Office, Energy Statistics Yearbook 1989 (United Nations, New York, 1991), and previous volumes. NOTE: One gigajoule =109 joules.
Figure 3: Global Fossil Fuel Consumption, 1950-89
(exajoules)300 I""l,-..;....---------'----------==----, 250 1--------------------
200 1---------------
150 1------------
100 1-------
o 1950 1960 1970 1980 1989
SOURCE: 1. United Nations (U.N.), Energy Statistics Yearbook 1982 (U.N. New York, 1984). 2. United Nations (U.N.), Energy Statistics Yearbook 1989 (U.N. New York, 1991).
EXTENSION • Ask the students to take their charts home and discuss ways to
conserve energy with their families and report back to the class.
Figure 4: Reducing Carbon Emissions
300 kilowatt~
hours 'per year (kwh/yr.)
2,000 kwh/yr.
1,250 kwh/yr.
3<>qgaUons
50 gallons/yr:
Activity
Home Improving' insulation in your hot water heater
Switching from resistance heater to heat pump
Switching from typical refriger~
ator/freezer to more efficient model
Updating central air conditioning
Substituting an 18~wattcompatt
fluore$cent light for a 75~watt
regular bulb (8 hours/day)
Driving a car with 50 mpg
Driving a ear with 40 mpg
Tuning up your car (at average 500 gallons/yr.)
Planting trees to 500-1,500 kwh/yr. the south,and west of your home
Driving a 'car with 30 mpg, ,(instead ofa car with 20, mpg) for 10,000 miles
Car Carpooling instead ,ofdriWti9 ", gasf?lih¢lft,alone, for 5 friends '
Takitlgintei~c:;ity train instead of air£tigtit
NotQriVingXtn,e "'$~q'~ca~lo~' average U.S. Car goes lQ,QQO'nililes per year)
'Community Using a push mower instead of power mower
SOURCE: Adapted from Francesco Lyman, with Irving Mintzer, Kathleen Courrier, and James MacKenzie, The Greenhouse Trap (Beacon Press, Boston, 1990).
•A
50
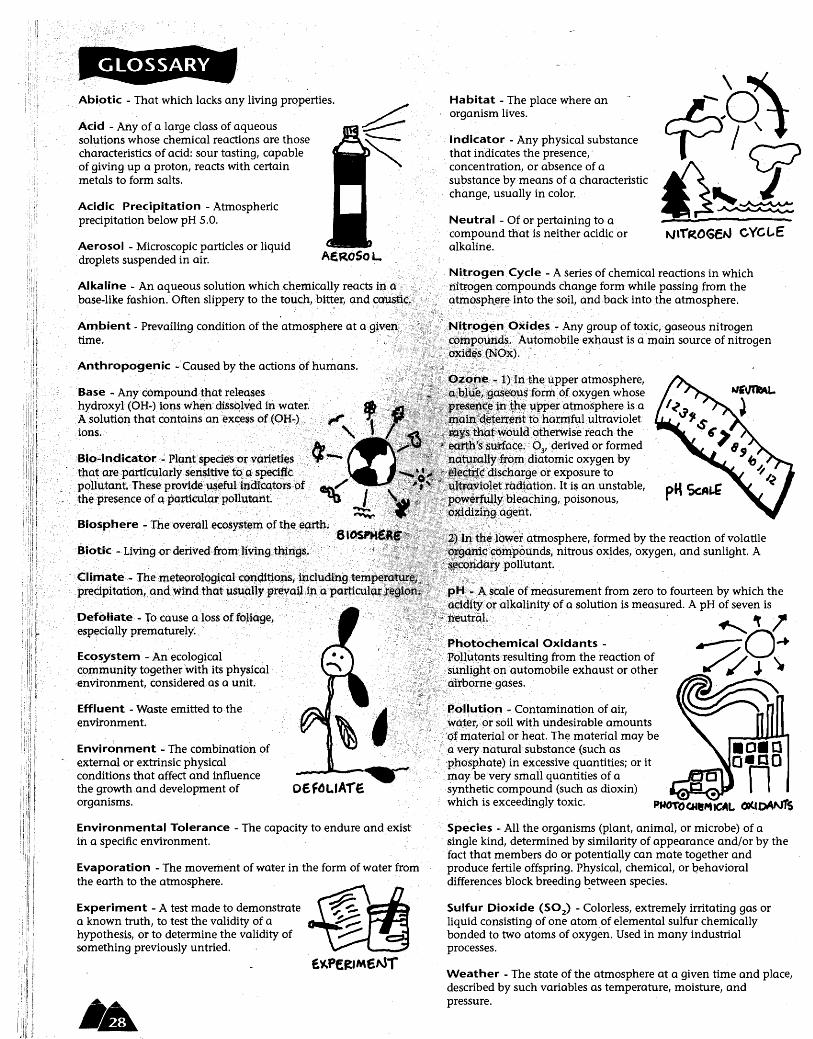
~,i~ ..og~n~,~icl~,$" Any group of toxic, gaseous nitrogen ~.dS.<.Automobileexhaustis a main source of nitrogen ~O~)···.·
atti"!osph.ereintothesoil, and back into the atmosphere.
l)I~:t~e.llPperatmosphere, 'e~'!i~'Jormof oxygen whose
~~:pe~atm0sphereis,a !9"h(u:~tulultraviolet
,~Ulaotherwise reach the fec:e.·••'.. 03,'perived or formed )<~f()lDdiatomic oxygen by scz~~weorexposureto
1~.~tadttltH:m. It is an unstable, lY';blef\ching, poisonous, a~~nt.
l~~e~ atmosphere, formed by the reaction of volatile cz9'ttlP9unds, nitrous oxides, 'oxygen, and sunlight. A
'",pollutp.nt.
< Photochemical Oxidants 1;'PIXutp.ntsIesulting from the reaction of :sl1nlight em automobile exhaust or other airborne gases.
'e<H,utiQn-Contamination of air, wa.~er,. or soil with undesirable amounts
"'q~rnaterialor heat. The material may be avery natural substance (such as 'phosphate) in excessive quantities; or it rnay be very small quantities of a synthetic compound (such as dioxin) which is exceedingly toxic.
Effluent - Waste emitted to the environment.
8io-indicator .•~.. Plant·.speciesotva~~ti~# that .• arepartiCllIady~ensi~ivet()' .•~s~eci~c pQll.utant.·These.provide.Wi~ntlt~diCQ;t()Ji$.pf··.· the presence of apar.tieulQ;l'pollU'talU. .
Bio~ptlere - Theoveralleco$Y$t~mQftJ:}e¢Slrtb;
BiotiC·· -,uvingorde!ivedfrom:livtng.thiing$.
Climate·.•..T~e'mete?r(Jlog~cqle!~di~Otls;j~c~~di!t1gte prec,ipitation~ •• and.~indthQ;tuSllpl1y·gr~ai1ill.a.·pa~eul~
Base -' Any compound that releases hydroxyl (OH-) ions when dissplvedin water. A'solution that contains an. excess of (OH-) ions.
Ecosystem - An ecological c()mmunity together 'with its physical environment, considered as a unit.
base-like fashion. Often slippery to the touch,bitt.er,andco:u.&tl,~
Ambient - Prevailing condition of the atmosphere atag}veti;' time.
Defoliate_ locause a,lossoffoJi~ge,
especially p,rematurely.
Anthropogenic-Causedby the actions Qfhumans.
Environment - The combination of external or extrinsic physical conditions that affect and influence the growth and development of organisms.
'if, GLOSSARY
Abiotic - That which lacks any living properties.
Acid -Any of a large class of aqueous solutions whose chemical reactions are those characteristics of acid: sour tasting, capable of giving up a proton, reacts with certain metals to form salts.
Acidic Precipitation - Atmospheric precipitation below pH 5.0.
Aerosol - Microscopic particles or liquid droplets suspended in air.
!ill Alkaline - An aqueous solution which chemically reacts bl~i;
Environmental Tolerance - The capacity to endure andeXist in a specific environment.
Evaporation - The movement of water in the form of water from the earth to the atmosphere.
Experiment - A test made to demonstrate a known truth, to test the validity of a hypothesis, or to determine the validity of something preViously untried.
Habitat - The place where an organism lives.
Indicator - Any physical substance that indicates the presence,' concentration, or absence of a substance by means of a characteristic chang~, usually in color.
Neutral - Of or pertaining to a compound that is neither acidic or alkaline.
~ itrogen Cyde- Aseries of chemical reactions in which nitrogencOln,pounds change form while passing from the
N'T'ROGEN cYCl.E
Spec,ies - All the organisms (plant, animal, or microbe) of a single kind,' determined by similarity of appearance andlor by the fact that members do or potentially can mate together and produce fertile offspring. Physical, chemical, or Qehavioral differences block breeding ~etween species.
Sulfur Dioxide (S02) - Colorless, extremely irritating gas or liquid consisting of one atom of elemental sulfur chemically bonded to two atoms of oxygen. Used in many industrial processes.
Weather - The state of the atmosphere at a given time and place, described by such variables as temperature, moisture, and pressure.

l
Tips for Using Video Tapes
Many television programs are valuable tools for teaching, but their success depends on how they are used. Here are some questions you may wish to consider in deciding whether or not to use a program and, if so, how to more effectively use it."
Should I use,a video tape of a televised science program in my classroom? - • Does the content of the program contribute to,the achievement of course objectives? If only a part of the
program applies to what is being studied in class, should just a segment of the program be used? • Will the students have sufficieI}t background to understand the major points in the program? If not, is it
feasible to develop the needed background before shoWing the program? • Is the length of the program app~opriate for the class to which it is to be shown? If not, could it be
shown in segments, each followed by discussion and other activities? • Does the program emphasize things that are not easily done in class or with other media, such as
interviews with scientists, or tours of laboratories, or visits to research field sites? • Does the program contain controversial topics with which the teacher wants to deal? If so, do ground
rules for dealing with controversial topics need to be established with the class? • Does the program present a balanced point-of-view on controversial topics? If not, what will need to be
presented in class to provide a balanced'point-of-view? \ • If copied from' television, is permission expressly given for copying the program and for your use? If not,
has permission been obtained to use the program?
How should the program be introduced? • How will students know what they are expected to learn from viewing the program? For example, will
they be given a list of questions to answer as they watch the program? • If the program contains scientific concepts that may be unfamiliar to many students, what will be done , to introduce these concepts before vieWing the program?
• If the program contains scientific vocabulary that is not familiar to many students, what will be done to help students understand this terminology?
How will the program be followed up? • If the students are given questions to answer while watching the program, how will their answers be
used? • Will the students have an opportunity to do investigativ~ laboratory work following the program? • Will the students have ~n opportunity to apply what they have learned by watching the program? • Hdw will what students learned from watching the program be evaluated? Will they be given a test or
evaluated with some type of alternative assessment, such as writing a summary of the program or draWing a concept map?
\
In most situations, time will not permit teachers to do all the things suggested. But attention should be given to ways to introduce and follow-up the program if students are to profit from viewing it. With a sense of direction, many students will apply knowledge.
A program worth showing deserves an introduction and follow-up that will help students profit from having seen the program.
SOURCE: Norman D. A!1derson, North Carolina State University.


