The Separation of Complex Lipide Mixtures by the Use of Silicic Acid Chromatography” JULES HIRSCH AND EDWARD H. AHRENS, JR. From the Rockefeller Institute, New York, New York (Received for publication, February 13, 1958) It is now well established that the various lipide classes of blood (1)) liver (2)) and other organs are metabolically dissimilar. The different fatty acids of the diet (3) and within the organism (4) also have been shown to have variable functions and effects. Methods have recently become available for the rapid and pre- cise analysis of these fatty acids (5) and it is reasonable to expect that an analysis of the fat,ty acid composition of each lipide class will yield rich information concerning the transport and metab- olism of fatty acids. Considerations of this type indicate the need for a reliable, standardized method for the separation of the lipide classes. The present communication describes a method for such separation based on adsorption chromatography with silicic acid. Since Trappe’s introduction of silicic acid chromatography for lipide separation in 1940 (6, 7), a considerable experience has been gained with this procedure (8-11). Such information has been put to practical use in many types of lipide separations (1, 12, 13) but workers have found that the separations can be cap- ricious and unreliable. Therefore, a systematic study of the many variables seemed desirable. Information obtained from this study and from previous investigations of the properties of silicic acid (14-16) were used to elaborate a standardized method for the separation of lipide groups. The present report is a de- scription of the method and some representative results. METHODS Adsorbent-Mallinckrodt silicic acid, 100 mesh, labeled “suit- able for chromatographic analysis by the method of Ramsey and Patterson” is used. Whereas different batches (control No. DLD and control No. CVB) have given the same results, other com- mercially available silicic acids do not give the same results as these Mallinckrodt preparations. Since reduction of particle size enhances resolution of the column (16), 200 gm. of adsorbent are milled for 10 to 12 hours with 400 gm. of t-inch porcelain balls in an Abbe mill. 90 per cent of this milled silicic acid will pass through a standard 325 mesh sieve, but before milling only 50 per cent passes the sieve. The ground silicic acid is placed in a 2 liter glass cylinder. Absolute methanol is added to the 2 liter mark, and the silicic acid suspended by rapid agitation. After csactly 30 minutes of settling, the methanol and suspended silicic acid are decanted and discarded. This is repeated once again with methanol and twice with ethyl ether. These repeated sus- pensions remove extremely fine particles which slow the column * Supported in part by the U. S. Public Health Service (H-2539)) Williams-Waterman Fund, and the Nutrition Founda- tion. flow rate and may be washed from the column by polar eluants. Finally, the remaining silicic acid is dried in air and stored in a dry glass container. Silicic acid moist with organic solvents may be explosive if heated; thus, the drying should be done slowly in a warm, dry atmosphere. Such preparation yields about 75 per cent of the starting material.’ Adsorption vulues-These are determined by a modification of Trappe’s method (6). Test solutions are made with 50 or 100 mg. of solute per 100 ml. of the solvent under study. 4 gm. aliquots of silicic acid are weighed into a series of 50 ml. glass- stoppered centrifuge tubes. The adsorbent is activated in an oven at 115” for 1 hour and cooled to 20”. A 25 ml. sample of each test solution is pipetted into each of the tubes. Solutions and adsorbents are mixed by repeated gentle inversion and al- lowed to stand for 30 minutes at 20”. Aliquots of the superna- tant solutions are analyzed gravimetrically and the percentage of lipide adsorbed is computed. Apparatus-A useful all Pyrex2 apparatus is shown diagrammat- ically in Fig. 1. It is held together firmly by mechanical clamps and stainless steel leashes. The solvent reservoir consists of a globe type 1200 ml. separatory funnel ending below the stopcock in a ground male joint. This fits into a separate short segment which is, in turn, connected through a ball and socket joint with the upper end of the jacketed Pyrex cylinder (250 x 18 mm.), comprising the column. The mercury filled glass plunger in the separatory funnel maintains an air pocket above the column, thereby preventing back diffusion of solutes from the column into the solvent reservoir. The column is supported below by a coarsely sintered glass disk on a ground glass fitting. The flow rate is largely determined by the characteristics of the adsorbent and the packing. It can also be affected by changing the small head of pressure of solvent immediately above the column or by applying nitrogen under pressure to the solvent reservoir. No attempt is made to regulate flow rate with the stopcocks of the apparatus. Large fractions are collected in glass beakers; for smaller fractions an automatic collector is useful. The adsorp- tion of lipides on silicic acid diminishes with rising temperature, which causes more rapid elution. Thus, temperature control of 1 Recently the Bio-Rad Laboratories, 800 Delaware Street, Berkeley, California, have begun the commercial production of silicic acid prepared according to these specifications. Their product has been tesed in this laboratory and found to give the same results as those reported here. 2 These parts were made by the Scientific Glass Apparatus Com- pany, Inc., Bloomfield, New Jersey, and are available as chroma- tographic apparatus No. 57824. Separate part,s may be ordered and should be referred to by the circled numbers in Fig. 1. 311 by guest on June 6, 2018 http://www.jbc.org/ Downloaded from
Transcript
The Separation of Complex Lipide Mixtures by the Use of
Silicic Acid Chromatography”
JULES HIRSCH AND EDWARD H. AHRENS, JR.
From the Rockefeller Institute, New York, New York
(Received for publication, February 13, 1958)
It is now well established that the various lipide classes of blood (1)) liver (2)) and other organs are metabolically dissimilar. The different fatty acids of the diet (3) and within the organism (4) also have been shown to have variable functions and effects. Methods have recently become available for the rapid and pre- cise analysis of these fatty acids (5) and it is reasonable to expect that an analysis of the fat,ty acid composition of each lipide class will yield rich information concerning the transport and metab- olism of fatty acids. Considerations of this type indicate the need for a reliable, standardized method for the separation of the lipide classes. The present communication describes a method for such separation based on adsorption chromatography with silicic acid.
Since Trappe’s introduction of silicic acid chromatography for lipide separation in 1940 (6, 7), a considerable experience has been gained with this procedure (8-11). Such information has been put to practical use in many types of lipide separations (1, 12, 13) but workers have found that the separations can be cap- ricious and unreliable. Therefore, a systematic study of the many variables seemed desirable. Information obtained from this study and from previous investigations of the properties of silicic acid (14-16) were used to elaborate a standardized method for the separation of lipide groups. The present report is a de- scription of the method and some representative results.
METHODS
Adsorbent-Mallinckrodt silicic acid, 100 mesh, labeled “suit- able for chromatographic analysis by the method of Ramsey and Patterson” is used. Whereas different batches (control No. DLD and control No. CVB) have given the same results, other com- mercially available silicic acids do not give the same results as these Mallinckrodt preparations. Since reduction of particle size enhances resolution of the column (16), 200 gm. of adsorbent are milled for 10 to 12 hours with 400 gm. of t-inch porcelain balls in an Abbe mill. 90 per cent of this milled silicic acid will pass through a standard 325 mesh sieve, but before milling only 50 per cent passes the sieve. The ground silicic acid is placed in a 2 liter glass cylinder. Absolute methanol is added to the 2 liter mark, and the silicic acid suspended by rapid agitation. After csactly 30 minutes of settling, the methanol and suspended silicic acid are decanted and discarded. This is repeated once again with methanol and twice with ethyl ether. These repeated sus- pensions remove extremely fine particles which slow the column
* Supported in part by the U. S. Public Health Service (H-2539)) Williams-Waterman Fund, and the Nutrition Founda- tion.
flow rate and may be washed from the column by polar eluants. Finally, the remaining silicic acid is dried in air and stored in a dry glass container. Silicic acid moist with organic solvents may be explosive if heated; thus, the drying should be done slowly in a warm, dry atmosphere. Such preparation yields about 75 per cent of the starting material.’
Adsorption vulues-These are determined by a modification of Trappe’s method (6). Test solutions are made with 50 or 100 mg. of solute per 100 ml. of the solvent under study. 4 gm. aliquots of silicic acid are weighed into a series of 50 ml. glass- stoppered centrifuge tubes. The adsorbent is activated in an oven at 115” for 1 hour and cooled to 20”. A 25 ml. sample of each test solution is pipetted into each of the tubes. Solutions and adsorbents are mixed by repeated gentle inversion and al- lowed to stand for 30 minutes at 20”. Aliquots of the superna- tant solutions are analyzed gravimetrically and the percentage of lipide adsorbed is computed.
Apparatus-A useful all Pyrex2 apparatus is shown diagrammat- ically in Fig. 1. It is held together firmly by mechanical clamps and stainless steel leashes. The solvent reservoir consists of a globe type 1200 ml. separatory funnel ending below the stopcock in a ground male joint. This fits into a separate short segment which is, in turn, connected through a ball and socket joint with the upper end of the jacketed Pyrex cylinder (250 x 18 mm.), comprising the column. The mercury filled glass plunger in the separatory funnel maintains an air pocket above the column, thereby preventing back diffusion of solutes from the column into the solvent reservoir. The column is supported below by a coarsely sintered glass disk on a ground glass fitting. The flow rate is largely determined by the characteristics of the adsorbent and the packing. It can also be affected by changing the small head of pressure of solvent immediately above the column or by applying nitrogen under pressure to the solvent reservoir. No attempt is made to regulate flow rate with the stopcocks of the apparatus. Large fractions are collected in glass beakers; for smaller fractions an automatic collector is useful. The adsorp- tion of lipides on silicic acid diminishes with rising temperature, which causes more rapid elution. Thus, temperature control of
1 Recently the Bio-Rad Laboratories, 800 Delaware Street, Berkeley, California, have begun the commercial production of silicic acid prepared according to these specifications. Their product has been tesed in this laboratory and found to give the same results as those reported here.
2 These parts were made by the Scientific Glass Apparatus Com- pany, Inc., Bloomfield, New Jersey, and are available as chroma- tographic apparatus No. 57824. Separate part,s may be ordered and should be referred to by the circled numbers in Fig. 1.
312 Separation of Complex Lipide Mixtures Vol. 233, No. 2
the column is essential. Constant temperature is achieved by continuous circulation of water at 25” pumped through the jacket from a constant temperautre circulating bath (American In- strument Company, catalogue No. 4-96).
Column Preparation-In the separation of materials of widely different polarities, silicic acid may be used merely as a selective filter which retains one lipide while another is being washed through the column. However, for reproducible separations of closely related lipides, meticulous attention to the details of col- umn construction is required. 18 gm. of silicic acid, weighed from a batch of adsorbent which has been dried at 115” overnight, is dusted into the jacketed glass column; it settles on the sintered glass plate which is covered by a circular disk of ether-extracted filter paper. With gentle tapping of the sides of the cylinder as the adsorbent is gradually added, the column shrinks slowly into place with a flat upper surface. Maximal suction from a water aspirator (pressure = <2 cm. of mercury), applied to the lower end of the column, causes slight further shrinkage and assures even, reproducible packing. Finally, another circular disk of filter paper is placed, without pressure, against the top
lR
--V=Volume (constant)
Nz
1200
FIG. 1. Apparatus used for column chromatography with silicic acid consisting of a lower assembly and two types of upper assem- bly. Lower assembly: This shows the jacketed column and sur- rounding Pyrex parts. The top of this assembly fits into either type of upper assembly. Upper assemblies: The two arrange- ments shown here are for step-wise elution with a single flask (left) or for gradient elution with two flasks in tandem (right). All parts labeled by circled numbers are commercially available.2
of the column. This prevents dislodging of the upper layer of ad- sorbent into the solvent.
The silicic acid in such a column contains a variable amount of water which acts as the stationary phase of a liquid-liquid parti- tion system. With less water the effects approach adsorption on a solid surface, becoming maximal when the silicic acid is about 5 per cent water by weight (15). Oven-heating removes varying amounts of water, but the desired degree of activation is more reproducibly obtained by the use of dehydrating washes (16). For this purpose, the column is successively washed with 10 ml. of ethyl ether, 30 ml. of acetone-ethyl et.her (1: 1, v : v) and finally 20 ml. of ethyl ether. Gentle suction from below hastens these preliminary washings. When completed, the column is attached to the solvent reservoir containing petroleum ether (b. p. 60- 70”)) and allowed to wash slowly for 10 to 12 hours to assure com- plete removal of the dehyrating solvents. Since temperature change and bubbling may disrupt the column structure, all solvents should be at the same or slightly higher temperature than that of the column; and the constant temperature device described above must be used from the time the preliminary dehydrating washes are begun.
A column prepared in this way has the following characteris- tics: column volume = 22 ml.; flow rate of petroleum ether under pressure of the solvent reservoir = 0.3 to 0.6 ml. per minute. Colored substances, such as p-nitroaniline or carotene, are eluted by benzene or petroleum ether in a sharp band, 0.5 to 1.0 cm. in width, which during column passage remains almost precisely perpendicular to the long axis of the column. A determination of the column constants defined by LeRosen (17) indicates that a column of this type is suitable for the most demanding separa- tions.
Charging the Column-When the petroleum ether washing is finished, any solvent remaining above the column is gently sucked away without allowing the upper surface of the column to dry. The mixture of lipides to be separated is dissolved in as small a volume of petroleum ether as possible and pipetted on to the col- umn. In dealing with substances relatively insoluble in petro- leum ether, such as monoglycerides, it may be necessary to add the dry compound to a small volume of solvent above the column. As the elution proceeds, this material slowly dissolves. In this way the total volume of solvent used for charging the column is kept under the permissible maximum of 20 ml. In the results to be reported, the total amount of lipide charge did not exceed 300 mg., usually with no more than 50 mg. of each component. With these quantities there has been no evidence of column over- loading. After the charge has passed into the column, the sides of the glass cylinder above the column are washed with 1 to 2 ml. of petroleum ether. When this has entered the column, elu- tion with more polar solvents is begun.
E&ion-All solvents used for elution are of reagent grade, redistilled in glass. The only solvent requiring special treatment is ethyl ether which is distilled over sodium and stored at O-5”. Ether treated in this manner remains free of peroxides for at least 3 months.
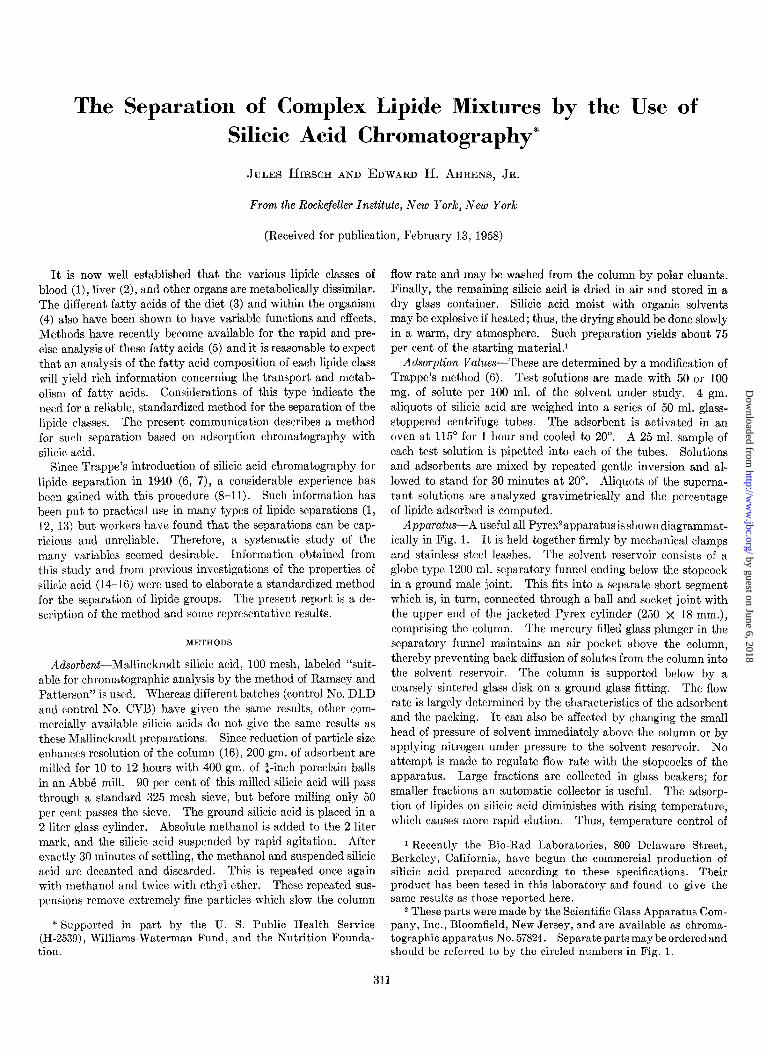
Elution carried out with solvent mixtures of increasing polarity produces an orderly migration of lipide classes from the column. The solvent pair, ethyl ether and petroleum ether (b. p. 60-70”), is employed for this purpose. This system was recommended by Fillerup and Mead (10) for the separation of serum lipides and has been found useful in the chromatography of other organic
50 ml. of 1% ethyl ether in petroleum ether (60-70”)
75 ml. of 1% ethyl ether in petroleum ether
225 ml. of 1% ethyl ether in petroleum ether; then, 60 ml. of 4% ethyl ether in petroleum ether
240 ml. of 40/, ethyl ether in petroleum ether; then, 200 ml. of 8% ethyl ether in petroleum ether
450 ml. of 8% ethyl ether in petroleum ether; then, 50 ml. of 25yn ethyl ether in petroleum ether
200 ml. of 25’% ethyl et,her in petroleum ether
300 ml. of ethyl ether
400 ml. of absolute methanol
B. Stepwise elution of 3 major classes of fatty acid esters
Fraction Eluant
I 350 ml. of 1% et,hyl ether in petroleum ether; then, 60 ml. of 40/, ethyl ether in petroleum ether
II 300 ml. of ethyl ether
III 400 ml. of absolute methanol
C. Gradient elution of 8 major classes of lipides
Fraction Eluant
I (1200 ml. of 10% ethyl
Upper reservoir ether in petroleum ether;
I then, 1000 ml. of ethyl
Lower (mixing) reservoir 1
600-800 ml. of petroleum ether
II Then, 400 ml. of absolute methanol
substances (14). Changes in polarity can be effected by abrupt, stepwise changes in ethyl ether concentration or by a gradient of ethyl ether concentration. There are many variations of these two techniques, each useful for certain separations. Three elu- tion schemes, found to have particular utility in this laboratory, are given in detail in Table I.
Simple theoretical considerations enable an approximation of the solvent concentrations during gradient elution. If a mixture of ethyl ether in petroleum ether of concentration C (upper res- ervoir) is added to a mixing chamber containing V ml. of petro- leum ether in which there is complete mixing (lower reservoir), and if R, the rate of inflow from the upper reservoir, equals the rate of outflow from the lower mixing chamber, the concentration of ethyl ether in petroleum ether, E, which leaves the mixing flask in time, t, changes as follows:
Scheme A-Successive solvent mixtures are applied when the last remnants of the preceding mixture disappear into the column. Since care must be taken to prevent the head of the column be- coming dry, the timing of these changes requires considerable attention. At the time of each solvent change, the lower stop- cock is closed and the glass tip beneath the stopcock is washed with a few ml. of chloroform which is added to the eluate last cnllscted. In this wav. the small amount of solute which crvstal-
dE RC - RE -= at v
The solution of this equation under the conditions mentioned above is:
E=C- e& ( > This is a special case of the more general equation of gradient
Y I
3 Made by Beeton, Dickinson and Company, Rutherford, New . ,
Jersey. Catalogue No. 421 B.
1; 42mm.
1 Gmwe to allow
rod
FIG. 2. Stirring device in mixing flask. Rapid mixing of the eluant during gradient elution is achieved by this Teflon and glass device which holds a magnetic bar close to an externally placed, rotating magnetic field. The magnetic bar and Teflon holder spin freely on the glass rod.
lizes out of solution and encrusts the glass tip is recovered. Such encrustation can be reduced by fusing a Baketel adapter3 to the tip and attaching a fine bore stainless steel needle (No. 23) as shown in Fig. 1. Elution is completed by the addit.ion of meth- anol. This must be added slowly, otherwise the rapid mixing of methanol with ethyl ether may disrupt the column structure.
Scheme B-As shown in Table I, this is a simplified elution pat- tern for isolating the major classes of fatty acid esters.
Scheme C-Gradient elution provides an almost completely automatic means of changing the solvent polarity which thus avoids the necessity of carefully timed solvent applications. It is achieved by using two separatory funnels joined in series above the column as shown in Fig. 1. The two mercury-weighted plungers maintain air pockets in the mixing flask and above the column. Rapid and thorough mixing is accomplished by a Teflon-covered magnetic bar, spun by a magnetic stirrer outside the mixing reservoir. The magnetic bar must be swivelled in order to fit through the top of the solvent reservoir. This assem- bly (Fig. 2) is made of glass and Teflon since organic solvents ex- tract plasticizers and other material from rubber and most plas- tics other than Teflon.
314 Separation of Complex Lipide Mixtures Vol. 233, No. 2
, 0 400 800 1200 1600 Zoo0 MOO
Time in minutes FIG. 3. Change in composition of eluant during gradient elu-
tion. The heavy, unbroken line is the theoretical curve of solvent concentration when 10 per cent ethyl ether in petroleum ether is added to a constant volume of petroleum ether, V, at a rate of (V/1000) ml./min. After 20 hours, ethyl ether is added and the second, steeper limb of the curve is described. The broken line shows, for comparison, the solvent concentration changes which occur with the step-wise elution scheme of Table I, if a flow rate of 0.8 ml./min. is assumed.
elution proposed by Lakshmanan and Lieberman (18). The curve of solvent concentration as a function of time described by this equation can be controlled regardless of variations in R, the flow rate of the column, by altering V, an easily changed pa- rameter. Generally, columns fitted with the gradient elution ap- paratus (Fig. 1) will flow at the increased rate of 0.6 to 0.8 ml./ min. because of the greater pressure head. A convenient value of V for this flow rate is 600 to 800 ml., which maintains R/V
at 0.001. Under these circumstances, the curve of solvent con- centration is that shown in Fig. 3 (solid line). Such gradient elution satisfactorily separates all lipide classes by adherence to the following scheme: 1200 ml. of 10 per cent ethyl ether in pe- troleum ether in the upper funnel flows into 600 to 800 ml. petro- leum ether in the lower. When the upper reservoir empties, the final eluate of 1000 ml. ethyl ether is added to it. Finally, when both chambers empty, the gradient elution device can be removed, and 400 ml. of methanol are added directly to the column for completion of the elution.
Analysis-Solvent is removed from large fractions at room temperature by vacuum distillation in a Craig rotary distillation apparatus (19). When necessary, this is done under a cover of nitrogen. The solute is redissolved in a known volume and ali- quots are taken for analysis. The weight of solute is determined in tared glass shells by the method of Craig et al. (20). De- terminations of free and esterified cholesterol are made by the Sperry-W7ebb method (21) and the lipide phosphorus analysis by a modification of Stewart and Hendry’s method (22). Other valuable methods occasionally used for more specific identifica- tions are the titration of nonesterified fatty acids according to Dole (23) and the ninhydrin reaction of unhydrolyzed phos- pholipides described by Lea and Rhodes (24).
When many small fractions are collected, the method of Rap- port and Alonao (25) for esters of carbosylic acids is particularly
TABLE II Source of reference compounds
Compound
Cholesteryl palmitate, lauric acid, distearin, dipalmitin, dilaurin, monostearin, mon- olaurin, monopalmitin (l- and P-isomers), monoacetin and “mono- and di-acetin fats”
useful. In the case of cholesterol esters, the end products of the reaction may be insoluble in the final color reagent (ethanolic ferric perchlorate). To circumvent this, n-butanol is substituted for ethanol. The final colored product is compared with a monoglyceride standard and the result reported in microequiva- lents of carboxyl ester.
The quantity of 1-monoglyceride in a mixture of the I- and 2-isomers is determined by the intensity of color created when a sensitive Schiff reagent (26) is allowed to react with the periodic acid oxidation products.
Reference Compounds-The use of impure compounds results in uncertain yield and confusing results. Recrystallization is al- most always necessary when the commercially available supplies of triglycerides and cholesterol are used. The various com- pounds used in these studies and their sources are listed in Ta- ble II.
RESULTS
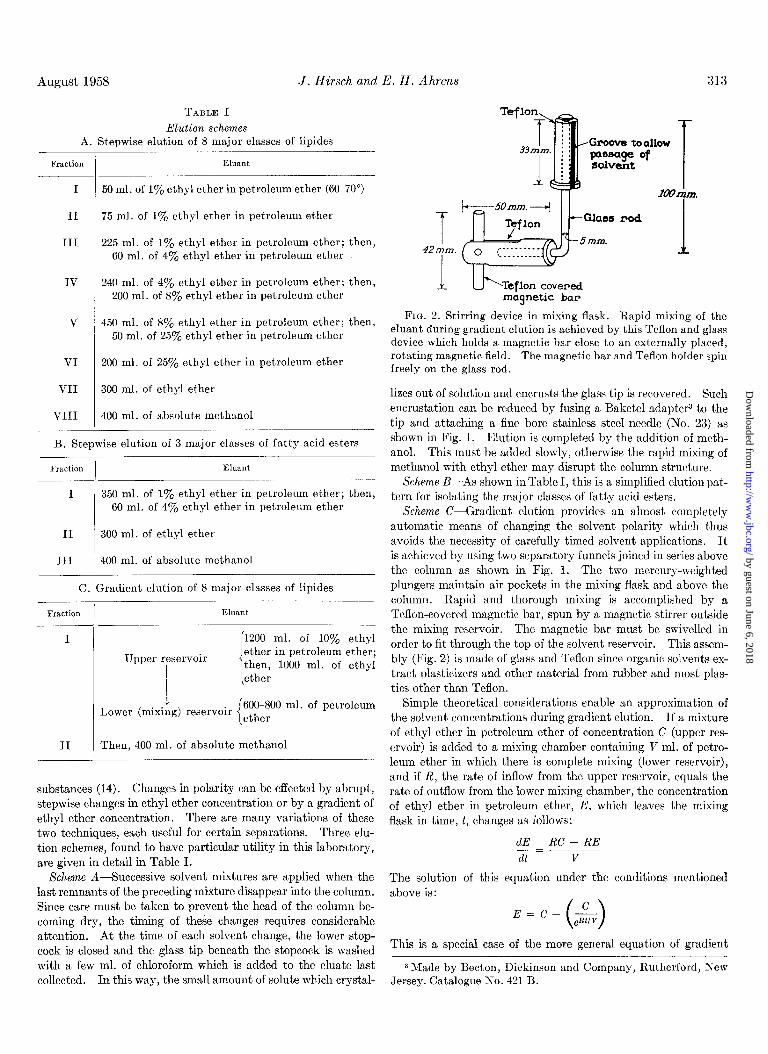
Adsorption Values-The adsorptive properties of silicic acid for
lipides can be studied by measuring the adsorption values of pure
I” Adsorption
60 0 Paaaffin l Squalene 0 Cholestepyl
palmitate
Per cent ethyl ethec/pet. ether
FIG. 4. The percentage of lipide adsorbed at 20” by 4 gm. of silicic acid from 25 ml. of a 100 mg./lOO ml. solution.
compounds in ethyl ether-petroleum ether mixtures (Figs. 4.and 5). Study of such data enables selection of the best solvent com- Adsorption Values
binations for subsequent separation. For example, the adsorp- tion values of paraffin, squalene, and cholesteryl palmitate (Fig. 4) show maximal differences at 0.5 to 1 per cent concentra- ,z 100
0 Tripalmitin A Cholesterol
tion of ethyl ether in petroleum ether. In application of these g D
0 ~7 Dipalmitin
findings, chromatographic elution with 1 per cent ethyl ether in 8 80 l Monopalmitin
petroleum ether yields complete separation of these three corn- pounds (Fig. 6). In general, substances which differ by 10 or
$
more per cent in adsorption value in a given solvent mixture can 2 60-
be separated completely by that mixture. These considerations 8
led to the adoption of the various clution schemes described F 40 8
above. Chromatographic Separations-Results obtained by various
20
types of elution can be illustrated by representative separations of synthetic mixtures of lipides as well as by separation of the
biiii-
10 20 30 40 50 60 70 80 90 1 i 00
components in naturally occurring mixtures such as the lipides of human serum. For demonstration of completeness of re- covery, separations are most satisfactorily made by the collection of large batches of eluate, but the best illustration of the course of elution is obtained by collecting many small fractions. Re- sults obtained by the three elution schemes described in Table I will be given in order:
Pep cent ethyl ether/pet. ether
FIG. 5. The percentage of lipide adsorbed at 20” by 4 gm. of silicic acid from 25 ml. of a 50 mg./lOO ml. solution
Scheme A: Stepwise El&ion of Eight Major Classes of Lipides- This eiution scheme enables the resolution of a complex lipide mixture into eight discrete classes: saturated hydrocarbons, un- saturated hydrocarbons, cholesterol esters, triglycerides, nones- terified cholesterol, diglycerides, monoglycerides, and phospho- lipides. The chromatographic behavior of homologous members of each lipide class is a function of chain length and unsaturation of its constituent fatty acids. Therefore, to test the limits of the method, columns were charged with substances of the same chem- ical class but composed of fatty acids of widely divergent polarity. These studies were done with synthetic mixtures and also with the lipide mixture found in human serum.
Synthetic Mixtures of Lipides (Table III)-Cholesterol esters, ranging in molecular weight from cholesteryl stearate to choles- teryl acetate (Fraction III), separate from the unsaturated hydro- carbons (Fraction II) but precede saturated, long-chain triglyc- erides (Fraction IV) from the column. Fraction IV contains
M9
liydnocarbons and Chol. Ester
Charge: Paraffin Squalene
30.2 mg. 28.4 ”
Cholesteryl palmitate 21.3 11
Eluant : 1 pep cent ethyl ether in petroleum ether
(60-70’)
Ml. 30 60 90 120 150 180 210 240 270 300
FIG. 6. The separation (as predicted from the adsorption values of Fig. 4) of two hydrocarbons and a cholesterol ester by elution from an 18 gm. column of silicic acid wit.h 1 per cent ethyl
Monostearin, monolaurin, vita- min A acetate, lithocholic acid, a-glyceryl ether (chimyl alco- hol) { Desoxycholic acid*
Monoacetin, dimyristoyl l-or-lecithin
* Overlaps two fractions
saturated triglycerides ranging in molecular size from tristearin to tricaproin, as well as the highly unsaturated, long-chain tri- glycerides of linseed oil. Distearin is found in Fractions V and VI, and thus is not completely separated from nonesterified cholesterol in Fraction V, but C1O.16 diglycerides are found only in Fraction VI. The very short chain triglyceride, tributyrin, is also contained in this fraction. Monostearin, monopalmitin, and monolaurin all appear in Fraction VII. However, the very short-chain monoglyceride formed from acetic acid is eluted with phospholipides in Fraction VIII.
I f one long-chain fatty acid of a typical triglyceride is replaced by acetic acid (“monoacetin fat”) )4 the chromatographic proper- ties are not significantly changed, and the fat is eluted in Frsc- tion IV with the other triglycerides. However, if two moles of acetic acid replace two long-chain fatty acids in a triglyceride (“diacetin fat”), the new fat becomes considerably more polar and is eluted in Fractions V and VI along with distearin. I f an ether linkage replaces one of the carbosyl ester linkages in a tri- glyceride, the pattern of elution is unchanged. Thus, chimyl dioleate behaves like a triglyceride and chimyl alcohol like a monoglyceride.
Detailed analyses of each fraction demonstrate the complete- ness of separation and recovery by this procedure. Two exam- ples of this are shown in Table IV. A small amount of solute, usually less than 2 mg., may be present in Fractions VI, VII, and VIII even in the absence of di- or monoglycerides or phos- pholipides. This is due to a small amount of silicic acid washed from the column by these polar eluants, a contamination kept to a minimum by the method of adsorbent preparation described
4 This nomenclature is recommended by Mattson et al. (27).
A “monoacetin fat” or “diacetin fat” is one in which one or two of the fatty acids of a conventional triglyceride are replaced by acetic acid.
TABLE IV Separation of synthetic mixtures into major lipide classes
* Expressed as milligram of cholesteryl palmitate.
above. The small amount of cholesterol which contaminates the diglyceride fraction indicates the difficulty in separating non- esterified sterols from diglycerides.
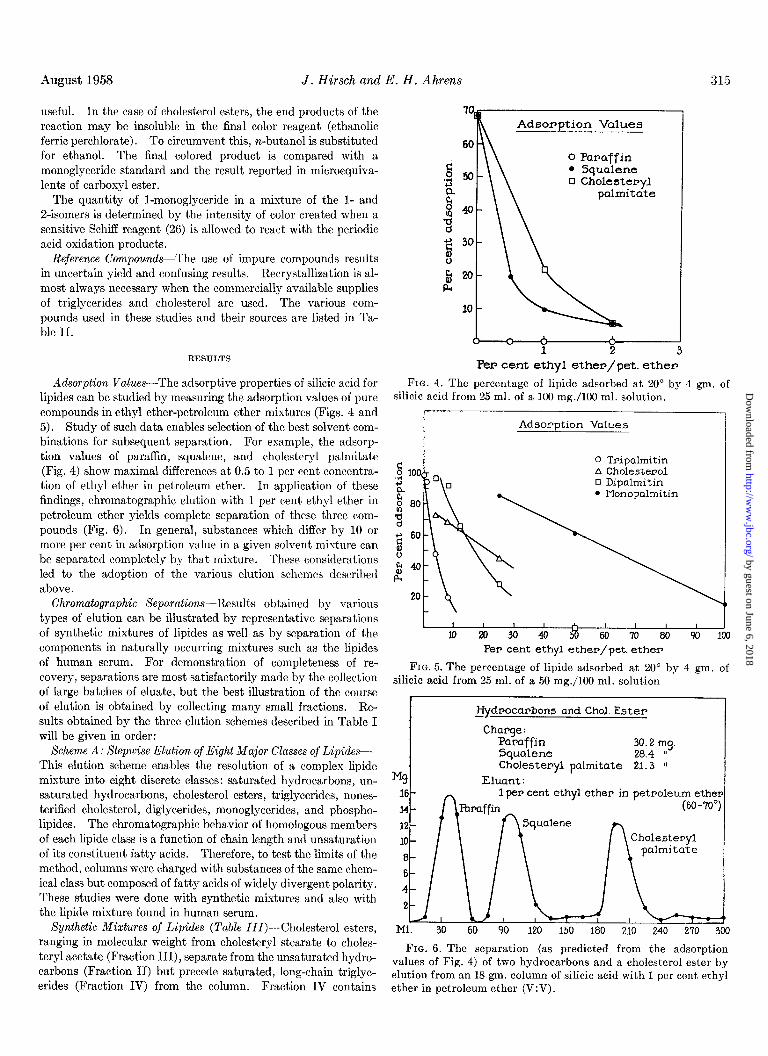
If many small fractions are taken for analysis, an elution curve is obtained which may indicate the separation of components within a single class. This is illustrated in Fig. 7 which shows the curve of elution of a column charged with representative mem- bers of many lipide classes. A separation of two triglycerides, tristearin and tricaproin, is clearly seen. Another feature of in- terest in this curve is the prolonged tail of the cholesterol peak and the consequent incomplete separation of cholesterol and di- palmitin. This tailing was shown to be the result of impurities in the cholesterol with which the column was charged, for when freshly recrystallized cholesterol was used, a more complete sep- aration (Fig. 8) was obtained. Yet, even this curve shows some tailing of cholesterol elution. Since Trappe (7) had shown that cholesterol may undergo transformation on columns of silicic acid, the possibility that tailing might have resulted from alteration during column passage was entertained and explored by infrared spectral analysis of material from various portions of the elution curve. All spectral patterns were precisely the same. Thus,
Fractions of Scheme A I-I+II~II~ lv,&---+-vI+vII---i
-4%4+ (300 ml.)
8% 650 ml.
-I-- 25 % -EGO% ethyl+ (200 ml.) ether (ZoomI)
FIG. 7. Elution of representative substances of seven major classes of lipides from an 18 gm. column of silicic acid. The abscissa shows the tube numbers collected fractionally and the various solvents used to effect elution. The fractions of stepwise elution scheme A are also shown and indicate the location of these steps on the elution curve.
the tailing must be ascribed to the particular adsorption charac- teristics of cholesterol. This phenomenon has also been en- countered in the silicic acid adsorption chromatography of uri- nary ketosteroids (18).
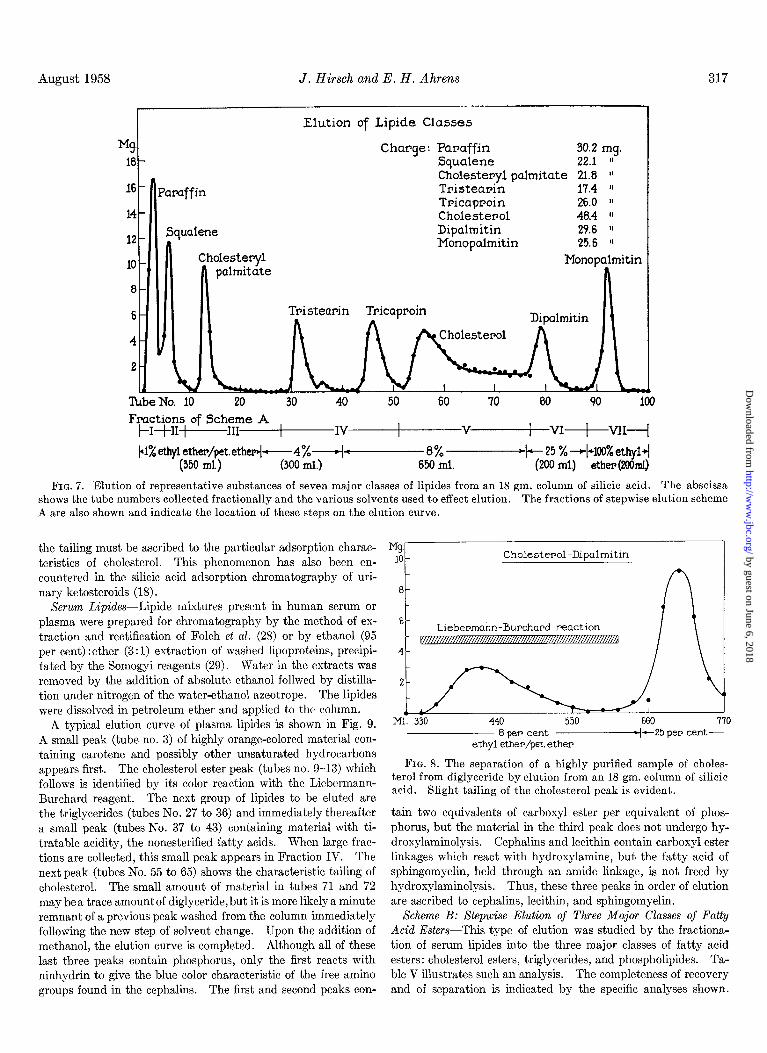
Serum Lipides-Lipide mixtures present in human serum or plasma were prepared for chromatography by the method of ex- traction and rectification of Folch et al. (28) or by ethanol (95 per cent) : ether (3 : 1) extraction of washed lipoproteins, precipi- tated by the Somogyi reagents (29). Water in the extracts was removed by the addition of absolute ethanol follwed by distilla- tion under nitrogen of the water-ethanol azeotrope. The lipides were dissolved in petroleum ether and applied to the column.
A typical elution curve of plasma lipides is shown in Fig. 9. A small peak (tube no. 3) of highly orange-colored material con- taining carotene and possibly other unsaturated hydrocarbons appears first. The cholesterol ester peak (tubes no. 9-13) which follows is identified by its color reaction with the Liebcrmann- Burchard reagent. The next group of lipides to be eluted are the triglycerides (tubes No. 27 to 36) and immediately thereafter a small peak (tubes No. 37 to 43) containing material with ti- tratable acidity, the nonesterified fatty acids. When large frac- tions are collected, this small peak appears in Fraction IV. The next peak (tubes No. 55 to 65) shows the characteristic tailing of cholesterol. The small amount of material in tubes 71 and 72 may be a trace amount of diglyceride, but it is more likely a minute remnant of a previous peak washed from the column immediately following the new step of solvent change. Upon the addition of methanol, the elution curve is completed. Although all of these last three peaks contain phosphorus, only the first reacts with ninhydrin to give the blue color characteristic of the free amino
I”% 10
a
Cholesterol-Dipalmitin
A
4 I I 6’-
t
Liebermann-Buechard reaction
41- I \I
2- ,
L M1: 350 440 550 660 170
8 pm cent p-j--25 pep cent- ethyl ether/pet. ether
FIG. 8. The separation of a highly purified sample of choles- terol from diglyceride by elution from an 18 gm. column of silicic acid. Slight tailing of the cholesterol peak is evident.
tain two equivalents of carboxyl ester per equivalent of phos- phorus, but the material in the third peak does not undergo hy- droxylaminolysis. Cephalins and lecithin contain carboxyl ester linkages which react with hydroxylamine, but the fatty acid of sphingomyelin, held through an amide linkage, is not freed by hydroxylaminolysis. Thus, these three peaks in order of elution are ascribed to cephalins, lecithin, and sphingomyelin.
Scheme B: Stepwise El&ion of Three Major Classes of Fatty Acid Esters-This type of elution was studied by the fractiona- tion of serum lipides into the three major classes of fatty acid esters: cholesterol esters, triglycerides, and phospholipides. Ta- ble V illustrates such an analysis. The completeness of recovery
groups found in the cephalins. The first and second peaks con- and of separation is indicated by the specific analyses shown.
FIG. 9. The separation of the lipide components of human plasma by elution from an 18 gm. column of silicic acid. Three peaks of phosphorus-containing lipide correspond to the three types of phospholipide found in human plasma. The abscissa shows the tube numbers collected fractionally and the various solvents used to effect elution. The fractions of stepwise elution scheme A are also shown and indicate the location of these steps on the elution curve.
NonesteriEed fatty acids and nonesterified cholesterol are found with triglycerides as are any small amounts of partial glycerides which may be present. In Fraction III, there is a little less than 2 peq. of carboxyl ester per peq. of phosphorus, as expected in a mixture of serum phospholipides.
Scheme C: Gradient EL&ion-The efficacy of gradient elution was tested by the separation of various synthetic mixtures, and in all instances it was found equal to the stepwise scheme of elu- tion. However, one of its greatest utilities is in the search for
TABLE V
Separation of serum lipides into three fractions of fatty acid esters
Charge
Fraction I, Chol- esterol esters
Fraction II, Tri-
glycerides
Fraction III,
phospholipides
y. recovery
115.0
15.5
80.0
19.8
100.2 -
Total xboxyl
ester b-2.)
334.7 19.6
25.2 21.2
280.0
35.8
101.9
0
0
108.2
- Esteri-
fied choles-
terol beq.)
~%s choles-
terol (wl.)
16.9
0.3
16.9
1.0
107.2
91.7
1.4
93.3
0
103.3
Phos- phorus (req.)
20.0
0
0
19.4
97.0
* Triglyceride = total carboxyl ester-2(phosphorus)-esterified cholesterol,
all in fieq. J
partial glycerides in human serum. In many normal and ab- normal human sera, no monoglycerides or diglycerides were found. However, when a hyperlipemic patient was injected intravenously with heparin to induce clearing, small amounts of both mono- and diglycerides were found. The elution curve (Fig. 10) shows a larger than normal amount of nonesterified fatty acids, a known consequence of heparin-induced clearing (30), but the feature of particular interest is the small double peak in tubes No. 142 to 152 where diglycerides are expected, and a small peak in tubes No. 182 to 186 where monoglycerides are eluted. Material from these peaks was examined by infrared spectroscopy and gave the expected patterns of di- and monoglyceride. Even in this hyper- lipemic plasma, less than 2 per cent of the total glyceride is present as these partial glyceride products. In nine other human and rabbit sera so examined during the clearing reaction even tmaller amounts of partial glycerides were found. The small content of these substances in plasma indicates the likelihood that they are in rapid metabolic turnover, as in the case of the nonesterified fatty acids of plasma (31).
DISCUSSION
The methods described in this report have been shown to be satisfactory for the separation of the components of many syn- thetic mixtures as well as the natural mixture of lipides found in human serum. With minor changes these methods should be ap- plicable to many other naturally occurring lipide mixtures. In making these alterations, the following points deserve mention.
The adsorbent, prepared in the manner stated above, is ade- quate for all purposes so far envisioned. Since the particle size will provide a flow rate desirable for good separation, there is no need for adding a filteraid of diatomaceous earth, which intro- duces a further variable.
Gradient Elution of Post-Hepapin Hyperlipemic Plasma
10
9
8
7
6
5
4
3
2
1
l = peq. carboxyl ester o= ,ueq. titratable acidity x = Mg. of cholesterol
,
. 0 20 40 60 80 100 120 140 160 180 200
Tube No.
(Each tube is a 20 min. collection containing 8 to II ml.)
FIG. 10. The separation of the lipide components of a hyperlipemic human plasma during heparin-induced clearing by gradient lution from an 18 gm. column of silicic acid.
The three solvents: petroleum ether, ethyl ether, and methanol, span the range of solvent polarity and in different combinations provide any desired degree of eluting power for lipides of biolog- ical origin. Although some solvent of similar polarity might re- place ethyl ether, Schroeder (14) has found that petroleum ether and ethyl ether mixtures provide more complete separations of specific test mixtures than a number of other solvent pairs.
The necessary changes of solvent polarity are brought about either by stepwise changes or by a gradient. The use of such a gradient has not improved any of the particular lipide separations studied and in the case of serum phospholipides, the establish- ment of a gradient of methanol concentration in ethyl ether ac- tually yielded less sharp separation of the components than did an abrupt change. Similar findings are reported by Hanahan et al. (32) in their studies of phospholipide separations by chloro- form-methanol elution from columns of silicic acid. Yet in the separation of monkey brain sphingolipides, Weiss (33) has found gradient elution useful. Perhaps the greatest value of gradient elution in this type of chromatography is for the demonstration of small amounts of some particular lipide class in the presence of much larger amounts of other lipides, as in its use in a search for di- and monoglycerides in human serum (side supra). The reason for this utility is evident from a consideration of the ef- fects of the abrupt solvent changes of stepwise elution. Any trace amount of material trailing from a previous peak may be quickly washed from the column after such solvent change, cre- ating an additional small peak. Gradient elution avoids such factitious secondary peaks (34). For quantitative recovery, elu- tion schemes A and B have been devised so as to include these secondary peaks with their parent peaks.
The determination of adsorption values will reduce the empir- cism of solvent concentration selection for the separation of
compounds not listed in Table III. These values can also sup- ply other useful information. One illustration of this is in the prediction of the order of elution of a mixture of compounds. For example, in Fig. 5 it is evident that in 12 per cent or less ethyl ether in petroleum ether, dipalmitin is more firmly held by silicic acid than is cholesterol; but, beyond the 12 per cent con- centration, the opposite is true. When these two compounds are eluted from columns by 8 per cent ethyl ether, cholesterol pre- cedes diglyceride, but at 25 per cent ethyl ether, the order of elu- tion is inverted, as predicted by the adsorption values. Such in- versions at different solvent concentrations are rare for most chromatographic systems, but have been described for a number of compounds separable on silicic acid columns, e.g. N-nitro- sodiphenylamine and nitroglycerine (14).
Since Trappe showed that cholesterol and its esters may un- dergo transformation when trichlorethylene containing hydro- chloric acid is used as eluant (7) it is important to search for any evidence of such transformation with other lipides. In our studies no evidence for chemical transformation was found, as judged by physical and chemical characteristics of the lipides eluted from silicic acid (melting points, ultraviolet and infrared spectral analyses, calorimetric analyses, aldehyde formation, etc.). However, the isomerization of 2-monoglycerides to the more stable l-form was hastened by passage over silicic acid. This phenomenon, first reported by Borgstrom (9), could be demonstrated when a mixture of the isomers of monopalmitin with only 4 per cent in the l-form was applied to the column; 60 per cent of the eluted monoglyceride was found to be the l-isomer.
SUMMARY
A method is described for the separation of complex lipide mix- tures into chemical classes by elution from a single column of
320 Separation of Complex Lipide Mixtures Vol. 233, No. 2
silicic acid. The method has been tested by the separation of infrared spectra, as well as the competent technical assistance of synthetic mixtures and the mixture of lipides found in human Misses Susan Cheney and Carole Barr. Drs. Willy Lange and plasma. Some of the many possible applications are illustrated. F. H. Mattson of the Procter and Gamble Company have been
Acknowledgement-The authors gratefully acknowledge the as- particularly helpful in making available many substances of high sistance of Dr. Herbert Jaffe in obtaining and interpreting the purity.
REFERENCES
1. LIPSHY, S. R., MCGUIRE, J. S., JR., BONDY, P. K., AND MAN,
E. B., J. Clin. Invest., 34, 1760 (1955). 2. PIHL, A., AND BLOCH, K. J., J. Biol. Chem., 183, 431 (1950). 3. AHRENS,E. H., JR., HIRSCH, J., INSULL, W., JR., TSALTAS, T.
T.,BLOMSTRAND,R., AND PETERSON, M. L., Lancet, 272, 943 (1957).
4. HOLMAN, R. T., Proc. Sot. Exptl. Biol. Med., 76, 100 (1951). 5. JAMES, A. T., AND MARTIN, A. J. P., Biochem. J., 63, 144
10. FILLERUP, D. L., AND MEAD, F. J., Proc. Xoc. Exptl. BioZ. Med., 83, 574 (1953).
11. LEA, C. H., RHODES, D. N., AND STOLL, R. D., Biochem. J., 60, 353 (1955).
12. WYCOFF, H. D., AND PARSONS, J., Science, 126, 347 (1957). 13. LOUGH, A. K., GARTON, G. A., AND DUNCAN, W. R. H., Bio-
them. J., 66, Part 3,31p (1957). 14. SCHROEDER, W. A., Ann. N. Y. Acud. SC., 49, 204 (1948).
15. KAY, L. M., AND TRUEBLOOD, K. N., Anal. Chem., 26, 1566 (1954).
16. MALMBERG, E. W., Anal. Chem., 27, 840 (1955). 17. LEROSEN, A. L., J. Am. Chem. Sot., 67, 1683 (1945). 18. LAKSHMANAN, T. K., AND LIEBERMAN, S., Arch. Biochem.
Biophys., 63, 258 (1954).
19. CRAIG, L. C., GREGORY, J. D., AND HAUSMANN, W., Anal. Chem., 22, 1462 (1950).
20. CRAIG, L. C. HAUSMANN, W., AHRENS, E. H., JR., AND HAR-
FENIST, E. J., Anal Chew&., 23, 1326 (1951). 21. SPERRY, W. M., AND WEBB, M., J. Biol. Chem., 187, 97 (1950). 22. STEWART, C. P., AND HENDRY, E. B., Biochem. J., 29, 1683
(1935). 23. DOLE, V. P., J. CZin. Invest., 36, 150 (1956). 24. LEA, C. H., AND RHODES, D. N., Biochim. et Biophys. Actu,
17, 416 (1955). 25. RAPPORT, M. M., AND ALONZO, N., J. BioZ. Chem., 217, 193