Page 1
The Separation of the Enantiomers of Asparagine by Crystallization
Karim Elgarhy
Department of Chemical Engineering
McGill University, Montreal
August 2005
A thesis submitted to Mc Gill University in partial
fulfillment of the requirements of the degree of Doctor of Philosophy
© Karim Elgarhy, 2005
Page 2
1+1 Library and Archives Canada
Bibliothèque et Archives Canada
Published Heritage Branch
Direction du Patrimoine de l'édition
395 Wellington Street Ottawa ON K1A ON4 Canada
395, rue Wellington Ottawa ON K1A ON4 Canada
NOTICE: The author has granted a nonexclusive license allowing Library and Archives Canada to reproduce, publish, archive, preserve, conserve, communicate to the public by telecommunication or on the Internet, loan, distribute and sell theses worldwide, for commercial or noncommercial purposes, in microform, paper, electronic and/or any other formats.
The author retains copyright ownership and moral rights in this thesis. Neither the thesis nor substantial extracts from it may be printed or otherwise reproduced without the author's permission.
ln compliance with the Canadian Privacy Act some supporting forms may have been removed from this thesis.
While these forms may be included in the document page cou nt, their removal does not represent any loss of content from the thesis.
• •• Canada
AVIS:
Your file Votre référence ISBN: 978-0-494-25138-6 Our file Notre référence ISBN: 978-0-494-25138-6
L'auteur a accordé une licence non exclusive permettant à la Bibliothèque et Archives Canada de reproduire, publier, archiver, sauvegarder, conserver, transmettre au public par télécommunication ou par l'Internet, prêter, distribuer et vendre des thèses partout dans le monde, à des fins commerciales ou autres, sur support microforme, papier, électronique et/ou autres formats.
L'auteur conserve la propriété du droit d'auteur et des droits moraux qui protège cette thèse. Ni la thèse ni des extraits substantiels de celle-ci ne doivent être imprimés ou autrement reproduits sans son autorisation.
Conformément à la loi canadienne sur la protection de la vie privée, quelques formulaires secondaires ont été enlevés de cette thèse.
Bien que ces formulaires aient inclus dans la pagination, il n'y aura aucun contenu manquant.
Page 3
ABSTRACTS
Abstracts
Page 4
ASSTRACTS
Abstract
Enantiomers are chiral molecules (i.e. they are mirror-images of each other). They
have identical physical properties except for the rotation of polarized light. However their
chemical properties are different when reacting with other chiral molecules. The majority
of biological processes involve the reaction of two or more chiral molecules. There is
therefore a strong interest coming from the pharmaceutical, food and agricultural industry
for the separation of enantiomers.
Separation methods such as chromatography exist but are generally expensive and
limited in scale. Stereosynthesis often has prohibitive development and operating costs.
For 10 to 15% of known enantiomeric systems, a conglomerate is formed upon
crystallization (each individual crystal contains only one type of enantiomer).
Crystallization is widely used as an inexpensive separation process which takes
advantage of the difference in solubility of the compounds to be separated and yields very
high purities in one separation stage. There is no difference in solubility between two
enantiomers but in the special case of conglomerates, a difference in crystallization rate
can be used as the driving force for the separation of the enantiomers.
In this project, the effects of the important parameters governmg the
crystallization of asparagine (ASN) were studied in order to develop a separation method
based on crystallization. ASN is an amino acid having two enantiomers (L-ASN and D
ASN) and forming a conglomerate. The effects of mixing speed, crystallization
temperature, initial supersaturation and seeds (amount, type and time of addition) on the
crystallization rates were studied. The crystallization temperature was shown to have a
negligible effect over the range studied. Increasing initial supersaturations had a strong
11
Page 5
ASSTRACTS
accelerating effect on the crystallization. The addition of L-ASN seeds increased the
crystallization rate of L-ASN without affecting that of D-ASN. The corresponding
statement was true for D-ASN. Larger amounts of seeds and faster mixing increased
crystallization rates. Separation methods were developed and 95.8-97.7% pure
enantiomers with yields of 73.1 % were obtained in a cyclic process. The growth and
desupersaturation rates were also modeled.
111
Page 6
ASSTRACTS
Résumé
Les énantiomères sont des molécules chirales (i.e. ils sont l'image l'un de l'autre
dans un miroir). Leurs propriétés physiques sont identiques à l'exception de leur rotation
de la lumière polarisée. Cependant, leurs propriétés chimiques sont différentes lorsqu'ils
réagissent avec d'autres molécules chirales. La plupart des processus biologiques
impliquent au moins une réaction entre molécules chirales. Il y a donc un intérêt
grandissant de la part des industries pharmaceutique et agroalimentaire en particulier pour
l'isolation d'énantiomères.
Des méthodes de séparation, (ex. la chromatographie) existent mais sont souvent
limitées au niveau de la productivité et des coûts. La stéréo synthèse a aussi souvent des
coûts de développement et d'opération prohibitifs.
Dans 10 à 15% des cas, les systèmes d'énantiomères forment un conglomérat lors
de la cristallisation. Chaque cristal ne contient alors qu'un énantiomère.
La cristallisation est fréquemment utilisée comme procédé de séparation
économique qui utilise la différence de solubilité des composants à séparer et qui produit
une pureté élevée en une étape.
Il n'y a pas de différence de solubilité entre deux énantiomères mais dans le cas
ou un conglomérats est formé, une différence du taux de cristallisation peut être utilisée
pour séparer les énantiomères.
Dans le présent projet, les effets de paramètres important dans la cristallisation de
l'asparagine (ASN) furent étudiés pour développer une méthode de séparation fondée sur
la cristallisation. L'ASN est un acide aminé qui a deux énantiomères (L-ASN et D-ASN)
et qui forme un conglomérat. Les effets de la température de cristallisation, de la
IV
Page 7
ABSTRACTS
sursaturation initiale, de germes de cristal (quantité, type et temps d'addition) et de la
vitesse d'agitation sur les taux de cristallisation furent étudiés. Il fut démontré que la
température de cristallisation avait un effet négligeable dans l'intervalle étudiée. Un
augmentation de la sursaturation accéléra la cristallisation. L'addition de germe de L
ASN augmenta le taux de cristallisation de la L-ASN mais n'eut pas d'effet sur la D
ASN. L'affirmation correspondante fut démontrée pour la D-ASN. Une plus grande
quantité de germes et une agitation plus rapide augmenta les taux de cristallisation. Des
méthodes de séparation furent développés et des énantiomères purs a 95.8-97.7% et des
rendements de 73.1 % furent obtenus lors de procédés cycliques. Les taux de croissance et
de désursaturation furent aussi modélisés.
v
Page 8
ACKNOWLEDGEMENTS
Acknowledgements
1 wish to thank my supervisor Professor Dimitrios Berk for his guidance as weil as
our research team and the Chemical Engineering departmental staff for their technical
support. 1 also wish to express my gratitude to my parents, my brothers and my girlfriend
for their moral support.
vi
Page 9
TABLE OF CONTENTS
Table of Contents
VIl
Page 10
TABLE OF CONTENTS
1 Introduction.......................... ....................................................... 1
2 Background Information and Literature Survey. . .... . . . . . . . . . . . . . . . . . . . . . . . . . . . . . 6
2.1 Amino Acids and Asparagine....................................................... 7
2.2 Enantiomers, Diastereomers and Conglomerates............................. .... 8
2.2.1 Enantiomers..................................................................... 8
2.2.2 Diastereomers................................................................... 10
2.2.3 Conglomerates..................................................... ............. 10
2.3 Methods for the Separation of Enantiomers.................. ... ... ... ... ...... ... Il
2.3.1 Chromatography... ......... ...... ...... ... ... ... ... ... ......................... Il
2.3.2 Stereosynthesis............................................................... ... 12
2.3.3 Other Separation Methods.................................................. ... 13
2.4 The Crystallization Process......................................................... 13
2.4.1 Definitions... ... ......... ...... ......... ..................... ...... ...... ........ 14
2.4.2 Nucleation.................................................................... ... 14
2.4.3 Growth........................................................................... 17
2.4.4 Other Processes ...................................................... '" ........ 19
2.4.5 Approaches for Modeling.................................................. .... 20
2.5 Separation of Enantiomers by Crystallization... ... ... ........ ...... .......... ... 21
2.5.1 Transformation into Diastereomers.......................................... 22
2.5.2 The Crystallization of Conglomerates....................................... 25
2.5.2.1 Principles.................................................................. 25
2.5.2.2 Process Design for Separation by Entrainment.................... ... 32
2.6 Statement of Objectives. ...................... ....................................... 42
3 Materials and Methods............ ...... ...... .................... ... ... ......... ......... 44
3.1 Preparation of Solutions............................................................. 45
3.2 High Performance Liquid Chromatography Analysis........................... 45
3.2.1 Calibration.................................................................... ... 45
3.2.2 Other Samples......................................................... ......... 47
3.3 Solubility Experiments............................................................ ... 48
3.4 Crystallization Rate Measurements and Separation Experiments........... ... 49
3.4.1 Tube Crystallizer Setup...... ...... ............ .... ..... ........ ... ............ 49
Vlll
Page 11
TABLE OF CONTENTS
3.4.2 Crystallization Rate experiments............................................. 51
3.4.3 Separation Experiments........................................................ 54
3.4.4 Cyclic Separation Experiments................................... ............. 54
3.5 Crystal Analysis...................................................................... 55
3.5.1 Morphology..................................................................... 55
3.5.2 Density....................................................................... .... 55
3.5.3 Particle Size Distribution................................................. ..... 56
4 ResuUs and Discussion............................................................. ....... 57
4.1 Solubility...... ... ... ... ... ...... ............... ...... ...... ... ........................ 58
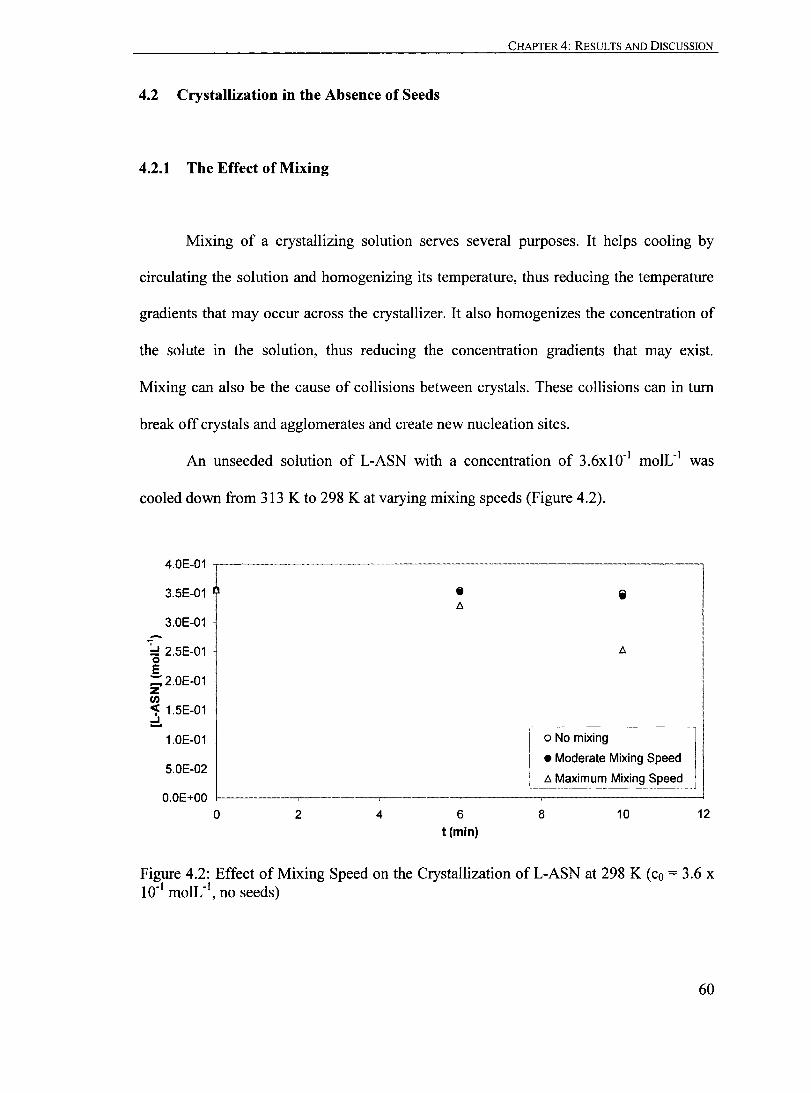
4.2 Crystallization in the Absence of Seeds............................................ 60
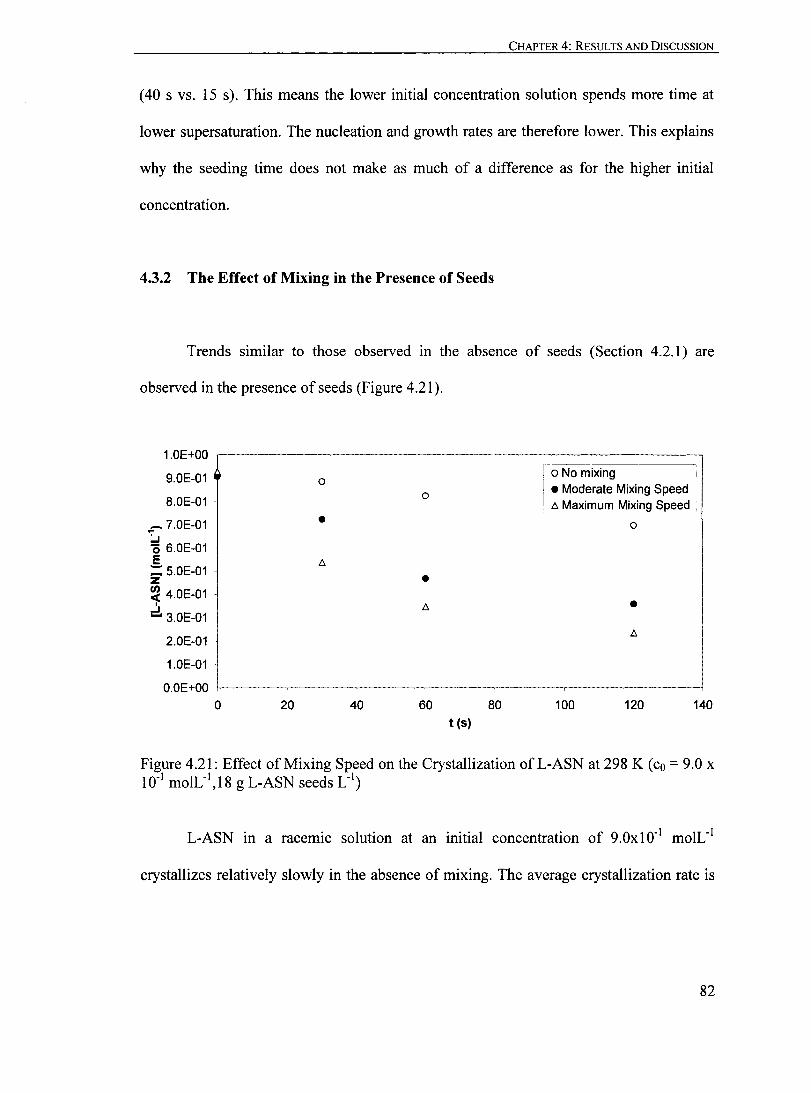
4.2.1 The Effect of Mixing.. ......................................................... 60
4.2.2 The Effect ofCrystallization Temperature..... ........... ... ... ... .......... 61
4.2.3 The Effect of Supersaturation... ... ...... . .. ... ... ........ . ................... 65
4.2.4 Summary of the Effects of Mixing, Crystallization Temperature and
Supersaturation on the Crystallization of ASN in the Absence of
Seeds.............................................................................. 67
4.3 Crystallization in the Presence of Seeds............ .................. .............. 68
4.3.1 The Effect ofSeeds.... ...... ......... .......... ... ........ ... .................. 68
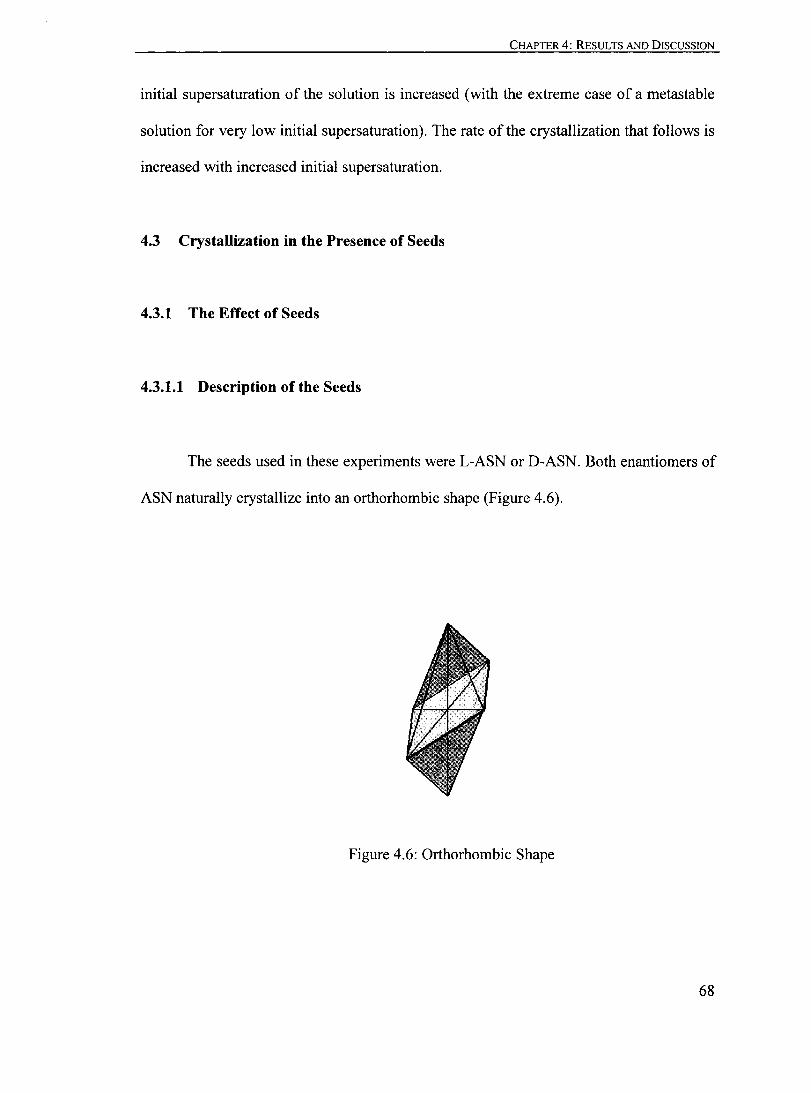
4.3.1.1 Description of the Seeds ............................ '" ......... ...... ... 68
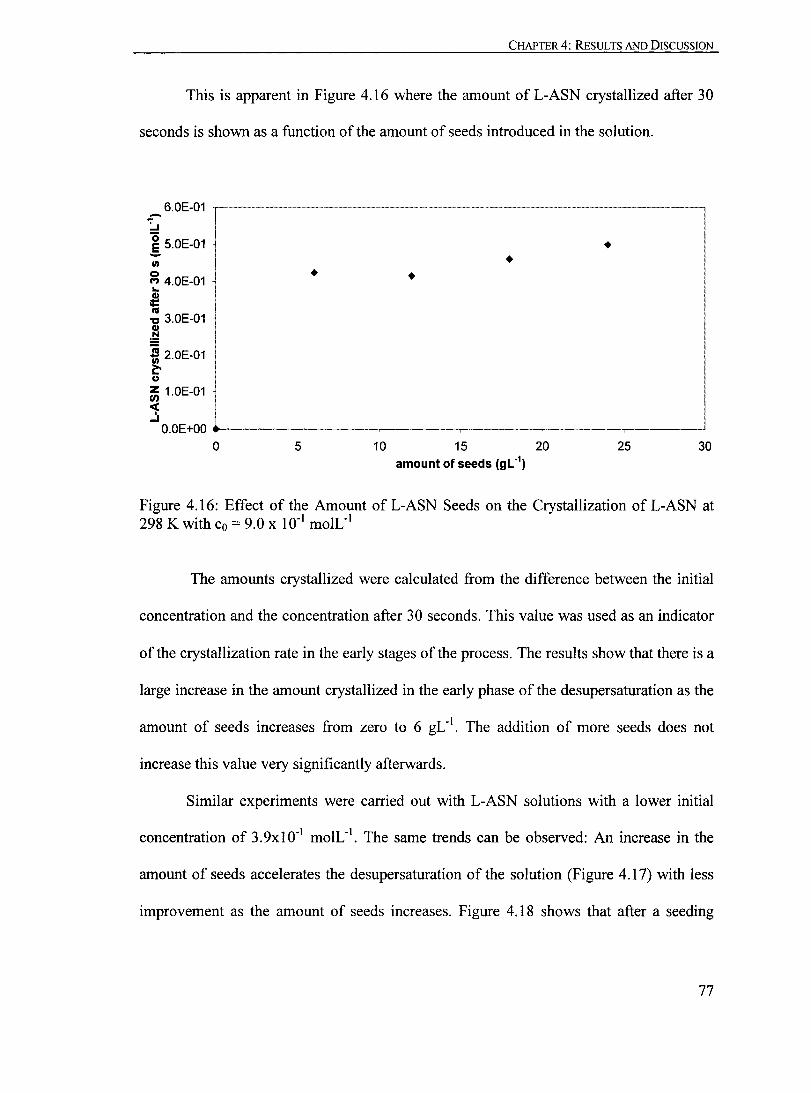
4.3.1.2 Amount ofSeeds and Seeding Time...... ............ ............ ..... 76
4.3.2 The Effect of Mixing in the Presence ofSeeds........ ...... ............... 82
4.3.3 Summary of the Effects ofSeeds and Mixing in the Presence ofSeeds
on the Crystallization of ASN. . . . . . . . . . . . . . . . . . . . . . . . . . . . . . . . . . . . . . . . . . . . . . . . 84
4.4 Separation of Mixtures of Enantiomers. ........................................... 85
4.4.1 Basic Principles of the Separation Process.............................. ..... 85
4.4.1.1 Racemic Mixtures.... ... ........... ... .. . ..... .... ... . .............. ...... 85
4.4.1.2 Non-Racemic Mixtures....... .............. ......... ... .................. 98
4.4.2 Development of the Separation Process................................ ...... 99
4.4.3 Cyclic Process................................................................... 107
4.5 Modeling of the Crystallization and Separation Process......................... 117
4.5.1 Nucleation and Growth Rate... ......... ............... ... ...... ............... 118
ix
Page 12
TABLE OF CONTENTS
4.5.2 Desupersaturation Rate.................... ................................. ..... 120
5 Conclusions and Recommendations.............................................. ...... 127
5.1 Summary and Conclusions.......................................................... 128
5.2 Recommendations for Future Research...................................... ....... 131
5.3 Contributions to Knowledge.................................................. ........ 132
References................................................................................ ..... 133
Appendices.................................................................................... 139
A.l Sample Calculations... ............. ...... ..................... ... ...... ... .......... 140
A.2 Development of the Models... . . . . . . . . . . . . . . . . . . . . . . . . . . . . . . . . . . . . . . . . . . . . . . . . . . . . .. 149
A.3 Use ofa Temary Diagram.......................................................... 152
A.4 Discussion on the Reproducibility of the Results................................ 154
x
Page 13
LIST OF FIGURES
List of Figures
Xl
Page 14
LIST OF FIGURES
Figure 2.1: The Molecule of Asparagine (ASN)............................. ................ 7
Figure 2.2: Enantiomers................................................................. ......... 8
Figure 2.3: Nomenclature from the Configuration of Enantiomers. .................. ..... 8
Figure 2.4: Example ofDiastereomers...... ...... ... ... ... ... ... ... .................. ......... 10
Figure 2.5: Enantiomer Resolution through Diastereomer Formation......... ...... ...... 22
Figure 2.6: Continuous Separation of Enantiomers by the Localized Crystallization of Conglomerates...... ...... ...... .. . ...... ... ... ... ........................... 27
Figure 2.7: Separation of the Enantiomers of ASN by Entrainment (T = 298 K, CL,O = 9.0 X 10⁻¹ moIL- I
, CD,O = 9.0 X 10⁻¹ moIL- I, 18 g L-ASN seeds L- I
)................. 33
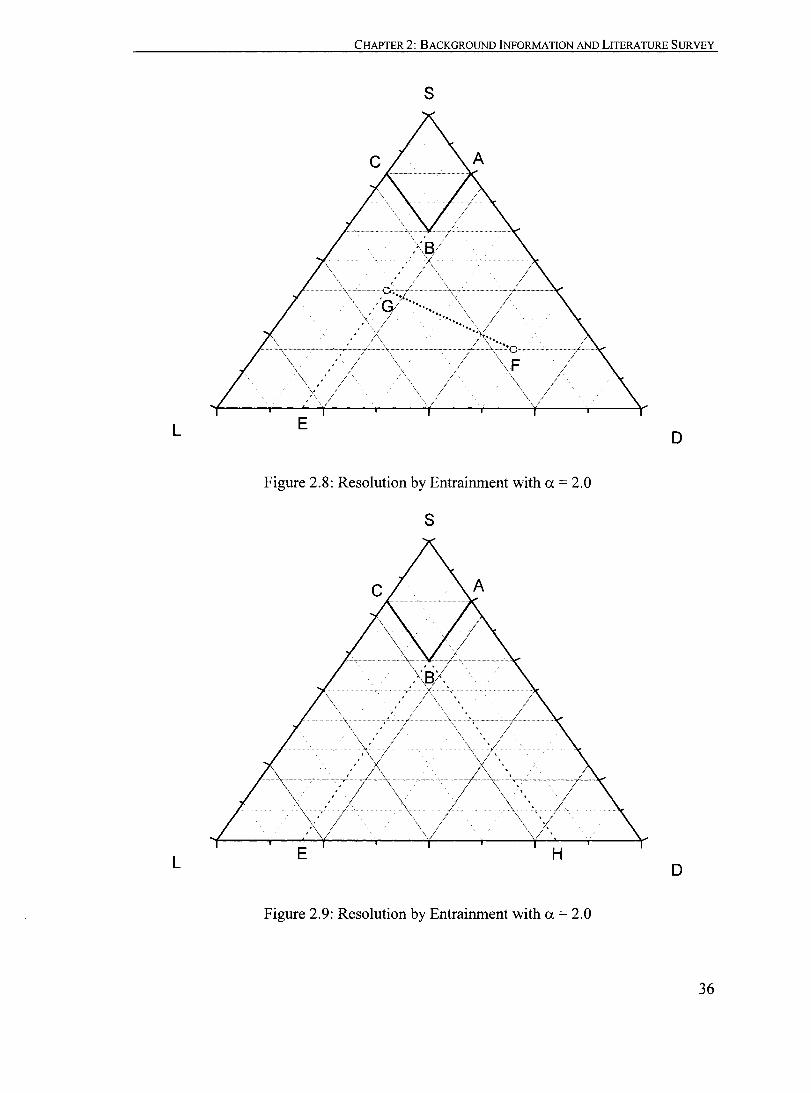
Figure 2.8: Resolution by Entrainment with a = 2.0.................................. ....... 36
Figure 2.9: Resolution by Entrainment with a = 2.0.............................. ........... 36
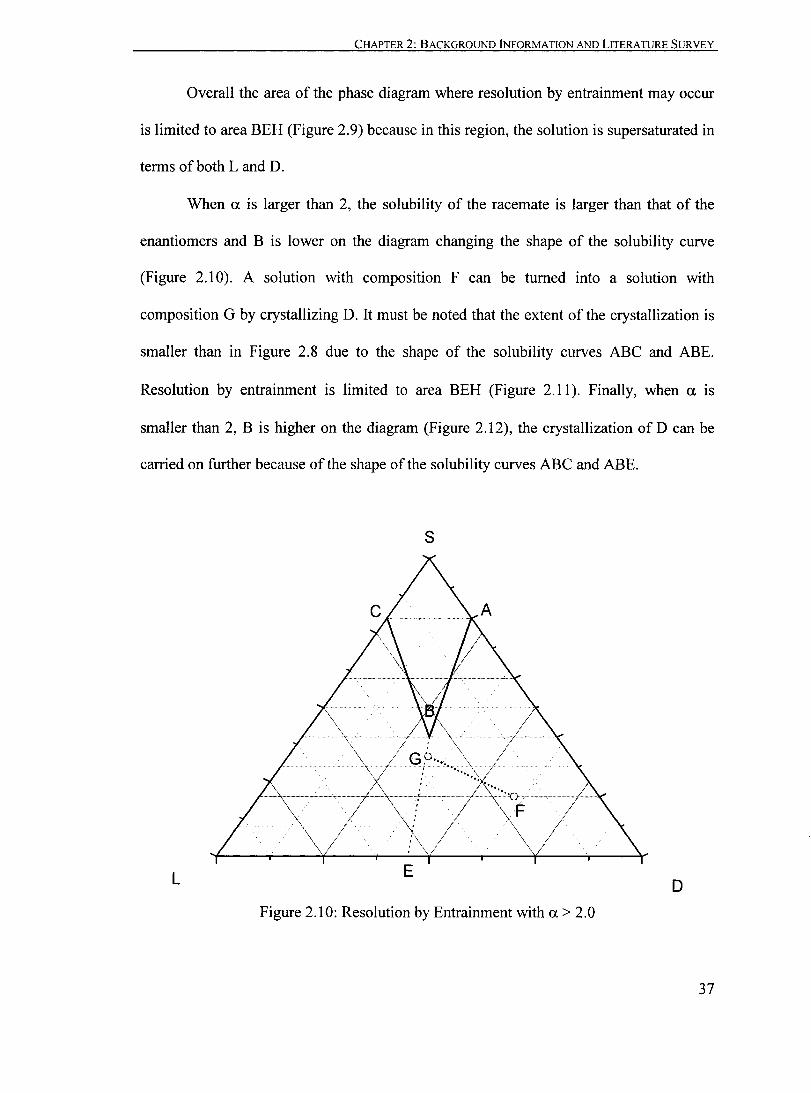
Figure 2.10: Resolution by Entrainment with a > 2.0...... .............. ................... 37
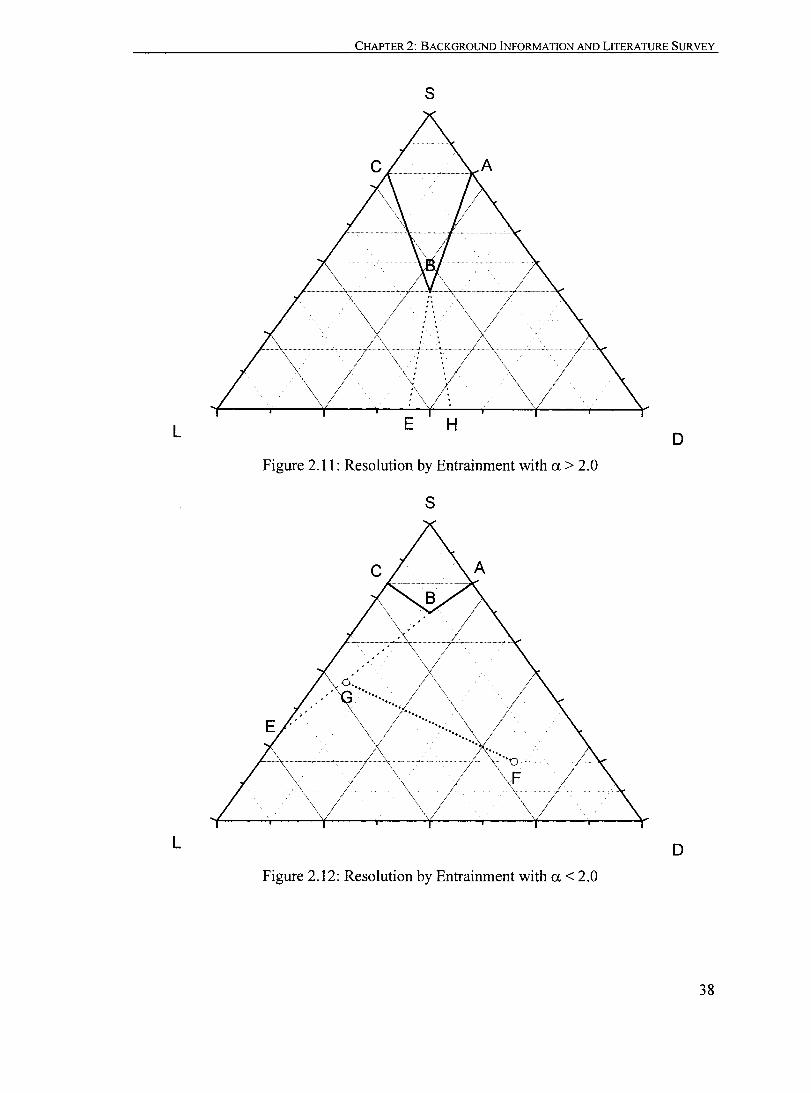
Figure 2.11: Resolution by Entrainment with a > 2.0....................................... 38
Figure 2.12: Resolution by Entrainment with a < 2.0............ ...... ......... ............ 38
Figure 2.13: Resolution by Entrainment with a < 2.0....................................... 39
Figure 2.14: Residual Supersaturation Curves................................................ 40
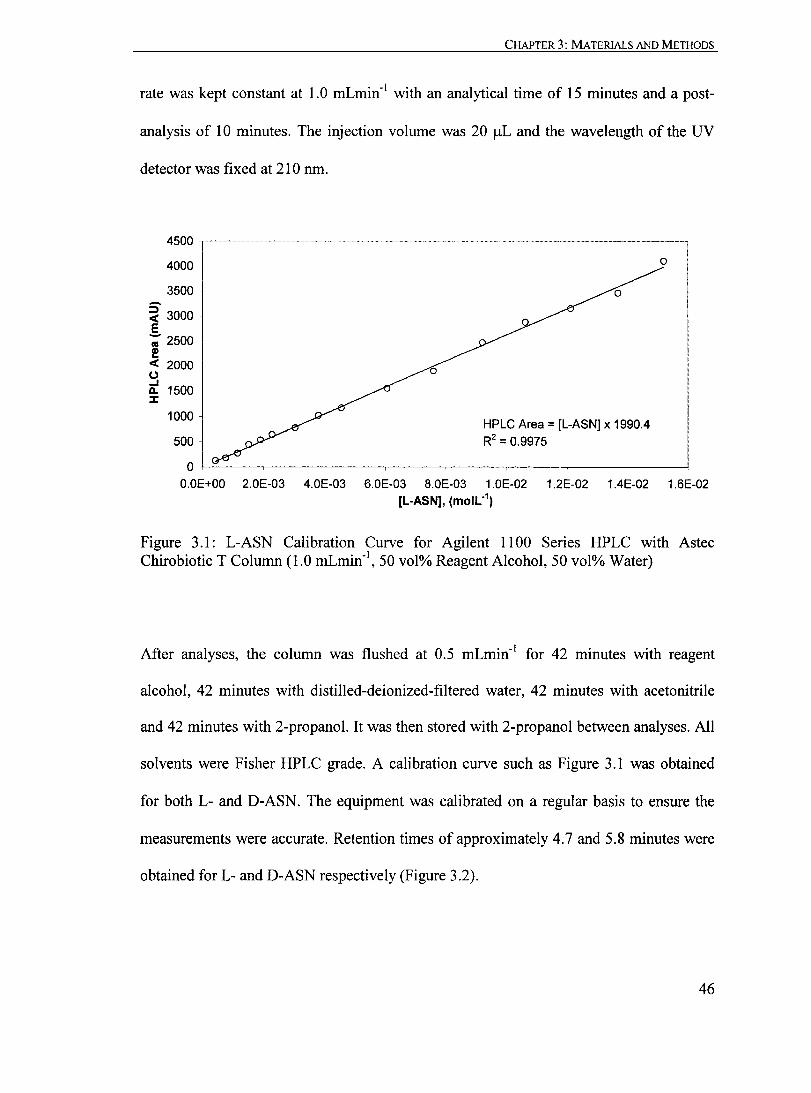
Figure 3.1: L-ASN Calibration Curve for Agilent 1100 Series HPLC with Astec Chirobiotic T Column (1.0 mLmin- l
, 50 vol% Reagent Alcohol, 50 vol% Water)...... 46
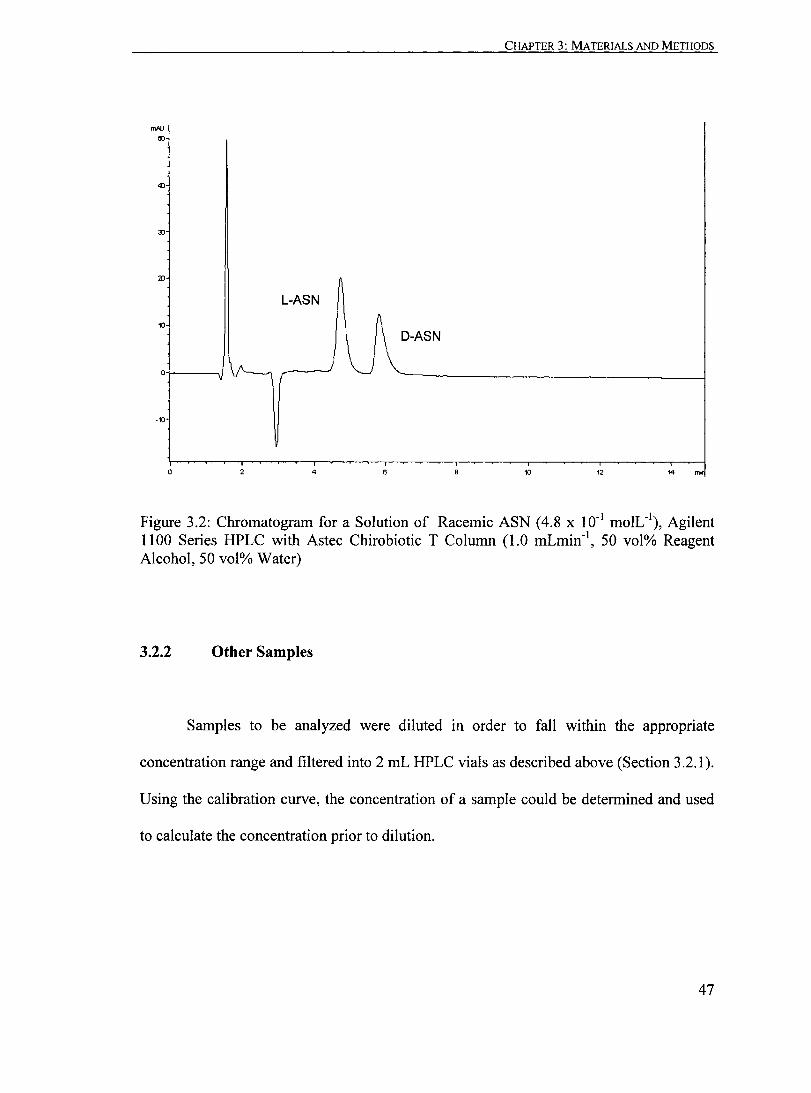
Figure 3.2: Chromatogram for a Solution of Racemic ASN (4.8 x 10⁻¹ moIL- I)
Agilent 1100 Series HPLC with Astec Chirobiotic T Column (1.0 mLmin-1
, 50 vol% Reagent Alcohol, 50 vol% Water)........................... ....... 47
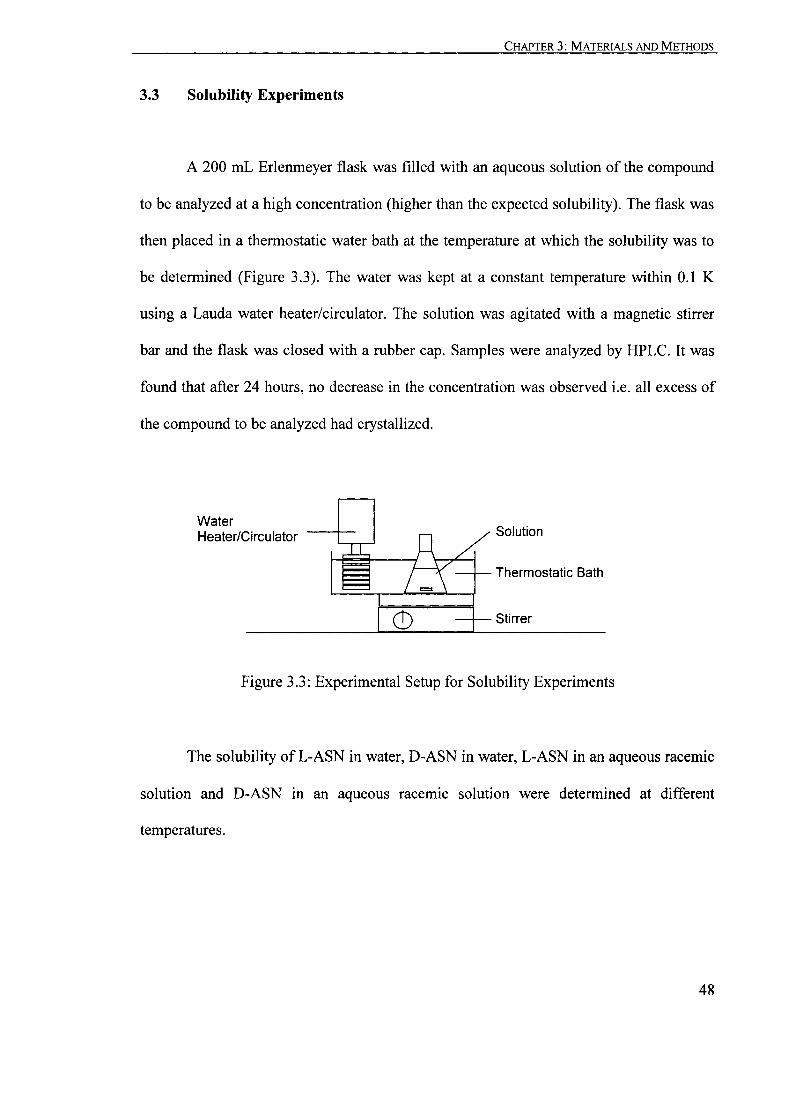
Figure 3.3: Experimental Setup for Solubility Experiments................................ 48
Figure 3.4: Experimental Setup for Crystallization Rate Measurement (Tube Crystallizer).......................................................................... ...... 49
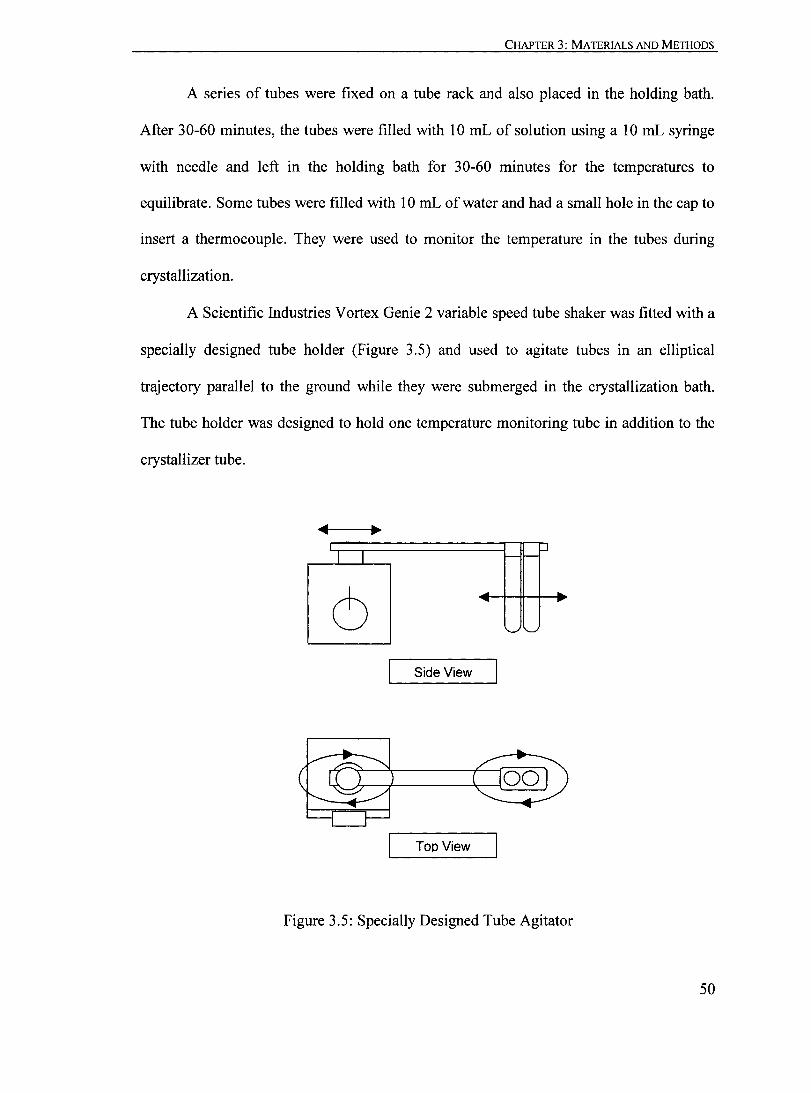
Figure 3.5: Specially Designed Tube Agitator. . . . . . . . . . . . . . . . . . . . . . . . . . . . .. . .. . . . . . . .. . . ..... 50 Figure 3.6: Temperature Profile for a Tube Crystallizer (To = 343 K, T = 298 K).. ..... 51
Figure 4.1: Solubility of L-ASN and D-ASN in water........ ........ ........ ............... 59
Xl1
Page 15
LIST OF FIGURES
Figure 4.2: Effeet of Mixing Speed on the Crystallization ofL-ASN at 298 K (co = 3.6 X 10⁻¹ moIL- I
, no seeds)........... ...................................... .... 60
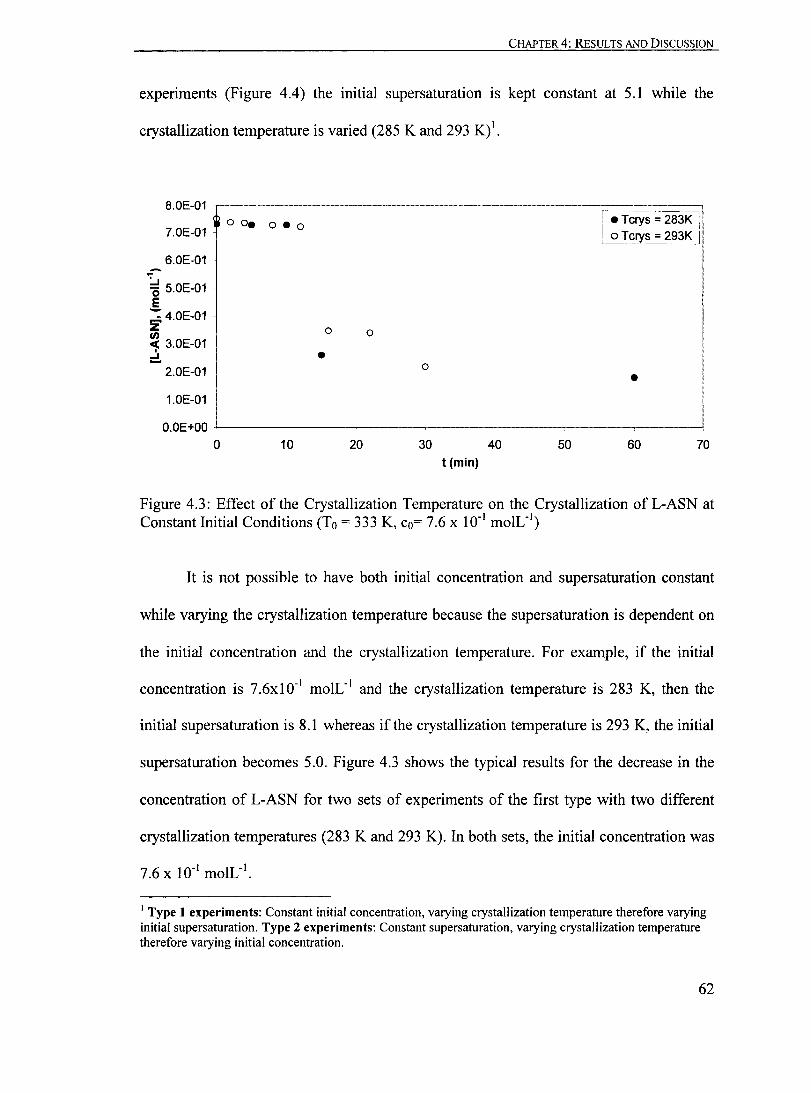
Figure 4.3: Effect of the Crystallization Temperature on the Crystallization ofL-ASN at Constant Initial Conditions (To = 333 K, Co= 7.6 X 10⁻¹ moIL-1
)....... ••... 62
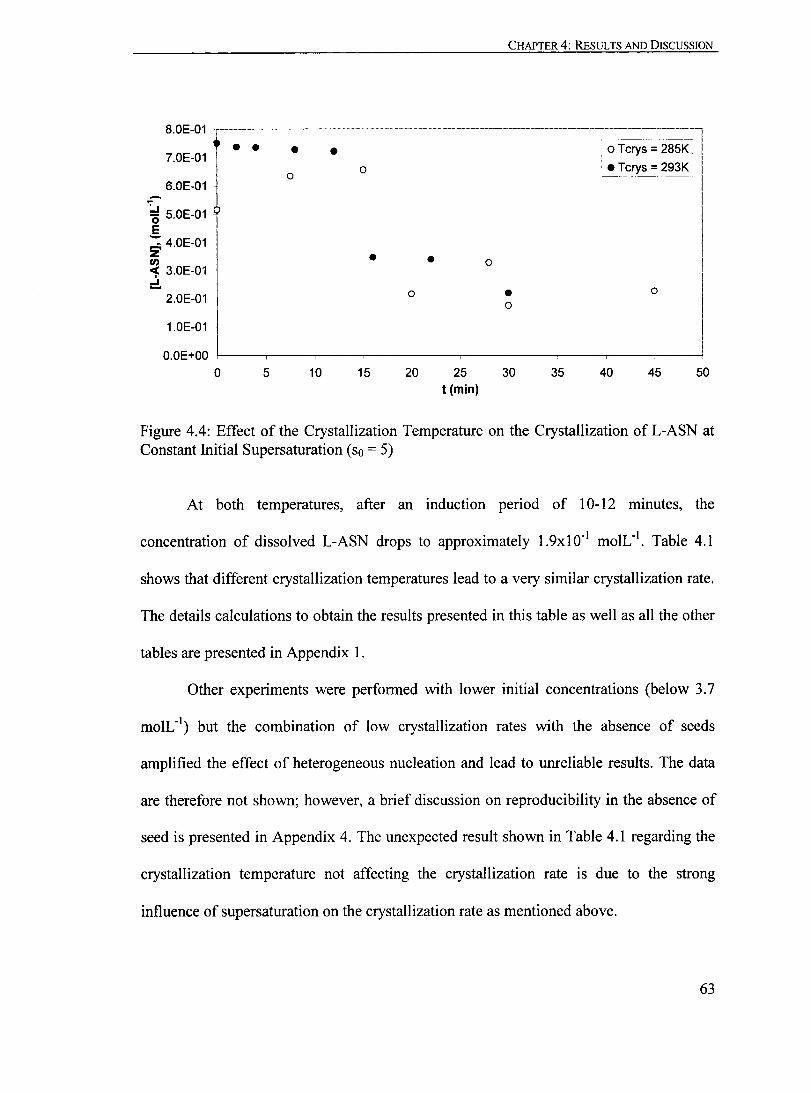
Figure 4.4: Effect of the Crystallization Temperature on the Crystallization ofL-ASN at Constant Initial Supersaturation (so = 5)....................................... 63
Figure 4.5: Effeet of the Initial Supersaturation on the Crystallization of L-ASN at 298 K...... ...... ............ ...... .. ..... .. ...... .... .......... . ... ...... .............. 66
Figure 4.6: Orthorhombic Shape............................................................... 68
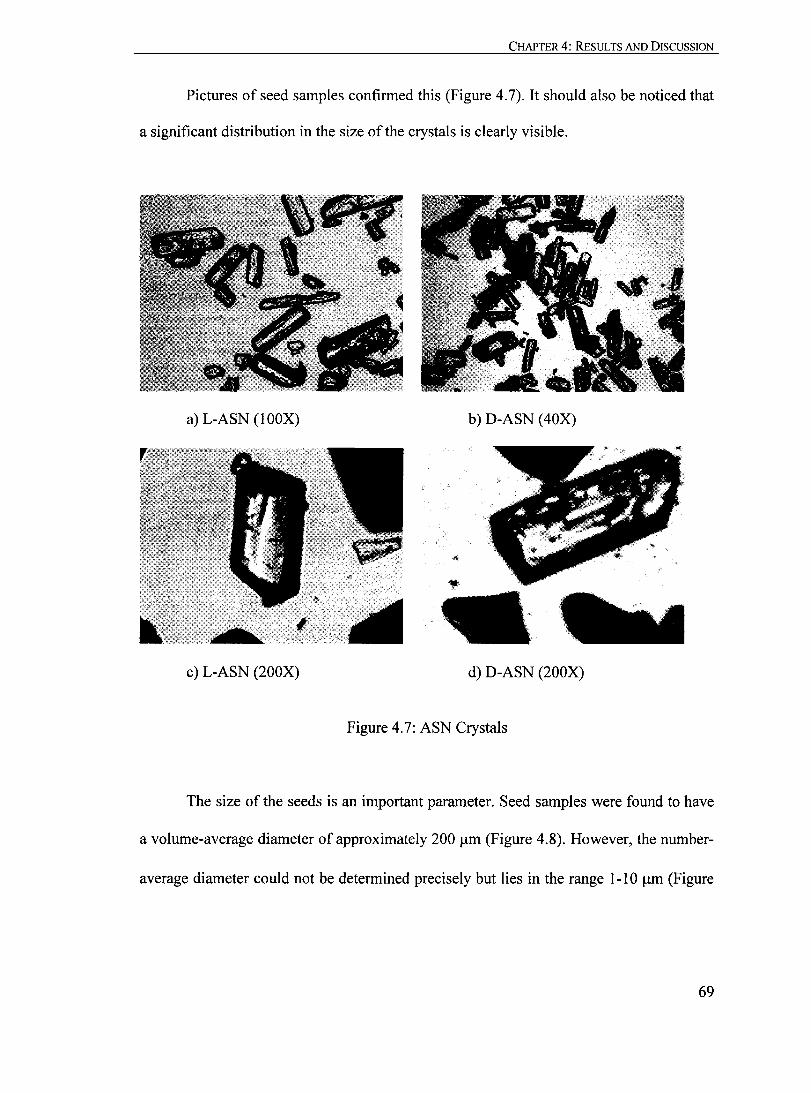
Figure 4.7: ASN Crystals........................................................................ 69
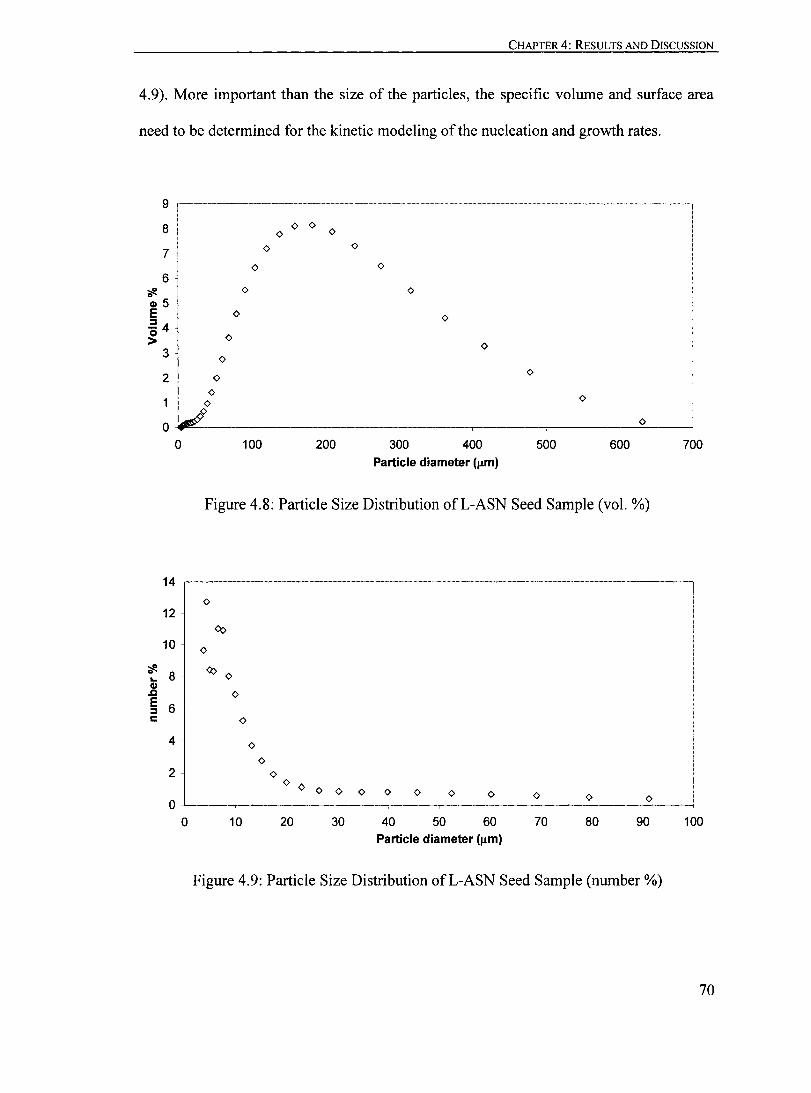
Figure 4.8: Particle Size Distribution ofL-ASN Seed Sample (vol. %).................. 70
Figure 4.9: Particle Size Distribution ofL-ASN Seed Sample (number %)........... ... 70
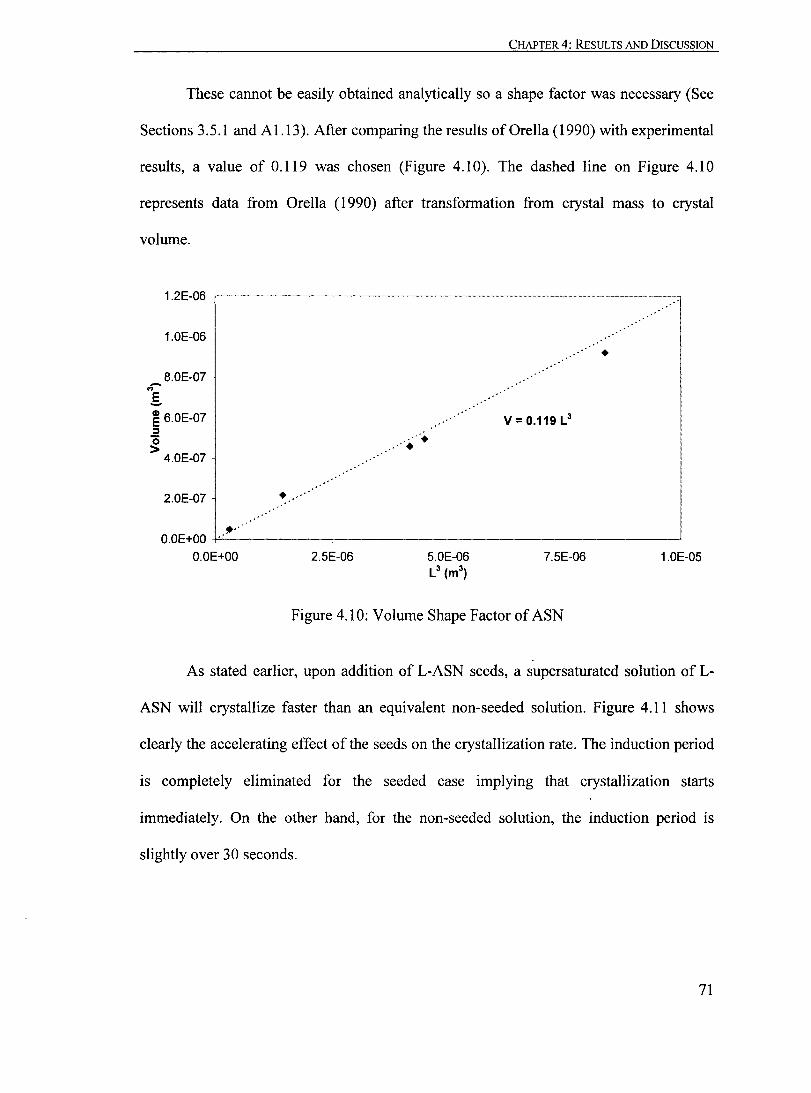
Figure 4.10: Volume Shape Factor of ASN...... ... ... ......... ... ... ......... ......... ...... 71
Figure 4.11: Effect of L-ASN Seeds on the Crystallization of L-ASN at 298 K with Co = 9.5 X 10⁻¹ molL-1
•...•.•...•.•.••...•..•.••.•..•.•..•.•.•..•....•...•••...•.• 72
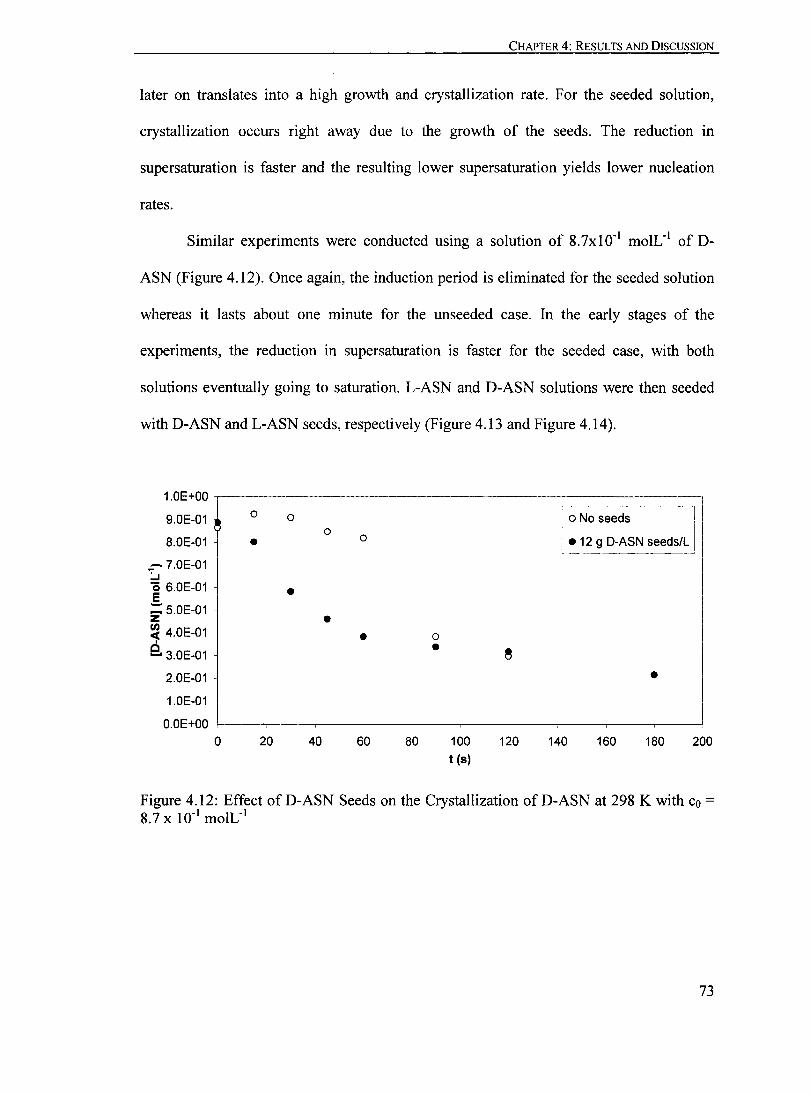
Figure 4.12: Effect ofD-ASN Seeds on the Crystallization ofD-ASN at 298 K with Co = 8.7 X 10⁻¹ moIL-1
•.•.•.•.•••.• ••••••••••.••••.•..••.••..•.••.••.•. ••••.•. .••• 73
Figure 4.13: Effect ofD-ASN Seeds on the Crystallization ofL-ASN at 298 K with Co = 9.5 X 10⁻¹ moIL-1
.•......•..•..•...•. .•...•.•..•.••...•..•..•.•••..•••...•.•• 74
Figure 4.14: Effeet of L-ASN Seeds on the Crystallization of D-ASN at 298 K with Co = 8.7 X 10⁻¹ mo1L-1
..•••...••• ..••..•..•..•.••..•.•.....•...•...••.•••.•.•. •••. 74
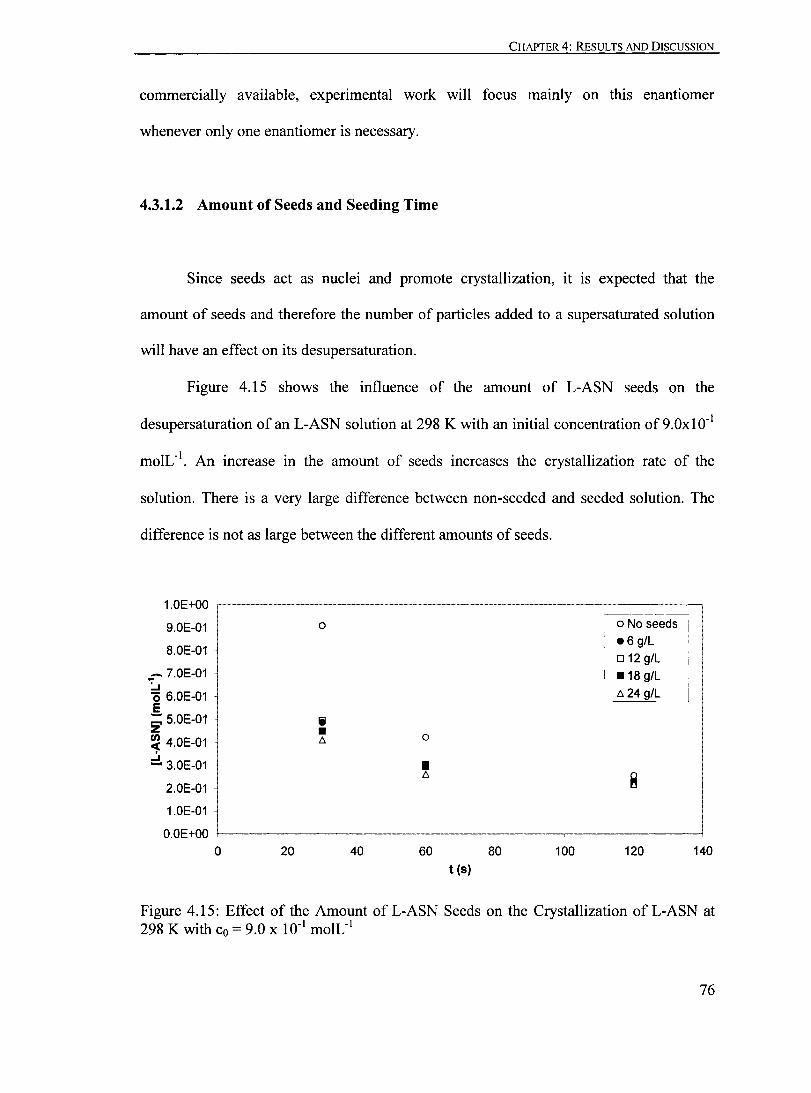
Figure 4.15: Effect of the Amount of L-ASN Seeds on the Crystallization ofL-ASN at 298 K with Co = 9.0 X 10⁻¹ moIL-1
.•....•.••..•..•. ....•..•.••....•...••..•.•• .... 76
Figure 4.16: Effect of the Amount ofL-ASN Seeds on the Crystallization ofL-ASN at 298 K with Co = 9.0 X 10⁻¹ moIL-1
..•.••..•....•••••••••••••••. ••••••.•••••..• •.• 77
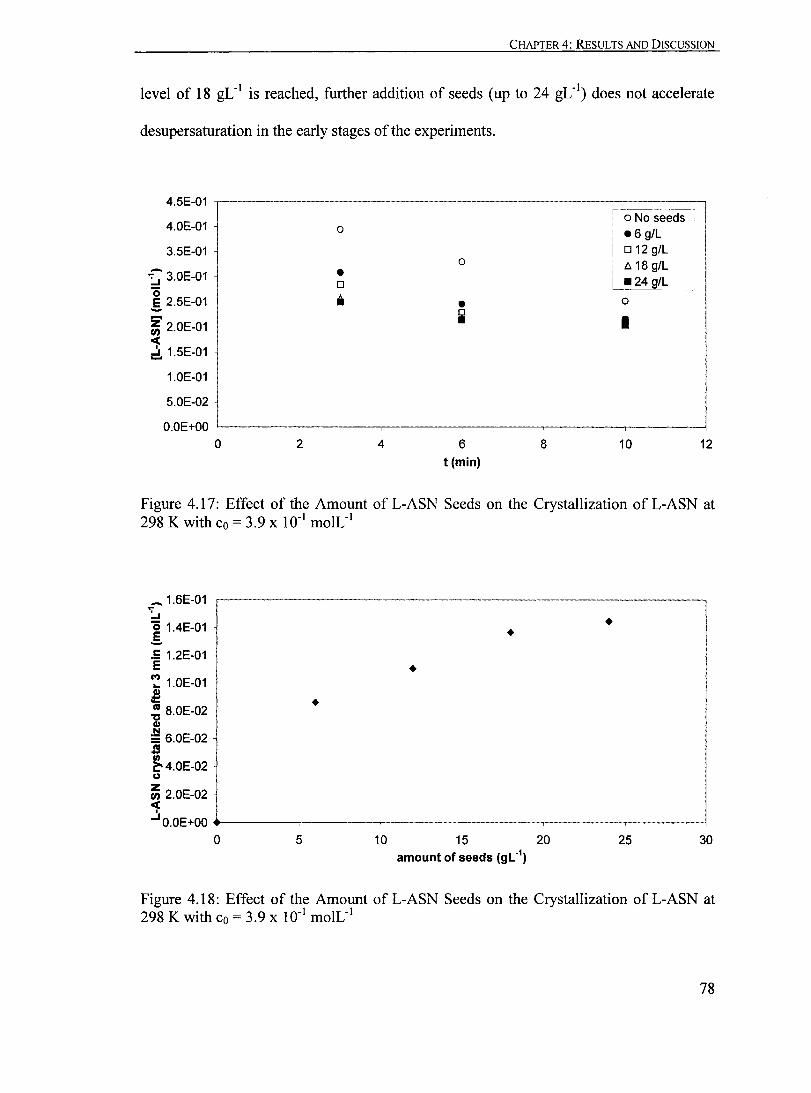
Figure 4.17: Effect of the Amount ofL-ASN Seeds on the Crystallization ofL-ASN at 298 K with Co = 3.9 X 10⁻¹ moIL-1
•......•............••.••...•.. ................ 78
Figure 4.18: Effect of the Amount ofL-ASN Seeds on the Crystallization ofL-ASN at 298 K with Co = 3.9 X 10⁻¹ moIL-1
........ ..•.••.••...•..•..••••••.•.•..•••..•... 78
X1ll
Page 16
LIST OF FIGURES
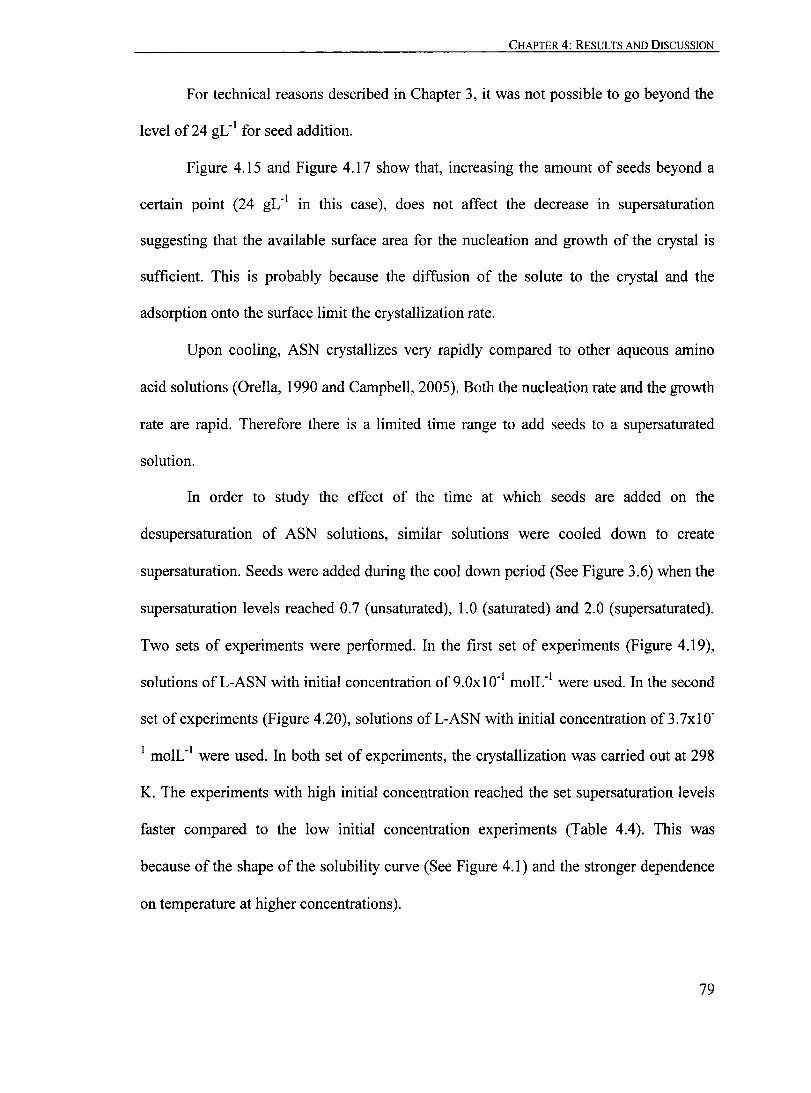
Figure 4.19: Effect of Time ofSeed Addition on the Crystallization ofL-ASN at 298 K (co = 9.0 x 10⁻¹ moIL· I
, 24 g L-ASN seeds L .').................................... 80
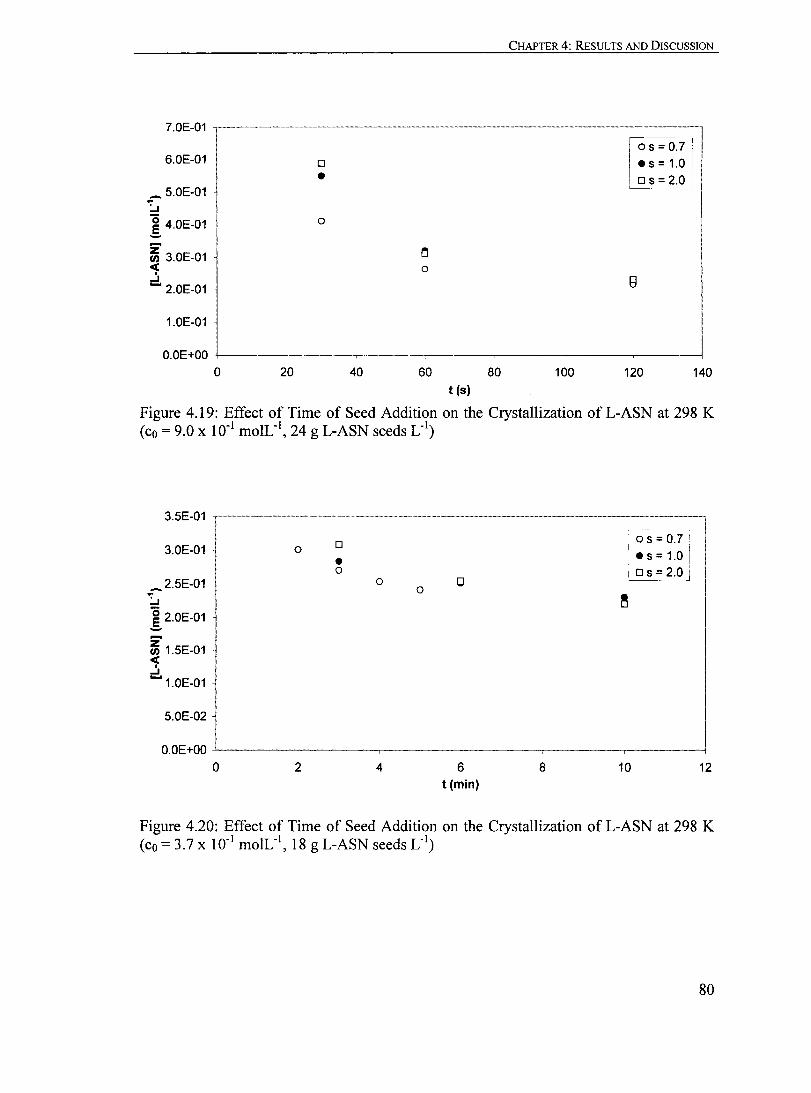
Figure 4.20: Effect of Time of Seed Addition on the Crystallization of L-ASN at 298 K (co = 3.7 X 10" moIL", 18 g L-ASN seeds L·').................................... 80
Figure 4.21: Effect of Mixing Speed on the Crystallization of L-ASN at 298 K (co = 9.0 X 10.1 moIL' I,18 g L-ASN seeds L·')............ ............ ............ 82
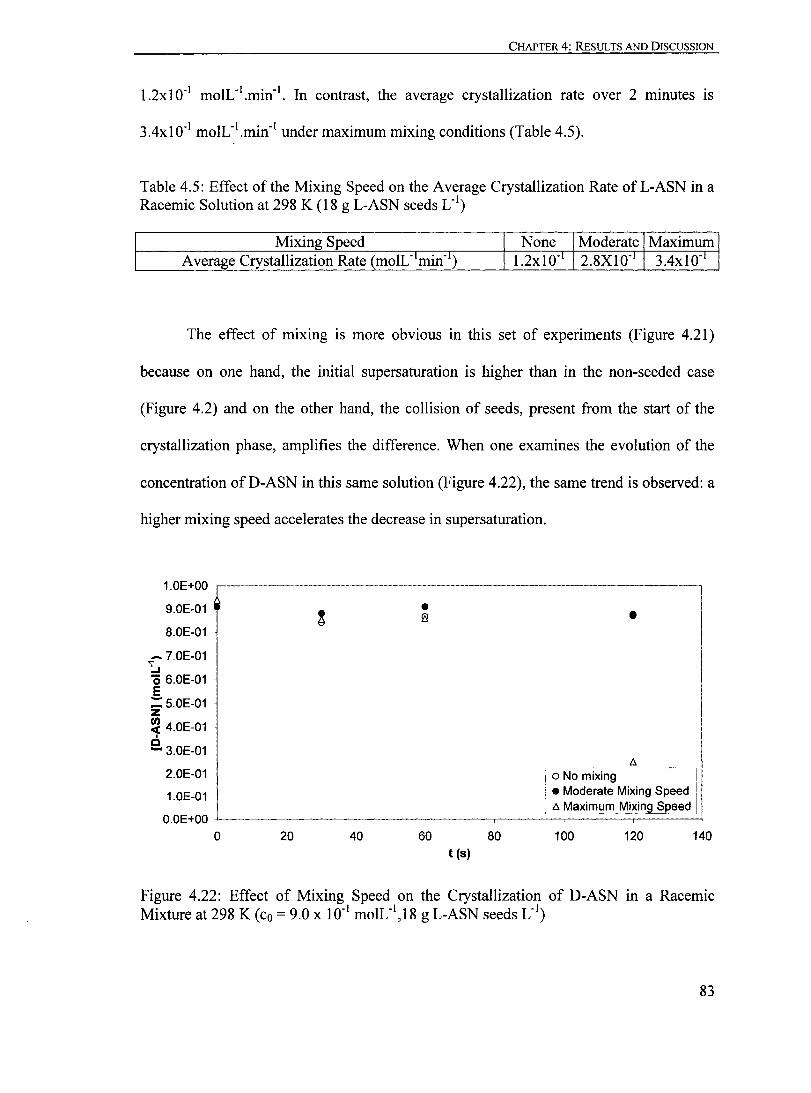
Figure 4.22: Effect of Mixing Speed on the Crystallization ofD-ASN in a Racemic Mixture at 298 K (co = 9.0 X 10" moIL' I,18 g L-ASN seeds L·').......... 83
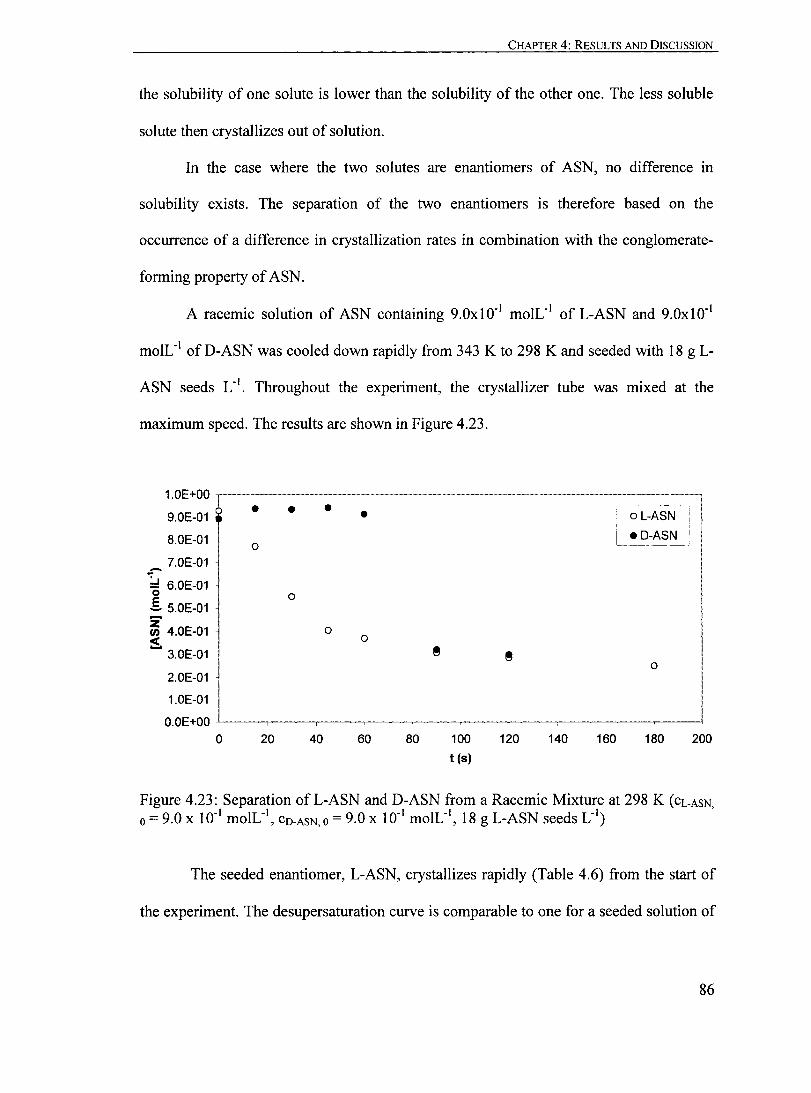
Figure 4.23: Separation of L-ASN and D-ASN from a Racemic Mixture at 298 K (CL.ASN 0 = 9.0 X 10-' moIL", CO.ASN 0 = 9.0 X 10" moIL", '., ' 18 g L-ASN seeds L )..................... ...... ......... ... ... .................. ...... ......... 86
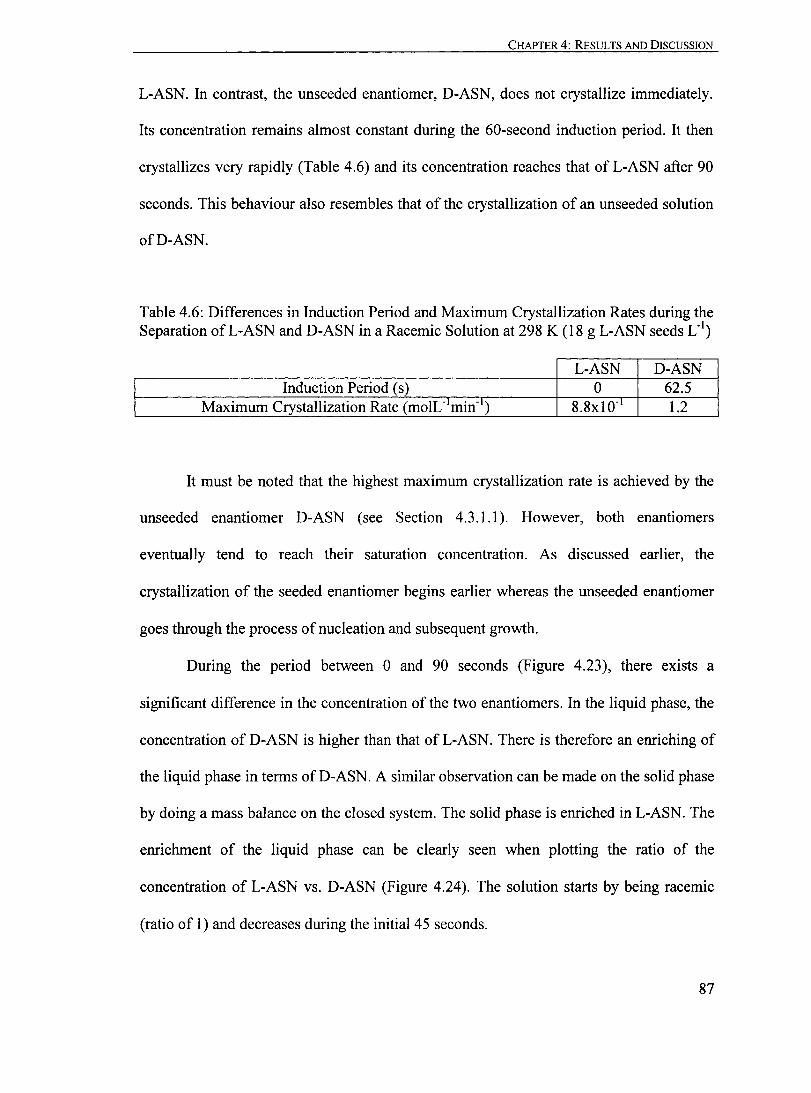
Figure 4.24: Enrichment of the Liquid Phase during the Separation ofL-ASN and D-ASN in a racemic mixture at 298 K (CL.ASN,O = 9.0 X 10" moIL' I,
CO.ASN,O = 9.0 X 10" moIL", 18 g L-ASN seeds L·')......................................... 88
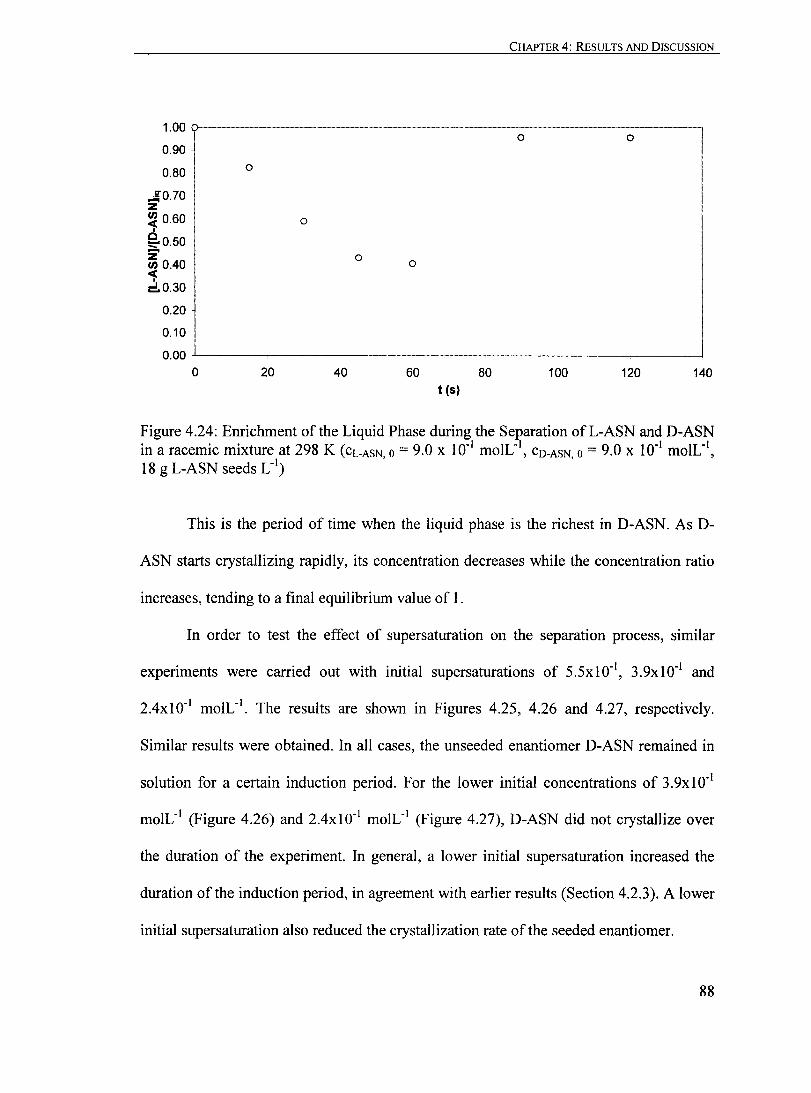
Figure 4.25: Separation ofL-ASN and D-ASN from a Racemic Mixture at 298 K (CL.ASN 0 = 5.5 X 10" moIL", CO.ASN 0 = 5.5 X 10" moIL", '., ' 18 g L-ASN seeds L )............... ............................................................ 89
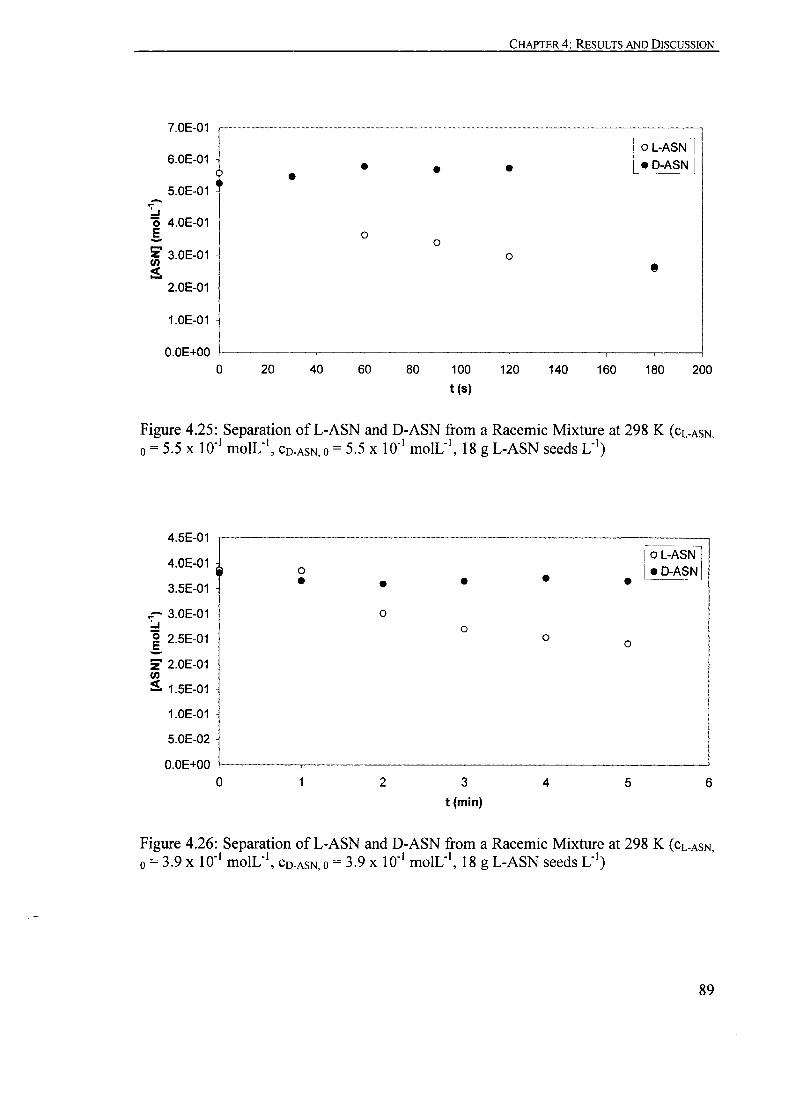
Figure 4.26: Separation ofL-ASN and D-ASN from a Racemic Mixture at 298 K (CL.ASN,O = 3.9 X 10" moIL", CO.ASN,O = 3.9 X 10" moIL", 18 g L-ASN seeds L· I
)........ ........................................... ............ ............ 89
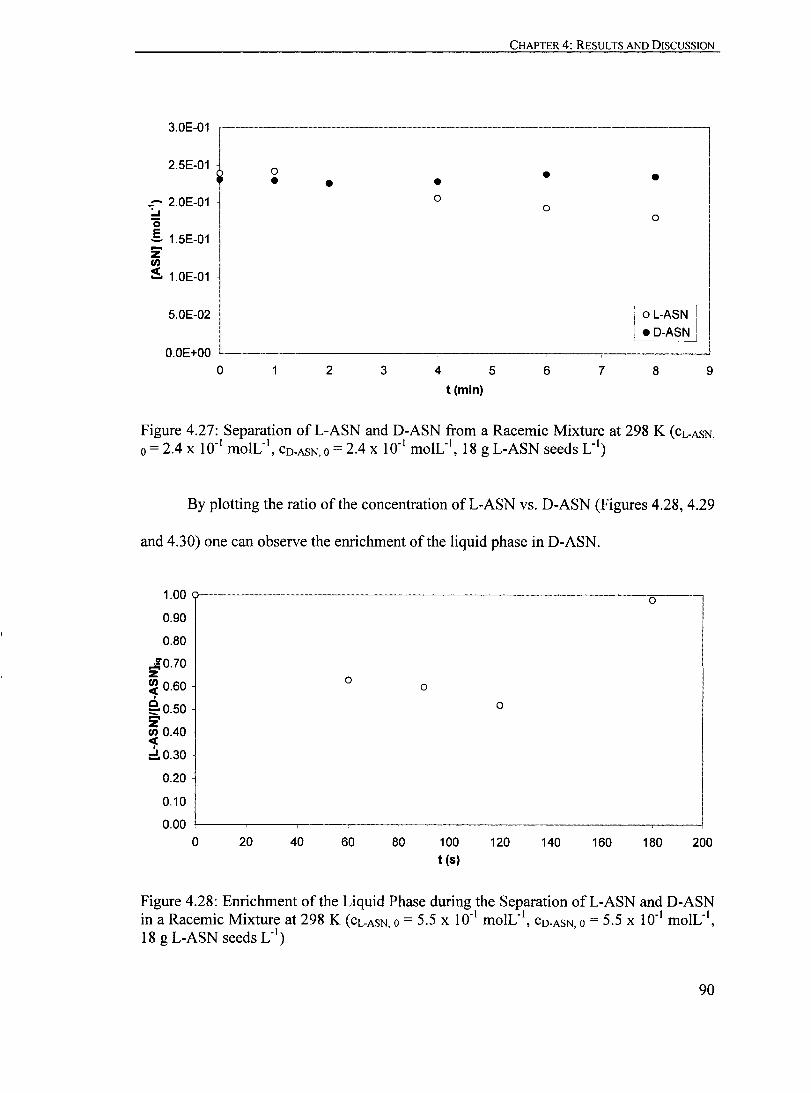
Figure 4.27: Separation ofL-ASN and D-ASN from a Racemic Mixture at 298 K (CL.ASN 0 = 2.4 X 10" moIL", CO.ASN 0 = 2.4 X 10.1 moIL", '., ' 18 g L-ASN seeds L )........................................................................... 90
Figure 4.28: Enrichment of the Liquid Phase during the Separation ofL-ASN and D-ASN in a Racemic Mixture at 298 K (CL.ASN, 0 = 5.5 X 10" moIL", CO-ASN,O = 5.5 X 10⁻¹ moIL", 18 g L-ASN seeds L·')......................................... 90
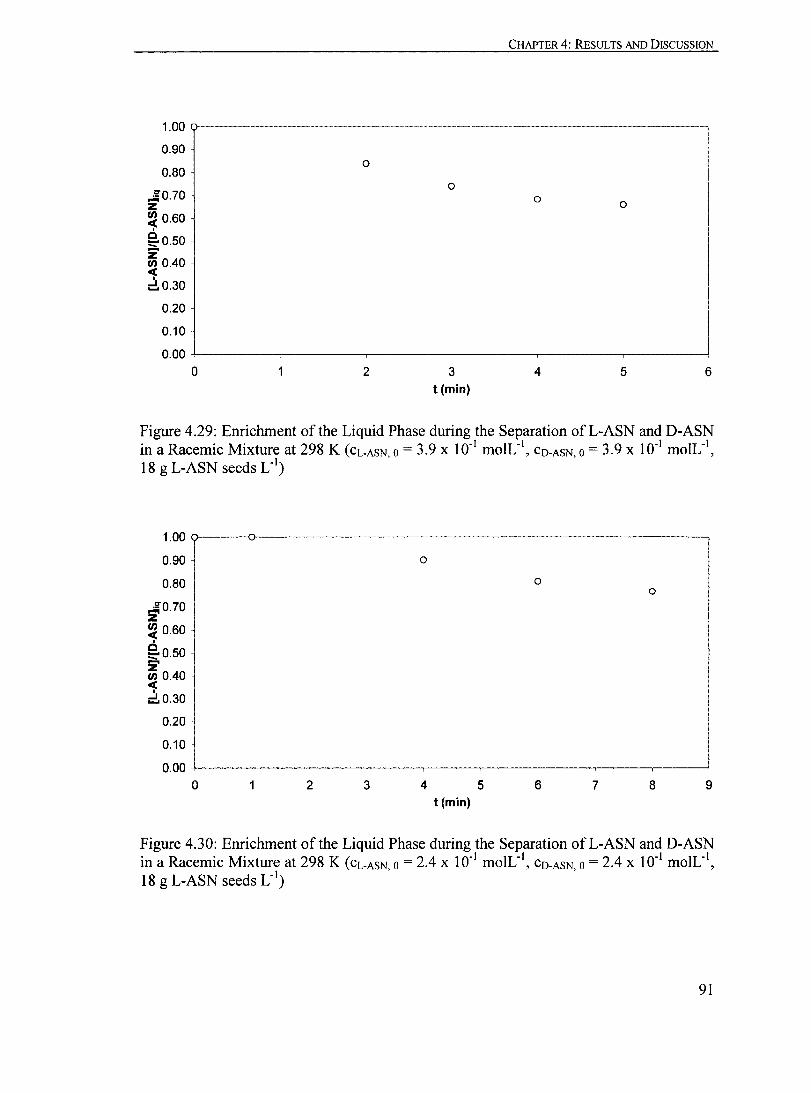
Figure 4.29: Enrichment of the Liquid Phase during the Separation ofL-ASN and D-ASN in a Racemic Mixture at 298 K (CL.ASN, 0 = 3.9 X 10" moIL' I,
Cn.AsN,o = 3.9 x 10" mole', 18 g L-ASN seeds L· I)......................................... 91
Figure 4.30: Enrichment of the Liquid Phase during the Separation ofL-ASN and D-ASN in a Racemic Mixture at 298 K (CL.ASN, 0 = 2.4 x 10" moIL", CO.ASN,O = 2.4 X 10" moIL", 18 g L-ASN seeds L·')......................................... 91
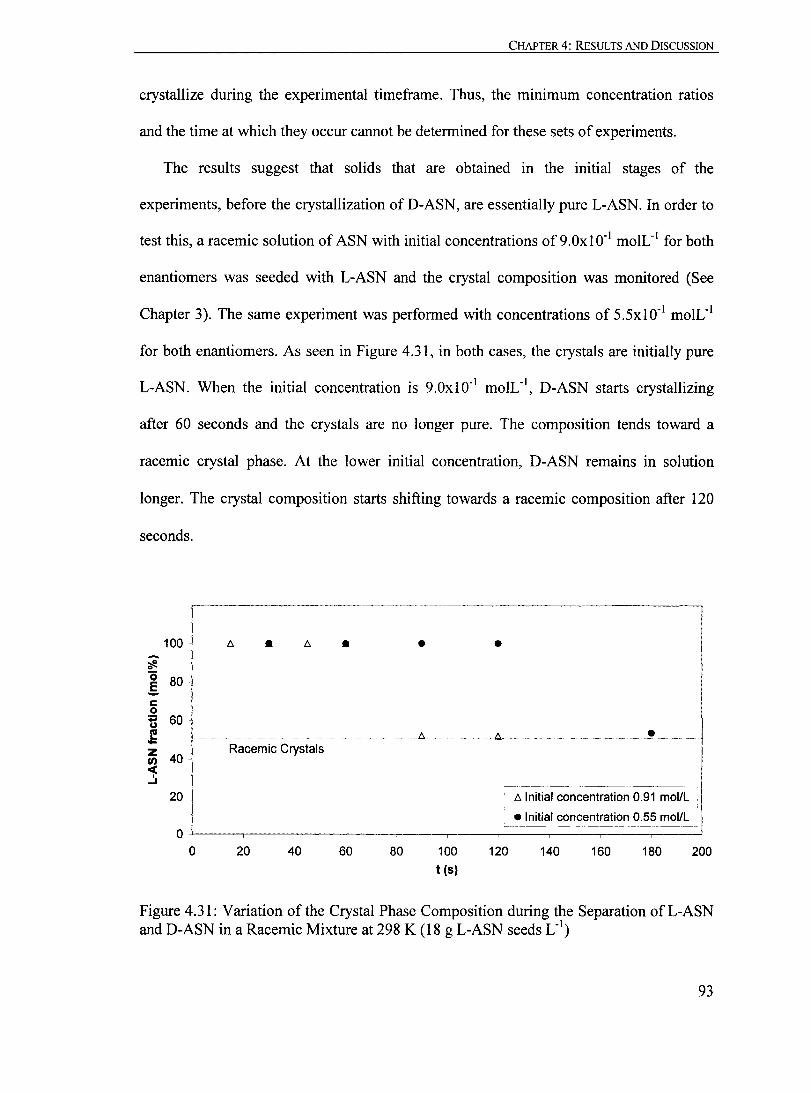
Figure 4.31: Variation of the Crystal Phase Composition during the Separation ofL-ASN and D-ASN in a Racemic Mixture at 298 K (18 g L-ASN seeds L·')......... 93
XIV
Page 17
LIST OF FIGURES
Figure 4.32: Separation ofL-ASN from a Racemic Mixture at 298 K (CL-ASN,O = 9.0 X ID- I moIL-I
, CO-ASN,O = 9.0 X ID- I moIL- I, 18 g L-ASN seeds L- I
)...... 94
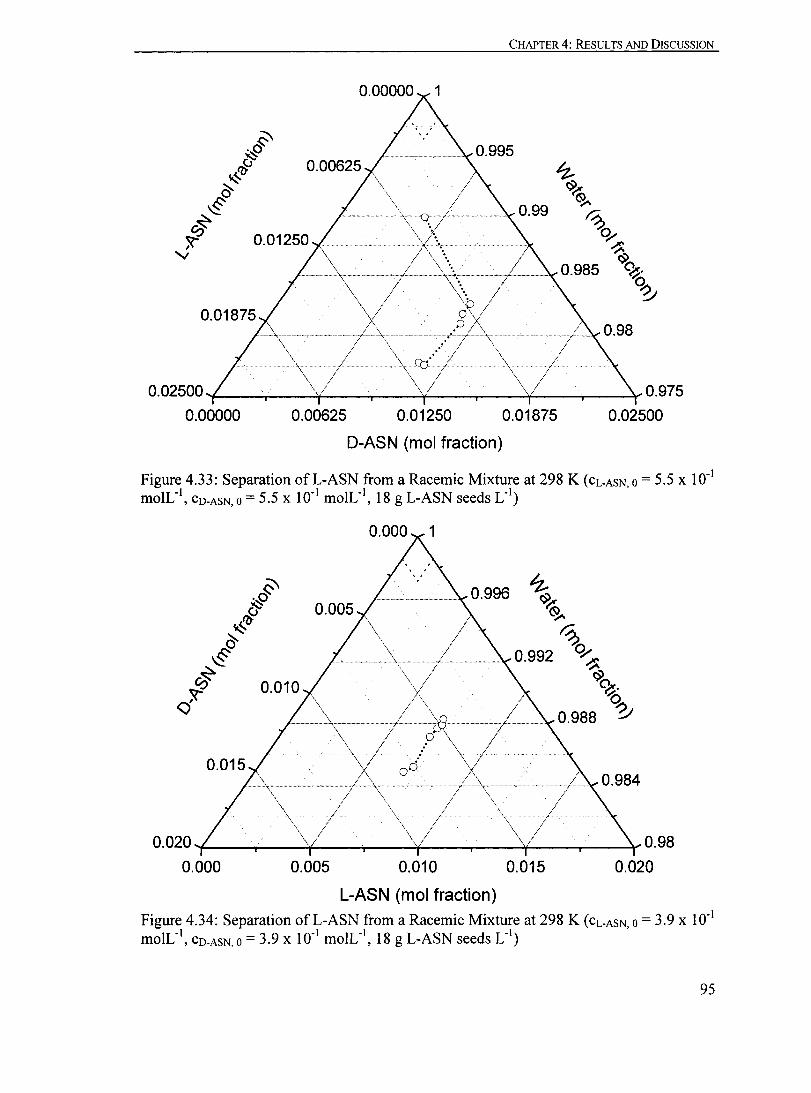
Figure 4.33: Separation ofL-ASN from a Racemic Mixture at 298 K (CL-ASN,O= 5.5 X ID- I moIL-I
, CO-ASN,O = 5.5 X ID- I moIL- I, 18 g L-ASN seeds L- I
)...... 95
Figure 4.34: Separation ofL-ASN from a Racemic Mixture at 298 K (CL-ASN,O = 3.9 X ID- I moIL-I
, CO-ASN, 0 = 3.9 X ID- I moIL- I, 18 g L-ASN seeds L- I
)...... 95
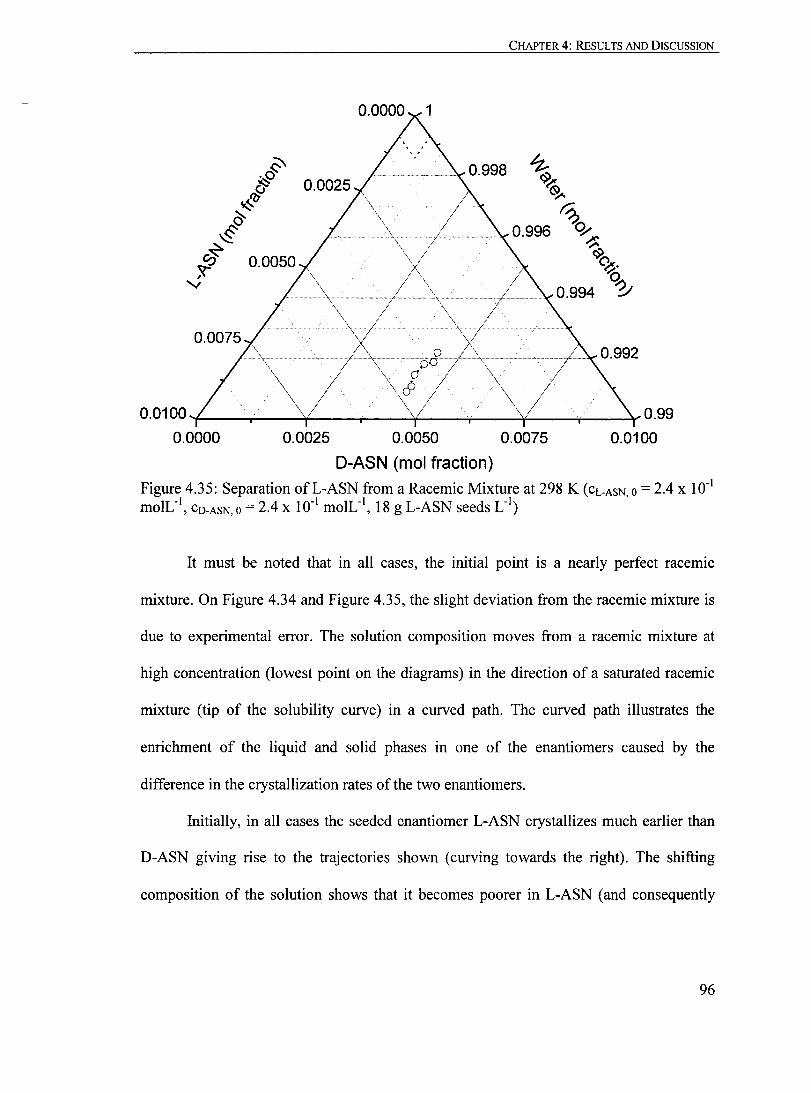
Figure 4.35: Separation ofL-ASN from a Racemic Mixture at 298 K (CL-ASN,O = 2.4 X ID- I moIL-I
, CO-ASN,O = 2.4 X ID- I moIL-I, 18 g L-ASN seeds L- I
)...... 96
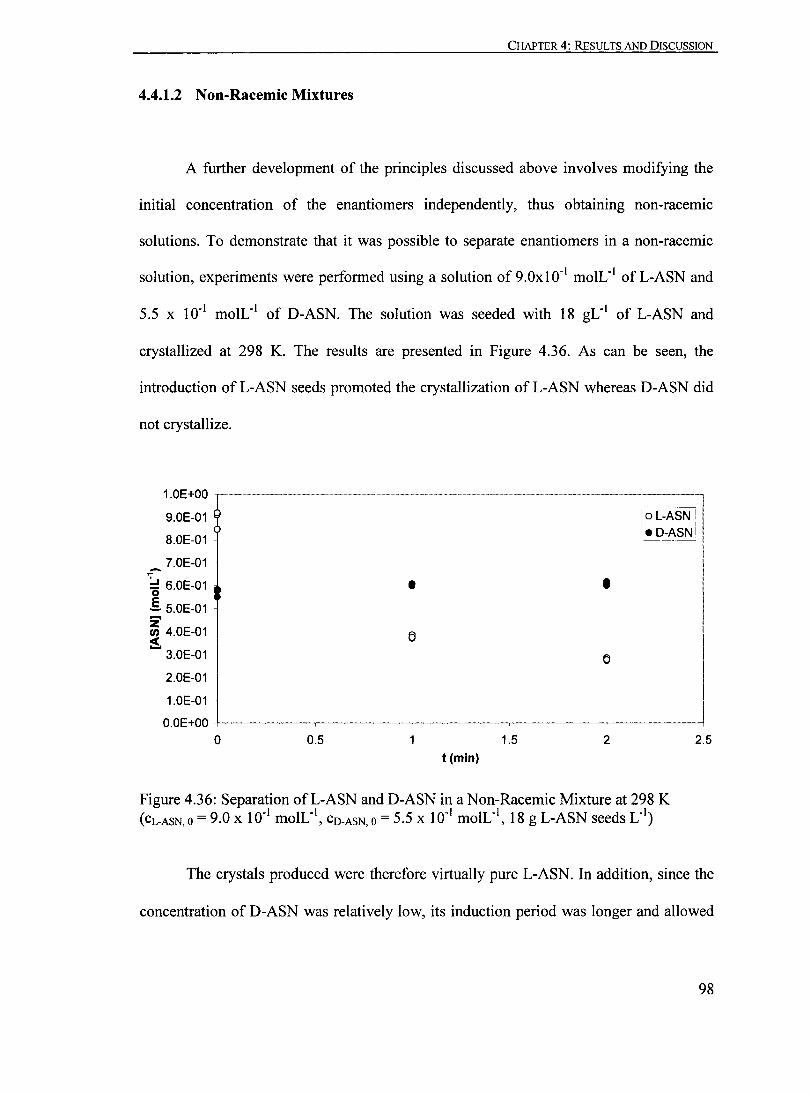
Figure 4.36: Separation ofL-ASN and D-ASN in a Non-Racemic Mixture at 298 K (CL-ASN,O = 9.0 X ID- I moIL-I
, CO-ASN,O = 5.5 X ID- I moIL-I, 18 g L-ASN seeds L- I
)...... 98
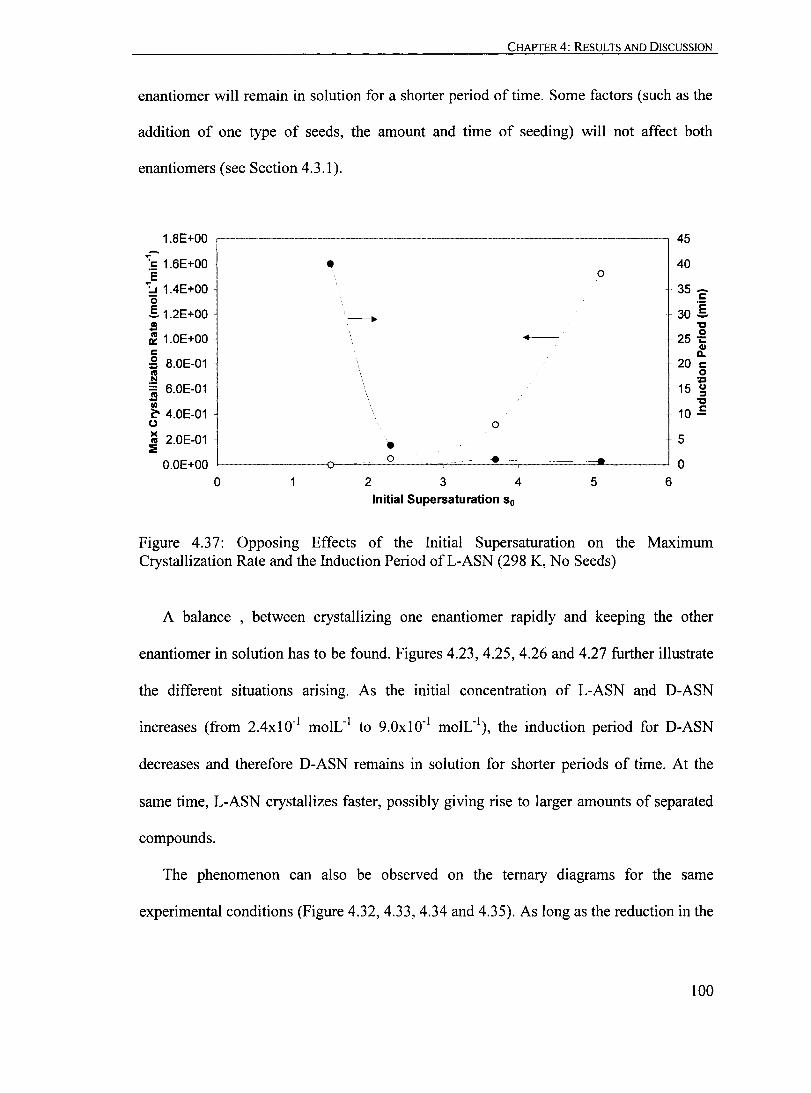
Figure 4.37: Opposing Effects of the Initial Supersaturation on the Maximum Crystallization Rate and the Induction Period ofL-ASN (298 K, No Seeds).. ........... 100
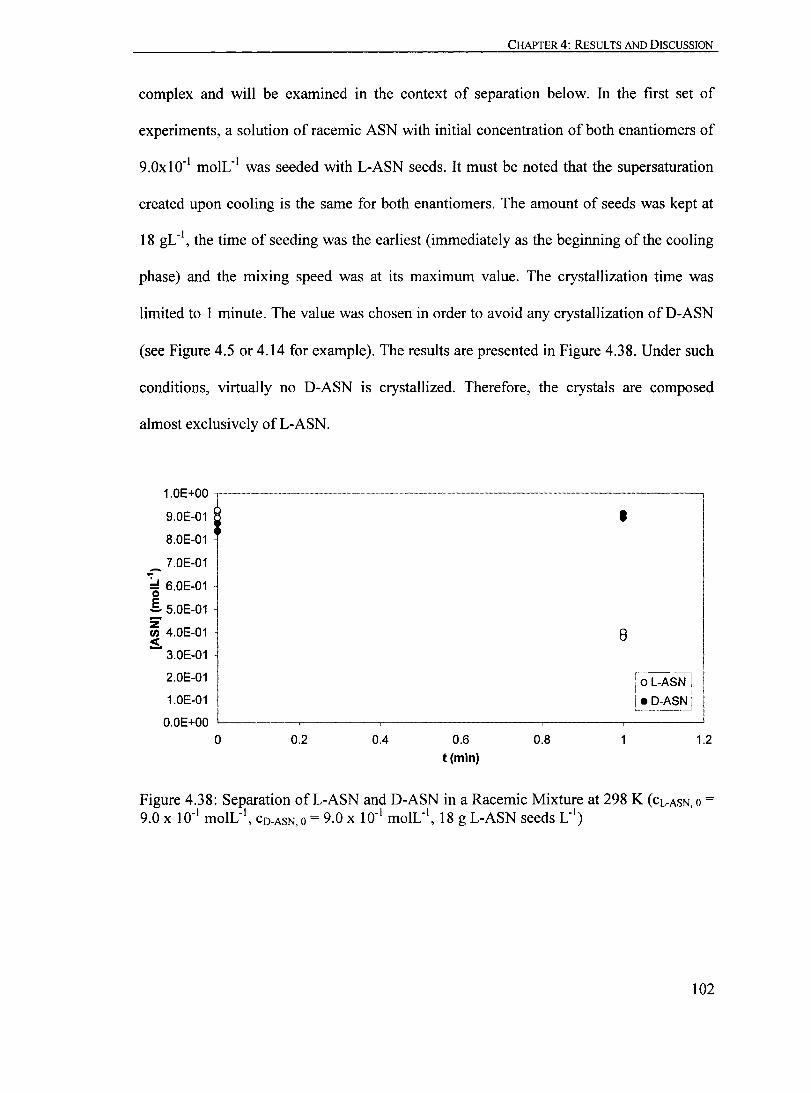
Figure 4.38: Separation ofL-ASN and D-ASN in a Racemic Mixture at 298 K (CL-ASN,O = 9.0 X ID- I moIL- I
, CO-ASN,O = 9.0 X ID- I moIL- I, 18 g L-ASN seeds L- I
)...... ID2
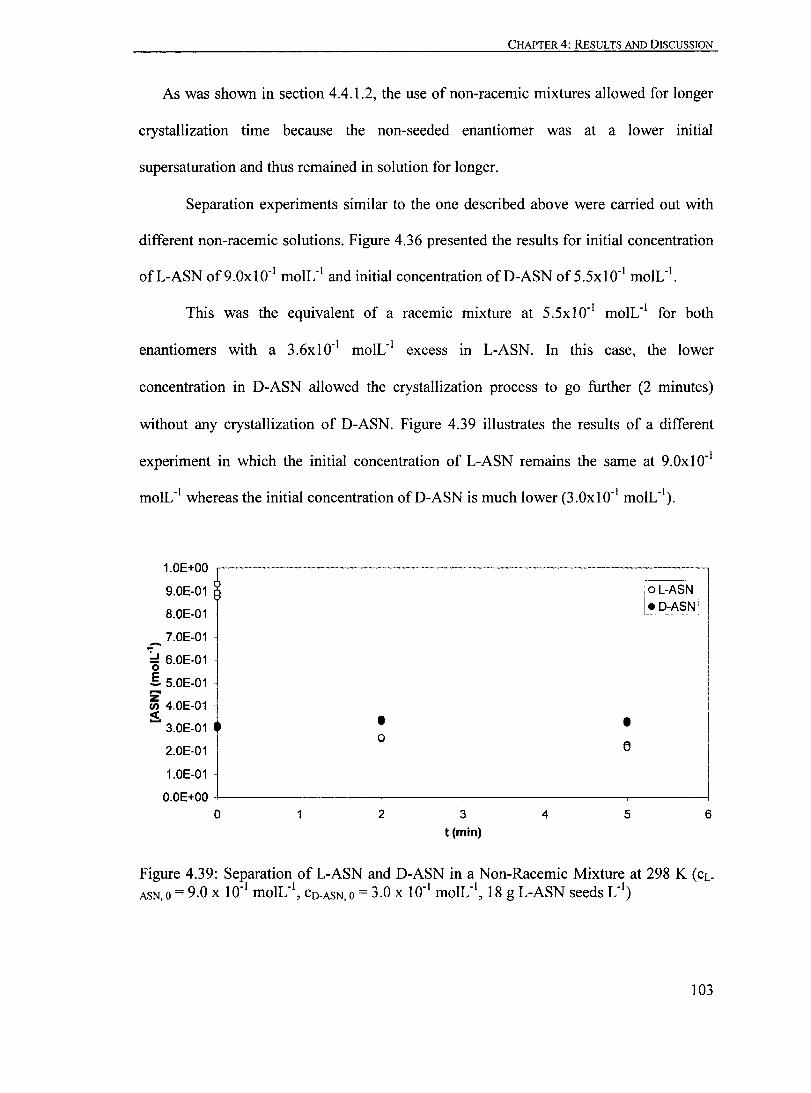
Figure 4.39: Separation ofL-ASN and D-ASN in a Non-Racemic Mixture at 298 K (CL-ASN,O = 9.0 X ID- I moIL-I
, CO-ASN,O = 3.0 X ID- I moIL- I, 18 g L-ASN seeds L- I
)...... 103
Figure 4.40: Cyc1ic Separation of L-ASN and D-ASN in a Racemic Mixture (Initial Enantiomeric Excess Equal to the Net Amount Crystallized)........ .......... .... 108
Figure 4.41: Cyc1ic Separation of L-ASN and D-ASN in a Racemic Mixture (Initial Enantiomeric Excess Larger than the Net Amount Crystallized).................. 110
Figure 4.42: Cyc1ic Separation ofL-ASN and D-ASN in a Racemic Mixture (Initial Enantiomeric Excess Smaller than the Net Amount Crystallized)........... ..... 110
Figure 4.43: Cyc1ic Separation ofL-ASN and D-ASN in a Racemic Mixture (Initial L-ASN Excess Equal to the Net amount Crystallized, Mol Fractions)........... 111
Figure 4.44: Residual Supersaturation Curves for Seeded ASN at 298 K.......... ...... 113
Figure 4.45: Residual Supersaturation Curves for Unseeded ASN at 298 K........ ..... 113
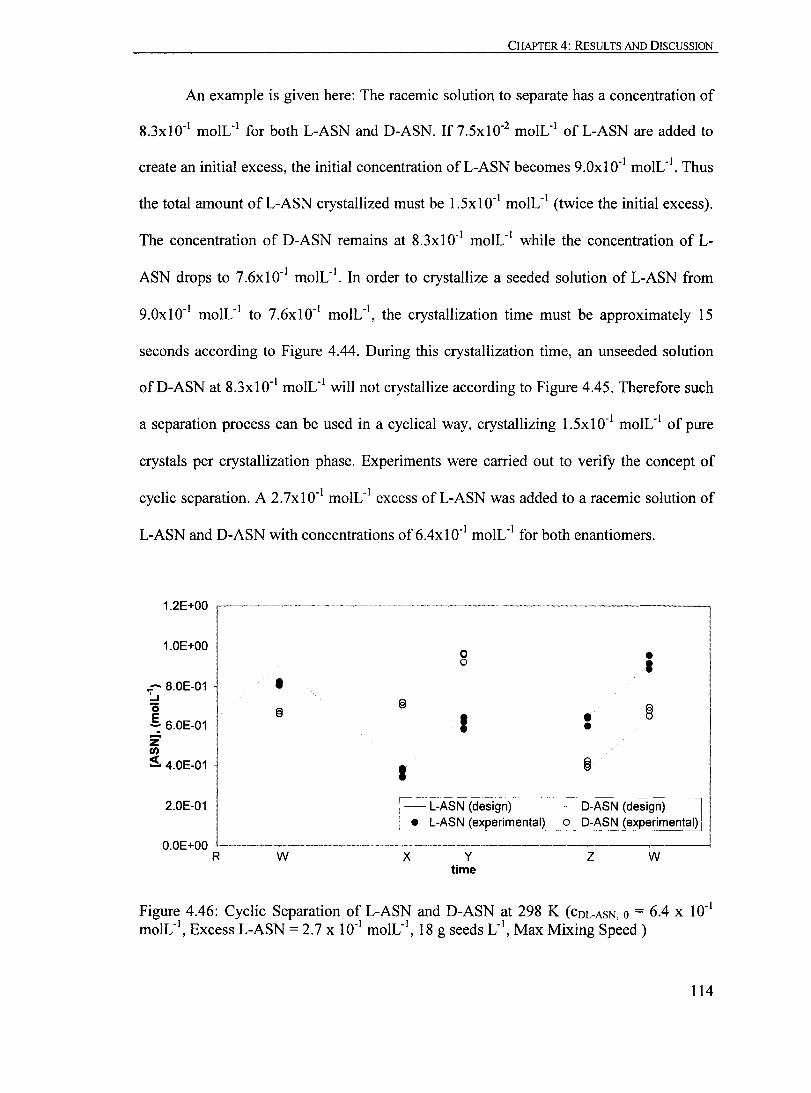
Figure 4.46: Cyc1ic Separation ofL-ASN and D-ASN at 298 K (COL-ASN,O = 6.4 X ID- I moIL- I
, Excess L-ASN = 2.7 x ID- I moIL- I,
18 g seeds L- I, Max Mixing Speed )............................................................ 114
Figure 4.47: Cyc1ic Separation ofL-ASN and D-ASN at 298 K (COL-ASN,O = 6.4 X ID- I moIL- I
, Excess L-ASN = 2.7 x ID- I moIL-I,
18 g seeds L- I, Max Mixing Speed, Mol Fractions)................ .......... ................. 116
xv
Page 18
LIST OF FIGURES
Figure 4.48: Growth Rate of L-ASN at 298 K (so = 1.3, 18 g L-ASN seeds Loi, Max Mixing Speed).. ......................................................................... .... 119
Figure 4.49: Growth Rate ofL-ASN at 298 K (so = 5.0,18 g L-ASN seeds LoI, Max Mixing Speed).. .......................................................................... ... 119
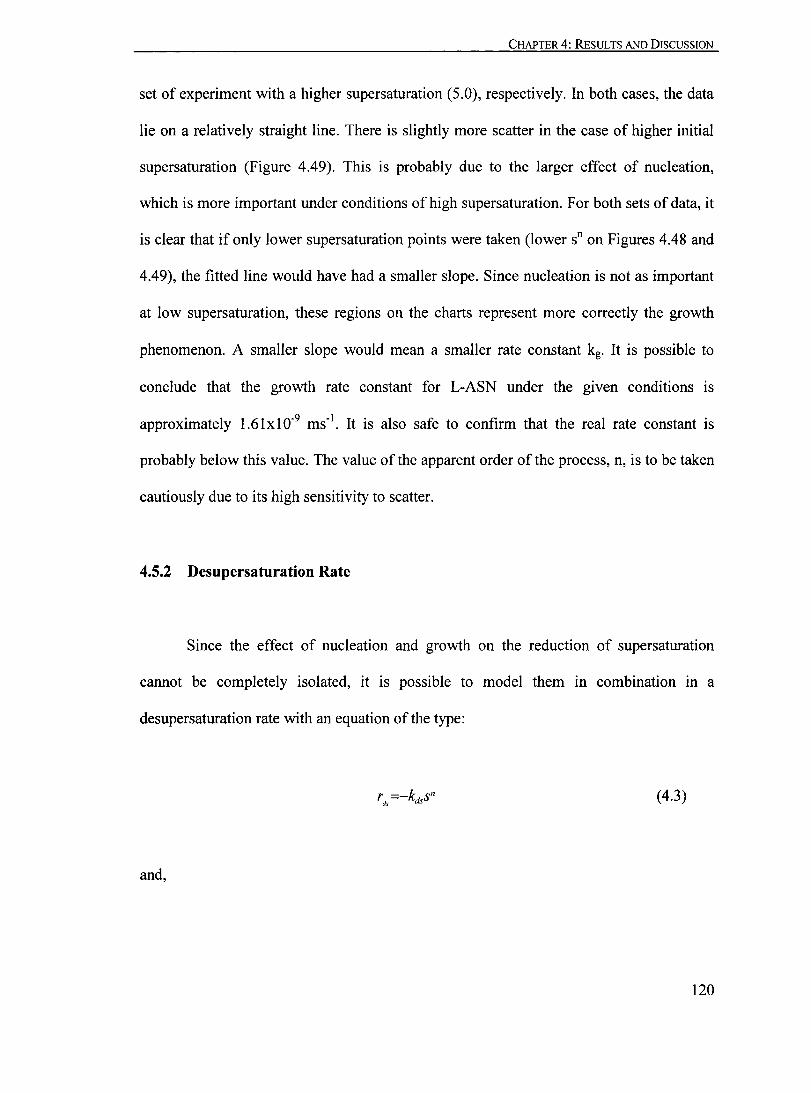
Figure 4.50: Desupersaturation Rate ofL-ASN at 298 K (so = 1.3, 18 g L-ASN seeds LoI, Max Mixing Speed)................................................... 121
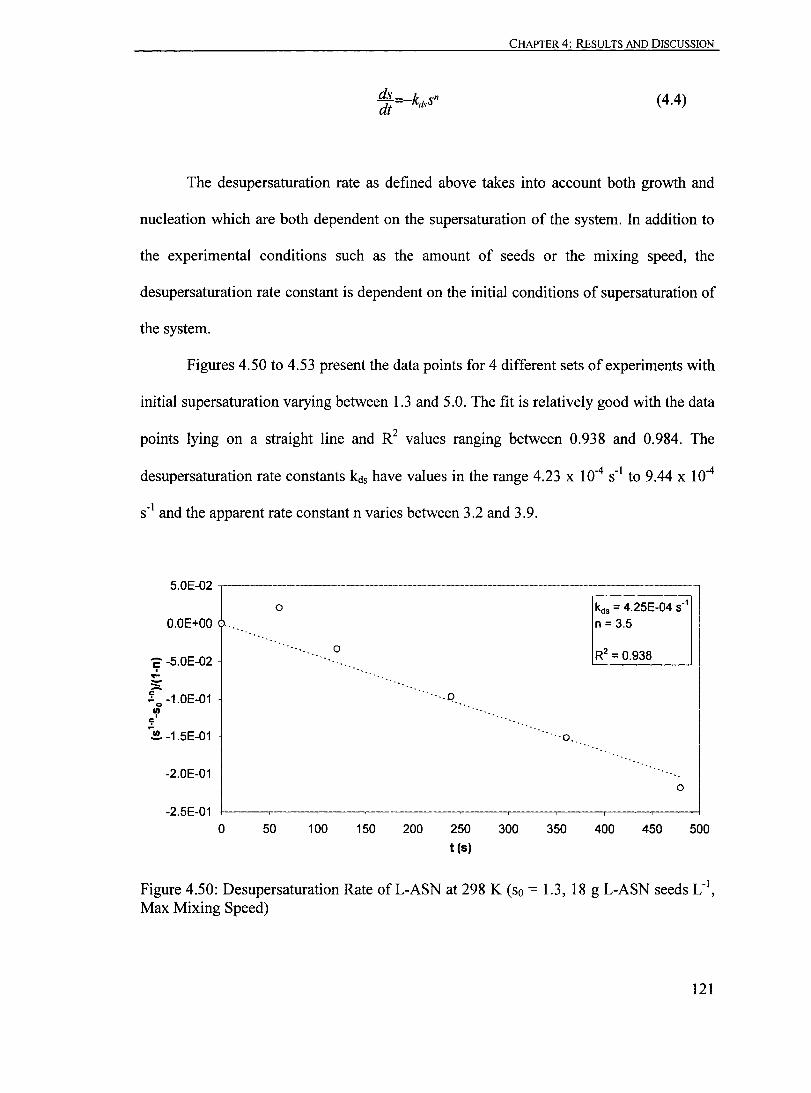
Figure 4.51: Desupersaturation Rate ofL-ASN at 298 K (so = 2.3, 18 g L-ASN seeds LoI, Max Mixing Speed)................................................... 122
Figure 4.52: Desupersaturation Rate ofL-ASN at 298 K (so = 3.0, 18 g L-ASN seeds Loi, Max Mixing Speed)................................................... 122
Figure 4.53: Desupersaturation Rate ofL-ASN at 298 K (so = 5.0, 18 g L-ASN seeds LoI, Max Mixing Speed).................. .............. ............ ....... 123
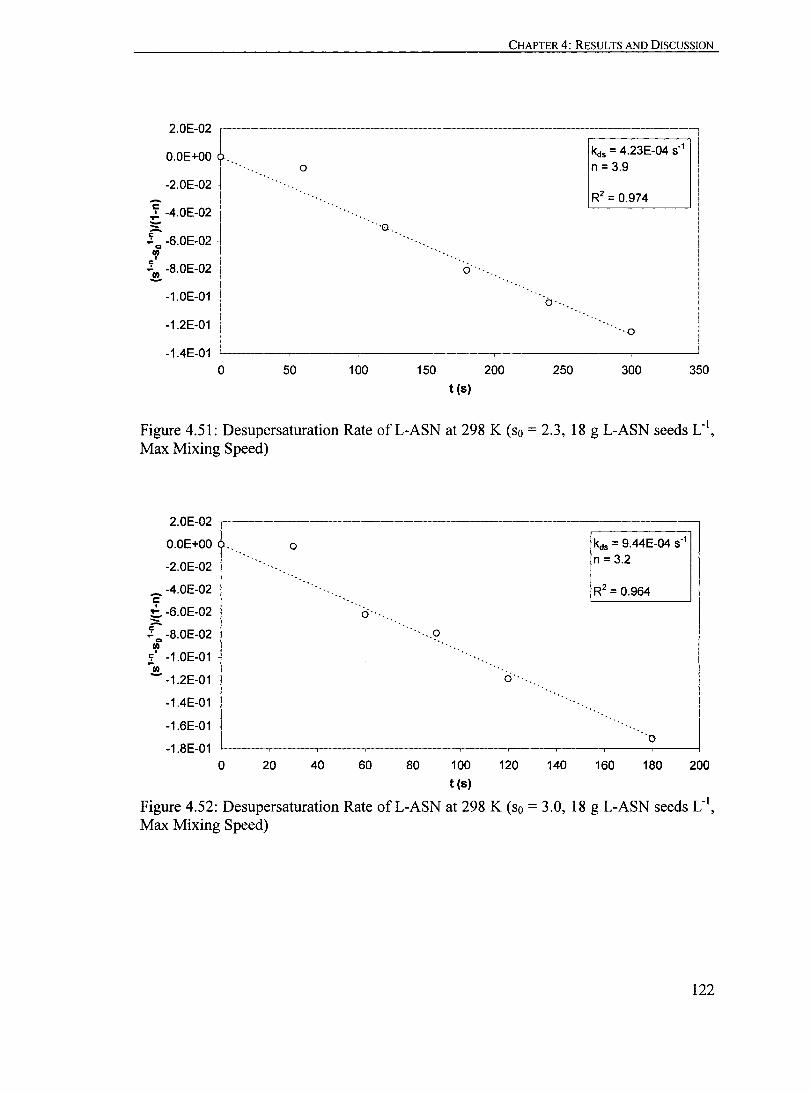
Figure 4.54: Comparison between Experimental Data Points and Model for L-ASN (T = 298 K, So = 1.3, 18 g L-ASN seeds Loi, Max Mixing Speed)........... 124
Figure 4.55: Comparison between Experimental Data Points and Model for L-ASN (T = 298 K, So = 2.3, 18 g L-ASN seeds Loi, Max Mixing Speed)........... 125
Figure 4.56: Comparison between Experimental Data Points and Model for L-ASN (T = 298 K, So = 3.0, 18 g L-ASN seeds LoI, Max Mixing Speed)............ 125
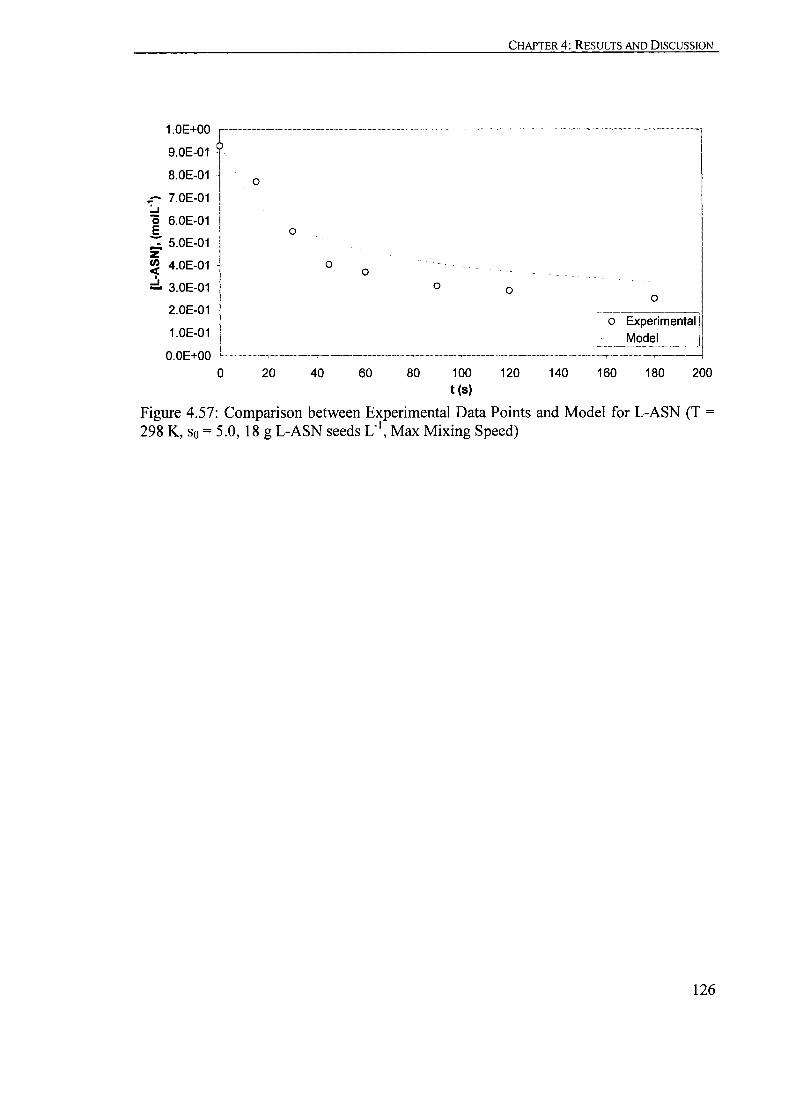
Figure 4.57: Comparison between Experimental Data Points and Model for L-ASN (T = 298 K, So = 5.0, 18 g L-ASN seeds Cl, Max Mixing Speed)........... 126
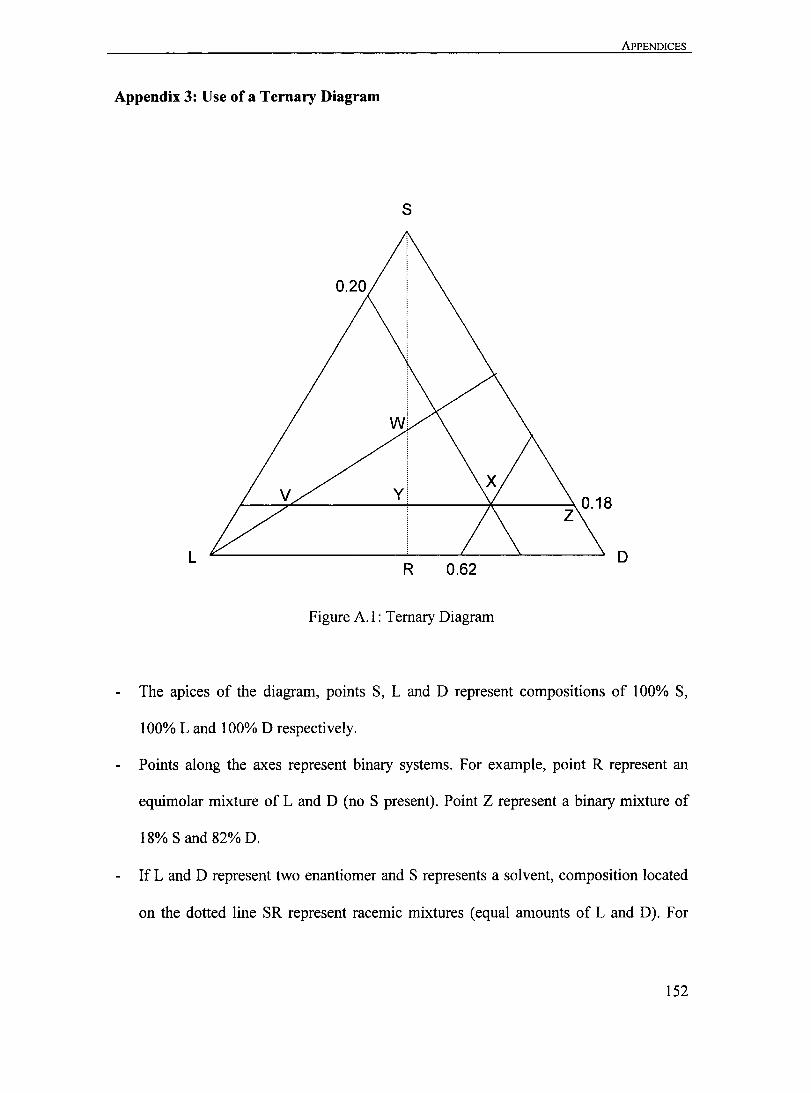
Figure A.1: Ternary Diagram................................................................... 152
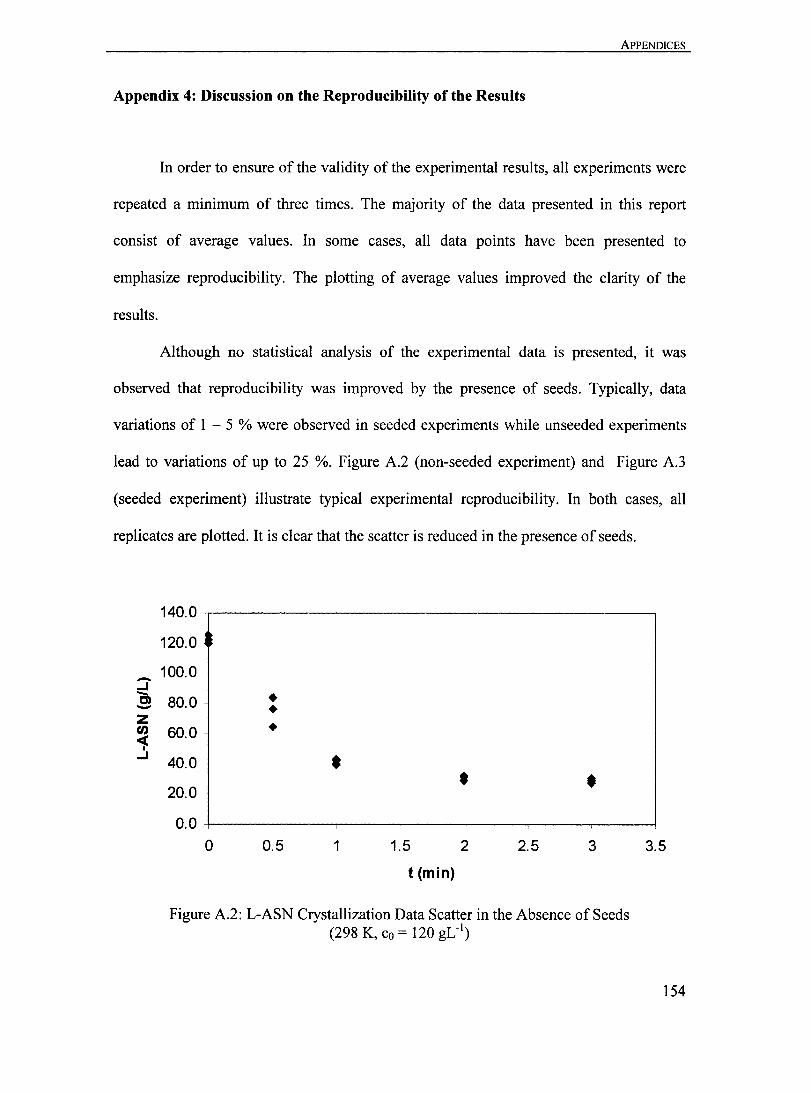
Figure A.2: L-ASN Crystallization Data Scatter in the Absence of Seeds (298 K, Co = 120 gLO I
)............................................................................ 154
Figure A.3: L-ASN Crystallization Data Scatter in the Presence of Seeds (298 K, Co = 120 gLO I, 12 g L-ASN seeds LoI)................................................ 155
XVI
Page 19
LIST OF TABLES
List of Tables
xvii
Page 20
LIST OF TABLES
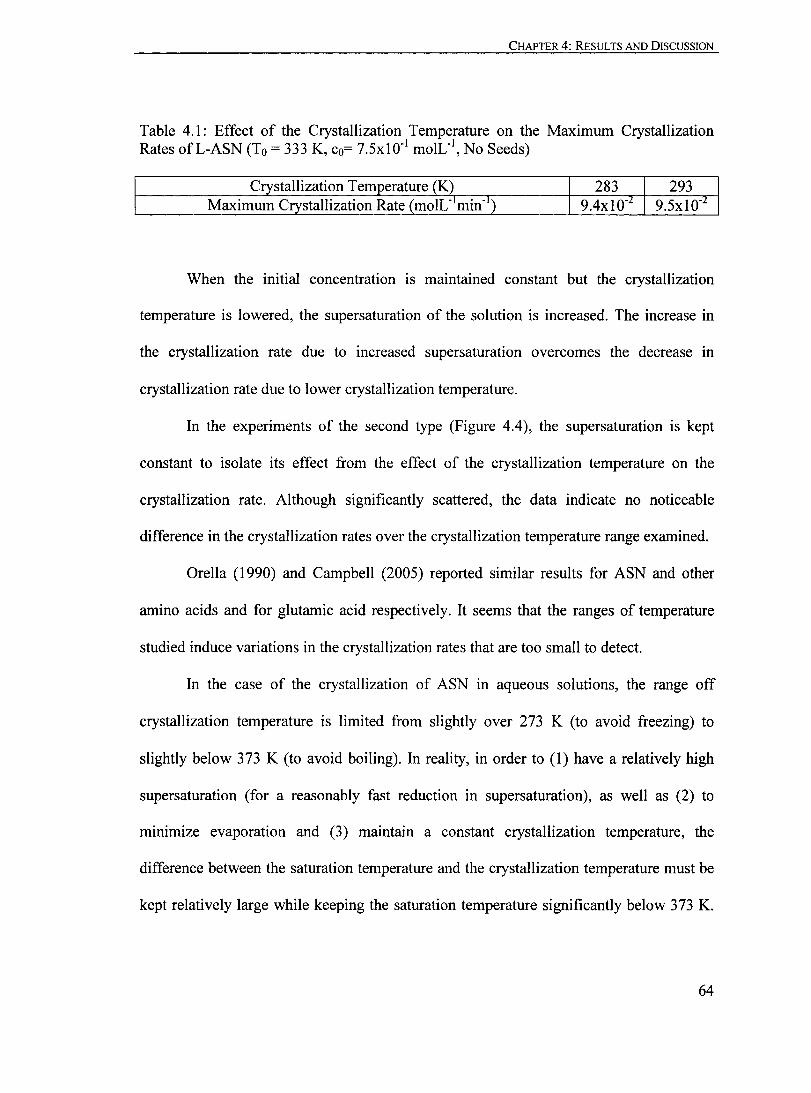
Table 4.1: Effect of the Crystallization Temperature on the Maximum
Crystallization Rates ofL-ASN (Ta = 333 K, Co= 7.5xlO-1 moIL- I,
No Seeds)....................... ............................................................... ... 64
Table 4.2: Effect of the Initial Supersaturation on the Reduction in
Supersaturation ofL-ASN, the Duration of the Induction Period and the
Maximum Crystallization Rate at T= 298 K (No Seeds)..... ............................. 65
Table 4.3: Effect of the L-ASN Seeds on the Maximum Crystallization
Rates ofL-ASN at 298 K (co = 9.5xlO-1 moIL-I)........................................... 72
Table 4.4: Effect oflnitial Concentration on Time to Reach Set Supersaturation... ... 81
Table 4.5: Effect of the Mixing Speed on the Average Crystallization
Rate ofL-ASN in a Racemic Solution at 298 K (18 g L-ASN seeds L- I)...... ......... 83
Table 4.6: Differences in Induction Period and Maximum Crystallization
Rates during the Separation of L-ASN and D-ASN in a Racemic Solution
at 298 K (18 g L-ASN seeds L- I)... ...... ......... ..................... ... ... ......... ........ 87
Table 4.7: Effect of the Initial Solute Concentration on the Maximum
Concentration Ratio and the Time at which the Maximum Concentration
Ratio Occurs in a Racemic Solution at 298 K (18 g L-ASN seeds L- I).............. .... 92
Table 4.8: Effect of the Initial Concentrations of the Enantiomers on the
Separation of L-ASN and D-ASN in a Racemic Solution at 298 K
(18 g L-ASN seeds L- I, Max Mixing Speed)................................................ 104
Table 4.9: Net Effect of the Initial Concentrations of the Enantiomers on the
Separation of L-ASN and D-ASN in a Racemic Solution at 298 K
(18 g L-ASN seeds L- I, Max Mixing Speed)................................................. 104
XVlll
Page 21
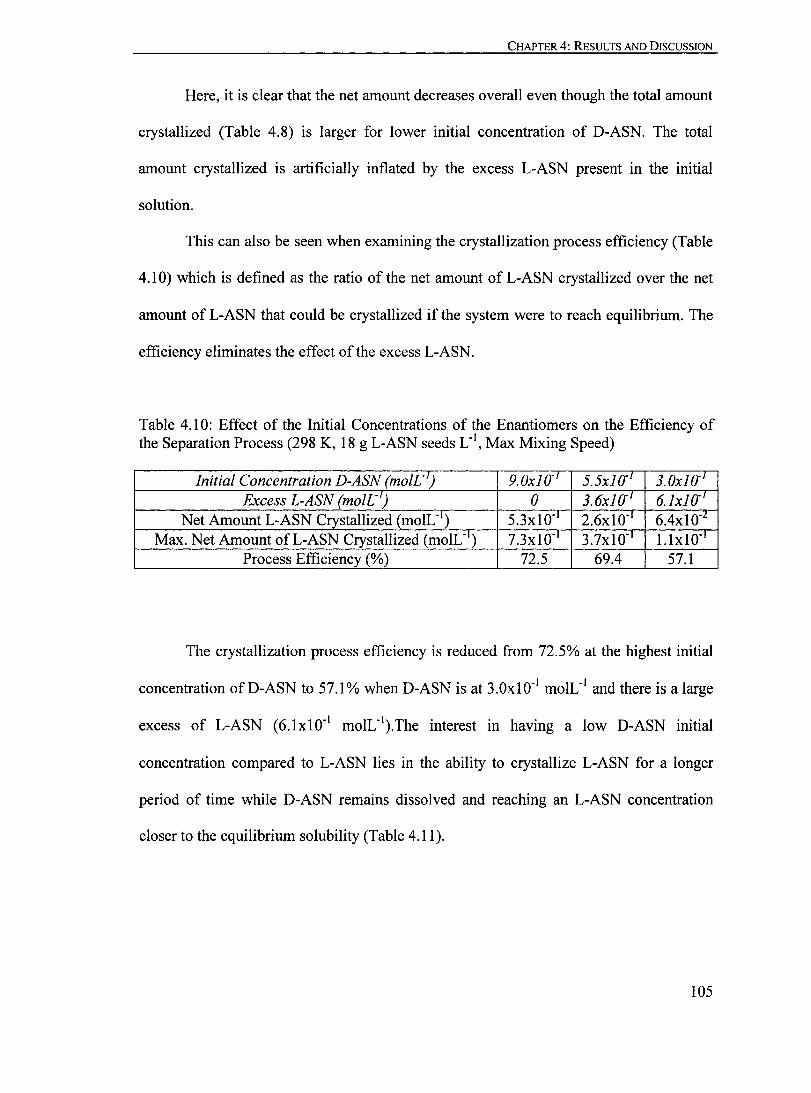
Table 4.10: Effect of the Initial Concentrations of the Enantiomers on the
Efficiency of the Separation Process (298 K, 18 g L-ASN seeds L-1,
LIST OF TABLES
Max Mixing Speed)........... ............................................................... .... 105
Table 4.11: Effect of the Initial Concentrations of the Enantiomers on the
Recovery of the Seeded Enantiomer (298 K, 18 g L-ASN seeds L- I,
Max Mixing Speed).......................................................................... .... 106
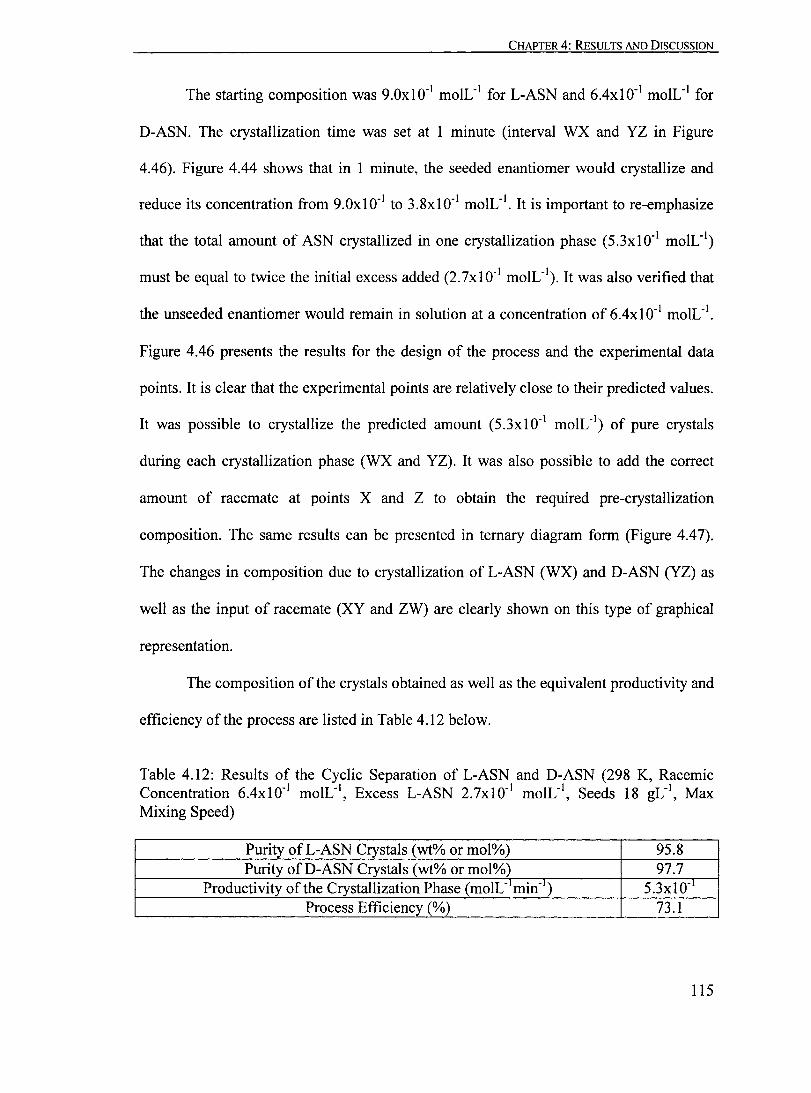
Table 4.12: Results of the Cyclic Separation ofL-ASN and D-ASN (298 K,
Racemic Concentration 6.4xl0-1 moIL- I, Excess L-ASN 2.7xl0-1 moIL- I,
Seeds 18 gL- I, Max Mixing Speed).......................................................... 115
XIX
Page 22
LIST OF SYMBOLS
List of Symbols
xx
Page 23
A
a
C
Co
Co
Cf
Ci
Cxs
* C
~c
E
Eg
f
y
k
Lseedparticle
m
mseed
mseedparticle
n
n
nseed
LIST OF SYMBOLS
Arrhenius Pre-exponential Factor
Supersaturation Polynomial Model Coefficients (i = 1 to 4)
Solubility Ratio
Crystal Volume Shape Factor
Concentration
Initial Concentration, absolute
Concentration of D-ASN
Final Concentration, relative
Initial Concentration, relative
Concentration of L-ASN
Excess Enantiomer Concentration
Solubility
Excess Concentration
Activation Energy
Growth Activation Energy
Crystal Shape Factor
Volume Excess Free Energy
Interfacial Tension
Boltzmann 's Constant
Desupersaturation Rate Constant
Growth Rate Constant
Nucleation Rate Constant
Rate Constants
Crystal Length
Length of One Seed Crystal Particle
Nucleation Apparent Order
Total Mass ofSeeds
Mass of One Seed Crystal Particle
Growth Apparent Order
Crystal Density Function
Total Number of Seed Particles
XXI
Page 24
npart
no
R
f
fg
f n
p
S
So
t
V seedparticIe
VT
[il
Number of Crystals in One Size Interval
Particle Size Distribution of the Seeds
Gas Constant
Equivalent Radius of One Crystal Particle
Nuclei Critical Radius
Desupersaturation Rate
Growth Rate
Nucleation Rate
Crystal Density
Supersaturation
Initial Supersaturation
Time
Initial time, relative
Final time, relative
Temperature
Molecular Volume
Volume of One Crystal Particle
Volume of One Seed Crystal Particle
Total Solution Volume
Concentration of Component i
LIST OF SYMBOLS
XXIl
Page 25
CHAPTER 1: INTRODUCTION
Chapter 1: Introduction
1
Page 26
CHAPTER 1: INTRODUCTION
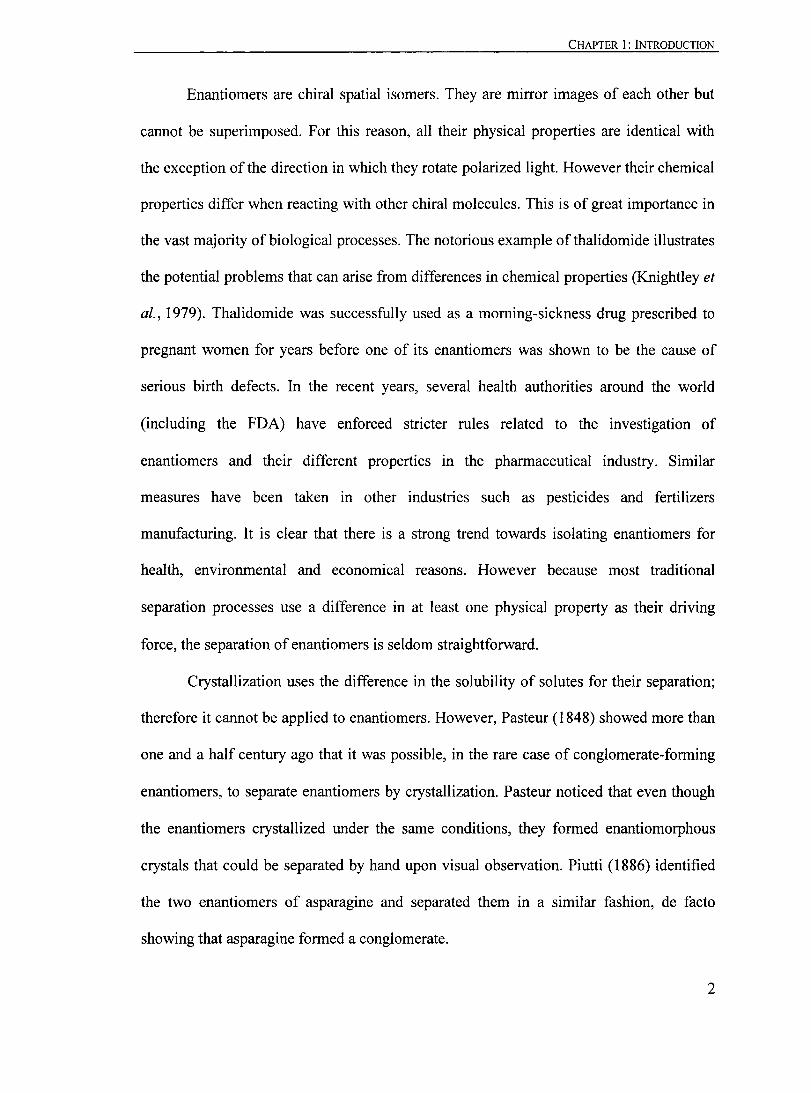
Enantiomers are chiral spatial isomers. They are mirror images of each other but
cannot be superimposed. For this reason, aIl their physical properties are identical with
the exception of the direction in which they rotate polarized light. However their chemical
properties differ when reacting with other chiral molecules. This is of great importance in
the vast majority ofbiological processes. The notorious example of thalidomide illustrates
the potential problems that can arise from differences in chemical properties (Knightley et
al., 1979). Thalidomide was successfully used as a moming-sickness drug prescribed to
pregnant women for years before one of its enantiomers was shown to be the cause of
serious birth defects. In the recent years, several health authorities around the world
(including the FDA) have enforced stricter rules related to the investigation of
enantiomers and their different properties in the pharmaceutical industry. Similar
measures have been taken in other industries such as pesticides and fertilizers
manufacturing. It is clear that there is a strong trend towards isolating enantiomers for
health, environmental and economical reasons. However because most traditional
separation processes use a difference in at least one physical property as their driving
force, the separation of enantiomers is sel dom straightforward.
Crystallization uses the difference in the solubility of solutes for their separation;
therefore it cannot be applied to enantiomers. However, Pasteur (1848) showed more than
one and a half century ago that it was possible, in the rare case of conglomerate-forming
enantiomers, to separate enantiomers by crystallization. Pasteur noticed that even though
the enantiomers crystallized under the same conditions, they formed enantiomorphous
crystals that could be separated by hand upon visual observation. Piutti (1886) identified
the two enantiomers of asparagine and separated them in a similar fashion, de facto
showing that asparagine formed a conglomerate.
2
Page 27
CHAPTER 1: INTRODUCTION
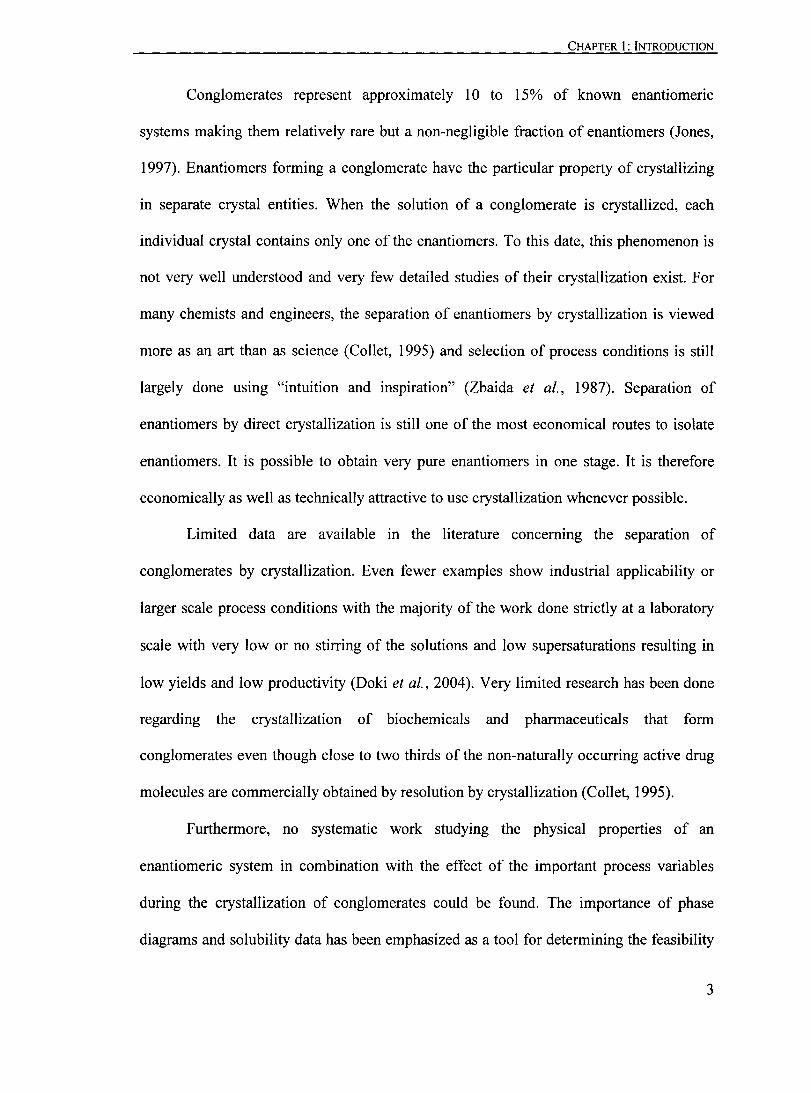
Conglomerates represent approximately lOto 15% of known enantiomeric
systems making them relatively rare but a non-negligible fraction of enantiomers (Jones,
1997). Enantiomers forming a conglomerate have the particular property of crystallizing
in separate crystal entities. When the solution of a conglomerate is crystallized, each
individual crystal contains only one of the enantiomers. To this date, this phenomenon is
not very weIl understood and very few detailed studies of their crystallization exist. For
many chemists and engineers, the separation of enantiomers by crystallization is viewed
more as an art than as science (Collet, 1995) and selection of process conditions is still
largely done using "intuition and inspiration" (Zbaida et al., 1987). Separation of
enantiomers by direct crystallization is still one of the most economical routes to isolate
enantiomers. It is possible to obtain very pure enantiomers in one stage. It is therefore
economically as weIl as technically attractive to use crystallization whenever possible.
Limited data are available in the literature conceming the separation of
conglomerates by crystallization. Even fewer examples show industrial applicability or
larger scale process conditions with the majority of the work done strictly at a laboratory
scale with very low or no stirring of the solutions and low supersaturations resulting in
low yields and low productivity (Doki et al., 2004). Very limited research has been done
regarding the crystallization of biochemicals and pharmaceuticals that form
conglomerates even though close to two thirds of the non-naturally occurring active drug
molecules are commercially obtained by resolution by crystallization (Collet, 1995).
Furthermore, no systematic work studying the physical properties of an
enantiomeric system in combination with the effect of the important process variables
during the crystallization of conglomerates could be found. The importance of phase
diagrams and solubility data has been emphasized as a tool for determining the feasibility
3
Page 28
CHAPTER 1: INTRODUCTION
of resolution by crystallization (Collet et al., 1980). In addition, the crystallization rate of
the individual enantiomers must be carefully examined since it can be used as the driving
force for separation.
The objectives of the present work were to study the effects of the variables
relevant to the crystallization of the asparagine enantiomers and to develop separation
processes for this enantiomeric system. These objectives are described in more detail at
the end ofChapter 2.
In Chapter 2, general background information is given on amino acids in general
and more particularly on asparagine. A brief description of the properties of enantiomers,
diastereomers and conglomerates is also presented. Chromatography, stereosynthesis and
other non-crystallization methods that can be used to separate enantiomers are described
with their advantages and shortcomings. The crystallization process is then covered with
a detailed description of the nuc1eation and growth processes. Finally, a comprehensive
literature review on the separation of enantiomers by crystallization, inc1uding the
crystallization of diastereomers and conglomerates is provided along with the
presentation of design tools for the graphical representation of the separation process and
the determination of favourable conditions for the separation.
Chapter 3 contains a detailed description of aIl the materials and experimental
methods used to determine the physical properties of asparagine as weIl as the different
set-ups used for the experimental separation of the enantiomers and for the analysis of the
solid and liquid phases.
In Chapter 4, the results and discussion of the results are presented. The effect of
temperature on the solubility of asparagine in discussed first. The effect of variables such
as mixing, crystallization temperature, supersaturation and seeding on the crystallization
4
Page 29
CHAPTER 1: INTRODUCTION
rate of the individual enantiomers is then presented. Finally, different versions of the
separation process are developed and described along with modeling of the crystallization
process with an emphasis on the growth rate and the desupersaturation rate.
The findings are surnmarized in the Chapter 5 and recommendations are made
regarding possible future work on the separation of conglomerates.
5
Page 30
CHAPTER 2: BACKGROUND INFORMATION AND LITERATURE SURVEY
Chapter 2: Background Information
and Literature Survey
6
Page 31
CHAPTER 2: BACKGROUND INFORMATION AND LITERATURE SURVEY
2.1 Amino Acids and Asparagine
Amino acids are simple biochemicals. They constitute the components of peptides
and proteins. Amino acids have a carboxylic group and an amine group attached to an
asymmetric carbon atom (Jones, 1997). Most amino acids are produced by fermentation
(mostly for L- enantiomers), chemical synthesis (mostly for racemates) or enzymatic
resolution (mostly for D- enantiomers) (Yamamoto, 1985).
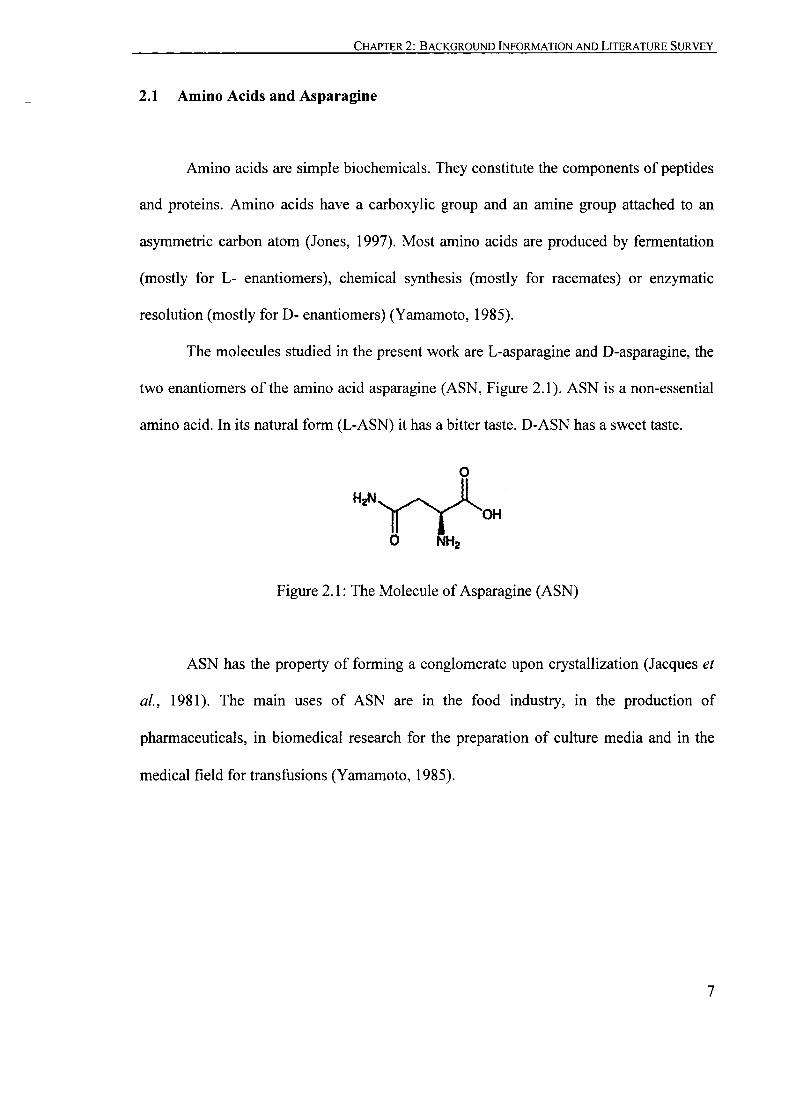
The molecules studied in the present work are L-asparagine and D-asparagine, the
two enantiomers of the amino acid asparagine (ASN, Figure 2.1). ASN is a non-essential
amino acid. In its natural form (L-ASN) it has a bitter taste. D-ASN has a sweet taste.
Figure 2.1: The Molecule of Asparagine (ASN)
ASN has the property of forming a conglomerate upon crystallization (Jacques et
al. , 1981). The main uses of ASN are in the food industry, in the production of
pharmaceuticals, in biomedical research for the preparation of culture media and in the
medical field for transfusions (Yamamoto, 1985).
7
Page 32
CHAPTER 2: BACKGROUND INFORMATION AND LITERATURE SURVEY
2.2 Enantiomers, Diastereomers and Conglomerates
2.2.1 Enantiomers
Enantiomers are stereoisomers that are mirror images (Figure 2.2). The chirality of
enantiomers is due to the existence on at least one asymmetric center, generally a carbon
atom, with four different bonds (Jones, 1997). They are therefore not superimposable.
x y-cf-w z
Figure 2.2: Enantiomers (after Morrison et al., 1973).
The nomenclature to distinguish between two enantiomers is based on their
absolute configuration (Figure 2.3). The groups bonded to the asymmetric center are
classified in order of priority using the Cahn-Ingold-Prelog rule (in general, the largest
atomic number has the highest priority).
R s
Figure 2.3: Nomenclature from the Configuration of Enantiomers (after Morrison et al., 1973)
8
Page 33
CHAPTER 2: BACKGROUND INFORMATION AND LITERATURE SURVEY
The group with the lowest priority is placed perpendicular to the plane, away from
the viewer. If the order of priority of the remaining three groups is clockwise, the
enantiomer is identified as the r-enantiomer (r standing for rectus). If the order of priority
is counterclockwise, the enantiomer is identified as the s-enantiomer (s standing for
sinister). Enantiomers can also be identified based on the direction in which they rotate
polarized light, an L-enantiomer (levorotary) rotating it counterclockwise and a D
enantiomer (dextrorotary) rotating it clockwise. A levorotary enantiomer can also be
labeled as a (-) enantiomer and a dextrorotary enantiomer can be labeled as a (+)
enantiomer. There is no relation between the absolute configuration of enantiomers and
the direction in which they rotate polarized light.
Since they are stereoisomers, enantiomers have identical physical properties
except for their ability to rotate light (Enantiomers rotate polarized light by the same
angle but in opposite directions). This makes it difficult to isolate them since most
classical separation processes use the difference in sorne physical property as the driving
force for separation (Jacques et al., 1981). However, enantiomers have different chemical
properties when reacting with other chiral molecules. This is of great importance
whenever molecular interactions involve natural molecules which are in a large
proportion chiral (Jones, 1997). Thalidomide is a famous example of a molecule for
which one enantiomer was a powerful drug whereas the other has been shown to induce
serious birth defects. Less dramatically, the drugs (+)-butaclamol and (S)-octoclothepin
are 100 and 36 times more potent than their respective enantiomers (Witiak et al., 1985).
Isolating them could possibly permit a reduction in the amount required for treatment and
consequently in the undesirable side-effects.
9
Page 34
CHAPTER 2: BACKGROUND INFORMATION AND LITERATURE SURVEY
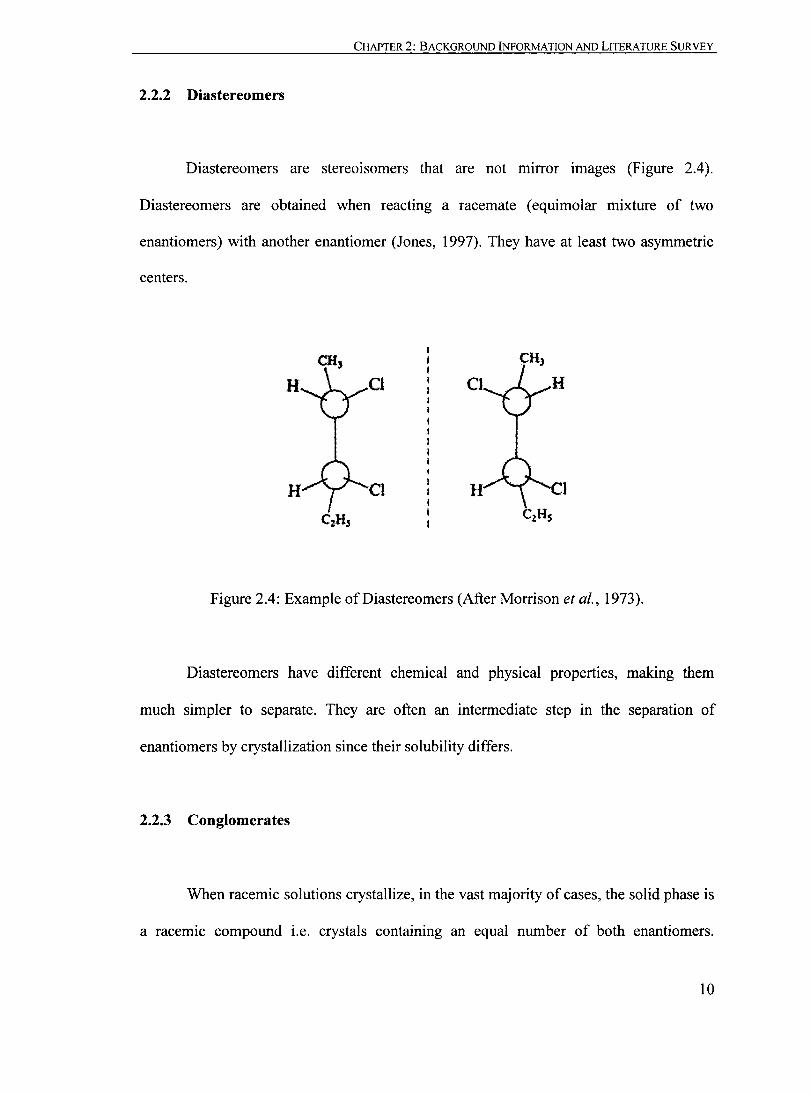
2.2.2 Diastereomers
Diastereomers are stereoisomers that are not mirror images (Figure 2.4).
Diastereomers are obtained when reacting a racemate (equimolar mixture of two
enantiomers) with another enantiomer (Jones, 1997). They have at least two asymmetric
centers.
H CI Cl
CI H
Figure 2.4: Example of Diastereomers (After Morrison et al., 1973).
Diastereomers have different chemical and physical properties, making them
much simpler to separate. They are often an intermediate step in the separation of
enantiomers by crystallization since their solubility differs.
2.2.3 Conglomerates
When racemic solutions crystallize, in the vast majority of cases, the solid phase is
a racemic compound i.e. crystals containing an equal number of both enantiomers.
10
Page 35
CHAPTER 2: BACKGROUND INFORMATION AND LiTERATURE SURVEY
However, in 10-15% of the cases, the solid phase is a conglomerate i.e. a mechanical
mixture of crystal s, each of which is composed of only one type of enantiomer
(homochiral crystals). Jacques et al. (1981) made an exhaustive list of conglomerate
forming systems. Glutamic acid, asparagine, methadone and potassium tartrate are just a
few examples. The link between the molecular structure and the occurrence of
conglomerates is not fully understood (Ward, 2003). It appears that in the cases where
conglomerates are formed, the coexistence of two enantiomers in one crystal is less
thermodynamically stable than the presence of only one. In theory, conglomerates are
more likely to occur in the presence of significant short-range repulsive forces (Schipper,
1983).
2.3 Methods for the Separation of Enantiomers
As was mentioned in Section 2.2.1, most classical separation methods use the
difference in one or more physical properties as the driving force for the separation and
are therefore not suitable for enantiomers. In order to separate enantiomers, the separation
process must be able to distinguish between chiral molecules. The main methods
available - in addition to crystallization, which is discussed extensively in Sections 2.4
and 2.5 below - are chromatography and stereosynthesis.
2.3.1 Chromatography
Different types of chromatographie separation processes are used for the
resolution of enantiomers. High performance liquid chromatography (HPLC), gas-liquid
Il
Page 36
CHAPTER 2: BACKGROUND INFORMATION AND LITERATURE SURVEY
chromatography and thin-layer chromatography have aIl proven successful in sorne
applications (Ahuja, 1997). In general, the process comprises one mobile phase (carrying
the enantiomers) and one stationary phase. The stationary phase can be chiral and the
separation is direct (Ahuja, 1997). Otherwise, the enantiomers require a derivatization to
become diastereomers. In both cases, it is the difference in the enatiomer-stationary phase
interaction (i.e. the difference in retenti on times) that is the driving force for the
separation. The enantiomer-stationary phase interaction is a partial bond (complex) and
not a covalent chemical bond (Jones, 1997). A stronger bond translates into a longer
retention time.
Separation methods using chromatography have small to medium scale outputs.
Recently, larger-scale HPLC methods have been developed (Ahuja, 1997a). Research is
actively ongoing, both in terms of applications (Brassat et al., 1986 and Brückner et al.,
1995) and in process development (Lee et al, 1992 and Hyun et al., 2003).
2.3.2 Stereosynthesis
Stereosynthesis is not truly a separation method but rather a synthetic way of
obtaining pure or optically active enantiomers. The strategy is to synthesize only one
enantiomer and therefore avoid the need for the resolution of a pair of enantiomers.
It is obvious that stereosynthesis is very molecule-specifie and there exist no
general scheme for the stereo specifie synthesis of enantiomers. However, stereosynthesis
generally makes use of chiral catalysts (Sheldon, 1993) or enzymatic catalysts (Coffen,
1997).
12
Page 37
CHAPTER 2: BACKGROUND INFORMATION AND LrTERATURE SURVEY
Stereosynthesis is used mainly in the pharmaceutical industry because of the high
value of the product and the possibility to offset the high development and operation costs
of such processes.
2.3.3 Other Separation Methods
Chromatography and stereosynthesis have been described as methods to obtain
pure enantiomers. They are the most widely used processes along with crystallization.
However, several other separation methods exist. In general the se methods are very
molecule-specifie or limited to a very small number of applications. Two methods are of
interest to the present work.
Collet et al. (1980) described the asymmetric destruction of one enantiomer by a
biological or chemical process as a viable separation method. In both cases, the separation
involved diastereomeric interaction.
The Noguchi Institute (1970) presented a selective dissolution method for the
isolation of enantiomers. Racemic crystals were dissolved in an optically active solution.
They showed that one enantiomer preferentially dissolved while the other remained in its
crystalline form.
2.4 The Crystallization Process
Crystallization is a relatively inexpensive separation process compared to the
methods described above. The driving force for separation is the difference in solubility
of the solutes to be separated whereas the driving force for crystallization is
13
Page 38
CHAPTER 2: BACKGROUND INFORMATION AND LITERATURE SURVEY
supersaturation. Supersaturation is typically created by cooling, evaporation or addition of
a non-solvent (Mullin, 1993). Crystallization can be used to separate diastereomers since
their solubility is different. For the special case of enantiomers forming conglomerates, a
modified crystallization scheme based on non-equilibrium conditions can be used (Collet
et al., 1981). The major processes involved in crystallization and the governing equations
are discussed below. The specific process for the separation of conglomerates is presented
in Section 2.5.2.
2.4.1 Definitions
There exist several ways of expressing concentration and solubility. In the present
work, concentrations and solubilities are expressed in units of grams or moles of solute
per total volume of solution (gL-1 or moIL-1). Supersaturation is expressed as the ratio of
the concentration of a solution over the solubility of the solute under the existing
conditions (s = c/c *) and thus it is dimensionless.
2.4.2 Nucleation
The formation of nuclei is the first step in the crystallization process. Nucleation
can be spontaneous (homogeneous), induced by foreign particles (heterogeneous) in the
system or induced by other crystals present in the system. Mullin (1993) classifies
homogeneous and heterogeneous nucleation as primary nucleation. Nucleation induced
by other crystals is called secondary nucleation.
14
Page 39
CHAPTER 2: BACKGROUND INFORMATION AND LITERATURE SURVEY
The mechanisms involved in the different types of nucleation are not fully
understood. The classical theory of nucleation developed by Gibbs, Volmer, Becker and
Doring models relatively weIl homogeneous nucleation (Mullin, 1993). The theory states
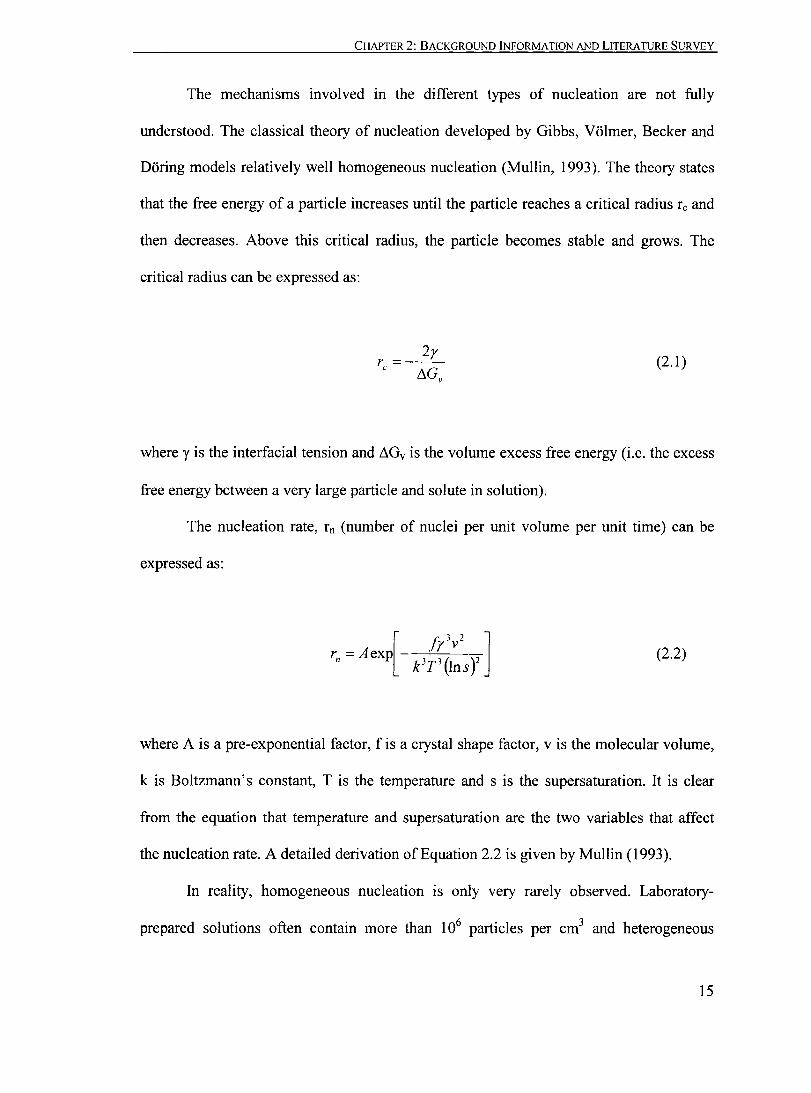
that the free energy of a particle increases until the particle reaches a critical radius rc and
then decreases. Above this critical radius, the particle becomes stable and grows. The
critical radius can be expressed as:
2r r =---c /),,0
v
(2.l)
where y is the interfacial tension and /)"Gv is the volume excess free energy (i.e. the excess
free energy between a very large particle and solute in solution).
The nucleation rate, rn (number of nuclei per unit volume per unit time) can be
expressed as:
(2.2)
where A is a pre-exponential factor, fis a crystal shape factor, v is the molecular volume,
k is Boltzmann's constant, T is the temperature and s is the supersaturation. It is clear
from the equation that temperature and supersaturation are the two variables that affect
the nucleation rate. A detailed derivation of Equation 2.2 is given by Mullin (1993).
In reality, homogeneous nucleation is only very rarely observed. Laboratory-
prepared solutions often contain more than 106 particles per cm3 and heterogeneous
15
Page 40
CHAPTER 2: BACKGROUND INFORMATION AND LITERATURE SURVEY
nucleation cannot be neglected (Mullin, 1993). The effects of process variables (such as
mixing) are also difficult to predict and fundamental principles do not give good results
(Nienow et al., 1978). Heterogeneous nucleation strongly depends on the particle and
solute involved. General rules are not easily drawn. It has been shown that particles in the
range 0.1-1 /-lm are the most active (Mullin, 1993). Secondary nucleation can be induced
by crystals present in solution or by seeds intentionally added to the system. The presence
of the se crystals increases the nucleation rate by creating small crystals and nuclei
through breakage, crystal-crystal or crystal-agitator collisions (Toyokura et al., 1976 and
Kuboi et al., 1984).
It is difficult to take into account aIl of the nucleation types and it is also difficult
to segregate them for study. Mahajan et al. (1991) have found that during the
crystallization of ASN, heterogeneous nucleation seems to dominate the early stages. It is
then followed by secondary nucleation when more crystals are present in solution. On a
more general observation Mahajan et al. (1994) have shown that homogeneous nucleation
is more important at high supersaturations whereas heterogeneous nucleation is larger at
lower supersaturations during the crystallization of ASN.
Researchers have found that empirical equations of the type shown below give the
best results:
(2.3)
16
Page 41
CHAPTER 2: BACKGROUND INFORMATION AND LITERATURE SURVEY
where kn is a rate constant and m is an apparent order. The apparent order has no physical
significance (Mullin, 1993). As for the theoretical model, supersaturation and temperature
(through kn) are the important variables, both increasing the nucleation rate.
2.4.3 Growth
Growth of the crystals occurs once nuclei are present in the crystallizing solution.
Several theories have been proposed to explain the mechanisms involved in growth.
Surface energy theories claim that the shape of the crystal and its growth determined by
minimizing the surface energy. These theories are not used very much anymore.
Diffusion theories relate the crystal growth to a diffusion mass transfer phenomenon. The
continuous addition of solute molecules to the surface of the crystal is dependent on the
solute concentration gradient in the system. Adsorption-layer theories de scribe growth as
a layer-by-layer surface adsorption of solute molecules. A complete analysis of the
different theories is beyond the scope of this work. The reader is referred to Mullin (1993)
for a more complete review.
The growth rate of a crystal can be expressed as a linear growth rate (in units of
length per time). Typical equations for the linear growth rate (rg) are given below:
r = dL = k sn g dt g
(2.4)
r = dL = k !:lC n
g dt g (2.5)
17
Page 42
CHAPTER 2: BACKGROUND INFORMATION AND LITERATURE SURVEY
where kg is the growth rate constant, s is the supersaturation, n is the apparent order of the
process, .1C is the excess concentration (the difference between the actual concentration
and the solubility), Lis a characteristic dimension of the crystal and t is time.
The important variables are supersaturation and temperature through the
Arrhenius temperature-dependence ofkg:
k =AexP(-~J g RT (2.6)
A higher supersaturation will therefore increase the growth rate. Similarly, a
higher temperature will increase the value of kg and therefore increase the growth rate.
However, the importance of the effect of temperature depends greatly on the activation
energy of the process (Eg). Orella (1990) showed that for the salting-out semi-batch
crystallization of L-ASN, the effect of temperature was lower than the experimental
variation. Campbell (2005) obtained similar results for batch cooling crystallization of
glutamic acid.
Mahajan et al. (1991) studied the crystallization ofL-ASN by salting out with the
addition of alcohols in aqueous solutions. Growth rates of 0.2 to 2 ~mmin-l were
observed. Similar results were obtained for batch crystallizers and single-crystal
measurements. Mahajan et al. (1994) compared the growth rates for L-ASN obtained by
different methods of crystallization (cooling and salting out) and showed that the rate
constants were comparable. Mahajan et al. (1993) showed that during the crystallization
of L-ASN, nucleation was more important than growth under conditions of high
18
Page 43
CHAPTER 2: BACKGROUND INFORMATION AND LITERATURE SURVEY
supersaturation. It was also observed that the growth of L-ASN crystals was not size
dependent.
The effect of impurities and additives on growth is very specifie to the system
being crystallized. Impurities and additives have been shown to increase or decrease the
growth kinetics (Addadi et al., 1982 and Lahav et al., 1982). Orella (1990) studied
extensively the effect of a1cohols on the solubility and growth rate of different ami no
acids. The solubility was significantly reduced, proportionally to the amount of alcohol in
solution. It was also observed that a1cohols such as I-propanol and 2-propanol decreased
the growth rate of alanine dramatically and to a lesser extent, also reduced the growth
kinetics of L-ASN. Impurities and additives can also selectively modify the growth rates
of certain faces of a crystal (Addadi et al., 1986). More examples are listed by Mullin
(1993).
2.4.4 Other Processes
Other phenomena can occur during the crystallization process. Agglomeration of
crystals can happen when conditions of high crystal magma density exist. Breakage of
larger crystals can also occur due to collisions between crystals or with the stirrer or walls
of a crystallizer (Mullin, 1993). Both phenomena will modify the crystal population by
changing the number and size of particles outside of the context of nucleation and growth
(Tavare et al. 1980 and McCoy, 2002). These phenomena must be taken into account in
the population balance equations when they are significant for a particular system.
19
Page 44
CHAPTER 2: BACKGROUND INFORMATION AND LITERATURE SURVEY
2.4.5 Approaches for Modeling
Batch crystallizers can be modeled in a number of different ways depending on
the data available and the information required. Mass, energy and population balances are
commonly used. Several methods have been developed for the determination of
nucleation and growth kinetics. Most of them use the population balance partial
differential equation of Randolph and Larson (1964) in combination with ordinary
differential equations for mass balances and algebraic equations for nucleation and
growth rates. One form of the population balance equation for a batch system is presented
below:
an a(rgn) -+ =0 at dl
(2.7)
where n is the crystal number density (number of crystal per size interval per volume), t is
time, and dL is a crystal size interval (Mersmann et al., 2002).
Tavare et al. (1986) introduced a method for the simultaneous determination of
nuc1eation and growth parameters kn, kg, n and m (see Sections 2.4.2 and 2.4.3) using
particle size distribution and supersaturation data. However Farrell et al. (1994) pointed
out some inaccuracies in the results due to the difficulty in taking into account small
crystals in the size distribution data. Aoun et al. (1999) presented an improvement in the
modeling of the batch crystallizer by minimizing the error due to differentiating
experimental data points.
20
Page 45
CHAPTER 2: BACKGROUND INFORMATION AND LITERATURE SUR VEY
In sorne specifie cases, agglomeration, breakage, size-dependent growth affect
significantly the crystallizing system. Chianese et al. (1993) and Yokota et al. (1999)
presented ways to incorporate these phenomena in the modeling equations.
Garside et al. (1982) introduced a rapid way to evaluate the growth kinetics of a
crystallizing system using only the initial derivatives of the desupersaturation curves.
However, the results obtained were only valid for systems in which nucleation was
negligible and where desupersaturation was due to growth only.
Methods to solve the system of equations have also been widely investigated. Liu
et al. (2004) and Quintana-Hemândez et al. (2003) reviewed selected numerical methods
and the use of different boundary and initial conditions.
2.5 Separation of Enantiomers by Crystallization
A number of separation processes that can be used to isolate enantiomers have
been described in Section 2.3. The crystallization process has been described in Section
2.4.1. It is an attractive separation method in terms of cost and simplicity but it cannot be
used to directly separate enantiomers in most cases. In the following sections, two
approaches to the separation of enantiomers by crystallization are presented. In the first
method (Section 2.5.1), the enantiomers are transformed into diastereomers prior to the
separation. The second method (Section 2.5.2) is applicable only to the specifie case of
conglomerate-forming enantiomeric systems.
21
Page 46
CHAPTER 2: BACKGROUND INFORMATION AND LITERATURE SURVEY
2.5.1 Transformation into Diastereomers
Since enantiomers have the same physical properties and therefore the same
solubility, they will crystallize under the same conditions. As opposed to the separation of
two solutes in solution, enantiomers cannot be separated by classical crystallization.
If enantiomers are allowed to chemically react with a chiral component, the
resulting components become diastereomers. They therefore have different physical
properties such as solubility and can, in principle be separated by crystallization.
In reality, a number of conditions must be satisfied in order for crystallization to
be a viable alternative for the separation of diastereomers (Collet, 1999). Conditions can
be for example the existence of a crystallisable system or a sufficient difference in the
solubility of the diastereomers. An extensive review of the conditions required is
presented in the work of Jacques et al. (1981).
Figure 2.5 presents the process of the separation of enantiomers by crystallization
through the transformation into diastereomers:
.. (R)-A and .. (S)-A
Resolving Reversion to ~ agent enantiomer
recovery
~ r-
Diastereomer .. Diastereomer formation r- separation
Resolving Reversion to
~ r- agent JI. enantiomer
recovery ~ Resolving agent
Figure 2.5: Enantiomer Resolution through Diastereomer Formation (after Schroer et al., 2001)
.. .. A (R)-
.. (Sr-A
22
Page 47
CHAPTER 2: BACKGROUND INFORMATION AND LITERATURE SURVEY
The enantiomers R-A and S-A are fed to the system and mixed with a resolving
agent in an appropriate solvent. The enantiomers do not necessarily have to be fed in a
racemate. The nature of the resolving agent and solvent depends on the enantiomers to be
separated; however, the resolving agent must be chiral in order for the chemical reaction
to yield diastereomers (Collet, 1999). Under the appropriate conditions, the enantiomers
are converted to diastereomers and sent to a crystallizer for separation. The type of
crystallizer is also variable. Cooling crystallizers and evaporative crystallizers are
common (Mullin, 1993). The separation is carried on as a classical separation by
crystallization: The diastereomer having the lowest solubility is crystallized first and
withdrawn from the solution. The other diastereomer can also be crystallized depending
on the further processing required. Finally, the diastereomers are reacted back to the
original enantiomers and the resolving agent is recovered and recycled if possible.
The separation of enantiomers through the conversion into diastereomers has a
large number of industrial, commercial and laboratory scale applications. For example,
Shiraiwa et al. (2002) demonstrated it was possible to react the enantiomers of 2-
benzoylamino-2-benzyl-3-hydroxypropanoic acid with the optically active resolving
agent cinchonidine to create diastereomeric salts, with the S-diastereomer being less
soluble than the R-diastereomer. The diastereomers were separated by crystallization and
transformed back into the original enantiomers by treatment with hydrochloric acid.
Similarly, Brienne et al. (1983) describe the separation of the enantiomers of sec
phenethyl alcohol through the classical crystallization of the hydrogen phthalate brucine
salts. They noted that this type of separation process is often difficult and costly to scale
up. In addition, the enantiomer's purity achieved is frequently insufficient and may
require further purification.
23
Page 48
CHAPTER 2: BACKGROUND INFORMATION AND LITERATURE SURVEY
Berlingozzi et al. (1958), Soos et al. (1974) and Fogassy et al. (1976) developed
processes for the separation of the enantiomers of ASN by transforming its enantiomers
into diastereomers.
In the Berlingozzi et al. (1958) process, a mixture of L-ASN and D-ASN was tirst
chemically treated to yield a mixture of L- and D-carbobenzoxyasparagine. The mixture
was then reacted with an optically active base, cinchonine (the resolving agent), to
produce cinchonine salt diastereomers. The diastereomers were separated by
crystallization and reverted back to separated L- and D- carbobenzoxyasparagine. The
separate compounds were further treated to recover the original L- and D-ASN.
Soos et al. (1974) and Fogassy et al. (1976) reacted a mixture of L- and D-ASN
with o,o-dibenzoyltartaric acid to produce diastereomer salts. The salts were separated by
crystallization and then refluxed with methanol to revert to L- and D-ASN respectively.
Purities of78 and 83% were obtained.
Collet (1995 and 1998) lists a large number of examples of processes for the
separation of enantiomers through their transformation into diastereomers. The author
daims that most enantiomers can be transformed into diastereomers in a more or less
direct way making this separation method very attractive. However sorne problems
remain. For example, even though this type of separation is generally economical
compared to other separation processes such as chromatography or compared to
stereosynthesis, the costs of development and operation for such processes are al ways
higher than for a simpler one-stage crystallization process. During development and
operation, the additional steps of transforming the enantiomers into diastereomers and
reverting to the enantiomers can be technically challenging or economically not feasible.
The complete removal of the resolving agent from the product can also be problematic
24
Page 49
CHAPTER 2: BACKGROUND INFORMATION AND LrTERATURE SURVEY
(Jacques et al., 1981). Researchers have tried to speed up and reduce the development
costs by standardizing design strategies and making development more systematic (Wilen
et al., 1977). It is clear, however, that a separation method using crystallization but not
requiring any prior chemical transformation would generally be preferred.
2.5.2 The Crystallization of Conglomerates
2.5.2.1 Principles
As seen in Section 2.2.3, conglomerate-forming enantiomeric systems represent
only lOto 15 % of aIl enantiomeric systems. The remaining systems form mostly racemic
mixtures in the solid phase (Jacques et al., 1981). However, conglomerates still represent
several hundreds of systems of enantiomers (Collet, 1995). It has also been shown that a
very large number of enantiomers can be derivatized in order to become conglomerate
forming systems (Collet, 1995 and Coquerel et al., 1990). It therefore appears that the
separation of enantiomers by the crystallization of conglomerates should not be limited to
a restricted group of enantiomeric systems.
Since conglomerates crystallize in separate crystalline phases, it is possible to
separate the two enantiomers through crystallization without any chemical reaction.
Several strategies are described below.
25
Page 50
CHAPTER 2: BACKGROUND INFORMATION AND LITERATURE SURVEY
a) Triage or Hand-Picking
Discovered by Pasteur (1848), this was the first method used to separate the
enantiomers of sodium ammonium tartrate. It consists in crystallizing the enantiomers and
mechanically separating them by hand, based on their shape. Since the crystals have the
same shape but are mirror images of each other, the two enantiomers can be visually
identified and separated (Collet et al., 1980). It is c1ear that this pro cess is very tedious
and is of little use for large-scale applications. However it is still used today for the
isolation of laboratory-scale amounts of pure enantiomer for use as seeds for ex ample
(Jacques et al., 1981).
b) Simultaneous or Localized Crystallization
Since enantiomers that form conglomerates do not crystallize in the same
crystalline phase, the introduction of crystals of only one enantiomer in a supersaturated
solution will promote the crystallization of that enantiomer only (Jacques et al., 1981).
This property led to the development of several separation processes.
In localized crystallization, crystals of one enantiomer are introduced in one part
of the crystallizer and crystals of the other enantiomer are introduced in the crystallizer,
away from the first crystals. The solution is not agitated to avoid movement of the
crystals and the supersaturation is kept relatively low to avoid excessive spontaneous
nucleation. The crystals will grow but will remain pure enantiomers effectively separating
the enantiomers initially present in excess of the saturation of the solution (Jungfleish,
1882).
26
Page 51
CHAPTER 2: BACKGROUND INFORMATION AND LITERATURE SURVEY
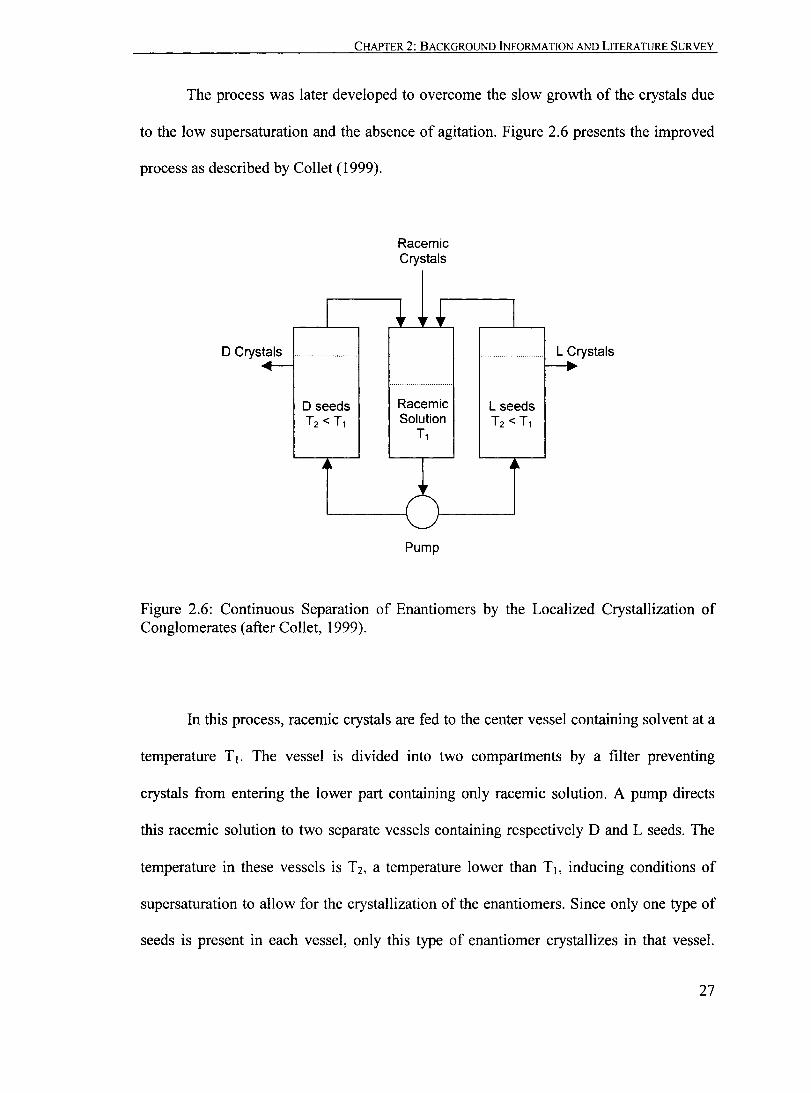
The process was later developed to overcome the slow growth of the crystals due
to the low supersaturation and the absence of agitation. Figure 2.6 presents the improved
process as described by Collet (1999).
D Crystals
o seeds T2 < Tl
Racemic Crystals
Racemic Solution
Tl
Pump
L seeds T2 < Tl
L Crystals
Figure 2.6: Continuous Separation of Enantiomers by the Localized Crystallization of Conglomerates (after Collet, 1999).
In this process, racemic crystals are fed to the center vessel containing solvent at a
temperature TI. The vessel is divided into two compartments by a filter preventing
crystals from entering the lower part containing only racemic solution. A pump directs
this racemic solution to two separate vessels containing respectively D and L seeds. The
temperature in the se vessels is T 2, a temperature lower than TI, inducing conditions of
supersaturation to allow for the crystallization of the enantiomers. Since only one type of
seeds is present in each vessel, only this type of enantiomer crystallizes in that vessel.
27
Page 52
CHAPTER 2: BACKGROUND INFORMATION AND LITERATURE SURVEY
Pure L and D crystals are removed continuously and the solutions are returned to the
central vessel and fed with racemic crystals to make up for the crystals removed from the
system. It must be noted that both Land D enantiomers crystallize simultaneously but in
different locations.
Similar processes have been used and are still in use in the industry, for example,
the Haarmann-Reimer process for the production of (-)-menthol (Hopp et al., 1993) and
the Merck process for the manufacture of an intermediate of L-a-methyldopa (Collins et
al., 1997). More industrial applications are listed by Collet et al. (1999).
Watanabe and Noyori (1969) described another separation method involving the
simultaneous crystallization of both enantiomers. In this process, one enantiomer is
seeded with large seeds that will grow into large crystals. In the meantime, the other
enantiomer is not seeded or seeded with small seeds and yields small crystals. The two
enantiomers can then be separated by sieving the crystals. They were successful in
separating the enantiomers of acetyl-glutamic acid.
Finally, Addadi et al. (1986) showed that it was possible to change the crystal
habit or the growth pattern of one enantiomer by using additives. The formation of very
distinct morphologies facilitated later mechanical separation of the two enantiomers. For
example, S-Lysine contaminated with S-Glutamic Acid crystallized as powders while the
growth habit ofR-Lysine was not affected and the enantiomer crystallized as plates.
c) Crystallization of One Enantiomer and Separation by Entrainment
Since enantiomers have the same physical properties, they will crystallize under
the same conditions even though they form conglomerates. However, it is possible to
28
Page 53
CHAPTER 2: BACKGROUND INFORMATION AND LITERA TURE SURVEY
create a difference in the crystallization rates of the enantiomers in order to have them
crystallize at different times. Processes using this phenomenon make use of non
equilibrium conditions for the separation of the enantiomers (Jacques et al., 1981).
The tirst approach is to inhibit the crystallization of one enantiomer while the
other is allowed to crystallize naturally.
Addadi et al. (1982) and Lahav et al. (1982) demonstrated that it was possible to
inhibit the growth of L-ASN by adding the L enantiomer of different amino acids such as
glutamic acid, aspartic acid, serine or glycine. The authors explained the phenomenon by
contirming that the additives absorbed on the surface of the growing crystals of L-ASN,
creating a barrier for other L-ASN molecule to bond to the surface. However the yields
were relatively low (13-48%) and crystallization time were long (approximately 48h).
This was due to the fact that the solutions could not be stirred in order to have good
separation, making the process inappropriate for commercial applications. Doki et al.
(2004) improved the process' yield by adding a heating phase to dissolve small crystals of
the unwanted enantiomer. This made the pro cess more robust and increased the yield
greatly by allowing mixing.
Zbaida et al. (1987) used chiral polymers to inhibit the growth of one enantiomer
and allow the other enantiomer to crystallize naturally. They reported good results for the
separation of the enantiomers of glutamic acid, threonine, asparagine monohydrate and
other systems. Yields were better than those reported by Addadi et al. (1982) using low
molecular weight additives.
The second approach to the separation of enantiomers using non-equilibrium
conditions is to accelerate the crystallization of one enantiomer while the other is kept in
solution (Collet et al., 1980). In this process, seeds of one enantiomer are added to
29
Page 54
CHAPTER 2: BACKGROUND INFORMATION AND LITERATURE SURVEY
promote the crystallization of the other enantiomer. This process is called resolution by
entrainment (Collet et al., 1981) It is important to note that the unseeded enantiomer's
crystallization is not inhibited. If the system were left to reach equilibrium, both
enantiomers would crystallize until the solution became saturated.
Harada (1965) seeded supersaturated aqueous solutions of racemic ASN in the
presence of 25 wt% ammonium formate. The purity of the crystals were low and required
recrystallization to achieve 93-97% purity.
Brienne et al. (1983) were successful in isolating the enantiomers of sec-phenethyl
alcohol by derivatizing them into their 3,5-dinitrobenzoate. The 3,5-dinitrobenzoate of
sec-phenethyl alcohol was shown to be a conglomerate. The enantiomers were separated
by promoting the crystallization of the LorD enantiomer by seeding the solution with L
or D enantiomer seeds respectively. This method seems to be an interesting alternative to
the other processes used to obtain optically active sec-phenethyl alcohol (separation of
diastereomers, stereosynthesis, synthesis from chiral mandelic acid).
Similarly, Coquerel et al. (1990) developed a method for the resolution of (±)-n
acylnorfenfluramine by the crystallization of conglomerates obtained through amidation.
Optical purities of 85-90% were achieved.
Shiraiwa et al. (2002) presented a process for the resolution of (±)-2-
benzoylamino-2-benzyl-3-hydroxypropanoic acid by entrainment. (±)-2-benzoylamino-2-
benzyl-3-hydroxypropanoic acid had previously been resolved through transformation
into diastereomers with cinchonidine. The authors demonstrated that (±)-2-benzoylamino-
2-benzyl-3-hydroxypropanoic acid was a conglomerate at room temperature and the
crystallization of one enantiomer could be favored by seeding with that same enantiomer.
30
Page 55
CHAPTER 2: BACKGROUND INFORMATION AND LITERATURE SURVEY
Finally, Collet (1995) described the Roussel-Uclaf process for the separation of an
interrnediate in the production of chloramphenicol. In this process, both enantiomers were
present in a saturated solution and were altematively seeded. Batch sizes of 500 kg and an
annual production of 35-40 tons were achieved.
As for the Roussel-Uclaf process, most separations by entrainment can be
improved in terrns of productivity and yield by using a cyclic process (Jacques et al.,
1981). In a cyclic process, a supersaturated solution is seeded with one enantiomer which
crystallizes faster than the unseeded enantiomer. The seeded enantiomer is allowed to
crystallize for a specific amount of time (maximizing the amount crystallized while
minimizing the amount of crystals of the unseeded enantiomer). The crystals are then
removed and replaced with racemic crystals which are dissolved to pro duce a
supersaturated solution. The other enantiomer is then seeded, crystallizes and the crystals
are removed. Racemic crystals are again dissolved. A large number of cycles can be used
to create a semi continuous separation process.
Several issues can arise when developing or operating a separation process based
on entrainment. Since the separation is based on the difference in crystallization rates, it is
important that the system be free of impurities or foreign bodies that could influence the
kinetics of crystallization. Balancing the fast crystallization of one enantiomer while
keeping the other enantiomer in a metastable or pseudo-metastable state can be
challenging. Special attention must be given to process design.
31
Page 56
CHAPTER 2: BACKGROUND INFORMATION AND LITERATURE SURVEY
2.5.2.2 Process Design for Separation by Entrainment
a) Graphical Representation
A temary phase diagram is conveniently used to illustrate the composition of a
three-component solution. A short description of the basic use of a temary diagram is
presented in Appendix 3. In the context of the separation of enantiomers by
crystallization, the three components are the two solutes (the two enantiomers) and the
solvent. In the specific case of the present work, the solutes are L-ASN and D-ASN, and
the solvent is water (Figure 2.7).
The apices of the temary diagram normally represent the pure components. In
Figure 2.7, L represents L-ASN, D represents D-ASN and W represents water. For the
majority of enantiomeric systems, the solute represents a minor fraction of the solution in
terms of mol and the diagram is therefore truncated to represent the small area of interest.
This is shown on Figure 2.7 when the scales on the axes are examined. The mol fraction
ofwater varies from 0.95 to 1 and the mol fractions ofL-ASN and D-ASN vary from 0 to
0.05. In the cases were the diagram is truncated, the apices for the solutes do not represent
the actual pure component.
Each point on the diagram represents one composition. For example, point A
represent a solution with a composition of 0.021 L-ASN, 0.021 D-ASN and 0.958 Water
in terms of mol fractions. As a general rule, when a composition moves away from one
apex, the mol fraction of that component decreases. For example, when the composition
moves from composition A to composition B, (away from L), the mol fraction of L-ASN
32
Page 57
CHAPTER 2: BACKGROUND INFORMATION AND LITERATURE SURVEY
decreases from 0.021 to 0.017. When a point is equidistant from L and D, it is a racemate.
For example, points A, Gand H are racemates.
D-ASN (mol fraction)
Figure 2.7: Separation of the Enantiomers of ASN by Entrainment (T = 298 K, CL,O = 9.0 X 10⁻¹ moIL- I
, CD,O = 9.0 X 10⁻¹ moIL-I, 18 g L-ASN seeds L- I
)
More generally, when a point is below the solubility curve (dotted curve at the top
of the diagram), the system is a supersaturated solution. Crystallization can take place in
such a system. If allowed to reach equilibrium, a supersaturated solution will crystallize
until its composition reaches the solubility curve. Above the solubility curve, the solution
is unsaturated
33
Page 58
CHAPTER 2: BACKGROUND INFORMATION AND LITERATURE SURVEY
The process of separation of enantiomers by entrainment is clearly represented
graphically in a temary diagram (Figure 2.7). The solution to be separated is initially
racemic (point A). The solution is seeded with L-ASN which promotes the crystallization
of L-ASN while keeping D-ASN in solution. As L-ASN crystallizes, the composition
moves to point B, then C, then E, away from L. If the crystals were to be collected, they
would have a composition of close to 100% L-ASN since the shift from A to B, C, and E
is almost a straight line away from the real apex L (not visible on the truncated diagram).
Between points E and F, a shift occurs, and D-ASN starts crystallizing. The composition
moves away from the apex D indicating D-ASN is crystallizing. The composition
eventually retums to a racemate of composition H. If allowed to reach equilibrium, the
composition would reach the solubility curve above H.
When crystallization starts at point A, the direction in which the composition
changes depends on the relative crystallization rates of Land D-ASN. If both enantiomers
crystallize at the same natural rate, the composition will move away from Land D
equally. If the crystallization rate of L-ASN is faster, the composition will move away
from L faster than from D.
b) Solubility Considerations
In order to be successfully resolved by entrainment, a system has to present certain
characteristics. The most important is that it be a conglomerate under the conditions of
crystallization. This aspect was discussed earlier (see Sections 2.4.2.1 and 2.2.3). The
second important aspect is related to the phase diagram of the system. The solubility ratio
a determines the conditions under which resolution by entrainment can be achieved and it
34
Page 59
CHAPTER 2: BACKGROUND INFORMATION AND LITERATURE SURVEY
is the ratio of the solubility of the racemlC enantiomers over the solubility of one
enantiomer:
(2.8)
a _CDL f)- (2.9)
Cf)
and,
aL =af) (2.10)
where CL, CD and CDL represent the solubility of the L- enantiomer, the D- enantiomer and
the racemate respectively.
Figure 2.8 presents the situation when a is equal to 2 ("ideal" solution). The
solubility curve of the enantiomer mixtures at different composition is represented by the
curve ABC. Point Bis the solubility of the racemic mixture (50% L-ASN, 50% D-ASN).
ABE represents the equivalent solubility curve of enantiomer D in a solvent containing L
and S. The segment BE is an extension of the solubility curve segment AB. A solution
having a composition represented by point F is supersaturated with respect to D. When
this solution is seeded with D- seeds, the D-enantiomer will crystallize and its
composition will move away from apex D, up to point G. Past point G, the solution is no
longer saturated in terms of D and will not crystallize further. The separation is therefore
limited by the line ABE which in tum is determined by the solubility curve ABC. The
same remarks hold for the L enantiomer.
35
Page 60
CHAPTER 2: BACKGROUND INFORMATION AND LITERATURE SURVEY
s
L E o
Figure 2.8: Resolution by Entrainment with a = 2.0
s
L o
Figure 2.9: Resolution by Entrainment with a = 2.0
36
Page 61
CHAPTER 2: BACKGROUND INFORMATION AND LITERATURE SURVEY
Overall the area of the phase diagram where resolution by entrainment may occur
is limited to area BEH (Figure 2.9) because in this region, the solution is supersaturated in
terms of both L and D.
When a is larger than 2, the solubility of the racemate is larger than that of the
enantiomers and B is lower on the diagram changing the shape of the solubility curve
(Figure 2.10). A solution with composition F can be tumed into a solution with
composition G by crystallizing D. It must be noted that the extent of the crystallization is
smaller than in Figure 2.8 due to the shape of the solubility curves ABC and ABE.
Resolution by entrainment is limited to area BEH (Figure 2.11). Finally, when a is
smaller than 2, B is higher on the diagram (Figure 2.12), the crystallization of D can be
carried on further because of the shape of the solubility curves ABC and ABE.
s
L o Figure 2.10: Resolution by Entrainment with a > 2.0
37
Page 62
CHAPTER 2: BACKGROUND INFORMATION AND LITERATURE SURVEY
s
L E H o
Figure 2.11: Resolution by Entrainment with a > 2.0
s
L o Figure 2.12: Resolution by Entrainment with a < 2.0
38
Page 63
CHAPTER 2: BACKGROUND INFORMATION AND LITERATURE SURVEY
The area on the diagram (Figure 2.13) where resolution by entrainment can occur
is delimited by points BELDH. In reality, for most systems with a below 2, the solubility
curves ABEL and CBHD are curves with segments EL and HD slightly away from the
lines SL and SD respectively (Collet et al., 1980).
s
L
........ _--1--/
/ /
/ /
/
/ /
Figure 2.13: Resolution by Entrainment with a < 2.0
D
However, the area available for resolution by entrainment is still significantly
larger than area BEH on Figure 2.9 and Figure 2.11.
It is c1ear that a solubility ratio larger than 2 can significantly limit the process
operating space for resolution by entrainment whereas a solubility ratio below 2
significantly enlarges that space.
39
Page 64
ID '5 (5 en '0 Q) > (5 en
.!a '0 -ü
CHAPTER 2: BACKGROUND INFORMATION AND LITERA TURE SURVEY
Watanabe and Noyori (1969) reported the solubility ratio of ASN to be equal to
2.02, putting it neither in a particularly favorable nor in an unfavorable position with
respect to separation by entrainment.
c) Crystallization Rates
In addition to having a system that is prone to separation by entrainment, sorne
conditions must be respected during the design of the separation process in order to obtain
the desired yield and purity. The residual supersaturation curves (Figure 2.14) are useful
to predict the behavior of a racemate during the crystallization of one enantiomer (Collet
et al., 1980).
t = 0
1A2 ...,.-------1 1--__ t = t2
O~~ HD~~ ........ .......H·D~~· HH t = 00 : :
IQDQS
Q (total solute)
Figure 2.14: Residual Supersaturation Curves (After Collet et al., 1980)
40
Page 65
CHAPTER 2: BACKGROUND INFORMATION AND LITERATURE SURVEY
Residual supersaturation curves are a plot of the dissolved solute C against the
total solute Q in a crystallizing system. For example, for solution A on Figure 2.14, at the
initial time, the amount of dissolved solute is equal to the total amount of solute which is
AO. As solute crystallizes out of solution A, the amount of dissolved solute decreases but
the total solute Q remains constant at QA (closed system). When t is equal to tl, the
concentration of the solution is reduced to Al, when t is equal to h, it is reduced to A2. If
the solution is left to equilibrate, the concentration (or dissolved solute) will reduce to the
solubility value Aoo. One can then say that after tl, the amount crystallized is equal to the
distance AOAI. One can also show that between time tl and h, the amount crystallized
corresponds to distance AIA2.
Similar data can be plotted starting with solutions B and D. It is important to
notice that the amount crystallized between the initial time and tl is larger for solution A
(AOAl) than for solution B (BOBl). Furthermore, since DO is equal to Dl, one can say
that a solution with an initial concentration of DO or lower will not have produced any
crystals after a crystallization time Oftl under these specific experimental conditions.
Amiard (1956) made the distinction between residual supersaturation and
metastable supersaturation. The residual supersaturation is defined as the supersaturation
remaining after a specific time whereas the metastable supersaturation is defined as a
state under which a solution is supersaturated but crystallization does not occur without
an initiating event (disturbing the system, for example mixing or seeding).
Since the limit of the metastable state is not easily determined (Jacques et al.,
1981), it is more convenient to use the residual supersaturation curves. If supersaturation
curves are built for both enantiomers (one seeded, one unseeded) under the specific
experimental conditions, it is possible to determine the crystallization time to obtain the
41
Page 66
CHAPTER 2: BACKGROUND INFORMATION AND LITERATURE SURVEY
desired crystallization of the seeded enantiomer and to have the unseeded enantiomer to
remain dissolved. For example, on Figure 2.14, since DO is equal to Dl, a solution with
an initial concentration of DO will remain at this concentration after a crystallization time
of t1 while a solution with an initial concentration of AO will have crystallized to reduce
its concentration down to A 1. If points DO and Dl represent the behavior of an unseeded
D- enantiomer and AO and Al represent the behavior of a seeded L- enantiomer, both in
the same solution then, it is possible to predict that after a crystallization time of t1, the
concentration of the L- enantiomer will be equal to Al while the concentration of the D
enantiomer will be equal to Dl = DO. This me ans the D- enantiomer will not have
crystaUized at aU, while the L- enantiomer will have crystaUized by an amount larger than
its initial excess compared to the D- enantiomer. The initial excess of the L- enantiomer is
equal to AO - DO, the amount of the L- enantiomer crystallized is equal to AO - Al and
the "net" amount of the L- enantiomer crystallized is therefore DO - Al.
The residual supersaturation curves are a convenient representation of the kinetic
as weU as the equilibrium forces involved in the process of resolution by entrainment.
The design of a specifie process will focus on balancing a high crystallization rate for one
enantiomer while minimizing or eliminating altogether crystaUization of the other
enantiomer.
2.6 Statement of Objectives
An extensive literature survey showed that there has been no study of separation
processes based on the crystaUization rate enhancement of one enantiomer with a
systematic account of the effect of the important variables affecting the crystallization.
42
Page 67
CHAPTER 2: BACKGROUND INFORMATION AND LITERATURE SUR VEY
The objectives of this research project will be to study the separation of two
enantiorners of the conglornerate-forrning asparagine by taking advantage of the
difference in crystallization rates induced by the addition of seeds.
Since supersaturation is the driving force for the crystallization process, the
effect of ternperature on the solubility of asparagine enantiorners will first be
verified.
The effect of the crystallization ternperature, the supersaturation, rnixing and the
addition of seeds on the crystallization rate of each enantiorner will be
exarnined.
The effect of the operating conditions on the separation process will then be
studied and verified experirnentally.
The rate constant and apparent order of the process will be deterrnined by
rnodeling.
Finally, batch and cyclic separation processes with different objectives (purity,
productivity) will be developed.
43
Page 68
CHAPTER 3: MA TERIALS AND METHODS
Chapter 3: Materials and Methods
44
Page 69
CHAPTER 3: MA TERIALS AND METHODS
3.1 Preparation of Solutions
The aqueous solutions of ASN were prepared with L(+)-Asparagine Monohydrate
99% and D(-)-Asparagine Monohydrate 99% from Acros Organics (Fisher) and distilled
and deionized water purified with a Millipore Simplicity 185 Ultrafiltration device. The
crystals of ASN were dried in a Lab-line mechanically convected oyen for 24 hours at
333 K prior to the solution preparation. Volumetrie flasks and a Mettler Toledo SB16001
balance were used. A magnetic stirrer bar and a Coming stirrer/hotplate were used when
necessary.
3.2 High Performance Liquid Chromatography Analysis
3.2.1 Calibration
Solutions of known concentrations were prepared as described in Section 3.1
above. Solutions of very low concentration were prepared by precise dilution of solutions
with higher concentration using Nichipet EX micropipets and volumetrie flasks.
Samples were syringed out of the volumetrie flasks, filtered out through 25 mm
0.2 /lm Fisherbrand membrane filters with Millipore Swinnex filter holders into HPLC 2
mL vials with screw cap and rubber septum. The samples were analyzed with an Agilent
1100 series HPLC and an Astec Chirobiotic T 250 x 4.6 mm column. The mobile phase
for the analytical method was a mixture of 50 vol% Fisher HPLC grade reagent alcohol
and 50 vol% distilled deionized and filtered water. Fisher HPLC grade reagent alcohol
was composed of 90.7 vol% ethanol, 4.2 vol% methanol and 5.1 % iso-propanol. The flow
45
Page 70
CHAPTER 3: MA TERIALS AND METHODS
rate was kept constant at 1.0 mLmin-1 with an analytical time of 15 minutes and a post-
analysis of 10 minutes. The injection volume was 20 ~L and the wavelength of the UV
detector was fixed at 210 nm.
4500 ,- ...... -- ............................... - ........................................................................................ - ............... -----.- ..................................... -...... ------------,
4000
3500
~ 3000 E -; 2500 l!! -< 2000 u ët 1500 :I:
1000
500
HPLC Area = [L-ASN] x 1990.4
R2 = 0.9975
o
O~----~------------~----~------r_----------~----~
O.OE+OO 2.0E-03 4.0E-03 6.0E-03 8.0E-03 1.0E-02 1.2E-02 1.4E-02 1.6E-02 [L-ASN), (moIL-1
)
Figure 3.1: L-ASN Calibration Curve for Agilent 1100 Series HPLC with Astec Chirobiotic T Column (1.0 mLmin- I
, 50 vol% Reagent Alcohol, 50 vol% Water)
After analyses, the column was flushed at 0.5 mLmin-1 for 42 minutes with reagent
alcohol, 42 minutes with distilled-deionized-filtered water, 42 minutes with acetonitrile
and 42 minutes with 2-propanoL It was then stored with 2-propanol between analyses_ AH
solvents were Fisher HPLC grade. A calibration curve such as Figure 3.1 was obtained
for both L- and D-ASN. The equipment was calibrated on a regular basis to ensure the
measurements were accurate. Retention times of approximately 4.7 and 5.8 minutes were
obtained for L- and D-ASN respectively (Figure 3.2).
46
Page 71
mAU
5)
<Il
20
10
·10
L-ASN
+-----dV ~
o 2 4
CHAPTER 3: MA TERIALS AND METHODS
J\ __ O-AS_N ------1
6 10 12 14 mio
Figure 3.2: Chromatogram for a Solution of Racemic ASN (4.8 x 10⁻¹ moIL-1), Agilent
1100 Series HPLC with Astec Chirobiotic T Column (l.0 mLmin- l, 50 vol% Reagent
Alcohol, 50 vol% Water)
3.2.2 Other Samples
Samples to be analyzed were diluted in order to faH within the appropriate
concentration range and filtered into 2 mL HPLC vials as described above (Section 3.2.1).
Using the calibration curve, the concentration of a sample could be determined and used
to calculate the concentration prior to dilution.
47
Page 72
CHAPTER 3: MA TERIALS AND METHODS
3.3 Solubility Experiments
A 200 mL Erlenmeyer flask was filled with an aqueous solution of the compound
to be analyzed at a high concentration (higher than the expected solubility). The flask was
then placed in a thermostatic water bath at the temperature at which the solubility was to
be determined (Figure 3.3). The water was kept at a constant temperature within 0.1 K
using a Lauda water heater/circulator. The solution was agitated with a magnetic stirrer
bar and the flask was c10sed with a rubber cap. Samples were analyzed by HPLC. It was
found that after 24 hours, no decrease in the concentration was observed i.e. aIl excess of
the compound to be analyzed had crystallized.
Water Heater/Circulator Solution
Thermostatic Bath
+Stirrer
Figure 3.3: Experimental Setup for Solubility Experiments
The solubility of L-ASN in water, D-ASN in water, L-ASN in an aqueous racemic
solution and D-ASN in an aqueous racemic solution were determined at different
temperatures.
48
Page 73
CHAPTER 3: MATE RIALS AND METHODS
3.4 Crystallization Rate Measurements and Separation Experiments
3.4.1 Tube Crystallizer Setup
Experiments for the study of the effect of crystallization temperature,
supersaturation, seeds and mixing speed on the crystallization rate of ASN and for the
separation of the enantiomers of ASN were carried out using Kimble Glass Kimax screw-
cap 10 mL (16 x 100 mm) culture tubes as crystallizers (Figure 3.4).
Two thermostatic water baths were used, a holding bath and a crystallization bath.
Solution was prepared in a volumetrie flask as described in Section 3.1 and placed in the
holding bath. The temperature of the holding bath was set in such a way that the
supersaturation of the solution was equal to 0.7 (slightly unsaturated) at this temperature.
This was done to avoid the formation of small crystals due to possible fluctuations in the
temperature. The temperature of the crystallization bath was set at the crystallization
temperature desired. This crystallization temperature was lower than the holding
temperature in order to create conditions of supersaturation.
Water Heater/Circulator
Holding Crystallization Bath Bath
Tube Agitator
Tube Rack
Temperature 0 Monitoring
Sample Tube
6
Figure 3.4: Experimental Setup for Crystallization Rate Measurement (Tube)
49
Page 74
CHAPTER 3: MA TERIALS AND METHODS
A series of tubes were fixed on a tube rack and also placed in the holding bath.
After 30-60 minutes, the tubes were filled with 10 mL of solution using a 10 mL syringe
with needle and left in the holding bath for 30-60 minutes for the temperatures to
equilibrate. Sorne tubes were filled with 10 mL of water and had a small hole in the cap to
insert a thermocouple. They were used to monitor the temperature in the tubes during
crystallization.
A Scientific Industries Vortex Genie 2 variable speed tube shaker was fitted with a
specially designed tube holder (Figure 3.5) and used to agitate tubes in an elliptical
trajectory parallel to the ground while they were submerged in the crystallization bath.
The tube holder was designed to hold one temperature monitoring tube in addition to the
crystallizer tube.
..J 1 1 1-- '-
6 .... ... ..... ~
'---' '---'
SideView
Top View
Figure 3.5: Specially Designed Tube Agitator
50
Page 75
CHAPTER 3: MATERIALS AND METHODS
The speed of mixing could not be directly measured with the holder assembly and
tubes attached. The di al settings on the Vortex Genie 2 variable speed tube shaker varied
between 0 (no mixing) and 8 (maximum mixing speed), corresponding approximately to a
range of 0 to 600 rpm. Such a setup allowed for a small crystallizer volume and a rapid
cooling of the solution (Figure 3.6). Since the crystallizing solutions were cooled very
quickly to their crystallization temperature (up to 30 seconds for the largest temperature
differences), it is assumed that the initial temperature did not significantly affect the
crystallization rate.
350 r------------·-------------------------- --------------.-----------------------,
345
340
335
330
- 325 ~ 1- 320
315
310
305
300
295+-----~--~----------------------------~--~----__ ----~ o 20 40 60 80 100
t (s) 120 140 160 180
Figure 3.6: Temperature Profile for a Tube Crystallizer (To = 343 K, T = 298 K)
3.4.2 Crystallization Rate Experiments
200
The temperature of the holding and crystallization baths were set in such a way as
to obtain the desired initial supersaturation and crystallization temperature. A sample tube
51
Page 76
CHAPTER 3: MA TERIALS AND METHODS
along with a temperature monitoring tube was rapidly removed from the saturation bath
and inserted in the tube holder. The tube agitator was turned on and the sample tube was
agitated while submerged in the saturation bath for the desired crystallization time. Time
was monitored with a digital timer.
The temperature of the crystallization bath was varied to study the effect of the
crystallization temperature on the crystallization of ASN. Since the Lauda water
heater/circulator used did not have refrigeration capabilities, it was difficult to maintain
constant temperatures below room temperature (approximately 295 K). The saturation
bath temperature was also limited to approximately 343 K in order to avoid rapid
evaporation. This limited the effective concentration of the solution to approximately 9.5
x 10-1 moIL- I• Due to the strong dependence of the solubility of ASN on temperature, a
reduction in the difference between the saturation temperature and the crystallization
temperature greatly affected the supersaturation decreasing it from a maximum of
approximately 5.1 to a maximum of 1.8 for a 20 K increase in crystallization temperature.
The initial supersaturation was also varied by changing the concentration of the
prepared solution. The saturation bath's temperature had to be varied accordingly to
maintain a pre-experiment supersaturation of 0.7 to avoid crystallization before the start
of the timed crystallization phase. The speed of mixing could be varied by turning the dial
on the Vortex Genie 2 tube shaker.
Seeds were prepared before the experiments by drying ASN in a Lab-Line
mechanically convected L-C oven for 24 ho urs at 333 K. An Ohaus Explorer balance was
used to weigh the desired amount of seeds for one tube in a polypropylene disposable
weighing dish.
52
Page 77
CHAPTER 3: MATERIALS AND METHODS
If the sample was to be seeded, the seeding was done after removing the tube from
the saturation bath and just before inserting it in the tube holder. During the seeding
procedure, the tube was rapidly uncapped, the content of the weighing dish was carefully
poured in the tube, the tube was capped and inserted in the tube holder. Beyond 0.24 g per
tube, it became difficult to rapidly pour the seeds into the tube without losing a significant
amount of material. Larger amounts could therefore not be investigated. To examine the
effect of the time at which the samples were seeded, different seeding times were
experimented. Seeds were added when supersaturation levels reached values of 0.7, 1.0
and 2.0. For supersaturations of 1.0 and 2.0, the tubes were removed from the saturation
bath, put in the tube agitator and the crystallization bath. The tubes were removed when
the supersaturation reached the desired value (determined by the temperature reading
from the monitoring tube). The seeds were then added as described above and the tube
put back in the agitator and crystallization bath for the remaining crystallization time.
Samples were taken at selected times. Approximately 3 mL of the mixture of
solution and crystals were syringed out of the crystallizer using a 3 mL B-D syringe with
needle. The needle was rapidly removed and replaced with a screw-on Millipore Swinnex
25 mm filter holder containing a Fisherbrand 0.2 /lm membrane filter. The content of the
syringe was filtered out to a polypropylene disposable dish. A Nichipet EX micropipet
with disposable tip was used to sample a precise volume of the supematant that was
placed in a volumetrie flask and diluted with distilled-deionized-filtered water. The
diluted solution was then very weIl mixed manually and ready for HPLC sampling
(Section 3.2.2).
The rest of the tube's content was discarded after sampling, making each tube an
independent experimental sample. Sampling of one tube did not affect the other tubes.
53
Page 78
CHAPTER 3: MATERIALS AND METHODS
3.4.3 Separation Experiments
Separation experiments were carried out us mg the same setup as the
crystallization rate experiments. However, the solution was a mixture of L-ASN and D-
ASN.
3.4.4 Cyclic Separation Experiments
Cyclic separation experiments used a setup similar to the separation experiments.
A tube containing a mixture of L- and D-ASN solution was seeded and crystallized in the
crystallization bath. At the end of the crystallization period, the entire content (solution
and crystals of the tube was syringed out using a 25 mL syringe with a piece of silicone
tubing. The tubing was rapidly removed and replaced with a screw-on filter holder
containing a 0.2 /lm membrane filter. The content of the syringe was filtered out into
another tube, effectively separating the solid and liquid phases. Using this method, it was
possible to minimize the losses for both the liquid and solid phase. The liquid phase was
replenished with the appropriate amounts of L- and D-ASN crystals and placed in a high
temperature bath until the crystals were completely dissolved. It was then placed back in
the saturation tube for 30-60 minutes for temperature equilibration. The cycle was started
again with seeding with the appropriate enantiomer and crystallization in the
crystallization bath and subsequent operations described above.
For analysis of the liquid phase, the tubes were sampled as described above
(Section 3.4.2). For analysis of the solid phase, the crystals recovered by the filter were
54
Page 79
CHAPTER 3: MATE RIALS AND METHODS
dried at 333 K for 24 hours and weighed. They were then dissolved in water and analysed
byHPLC.
3.5 Crystal Analysis
3.5.1 Morphology
For determination of the crystal shape factor, large crystals were obtained by slow
undisturbed crystallization of solutions of L-ASN and D-ASN at low supersaturation
(approximately 2.0) at room temperature in a 250 mL Erlenmeyer flask capped with a
rubber stopper. After 24 hours, crystals with length of 5-20 mm were obtained. The
length was measured using a micrometer.
Digital images were obtained using a Leica optical microscope equipped with a
digital camera. Crystal samples were deposited on a glass Petri dish and dispersed in
HPLC grade methanol.
3.5.2 Density
The density of L-ASN and D-ASN crystals was obtained using a 25 mL
pycnometer with HPLC grade 2-propanol at room temperature. Several runs were made
with different crystal sizes.
55
Page 80
CHAPTER 3: MA TE RIALS AND METHODS
3.5.3 Particle Size Distribution
The mean partic1e size and partic1e size distribution of small crystal samples were
determined using a Malvern Instruments Mastersizer 2000 partic1e size distribution
analyzer. HPLC grade methanol was used as the carrying solvent. Mechanical mixing and
ultrasounds were used to disperse the sample. It was not possible to obtain a steady
reading for L-ASN and D-ASN samples. It is assumed that excessive breakage occurred
while circulating the crystal suspension from the sampler to the observation cell. Results
in the small partic1e range were therefore not reliable.
56
Page 81
CHAPTER 4: RESULTS AND DISCUSSION
Chapter 4: Results and Discussion
57
Page 82
CHAPTER 4: RESULTS AND DISCUSSION
In the present chapter, the experimental results and discussions of the results are
presented in the following order:
In Section 4.1, the effect of temperature on the solubility of ASN is examined. The
fundamental role of solubility in crystallization is introduced.
The effects of variables such as mixing, crystallization temperature and initial
supersaturation on the crystallization of ASN in the absence of seeds are then exposed in
Section 4.2.
In Section 4.3, the crystallization of ASN in the presence of seeds is extensively
studied with a description of the seeds used and the effects of the type of seeds, the
amount and the time of addition of the seeds on the crystallization rates of the different
enantiomers.
In Section 4.4, the basic principles of the separation process are described, followed
by the development of specific separation processes and the introduction of a cyclic
process.
Finally, in Section 4.5, models for the growth rate and the desupersaturation rate are
presented.
4.1 Solubility
Asparagine (ASN) is an amino acid which is very soluble in water. Hs solubility in
water is greatly affected by temperature and pH. In the present work, the pH was not
adjusted in arder to avoid the introduction of other compounds in solution and was around
4.3 at 298 K and 9.0 x 10⁻¹ moIL-1• Figure 4.1 shows the solubility ofL-ASN and D-ASN
in molL-1 in water at temperatures between 297 K and 345 K. The data were obtained
58
Page 83
CHAPTER 4: RESULTS AND DISCUSSION
with solutions of L-ASN, D-ASN and racemic mixtures of L- and D-ASN. The solubility
varies from about 1.8xl0-1 moIL-1 to around 1.3 moiL- I• The results obtained are in
agreement with solubility values available in the literature (Stephen et al., 1979). This
large difference in solubility at different temperatures is the driving force for
crystallization.
1.4E+OO ,.---.---.----..... -----.-..... -......... - .. - ......... ---.... -.-.. -.-.. --------------.-.-----,
1.2E+00
1.0E+00
..-. ~~ 8.0E-01 "0 E ;-- 6.0E-01 u
4.0E-01
2.0E-01 o
o
o
•
o L-ASN j .D-ASN 1 ... L-ASN in racemic solution: .. D-ASN in racemic solution 1
O.OE+OO +--------,-----,-----------,----------,-----------1
290 300 310 320
T (K)
330 340
Figure 4.1: Solubility of L-ASN and D-ASN in Water
350
As shown, both enantiomers have the same solubility in water. Both enantiomers also
have the same solubility when in a racemic solution (the data points for L- and D-ASN in
a racemic solution are superimposed in Figure 4.1), this implies that the presence of one
enantiomer in solution does not affect the solubility of the other. The solubility ratio a at
any temperature (equations 2.8 and 2.9) can be used to quantifY this interaction (see
Chapter 2). For ASN, both aL and aD were found to be equal to 2. These results are
similar to those ofWatanabe and Noyori (1969).
59
Page 84
CHAPTER 4: RESULTS AND DISCUSSION
4.2 Crystallization in the Absence of Seeds
4.2.1 The Effect of Mixing
Mixing of a crystallizing solution serves several purposes. It helps cooling by
circulating the solution and homogenizing its temperature, thus reducing the temperature
gradients that may occur across the crystallizer. It also homogenizes the concentration of
the solute in the solution, thus reducing the concentration gradients that may exist.
Mixing can also be the cause of collisions between crystals. These collisions can in tum
break off crystals and agglomerates and create new nucleation sites.
An unseeded solution of L-ASN with a concentration of 3.6xl0-I molL-1 was
cooled down from 313 K to 298 K at varying mixing speeds (Figure 4.2).
4.0E-01 ------------.-......... ----... --.-... --.-.. ----... - ... -.---------,
3.5E-01
3.0E-01 .-
~ 2.5E-01 o E ;:; 2.0E-01 z en ~ 1.5E-01 -1 .....
1.0E-01
• Â
o No mixing
• Moderate Mixing Speed 5.0E-02
 Maximu~ Mi~in~.~peed.J 1
O.OE+OO \-----------.,.-----_----r-----------,------i
o 2 4 6 8 10 12
t (min)
Figure 4.2: Effect of Mixing Speed on the Crystallization of L-ASN at 298 K (co = 3.6 X
10-1 moIL-1, no seeds)
60
Page 85
CHAPTER 4: RESULTS AND DISCUSSION
In the absence of mixing, almost no crystallization occurs over 10 minutes. An
almost identical trend is observed when mixing is kept at a moderate speed (see Chapter 3
for details on mixing speed). However, at the maximum mixing speed, a signiticant
reduction in supersaturation is observed after 6 and 10 minutes. The solute concentration
decreases to 3.3xI 0-1 and 2.5xlO-1 molL -l, respectively.
It appears that the combination of faster cooling with relatively homogeneous
temperature and concentration throughout the crystallizer tube and the increased
probability of collisions between crystals increases the crystallization rate of L-ASN. In
the absence of mixing, the solute concentration is locally lower in the vicinity of crystals,
thus reducing the supersaturation level and lowering further the crystallization rate in the
absence of mixing. It has also been observed that crystals agglomerate and accumulate at
the bottom of the crystallizer tube thus reducing the surface area available for growth.
Based on these results, most subsequent experiments were carried out at the maximum
mixing speed.
4.2.2 The Effect of Crystallization Temperature
Two types of experiments were designed to study the effect of crystallization
temperature on the crystallization rate because the effect of temperature cannot be
completely decoupled from the effect of the initial concentration. In the tirst type of
experiments (Figure 4.3), the initial concentration is kept at 7.6xIO-1 molL-1 while the
crystallization temperature is varied (283 K and 293 K). In the second type of
61
Page 86
CHAPTER 4: RESULTS AND DISCUSSION
experiments (Figure 4.4) the initial supersaturation lS kept constant at 5.1 while the
crystallization temperature is varied (285 K and 293 K)l.
8.0E-01 -,-.--.-.. -.--.--.. -----... --.--.......... -.. - .................... ---.. ------.. --...... -.. --.... --------.. -------,
-
~oo. 0.0 7.0E-01
6.0E-01
-~ "0 5.0E-01 E ~ 4.0E-01 z en < 3.0E-01
1 ..J .....
2.0E-01
1.0E-01
a a
• a
r • Tcrys = ;~ l~T~rys = 293K j
•
O.OE+OO +------,----------,.-----,---------__,__------1
o 10 20 30 40 50 60 70
t (min)
Figure 4.3: Effect of the Crystallization Temperature on the Crystallization of L-ASN at Constant Initial Conditions (To = 333 K, Co= 7.6 X 10⁻¹ moIL-1
)
It is not possible to have both initial concentration and supersaturation constant
while varying the crystallization temperature because the supersaturation is dependent on
the initial concentration and the crystallization temperature. For example, if the initial
concentration is 7.6xlO-1 molL-1 and the crystallization temperature is 283 K, then the
initial supersaturation is 8.1 whereas if the crystallization temperature is 293 K, the initial
supersaturation becomes 5.0. Figure 4.3 shows the typical results for the decrease in the
concentration of L-ASN for two sets of experiments of the first type with two different
crystallization temperatures (283 K and 293 K). In both sets, the initial concentration was
1 Type 1 experiments: Constant initial concentration, varying crystallization temperature therefore varying initial supersaturation. Type 2 experiments: Constant supersaturation, varying crystallization temperature therefore varying initial concentration.
62
Page 87
CHAPTER 4: RESULTS AND DISCUSSION
8.0E-01 r--.-·.·-·---··----·-··········--.·-······ .. ·········· ... - ............. ---.-.-............. - ... --... --......... -.-----... ------.-----,
--
• 7.0E-01
6.0E-01 ~:..J
'0 5.0E-01 E :: 4.0E-01 z tn l3.0E-01
2.0E-01
1.0E-01
• • • o
• o
• • o
o
• o
-;; Tcrys=-285Kl
~~~rys = 293K 1
o
O.OE+OO +---r-----,----.,----r----,----,--------,---.,------j
o 5 10 15 20 25 30 35 40 45 50 t (min)
Figure 4.4: Effect of the Crystallization Temperature on the Crystallization of L-ASN at Constant Initial Supersaturation (so = 5)
At both temperatures, after an induction period of 10-12 minutes, the
concentration of dissolved L-ASN drops to approximately 1.9xlO-I moIL- I. Table 4.1
shows that different crystallization temperatures lead to a very similar crystallization rate.
The details calculations to obtain the results presented in this table as weIl as aIl the other
tables are presented in Appendix 1.
Other experiments were performed with lower initial concentrations (below 3.7
moIL- l) but the combination of low crystallization rates with the absence of seeds
amplified the effect of heterogeneous nucleation and lead to unreliable results. The data
are therefore not shown; however, a brief discussion on reproducibility in the absence of
seed is presented in Appendix 4. The unexpected result shown in Table 4.1 regarding the
crystallization temperature not affecting the crystallization rate is due to the strong
influence of supersaturation on the crystallization rate as mentioned above.
63
Page 88
CHAPTER 4: RESULTS AND DISCUSSION
Table 4.1: Effect of the Crystallization Temperature on the Maximum Crystallization Rates ofL-ASN (To = 333 K, Co= 7.5xlO-I moIL-1
, No Seeds)
Crystallization Tem erature (K) Maximum Crystallization Rate (moIL- min- )
When the initial concentration is maintained constant but the crystallization
temperature is lowered, the supersaturation of the solution is increased. The increase in
the crystallization rate due to increased supersaturation overcomes the decrease in
crystallization rate due to lower crystallization temperature.
In the experiments of the second type (Figure 4.4), the supersaturation is kept
constant to isolate its effect from the effect of the crystallization temperature on the
crystallization rate. Although significantly scattered, the data indicate no noticeable
difference in the crystallization rates over the crystallization temperature range examined.
Orella (1990) and Campbell (2005) reported similar results for ASN and other
amino acids and for glutamic acid respectively. It seems that the ranges of temperature
studied induce variations in the crystallization rates that are too small to detect.
In the case of the crystallization of ASN in aqueous solutions, the range off
crystallization temperature is limited from slightly over 273 K (to avoid freezing) to
slightly below 373 K (to avoid boiling). In reality, in order to (1) have a relatively high
supersaturation (for a reasonably fast reduction in supersaturation), as weIl as (2) to
minimize evaporation and (3) maintain a constant crystallization temperature, the
difference between the saturation temperature and the crystallization temperature must be
kept relatively large while keeping the saturation temperature significantly below 373 K.
64
Page 89
CHAPTER 4: RESUL TS AND DISCUSSION
The range of operating temperatures is therefore narrowed down giving a range of about
15-20 K for crystallization temperatures (See Chapter 3).
Using a value between 10,000 and 20,000 Jmor l for the activation energy for the
process (Orella, 1990), a temperature difference of around 60 K is required to double the
rate constant at 298 K. Similarly, a temperature difference of 8 K (Figure 4.4) or 10 K
(Figure 4.3) led to differences in rate constants of 12.2% and 15.6% respectively (See
Section A 1.14). This explains the difficulty in experimentally identifying a significant
difference in rates in the temperature range studied.
4.2.3 The Effect of Supersaturation
Four senes of experiments to study the effect of supersaturation on the
crystallization of ASN were carried out at 298 K. Table 4.2 and Figure 4.5 show the
results of these experiments. As the initial supersaturation of a solution increases, the
reduction in concentration and therefore the reduction in supersaturation is accelerated.
Crystallization rates increase with increasing supersaturation. This is also indicated by the
time to reach a supersaturation of 1.2 (Table 4.2). In the case of an initial supersaturation
of 1.5, s = 1.2 and the end of the induction period were not reached during the 40-minute
experiment.
Table 4.2: Effect of the Initial Supersaturation on the Reduction in Supersaturation of LASN, the Duration of the Induction Period and the Maximum Crystallization Rate at T= 298 K (No Seeds)
Initial Supersaturation 5.1 3.7 2.3 1.5 Time to Reach s = 1.2 (min) 2.7 4.8 13.4 >40
Duration of the Induction Period (min) 0.6 1.0 3.9 >40 Max. Crystallization Rate (moIL-lmin- l) 1.5 3.2xlO-1 4.8xlO-L :::::0
65
Page 90
1.2E+00 ----.---.-.-
1.0E+00 QQ
~::; 8.0E-01 Q
'0 •• E ::: 6.0E-01 • z U'J
0$30 ~ ct ..J 4.0E-01 ....
Q ~ 2.0E-01
0 0 0
0 0 • • • Q • • •
CHAPTER 4: RESULTS AND DISCUSSION
•
iOso=5.1l
l, • sO = 3.7 :
050 = 2.3 ! , .50 = 1.5 1
-~_.-
• o
O.OE+OO +-----,---------,----.,------,---------r---~
o 2 4 6 8 10 12 14 16
t (min)
Figure 4.5: Effect of the Initial Supersaturation on the Crystallization ofL-ASN at 298 K
The increase in crystallization rate is the result of the increase of both the
nuc1eation and growth rate of the ASN crystals as predicted by the rate expressions (See
Chapter 2). During the early stages of crystallization, there is an induction period during
which the concentration of L-ASN is relatively constant even at the highest initial
supersaturation. For example, for the highest supersaturation (so = 5.1), the concentration
is constant for approximately 30 seconds. In contrast, with a lower initial supersaturation
of 2.3, the concentration is constant for 4 minutes. At an initial supersaturation of 1.5, the
concentration remains almost constant for the entire experimental time. The induction
period shortens with increased supersaturation (Table 4.2).
This induction period appears to be the period during which mainly nuc1eation
occurs. Nuc1ei being extremely small (of the order of several dozen A, Jacques et al.,
1981), they cannot be filtered out (filter size of 0.2 !lm) during the analysis of the
samples, and are re-dissolved during dilution prior to HPLC analysis. The ASN
66
Page 91
CHAPTER 4: RESULTS AND DISCUSSION
concentration therefore appears to be constant. The presence of nuclei which increase in
number during the induction period also explains the rapid decrease in supersaturation in
the case of high supersaturation conditions.
This is further confirmed when the maximum crystallization rate occurring shortly
after the induction period is examined (Table 4.2). For the high supersaturation cases, the
maximum crystallization rate is higher probably due to the larger number of nuclei. In the
extreme case of very low supersaturation conditions, the solution seems to be almost
metastable, with no significant decrease in supersaturation over the experimental
crystallization time. This is due to the combination of a small number of nuclei formed
(low nucleation rate) with a low crystal growth rate both due to low supersaturation.
4.2.4 Summary of the Effects of Mixing, Crystallization Temperature and
Supersaturation on the Crystallization of ASN in the Absence of Seeds
An increase in the mixing speed of the crystallizing system accelerates the
decrease in supersaturation. The mixing speed was limited by the equipment used (see
Chapter 3).
Because of technical (Chapter 3) and physical constraints (Section 4.1), the range
of crystallization temperature studied was limited to a relatively small interval. It has been
shown that over the range examined, the temperature of crystallization does not influence
the crystallization of ASN.
It has also been shown that upon cooling, a solution of L-ASN will crystallize
creating a decrease in its supersaturation after an induction period during which the solute
concentration remains constant. The length of this induction period is shortened as the
67
Page 92
CHAPTER 4: RESUL TS AND DISCUSSION
initial supersaturation of the solution is increased (with the extreme case of a metastable
solution for very low initial supersaturation). The rate of the crystallization that follows is
increased with increased initial supersaturation.
4.3 Crystallization in the Presence of Seeds
4.3.1 The Effect of Seeds
4.3.1.1 Description of the Seeds
The seeds used in these experiments were L-ASN or D-ASN. Both enantiomers of
ASN naturally crystallize into an orthorhombic shape (Figure 4.6).
Figure 4.6: Orthorhombic Shape
68
Page 93
CHAPTER 4: RESULTS AND DISCUSSION
Pictures of seed samples confirmed this (Figure 4.7). It should also be noticed that
a significant distribution in the size of the crystals is clearly visible.
a) L-ASN (lOOX) b) D-ASN (40X)
ct c) L-ASN (200X) d) D-ASN (200X)
Figure 4.7: ASN Crystals
The size of the seeds is an important parameter. Seed samples were found to have
a volume-average diameter of approximately 200 !lm (Figure 4.8). However, the number
average diameter could not be determined precisely but lies in the range 1-10 !lm (Figure
69
Page 94
CHAPTER 4: RESULTS AND DISCUSSION
4.9). More important than the size of the particles, the specifie volume and surface area
need to be determined for the kinetic modeling of the nucleation and growth rates.
9
8 o 0 0 0
7 0 0
0 0 6
<f!. 0 0
CIl 5 E 0 0 -=4 0 0 >
3 0
0
2 0
0 0
0 ~ 0
0 100 200 300 400 500 600 700 Particle diameter (,.lm)
Figure 4.8: Particle Size Distribution ofL-ASN Seed Sample (vol. %)
14 o
12
10 <>
~ 0 8 ... CIl .Q E 6 ::l C o
4 ~ o o
2 o
0
o 000000 o o o o o
0 10 20 30 40 50 60 70 80 90 100 Particle diameter (Jlm)
Figure 4.9: Particle Size Distribution ofL-ASN Seed Sample (number %)
70
Page 95
CHAPTER 4: RESULTS AND DISCUSSION
These cannot be easily obtained analytically so a shape factor was necessary (See
Sections 3.5.1 and Al. 13). After comparing the results of Orella (1990) with experimental
results, a value of 0.119 was chosen (Figure 4.10). The dashed line on Figure 4.10
represents data from Orella (1990) after transformation from crystal mass to crystal
volume.
1.2E-06 r·········································_·_········· .................................................................................................................................................................................... _ ...... _ ................ _._ ................. _ ...... ,
1.0E-06
B.OE-O?
"'s. ~ 6.0E-O?
= ~ 4.0E-O?
2.0E-O? .. ' . ..... .'
.....• .....
•
v = 0.119 L3
O.OE+OO -+'----------------------r----------j
O.OE+OO 2.5E-06 ?5E-06 1.0E-05
Figure 4.10: Volume Shape Factor of ASN
As stated earlier, upon addition of L-ASN seeds, a supersaturated solution of L-
ASN will crystallize faster than an equivalent non-seeded solution. Figure 4.11 shows
clearly the accelerating effect of the seeds on the crystallization rate. The induction period
is completely eliminated for the seeded case implying that crystallization starts
immediately. On the other hand, for the non-seeded solution, the induction period is
slightly over 30 seconds.
71
Page 96
1
1
1.0E+00
::- 8.0E-01 '0 E ::: 6.0E-01 z UJ <C ...J 4.0E-01 ....
2.0E-01
o o
•
•
o
• o • •
CHAPTER 4: RESULTS AND DISCUSSION
I;-No seeds 1
i 1
• 18 9 L-ASN seeds/L i
O.OE+OO +---......-,.---,.----,------,-----.....,----.,..------,----,.-----1
o 20 40 60 80 100
t (s) 120 140 160 180 200
Figure 4.11: Effect of L-ASN Seeds on the Crystallization of L-ASN at 298 K with Co = 9.5 X 10⁻¹ molL-1
A close study of the desupersaturation curves (Figure 4.11) shows that for the non-
seeded case, the maximum crystallization rate (shortly after the induction period) is larger
than that ofthe seeded case (which occurs as soon as the experiment starts), (Table 4.3).
Table 4.3: Effect of the L-ASN Seeds on the Maximum Crystallization Rates ofL-ASN at 298 K (co = 9.5x10⁻¹ moIL-1)
Max. Crystallization Rate (moIL-lmin- l) Non-Seeded Solution 1.5
Seeded Solution (18g seeds L- t solution) 8.8xlO- t
This can be explained from the fact that in the non-seeded case, the solution
remains at a high supersaturation for a longer period of time and therefore the nucleation
rate is very high. During this period of time, a large number of nuclei are formed which
72
Page 97
CHAPTER 4: RESULTS AND DISCUSSION
later on translates into a high growth and crystallization rate. For the seeded solution,
crystallization occurs right away due to the growth of the seeds. The reduction in
supersaturation is faster and the resulting lower supersaturation yields lower nucleation
rates.
Similar experiments were conducted using a solution of 8.7xIO-1 molL-1 of D-
ASN (Figure 4.12). Once again, the induction period is eliminated for the seeded solution
whereas it lasts about one minute for the unseeded case. In the early stages of the
experiments, the reduction in supersaturation is faster for the seeded case, with both
solutions eventually going to saturation. L-ASN and D-ASN solutions were then seeded
with D-ASN and L-ASN seeds, respectively (Figure 4.13 and Figure 4.14).
1.0E+00
9.0E-01
8.0E-01
~ 7.0E-01 :.J '0 6.0E-01 E ::: 5.0E-01 z ~ 4.0E-01 ci .... 3.0E-01
2.0E-01
1.0E-01
------------------------- -----------,
o o o o •
• •
• o •
r 0 No seeds !
1 • 12 9 D-ASN seeds/L 1
•
O.OE+OO +---.,-------,--------,---,------,----,-----,--'
o 20 40 60 80 100
t (5)
120 140 160 180 200
Figure 4.12: Effect of D-ASN Seeds on the Crystallization of D-ASN at 298 K with Co =
8.7 X 10⁻¹ molL-1
73
Page 98
CHAPTER 4: RESULTS AND DISCUSSION
1.2E+00 ,_.-.. - ....................... _-............................................................................................................................................................................ -............. --_ ............... -.................................. __ ... -..... ----.-,
1.0E+OO
-:;- 8.0E-01 '0 E ;::; 6.0E-01 z tn
;l4.0E-01
2.0E-01
o •
• o • o ..
,-- --_._- -_. __ . ....., : 0 No seeds i
i • 18 9 D-ASN seeds/L !
._. __ , __ . ----.J
O.OE+OO +------,-----r---.....,.------~---,----,-------,-----r------1
o 20 40 60 80 100
t (s)
120 140 160 180 200
Figure 4.13: Effect of D-ASN Seeds on the Crystallization of L-ASN at 298 K with Co = 9.5 X 10⁻¹ moIL-1
1.0E+OO·
9.0E-01
8.0E-01
-- 70E-01 :..,. '0 6.0E-01 . E ;::; 5.0E-01 z ~ 4.0E-01 6 .... 3.0E-01
2.0E-01
1.0E-01
• o
• o
o
•
: .-.... ---.-- --'-~l
10 No seeds i
1. 12 9 L-ASN seeds/L 1
I ____ ._----~--~
•
O.OE+OO .f-------,---~---__,_-----,--------r-----,---------1
o 20 40 60 80 100 120 140
t (s)
Figure 4.14: Effect ofL-ASN Seeds on the Crystallization ofD-ASN at 298 K with Co = 8.7 X 10⁻¹ moIL-1
74
Page 99
CHAPTER 4: RESULTS AND DISCUSSION
In both cases, the seeds have no effect on the crystallization rate of the enantiomer
in solution. No significant difference is observable in the desupersaturation curve for
unseeded L-ASN and L-ASN seeded with D-ASN. Similarly, 18 gL-1 ofL-ASN seeds do
not apparently affect the crystallization of D-ASN. This is because ASN forms a
conglomerate when crystallizing. Since the thermodynamic stability of the crystal
compound containing both enantiomers is lower than that of a pure crystal (See Chapter
2), L-ASN and D-ASN do not grow from D-ASN and L-ASN nuclei respectively.
Therefore the nuclei of D-ASN and L-ASN formed through seeding do not lead to the
crystallization of L-ASN and D-ASN, respectively. Overall, the seeding of an L-ASN
solution with D-ASN and of a D-ASN solution with L-ASN does not have the
accelerating effect of seeding an L-ASN solution with L-ASN and a D-ASN solution with
D-ASN.
It has been demonstrated above that under identical conditions, L-ASN and D-ASN
have identical crystallization rates. The reduction in supersaturation occurs in the same
fashion. This is due to the symmetric nature of the enantiomers and their identical
physical properties. It has also been shown that upon addition of L-ASN seeds an L-ASN
solution crystallizes faster than in the absence of seeds. This is also true in the case of D
ASN and D-ASN seeds. More importantly, it has been shown that L-ASN and D-ASN
seeds have no observable effect on the crystallization rate of D-ASN and L-ASN
respectively. The results shown above strongly suggest that what is true for L-ASN is also
true for D-ASN.
Therefore from now on, whenever one experiment is performed with one type of
enantiomer and one type of seeds, the corresponding results will be assumed to be true for
the other enantiomer and the other type of seeds. L-ASN being more readily
75
Page 100
CHAPTER 4: RESULTS AND DISCUSSION
commercially available, experimental work will focus mainly on this enantiomer
whenever only one enantiomer is necessary.
4.3.1.2 Amount of Seeds and Seeding Time
Since seeds act as nuclei and promote crystallization, it is expected that the
amount of seeds and therefore the number of particles added to a supersaturated solution
will have an effect on its desupersaturation.
Figure 4.15 shows the influence of the amount of L-ASN seeds on the
desupersaturation ofan L-ASN solution at 298 K with an initial concentration of9.0xl0- I
moIL- I. An increase in the amount of seeds increases the crystallization rate of the
solution. There is a very large difference between non-seeded and seeded solution. The
difference is not as large between the different amounts of seeds.
1.0E+00 r-.-.. - .. ----.. --.. ----............. --....... --.. - .. - ...... - ......... - ....... --.----.--.--------,
9.0E-01
8.0E-01
...... 7.0E-01 ~ '0 6.0E-01 E ::: 5.0E-01 z ~ 4.0E-01
d 3.0E-01
2.0E-01
1.0E-01
o
il -/::;. o
o No seeds _6 g/L
1 012 g/L i
1 _18 g/L 1
~24g/_L_1
O.OE+OO +-----;------r----,---------,------,-----;
o 20 40 60 80 100 120 140
t (5)
Figure 4.15: Effect of the Amount of L-ASN Seeds on the Crystallization of L-ASN at 298 K with Co = 9.0 X 10⁻¹ molL-1
76
Page 101
CHAPTER 4: RESULTS AND DISCUSSION
This is apparent in Figure 4.16 where the amount of L-ASN crystallized after 30
seconds is shown as a function of the amount of seeds introduced in the solution.
6.0E-01 .-':J '0 .§. 5.0E-01 II)
~ 4.0E-01 ~
! ca " 3.0E-01
~ i 2.0E-01 ~ u ~ 1.0E-01
~
• • • •
O.OE+OO .-------,------,------,----------,-----1
o 5 10 15 20 25 30 amount of seeds (gL,l)
Figure 4.16: Effect of the Amount of L-ASN Seeds on the Crystallization of L-ASN at 298 K with Co = 9.0 x 10,1 molL'1
The amounts crystallized were calculated from the difference between the initial
concentration and the concentration after 30 seconds. This value was used as an indicator
of the crystallization rate in the early stages of the process. The results show that there is a
large increase in the amount crystallized in the early phase of the desupersaturation as the
amount of seeds increases from zero to 6 gL'I. The addition of more seeds does not
increase this value very significantly afterwards.
Similar experiments were carried out with L-ASN solutions with a lower initial
concentration of 3.9xlO'l moIL-I. The same trends can be observed: An increase in the
amount of seeds accelerates the desupersaturation of the solution (Figure 4.17) with less
improvement as the amount of seeds increases. Figure 4.18 shows that after a seeding
77
Page 102
CHAPTER 4: RESULTS AND DISCUSSION
level of 18 gL-1 is reached, further addition of seeds (up to 24 gL-1) does not accelerate
desupersaturation in the early stages of the experiments.
4.5E-01
4.0E-01
3.5E-01
'G' 3.0E-01 '0 §. 2.5E-01
~ 2.0E-01 oC(
d 1.5E-01
1.0E-01
5.0E-02
-----------------------:---------------------------------------------·--i-· ~-~-:-~-/:idS ~
• o il
o
• ~
i t.18g/L 1
L_·24g/~~ o
•
O.OE+OO +-------,-----....,.----~----.....,_----,____---_1
o 2 4 6 8 10 12
t (min)
Figure 4.17: Effect of the Amount of L-ASN Seeds on the Crystallization of L-ASN at 298 K with Co = 3.9 X 10⁻¹ molL-1
-.1.6E-01 -~ 11.4E-01
. 5 1.2E-01 E ~ 1.0E-01 ! : 8.0E-02
~ 6.0E-02 ,fi 1/1 ~4.0E-02 (,)
~ 2.0E-02 ~
• • •
•
...JO.OE+OO ...... ------,--------------.....,_----,____---_1
o 5 10 15 20 25 30 amount of seeds (gL·1)
Figure 4.18: Effect of the Amount of L-ASN Seeds on the Crystallization of L-ASN at 298 K with Co = 3.9 X 10⁻¹ molL-1
78
Page 103
CHAPTER 4: RESULTS AND DISCUSSION
For technical reasons described in Chapter 3, it was not possible to go beyond the
level of24 gL-1 for seed addition.
Figure 4.15 and Figure 4.17 show that, increasing the amount of seeds beyond a
certain point (24 gL-1 in this case), does not affect the decrease in supersaturation
suggesting that the available surface area for the nucleation and growth of the crystal is
sufticient. This is probably because the diffusion of the solute to the crystal and the
adsorption onto the surface limit the crystallization rate.
Upon cooling, ASN crystallizes very rapidly compared to other aqueous amino
acid solutions (OrelIa, 1990 and Campbell, 2005). Both the nucleation rate and the growth
rate are rapid. Therefore there is a limited time range to add seeds to a supersaturated
solution.
In order to study the effect of the time at which seeds are added on the
desupersaturation of ASN solutions, similar solutions were cooled down to create
supersaturation. Seeds were added during the cool down period (See Figure 3.6) when the
supersaturation levels reached 0.7 (unsaturated), 1.0 (saturated) and 2.0 (supersaturated).
Two sets of experiments were performed. In the tirst set of experiments (Figure 4.19),
solutions ofL-ASN with initial concentration of9.0xl0-1 molL-1 were used. In the second
set of experiments (Figure 4.20), solutions of L-ASN with initial concentration of 3. 7x 1 0-
1 molL-1 were used. In both set of experiments, the crystallization was carried out at 298
K. The experiments with high initial concentration reached the set supersaturation levels
faster compared to the low initial concentration experiments (Table 4.4). This was
because of the shape of the solubility curve (See Figure 4.1) and the stronger dependence
on temperature at higher concentrations).
79
Page 104
CHAPTER 4: RESULTS AND DISCUSSION
7.0E-01 ........ ---.. - .. -... ---.... --............ ---.................. --... -.............. ---.--... -...................... -.. -.-.-.-.----... ---
6.0E-01
.- 5.0E-01 ~ 14.0E-01
Z-CI) 3.0E-01 .
~ - 2.0E-01
1.0E-01
0
• 0
I~S=O~ i • s = 1.0 ! 0 S = 2.0 \ ~. --_._~
~
0 g
O.OE+OO +------------,----.,-------------,--------4
o 20 40 60 80 100 120 140 t (s)
Figure 4.19: Effeet of Time of Seed Addition on the Crystallization of L-ASN at 298 K (eo = 9.0 x 10⁻¹ moIL- I
, 24 g L-ASN seeds L-I)
3. 5E-0 1 , ..... -.. _ ... - ... -.... - ... ---.-.... - ..................... -................................................................................................................................... - ....... -..... -......... ----.--............ --....... - .. -.,
3.0E-01
.-2.5E-01 ~ 12.0E-01
--z CI) 1.5E-01
~ -1.0E-01
5.0E-02
o o
• o o
. 0 s = 0.7 ! l ,
1 • s = 1.0 i i Os = 2.0 : ____ J
o
O.OE+OO -\-----........,.-----,---------,-----,-----_-----1
o 2 4 6 8 10 12 t (min)
Figure 4.20: Effeet of Time of Seed Addition on the Crystallization of L-ASN at 298 K (co = 3.7 X 10⁻¹ moIL- I
, 18 g L-ASN seeds L- I)
80
Page 105
CHAPTER 4: RESULTS AND DISCUSSION
Table 4.4: Effect of Initial Concentration on Time to Reach Set Supersaturation
Initial Concentration Time (s) to Reach Set Supersaturation of Solution (moIL-') s = 0.7 s = 1.0 s =2.0
9.0 x 10-\ 0 5 15 3.7 x 10⁻¹ 0 6 40
Upon observation of the desupersaturation curves, it appears that early seeding
increases the crystallization rate and accelerates desupersaturation. The phenomenon
occurs both starting from a high concentration (Figure 4.19) or a moderate one (Figure
4.20). The effect is much smaller for the second case (Figure 4.20).
Under conditions of supersaturation, the nucleation process starts and nuclei are
formed and start growing right away. The formation of nuclei and the subsequent growth
of the crystals are the cause of the decrease in supersaturation. When seeds are added to a
supersaturated solution, new nuclei are formed and grow along with the seed crystals. In
that situation, growth occurs right away at the same time as nucleation, resulting in a rate
larger than that of an unseeded system. The earlier the seeds are added, the longer the
formed (primary) nuclei, the secondary nuclei (introduced and formed from seeds) and
the seeds grow and therefore the faster the desupersaturation of the solution.
Before the start of the crystallization, the solutions for the two sets of experiments
(initial concentration of9.0xlO-' and 3.7xl0-' molLO') were kept at temperatures such that
their supersaturation was 0.7 (unsaturated). This was do ne to avoid having any crystal
present in the solutions before the start of the crystallization (see Chapter 3). Therefore,
the condition of supersaturation equal to 0.7 is reached instantly in both cases (Table 4.4).
ln both cases, a supersaturation of 1.0 is reached at very similar times (5 and 6 s).
However, a supersaturation of 2.0 is reached much later for the lower initial concentration
81
Page 106
CHAPTER 4: RESULTS AND DISCUSSION
(40 s vs. 15 s). This means the lower initial concentration solution spends more time at
lower supersaturation. The nucleation and growth rates are therefore lower. This explains
why the seeding time does not make as much of a difference as for the higher initial
concentration.
4.3.2 The Effect of Mixing in the Presence of Seeds
Trends similar to those observed in the absence of seeds (Section 4.2.1) are
observed in the presence of seeds (Figure 4.21).
1.0E+00
9.0E-01
8.0E-01 .
_ 7.0E-01 ~ "0 6.0E-01 E ;:; 5.0E-01 z ~ 4.0E-01
d 3.0E-01
2.0E-01
1.0E-01
• •
O.OE+OO +--------..,.----..,.----..,.----,----,------1
o 20 40 60 80 100 120 140
t (5)
Figure 4.21: Effect of Mixing Speed on the Crystallization of L-ASN at 298 K (co = 9.0 X
10-1 moIL- I,I8 g L-ASN seeds L- I)
L-ASN in a racemic solution at an initial concentration of 9.0xIO-1 molL-1
crystallizes relatively slowly in the absence of mixing. The average crystallization rate is
82
Page 107
CHAPTER 4: RESULTS AND DISCUSSION
1.2x10⁻¹ moIL-1.min- l. In contrast, the average crystallization rate over 2 minutes is
3.4x10⁻¹ moIL-1.min-1 under maximum mixing conditions (Table 4.5).
Table 4.5: Effect of the Mixing Speed on the Average Crystallization Rate ofL-ASN in a Racemic Solution at 298 K (18 g L-ASN seeds L-1)
Mixing Speed 1 None 1 Moderate Maximum Average Crystallization Rate (moIL-lmin-1
) 1 1.2x10⁻¹ 1 2.8XlO- 1 3.4xlO- 1
The effect of mixing is more obvious in this set of experiments (Figure 4.21)
because on one hand, the initial supersaturation is higher than in the non-seeded case
(Figure 4.2) and on the other hand, the collision of seeds, present from the start of the
crystallization phase, amplifies the difference. When one examines the evolution of the
concentration of D-ASN in this same solution (Figure 4.22), the same trend is observed: a
higher mixing speed accelerates the decrease in supersaturation.
1.0E+00 T--·-···_··-·-···_-·_·················-··············· ......... - ............................................... - .... - ..................................... - ....... ·-.. ··.·-.-.-.···-----·.····· .. ··-.. - .. -·------·1
9.0E-01
8.0E-01
_ 7.0E-01 ~~
"06.0E-01 E ;::; 5.0E-01 z ~ 4.0E-01
é. 3.0E-01
2.0E-01
1.0E-01
• 01 •
t, -----~ ~-_·~-··~I
i 0 No mixing
1 ..• MOd. erate. M. ixing spe. ed [1
i ~ Max!l11':lm_r..1Î-,,-ing S~eed O.OE+OO J..----,.--------~----,----___._---_r_-----1
o 20 40 60 80 100 120 140
t (s)
Figure 4.22: Effect of Mixing Speed on the Crystallization of D-ASN in a Racemic Mixture at 298 K (co = 9.0 X 10⁻¹ moIL-1,18 g L-ASN seeds L-1)
83
Page 108
CHAPTER 4: RESULTS AND DISCUSSION
The difference is not very strong for a moderate mixing speed and no mixing. At
maximum mixing speed, there is a significant reduction in the concentration ofD-ASN. It
is important to note that the seeds added to this solution consist of L-ASN and have no
significant effect on D-ASN. The desupersaturation curves are the sarne as the ones that
would be obtained for an unseeded solution of D-ASN or L-ASN (comparable to Figure
4.5). For aIl mixing speeds, the absence of effect from the L-ASN seeds on D-ASN is
confirrned.
4.3.3 Summary of the Effects of Seeds and Mixing in the Presence of Seeds on the
Crystallization of ASN
The introduction of seeds in a crystaIlizing system completely eliminates the
induction period previously visible and greatly increases the crystallization rate of ASN.
L-ASN seeds have an accelerating effect on the crystallization of L-ASN while D-ASN
seeds have an accelerating effect on the crystallization ofD-ASN.
L-ASN seeds have no effect on the crystallization of D-ASN and D-ASN seeds
have no effect on the crystallization of L-ASN due to the conglomerate-forrning
properties of ASN.
A larger arnount of seeds increases the kinetics of crystallization although the
improvement tapers off as we reach 24 g seeds L- I. Technical issues limited the amount of
seeds used to a maximum of 24 g seeds L- I .
An earlier seeding promotes the introduction and appearance of a larger number of
nuc1ei earlier in the crystallization process therefore promoting a faster decrease in
supersaturation.
84
Page 109
CHAPTER 4: RESUL TS AND DISCUSSION
Conclusions similar to those in the absence of seeds can be made. An increase in
the mixing speed of the crystallizing system accelerates the decrease in supersaturation.
The effect was more obvious for seeded solutions and solutions at high initial
supersaturations.
4.4 Separation of Mixtures of Enantiomers
For the system studied in the present work, it has been shown that the initial
supersaturation, the type and amount of seeds used, the seeding time and the mixing
speed strongly influence the crystallization rates of L-ASN and D-ASN. Most
importantly, L-ASN and D-ASN have the property of forming a conglomerate, i.e. L
ASN and D-ASN are not both present in the same crystalline unit.
In the following sections, the parameters examined earlier will be used to create a
difference in crystallization rates between L-ASN and D-ASN. This difference in rates
will be used as the driving force for the separation of L-ASN from D-ASN in a racemic
mixture.
4.4.1 Basic Principles of the Separation Process
4.4.1.1 Racemic Mixtures
The driving force for classical separation by crystallization is the difference in
solubility of two or more solutes in a solvent. The conditions of the system are such that
85
Page 110
CHAPTER 4: RESULTS AND DISCUSSION
the solubility of one solute is lower than the solubility of the other one. The less soluble
solute then crystallizes out of solution.
In the case where the two solutes are enantiomers of ASN, no difference in
solubility exists. The separation of the two enantiomers is therefore based on the
occurrence of a difference in crystallization rates in combination with the conglomerate-
forming property of ASN.
A racemic solution of ASN containing 9.0x10⁻¹ molL-1 of L-ASN and 9.0xlO-1
molL-1 ofD-ASN was cooled down rapidIy from 343 K to 298 K and seeded with 18 g L-
ASN seeds L -1. Throughout the experiment, the crystallizer tube was mixed at the
maximum speed. The results are shown in Figure 4.23.
1. OE +00 , ............................. -................................................................................................................................................................................................................................................................................... ---.......... - ............. ,
9.0E-01
8.0E-01
__ 7.0E-01
-~ 6.0E-01
§. 5.0E-01 Z-en 4.0E-01 ~
3.0E-01
2.0E-01
1.0E-01
• • o
o
• • o L-ASN
.D-ASN _J
o o
o
O.OE+OO -t------r---,----,...----r-------,---.,---..,------,----,-----!
o 20 40 60 80 100
t (5)
120 140 160 180 200
Figure 4.23: Separation of L-ASN and D-ASN from a Racemic Mixture at 298 K (CL-ASN,
0= 9.0 X 10⁻¹ moIL-I, CD-ASN,O = 9.0 X 10⁻¹ moIL- I
, 18 g L-ASN seeds L- I)
The seeded enantiomer, L-ASN, crystallizes rapidly (Table 4.6) from the start of
the experiment. The desupersaturation curve is comparable to one for a seeded solution of
86
Page 111
1
1
CHAPTER 4: RESULTS AND DISCUSSION
L-ASN. In contrast, the unseeded enantiomer, D-ASN, does not crystallize immediately.
Its concentration remains almost constant during the 60-second induction period. It then
crystallizes very rapidly (Table 4.6) and its concentration reaches that of L-ASN after 90
seconds. This behaviour also resembles that of the crystallization of an unseeded solution
ofD-ASN.
Table 4.6: Differences in Induction Period and Maximum Crystallization Rates during the Separation ofL-ASN and D-ASN in a Racemic Solution at 298 K (18 g L-ASN seeds L-1
)
L-ASN D-ASN Induction Period (s) 0 62.5
Maximum Crystallization Rate (moIL-lmin-1) 8.8xlO-1 1.2
It must be noted that the highest maximum crystallization rate is achieved by the
unseeded enantiomer D-ASN (see Section 4.3.1.1). However, both enantiomers
eventually tend to reach their saturation concentration. As discussed earlier, the
crystallization of the seeded enantiomer begins earlier whereas the unseeded enantiomer
goes through the process of nuc1eation and subsequent growth.
During the period between 0 and 90 seconds (Figure 4.23), there exists a
significant difference in the concentration of the two enantiomers. In the liquid phase, the
concentration of D-ASN is higher than that of L-ASN. There is therefore an enriching of
the liquid phase in terms ofD-ASN. A similar observation can be made on the solid phase
by doing a mass balance on the c10sed system. The solid phase is enriched in L-ASN. The
enrichment of the liquid phase can be c1early seen when plotting the ratio of the
concentration of L-ASN vs. D-ASN (Figure 4.24). The solution starts by being racemic
(ratio of 1) and decreases during the initial 45 seconds.
87
Page 112
CHAPTER 4: RESULTS AND DISCUSSION
1.00 0----------.. -------------···-.. -.... --.. ----.. · .. -..... ·-" ...................... --------... - ... -----.... --.--.. -.------------,
0.90
0.80
...{0.70 z ~ 0.60 è !:::,0.50 Z en 0.40 ~ =.0.30·
0.20
0.10
o
o o
o
o o
0.00 -1-----_------------_----,------,-___ --1
o 20 40 60 80 100 120 140 t(s)
Figure 4.24: Enrichment of the Liquid Phase during the Separation ofL-ASN and D-ASN in a racemic mixture at 298 K (CL-ASN, 0 = 9.0 X 10⁻¹ moIL-I
, CD-ASN,O = 9.0 X 10⁻¹ moIL-I,
18 g L-ASN seeds L- I)
This is the period of time when the liquid phase is the riche st in D-ASN. As D-
ASN starts crystallizing rapidly, its concentration decreases while the concentration ratio
increases, tending to a final equilibrium value of 1.
In order to test the effect of supersaturation on the separation process, similar
experiments were carried out with initial supersaturations of 5.5x10⁻¹, 3.9xlO-1 and
2.4xlO-1 moiL- I• The results are shown in Figures 4.25, 4.26 and 4.27, respectively.
Similar results were obtained. In aIl cases, the unseeded enantiomer D-ASN remained in
solution for a certain induction period. For the lower initial concentrations of 3.9xlO-1
moiL-1 (Figure 4.26) and 2.4xlO-1 moIL-1 (Figure 4.27), D-ASN did not crystallize over
the duration of the experiment. In general, a lower initial supersaturation increased the
duration of the induction period, in agreement with earlier results (Section 4.2.3). A lower
initial supersaturation aiso reduced the crystallization rate of the seeded enantiomer.
88
Page 113
CHAPTER 4: RESULTS AND DISCUSSION
7.0E-01 r··_··············-··································· ........................................................................................................................................................................................................................................................ _ ......... _ ...... ....,
--:..,
6.0E-01 )
5.0E-01 •
o 4.0E-01 g ~ 3.0E-01
$ 2.0E-01
1.0E-01
• • •
o o
•
o
o L-ASN
! D-AS"!J
O.OE+OO +-------~--------,..--------r---.,.------,-----1
o 20 40 60 80 100
t(s)
120 140 160 180 200
Figure 4.25: Separation ofL-ASN and D-ASN from a Racemic Mixture at 298 K (CL-ASN,
0= 5.5 X 10⁻¹ maIL-l, CD-ASN, 0 = 5.5 X 10⁻¹ maIL-l, 18 g L-ASN seeds L- I)
4.5E-01 - _._._ .. _---------_ .... - ____ 0 ___ .-
~ ___ ,1
4.0E-01 i 0 L-ASN I[ 0 L!D-ASN • • • • 3.5E-01 • 1
~ 3.0E-01 0
1 :.... 0 12.5E-01 0
0
1 Z 2.0E-01 1 en 1
$ 1.5E-01 1
1.0E-01 i
1 5.0E-02 1
O.OE+OO
0 2 3 4 5 6
t (min)
Figure 4.26: Separation of L-ASN and D-ASN from a Racemic Mixture at 298 K (CL-ASN,
0= 3.9 X 10⁻¹ maIL-l, CD-ASN,O = 3.9 X 10⁻¹ maIL-l, 18 g L-ASN seeds L- I)
89
Page 114
3.0E-01
2.5E-01
~ 2.0E-01 :... ë5 .s 1.5E-01 Z-r/)
:!. 1.0E-01
5.0E-02
CHAPTER 4: RESULTS AND DISCUSSION
----------.... ---.-....... - .. -.... --- .......... -.----.-........ --.-.-.. ---..... -........ ----...... - ·····_---_·· __ ·_----_··_·_---_·_-------_·_--------1
o • • •
o • • o
o
O.OE+OO l----,------~--_,__-----_,__---,----,----_1 o 2 3 4 5 6 7 8 9
t (min)
Figure 4.27: Separation ofL-ASN and D-ASN from a Racemic Mixture at 298 K (CL-ASN,
0= 2.4 X 10⁻¹ molL-1, CD-ASN,O = 2.4 X 10⁻¹ molL-1
, 18 g L-ASN seeds L-1)
By plotting the ratio of the concentration ofL-ASN vs. D-ASN (Figures 4.28, 4.29
and 4.30) one can observe the enrichment of the liquid phase in D-ASN.
1.00
0.90
0.80
..l0.70 z ~ 0.60
o 1 c ~0.50 -. z r/) 0.40
~ .... 0.30
0.20
0.10
0.00
0 20 40 60
o
80 100
t (5)
o
120 140 160 180 200
Figure 4.28: Enrichment of the Liquid Phase during the Separation ofL-ASN and D-ASN in a Racemic Mixture at 298 K (CL-ASN, 0 = 5.5 X 10⁻¹ molL-1
, CD-ASN,O = 5.5 X 10⁻¹ molL-1,
18 g L-ASN seeds L-1)
90
Page 115
CHAPTER 4: RESULTS AND DISCUSSION
1.00
0.90 o
0.80 o
~0.70 z o o ~ 0.60
1 c !:::,0.50 .... z tn 0.40 oC(
1
.:. 0.30
0.20
0.10
0.00 0 2 3 4 5 6
t (min)
Figure 4.29: Enrichment of the Liquid Phase during the Separation ofL-ASN and D-ASN in a Racemic Mixture at 298 K (CL-ASN 0 = 3.9 X 10⁻¹ moIL- I
, CO-ASN 0 = 3.9 X 10⁻¹ moIL-I,
l' , 18 g L-ASN seeds L- )
1.00
0.90
-----0--.... - .. -----.----.. ---... - .. ----.... -- -_._-----, o
0.80 o o
~0.70 z ~ 0.60 Cl !:::,0.50 .... z tn 0.40 oC(
1
.:. 0.30
0.20
0.10
0.00 0 2 3 4 5 6 7 8 9
t (min)
Figure 4.30: Enrichment of the Liquid Phase during the Separation of L-ASN and D-ASN in a Racemic Mixture at 298 K (CL-ASN, 0 = 2.4 x 10⁻¹ moIL-I
, CD-ASN,O = 2.4 x 10⁻¹ moIL- I,
18 g L-ASN seeds L- I)
91
Page 116
CHAPTER 4: RESULTS AND DISCUSSION
For an initial concentration of 5.5xlO-1 molL-1 (Figure 4.28), the enrichment is
most important between 60 and 120 seconds, eventually going back to a value of 1 after
180 seconds. For lower initial concentrations (Figures 4.29 and 4.30), the ratio does not
go back to a value of 1 within the experimental time frame (5 minutes and 8 minutes
respectively). If these experiments were to be carried out for longer times, D-ASN would
eventually crystallize and the ratio of concentrations of L-ASN vs. D-ASN would
eventually reach the equilibrium value of 1 assuming that no metastable situation arises
under the experimental conditions.
The minimum ratio of the concentration of L-ASN vs. D-ASN occurring during
the crystallization process increased as the initial solute concentration was reduced (Table
4.7). This is due to the fact that at low initial concentrations, the unseeded enantiomer
remained in solution for longer periods of time which in tum allowed the seeded
enantiomer to crystallize on its own for longer periods of time.
Table 4.7: Effect of the Initial Solute Concentration on the Minimum Concentration Ratio and the Time at which the Minimum Concentration Ratio Occurs in a Racemic Solution at 298 K (18 g L-ASN seeds L-1
)
Initial Concentration (moIL- 1) 9.0xlO-1 5.5xl0-1 3.9xlO-1 2.4xlO-1
Minimum Concentration Ratio 0.40 0.52 ~0.66 ~ 0.77 Time of Minimum Concentration Ratio (min) 1 2 ~5 ~8
ln addition, the time at which this minimum ratio is reached is shortened as the
initial solute concentration is increased (Table 4.7). As can be seen in Figure 4.29 and
Figure 4.30, the concentration ratio did not go back to a value of 1 for the two
experiments with lower initial concentration because the unseeded D-ASN did not
92
Page 117
CHAPTER 4: RESULTS AND DISCUSSION
crystallize during the experimental timeframe. Thus, the minimum concentration ratios
and the time at which they occur cannot be determined for the se sets of experiments.
The results suggest that solids that are obtained in the initial stages of the
experiments, before the crystallization of D-ASN, are essentially pure L-ASN. In order to
test this, a racemic solution of ASN with initial concentrations of9.0xlO-1 molL-1 for both
enantiomers was seeded with L-ASN and the crystal composition was monitored (See
Chapter 3). The same experiment was performed with concentrations of 5.5xlO-1 molL-1
for both enantiomers. As seen in Figure 4.31, in both cases, the crystals are initially pure
L-ASN. When the initial concentration is 9.0xlO-1 moIL-1, D-ASN starts crystallizing
after 60 seconds and the crystals are no longer pure. The composition tends toward a
racemic crystal phase. At the lower initial concentration, D-ASN remains in solution
longer. The crystal composition starts shifting towards a racemic composition after 120
seconds.
100 • --";fl. "0 80 .§. c 0 :w 60 u oS Z 40 fi)
Racemic Crystals
CC ...J
20
0 0 20 40
• •
60 80 100 t (s)
•
120
... ~ ...
.6.lrilli~~~~~entr~tio~-0.91 mol/1..1
.lnitia~con~entrat~()n!l~5 rl10I/,=-I'
140 160 180 200
Figure 4.31: Variation of the Crystal Phase Composition during the Separation of L-ASN and D-ASN in a Racemic Mixture at 298 K (18 g L-ASN seeds L- I
)
93
Page 118
CHAPTER 4: RESUL TS AND DISCUSSION
If one were to stop the crystallization process in the tirst case after 60 seconds and in
the second case after 120 seconds, the crystalline phase collected would be pure L-ASN.
The trend is identical to that of the concentration ratio (Table 4.7).
Temary diagrarns are a convenient way of presenting concentration data for
separation experiments. Figures 4.32, 4.33, 4.34 and 4.35 present the data for the
separation experiments for a racemic mixture of ASN at 298 K with initial concentrations
of both enantiomers of 9.0xl0-I moIL-I, 5.5xl0-1 moIL- I
, 3.9xl0-1 molL-1 and 2.4xl0-1
molL-1 respectively. On aIl diagrams, the initial point is that of highest concentration in L-
ASN and D-ASN.
~ /
\" / ... / " ,.., -----------------.--\<-.. --7~':::--··-------------
'X/ .... / "
i. / \ g \ -- ...............• ;/-'\;;'.
\ / '9 / \ // :\ / ....... ;~/~~o .. E~i
/ . 1 \ /Î \ // \ / \
0,0500 ....,......---y--~/_-r----'\>f-/_--r---_\+/_/ ---r--~ 0.95
0.0000 0.0125 0.0250 0.0375 0.0500
D-ASN (mol fraction)
Figure 4.32: Separation ofL-ASN from a Racemic Mixture at 298 K (CL-ASN, 0 = 9.0 X 10⁻¹
moIL-I, CD-ASN,O = 9.0 X 10⁻¹ moIL-I
, 18 g L-ASN seeds L- I)
94
Page 119
CHAPTER 4: RESULTS AND DISCUSSION
D-ASN (mol fraction)
Figure 4.33: Separation ofL-ASN from a Racemic Mixture at 298 K (CL-ASN, 0 = 5.5 X 10⁻¹
moIL-I, CD-ASN,O = 5.5 X 10⁻¹ moIL-I
, 18 g L-ASN seeds L- I)
\\ / "\ 1/
............. \ ..... \\\ /1
. / v /\
/ \ // '\
··················/············)8···· 1 0\ / \\/ .. / \AI / 0 /
/ 0 / / \ / --- - --- -", - - t \ ··············1·············· '_'h" ••• , ••••••••• _.-............ _ ••• _ ••..••• - ..
1 \ / \ / \ j/ \.
/ \ / \\ / \." \.
/ \ / \\ / 0.020 'f------,.....---"~/ _---.. __ '*I __ ..--_-+-I ---r--~ 0.98
0.000 0.005 0.010 0.015 0.020
L-ASN (mol fraction)
Figure 4.34: Separation ofL-ASN from a Racemic Mixture at 298 K (CL-ASN, 0 = 3.9 X 10⁻¹
moIL- I, CD-ASN,O = 3.9 X 10⁻¹ moIL- I
, 18 g L-ASN seeds L- I)
95
Page 120
CHAPTER 4: RESULTS AND DISCUSSION
/ 1
/ /
1 /
\. / ......... , .... _~. '-_0'-":>, ..... _ ......... __ .... / .•........•
\\ / , 1
\." / X
/ \
.mmmi ..>~\" ....................L. \/1 '\\ ;1
1
\1 \1 1\ 0 /\ /
.........../-\;. "(). . /'\ "/-l '\CP,I \ Il
/ \f 1 \ / 0.01 00 'f-----r---~---r"------.,;+--_+_-----îf__--T-----+" 0.99
0.0000 0.0025 0.0050 0.0075 0.0100
D-ASN (mol fraction)
Figure 4.35: Separation ofL-ASN from a Racemic Mixture at 298 K (CL-ASN, 0 = 2.4 X 10⁻¹
moIL-1, CD-ASN, 0 = 2.4 X 10⁻¹ moIL-1
, 18 g L-ASN seeds L-1)
It must be noted that in aIl cases, the initial point is a nearly perfect racemic
mixture. On Figure 4.34 and Figure 4.35, the slight deviation from the racemic mixture is
due to experimental error. The solution composition moves from a racemic mixture at
high concentration (lowest point on the diagrams) in the direction of a saturated racemic
mixture (tip of the solubility curve) in a curved path. The curved path illustrates the
enrichment of the liquid and sol id phases in one of the enantiomers caused by the
difference in the crystaIlization rates of the two enantiomers.
InitiaIly, in aIl cases the seeded enantiomer L-ASN crystallizes much earlier than
D-ASN giving rise to the trajectories shown (curving towards the right). The shifting
composition of the solution shows that it becomes poorer in L-ASN (and consequently
96
Page 121
CHAPTER 4: RESULTS AND DISCUSSION
richer in water and D-ASN). Eventually, because D-ASN also crystallizes, a racemic
solution is obtained.
It must be noted that, since the mol fractions of L-ASN and D-ASN are small
compared to the solvent (water), the diagrams are truncated to only show a small region
of the composition triangle. In consequence, the reduction in the mol fraction of L-ASN
appears to be moving paraUe1 to the tie lines for D-ASN when in reality it is moving on a
straight line away from the L-ASN apex (truncated on the diagrams).
The dotted curve near the water apex represents the solubility curve for ASN at
298 K. If the experimental systems were allowed to reach equilibrium conditions, the
composition of the solution at 298 K would lie on the solubility curve. On Figure 4.32
and 4.33, when the mol fraction of L-ASN reaches approximately 9.0xlO-3 and 6.0xlO-3
respectively, a shi ft occurs in the crystallization curve. It is at this tuming point that the
crystallization rate of D-ASN becomes greater than that of L-ASN. The composition of
the solution then starts shifting towards a decrease in D-ASN. For the last data points on
Figure 4.32 and 4.33, the solution is back to being racemic although not saturated yet. If
the solutions were allowed to crystallize further, the concentration would reach the
equilibrium value at 298 K on the solubility curve.
It has been shown that the crystallization rates of L-ASN and D-ASN can be
manipulated independently of each other to a certain extent by the addition of seeds. The
difference in crystallization rates obtained can be used for enriching the liquid phase or
solid phase in either L-ASN or D-ASN (see Figures 4.24, 4.28, 4.29 and 4.30).
97
Page 122
CHAPTER 4: RESULTS AND DISCUSSION
4.4.1.2 Non-Racemic Mixtures
A further development of the principles discussed above involves modifying the
initial concentration of the enantiomers independently, thus obtaining non-racemic
solutions. To demonstrate that it was possible to separate enantiomers in a non-racemic
solution, experiments were performed using a solution of 9.OxlO-1 molL-1 of L-ASN and
5.5 X 10⁻¹ molL-1 of D-ASN. The solution was seeded with 18 gL-1 of L-ASN and
crystallized at 298 K. The results are presented in Figure 4.36. As can be seen, the
introduction of L-ASN seeds promoted the crystallization of L-ASN whereas D-ASN did
not crystallize.
--
1.0E+OO -.-----.-.-.... -... -----.-.-.---... -.---.-......... -.... -... ---.-
9.0E-01
8.0E-01
7.0E-01 -:..J (5 6.0E-01 •
.§. 5.0E-01 Z en 4.0E-01 ~
3.0E-01 .
2.0E-01 .
1.0E-01
•
O.OE+OO +-------,------------,-------------1
o 0.5 1.5 2 t (min)
Figure 4.36: Separation ofL-ASN and D-ASN in a Non-Racemic Mixture at 298 K (CL-ASN,O = 9.0 X 10⁻¹ moIL-I
, CD-ASN,O = 5.5 X 10⁻¹ moIL-I, 18 g L-ASN seeds L- I
)
2.5
The crystals produced were therefore virtually pure L-ASN. In addition, since the
concentration of D-ASN was relatively low, its induction period was longer and allowed
98
Page 123
CHAPTER 4: RESULTS AND DISCUSSION
for a longer crystallization time during which only L-ASN crystallized. The separation of
enantiomers in non-racemic solutions is further discussed in the context of process design
in the next section.
4.4.2 Development of the Separation Process
Since the separation of L-ASN from D-ASN in a mixture has been demonstrated
to be possible in principle, the present section will deal with the quantification of the
separation process. The crystallization conditions will be studied with respect to
separation results which will be evaluated in terms of the purity of the separated
compounds (or extent of the separation) and amounts separated.
From the results presented in Section 4.4.1, a separation strategy has been formulated.
The objectives will be two-f01d:
Crystallize the seeded enantiomer as much and as quickly as possible
and,
Keep the unseeded enantiomer in solution as much and for as long as possible.
It is c1ear that the above statements are opposing. Factors that will make one
enantiomer crystallize faster (such as higher initial supersaturation or faster mixing) will
also tend to make the other enantiomer crystallize as fast (see Sections 4.2.1, 4.3.2 and
4.2.3). These opposing trends are c1early illustrated in Figure 4.37. To increase the
crystallization rate of one enantiomer, it is possible the raise the initial supersaturation.
However, the induction period becomes shorter (for both enantiomers) and the other
99
Page 124
CHAPTER 4: RESUL TS AND DISCUSSION
enantiomer will remain in solution for a shorter period of time. Sorne factors (such as the
addition of one type of seeds, the amount and time of seeding) will not affect both
enantiomers (see Section 4.3.1).
1.8E+00 ----------------------------------------------------------------------------------- 45 -:5 1.6E+OO E
-:.J 1.4E+OO ë5 g 1.2E+OO .s ~ 1.0E+OO c .g 8.0E-01 ~ ~ 6.0E-01 1/1 ~ 4.0E-01 o
•
--o
o
-40
35 -c -- 30 :§.
" 25·g ~
20 c o +1
15 g " 10 .5
>< ~ 2.0E-01. 5
O.OE+OO -1--___ ~--o-~~.::..o-~__,_~'------",*-.,=--:;:::---:;:::--=-=:--=-=-::.:..-:.:::;::!II'-----+ 0
o 2 3 4 5 6 Initial Supersaturation 50
Figure 4.37: Opposing Effects of the Initial Supersaturation on the Maximum Crystallization Rate and the Induction Period ofL-ASN (298 K, No Seeds)
A balance , between crystallizing one enantiomer rapidly and keeping the other
enantiomer in solution has to be found. Figures 4.23, 4.25, 4.26 and 4.27 further illustrate
the different situations arising. As the initial concentration of L-ASN and D-ASN
increases (from 2.4xlO-1 molL-1 to 9.0xlO-1 moIL-1), the induction period for D-ASN
decreases and therefore D-ASN remains in solution for shorter periods of time. At the
same time, L-ASN crystallizes faster, possibly giving rise to larger amounts of separated
compounds.
The phenomenon can also be observed on the temary diagrams for the same
experimental conditions (Figure 4.32, 4.33, 4.34 and 4.35). As long as the reduction in the
100
Page 125
CHAPTER 4: RESULTS AND DISCUSSION
mol fraction of L-ASN is done by moving away from the L-ASN apex in a line as straight
as possible, little or no D-ASN is crystallized. When there is a shift in the crystallization
curve, D-ASN starts crystallizing and the separation of the enantiomers no longer occurs.
It therefore appears that there is an "optimal" time at which the crystallization should
be stopped. Before this time, mostly the seeded enantiomer crystallizes. After this time,
the unseeded enantiomer starts crystallizing. Crystals produced before and up to the
"optimal" crystallization time are relatively pure in the seeded enantiomer. The concept
of optimal time was illustrated in Section 4.4.1 and in Figure 4.31.
Among the system and process parameters studied above, the amount of seeds does
not affect the crystallization rate of the unseeded enantiomer in a racemic solution.
However, a larger amount of seeds accelerates the crystallization of the seeded
enantiomers. The amount of seeds will therefore be kept at its maximum value of 18 gL-1
for developing the separation process.
The seeding time has also no effect on the unseeded enantiomer. In contrast, an earlier
seeding favours the crystallization of the seeded enantiomer. The seeds will therefore be
added as early as possible for subsequent work.
Finally, the mixing speed does affect the crystallization rate of both the seeded and
unseeded enantiomer. However, it does not promote the crystallization of the unseeded
enantiomer at the early stages of crystallization (Figure 4.22). On the other hand, during
that same period, it significantly accelerates the decrease in supersaturation of the seeded
enantiomer (Figure 4.21). It will therefore be kept at the maximum value for the
subsequent development work.
It is now clear that the available variables for optimization are the initial
supersaturation and the duration of the crystallization process. Their effect is more
101
Page 126
CHAPTER 4: RESUL TS AND DISCUSSION
complex and will be examined in the context of separation below. In the first set of
experiments, a solution of racemic ASN with initial concentration of both enantiomers of
9.0xlO-1 molL-1 was seeded with L-ASN seeds. It must be noted that the supersaturation
created upon cooling is the same for both enantiomers. The amount of seeds was kept at
18 gL-1, the time of seeding was the earliest (immediately as the beginning of the cooling
phase) and the mixing speed was at its maximum value. The crystallization time was
limited to 1 minute. The value was chosen in order to avoid any crystallization of D-ASN
(see Figure 4.5 or 4.14 for example). The results are presented in Figure 4.38. Under such
conditions, virtually no D-ASN is crystallized. Therefore, the crystals are composed
almost exc1usively ofL-ASN.
1.0E+00----·---··--------·--··---.
9.0E-01
8.0E-01
7.0E-01
~ 6.0E-01
.5. 5.0E-01 Z en 4.0E-01 $
3.0E-01
2.0E-01
1.0E-01
•
8
'0 L-ASrv : 1_ D-ASN 1
c .•.. _____ 'J O.OE+OO +-----------,-----------,..------..,---------j
o 0.2 0.4 0.6 0.8 1.2
t (min)
Figure 4.38: Separation of L-ASN and D-ASN in a Racemic Mixture at 298 K (CL-ASN,O = 9.0 X 10⁻¹ moIL-1
, CD-ASN,O = 9.0 X 10⁻¹ moIL-1, 18 g L-ASN seeds L-1
)
102
Page 127
CHAPTER 4: RESULTS AND DISCUSSION
As was shown in section 4.4.1.2, the use of non-racemic mixtures allowed for longer
crystallization time because the non-seeded enantiomer was at a lower initial
supersaturation and thus remained in solution for longer.
Separation experiments similar to the one described above were carried out with
different non-racemic solutions. Figure 4.36 presented the results for initial concentration
ofL-ASN of9.0xlO-1 molL-1 and initial concentration ofD-ASN of 5.5xlO-1 moIL-I.
This was the equivalent of a racemic mixture at 5.5xlO-1 molL-1 for both
enantiomers with a 3.6xl0-1 molL-1 excess in L-ASN. In this case, the lower
concentration in D-ASN allowed the crystallization process to go further (2 minutes)
without any crystallization of D-ASN. Figure 4.39 illustrates the results of a different
experiment in which the initial concentration of L-ASN remains the same at 9.0xlO-1
molL-1 whereas the initial concentration ofD-ASN is much lower (3.0xI0-1 moIL- I).
1.0E+OO
9.0E-01
8.0E-01
7.0E-01
-----...... -----.. - .. -.--.. -.... - .. -.-.-... -... - ... -.-.-.--..... -..... -------r--=:l
iOL-ASN! 1
-. ~:.J ë5 6.0E-01 E - 5.0E-01 Z-en 4.0E-01 . ~
3.0E-01
2.0E-01 ..
1.0E-01
• • o e
O.OE+OO .\-------,.----------,------r------,.-----1
o 2 3 4 5 6
t (min)
Figure 4.39: Separation of L-ASN and D-ASN in a Non-Racemic Mixture at 298 K (CL
ASN,O = 9.0 X 10⁻¹ moIL-I, CD-ASN,O = 3.0 X 10⁻¹ molel
, 18 g L-ASN seeds L-1)
103
Page 128
CHAPTER 4: RESULTS AND DISCUSSION
This is equivalent to a racemic solution at 3.0xlO-1 molL-1 for both enantiomer
with a 6.1xl0-1 molL-1 excess in L-ASN. This allows the crystallization process to go on
for 5 minutes without crystallizing any D-ASN. A comparison of the results for the three
above-mentioned conditions is presented in Table 4.8.
Table 4.8: Effect of the Initial Concentrations of the Enantiomers on the Separation of LASN and D-ASN in a Racemic Solution at 298 K (18 g L-ASN seeds L- I
, Max Mixing Speed)
Initial Concentration D-ASN (molL-1) 9.0xl0-1 5. 5x1 0- 1 3.0xl0-1
Excess L-ASN (molr') 0 3.6x10-' 6.1xl0-' Total Amount ofL-ASN Crystallized (moIL- 1
) 5.3xlO-1 6.lxl0- 1 6.8xIO- 1
Production Rate ofL-ASN (moIL-lmin- 1) 5.3xl0-1 3.lxl0-1 1.4xlO-1
It is clear that as the initial concentration in D-ASN is lower, D-ASN remains in
solution for a longer period of time and therefore a larger amount of pure L-ASN can be
crystallized. At 9.0xl0-1 moIL- I, 5.3xl0-1 molL-1 ofL-ASN are crystallized, as opposed to
6.8xl0-1 molL-1 ofL-ASN when the initial concentration ofD-ASN is at 3.0xlO-1 moIL-I•
However, the extra amount of L-ASN is crystallized under conditions of low
supersaturation and low crystallization rate. This is visible when one looks at the
production rate which drops from 5.3xlO-1 to 1.4xl0-1 moIL- I• If the excess L-ASN is
subtracted, the difference is even more important (Table 4.9).
Table 4.9: Net Effect of the Initial Concentrations of the Enantiomers on the Separation of L-ASN and D-ASN in a Racemic Solution at 298 K (18 g L-ASN seeds L- I
, Max Mixing Speed)
Initial Concentration D-ASN (molL- 1) 9.0xl0-1 5.5xl0-' 3.0xl0-1
Excess L-ASN (molr') 0 3.6xl0-' 6.1xl0-' Net Amount ofL-ASN Crystallized (moIL-1
) 5.3xlO- 1 2.6xlO- 1 6.4xlO-.l Net Production Rate ofL-ASN (moIL-lmin- 1
) 5.3xlO- 1 1.3xlO-1 1.3xl0-.l
104
Page 129
CHAPTER 4: RESULTS AND DISCUSSION
Here, it is clear that the net amount decreases overall even though the total amount
crystallized (Table 4.8) is larger for lower initial concentration of D-ASN. The total
amount crystallized is artificially inflated by the excess L-ASN present in the initial
solution.
This can also be seen when examining the crystallization process efficiency (Table
4.10) which is defined as the ratio of the net amount of L-ASN crystallized over the net
amount of L-ASN that could be crystallized if the system were to reach equilibrium. The
efficiency eliminates the effect ofthe excess L-ASN.
Table 4.10: Effect of the Initial Concentrations of the Enantiomers on the Efficiency of the Separation Process (298 K, 18 g L-ASN seeds L-1
, Max Mixing Speed)
Initial Concentration D-ASN (moID') 9.0xl0-' 5.5xl0-' 3.0xl0-' Excess L-ASN (moID I
) 0 3.6x10⁻¹ 6.1xl0-1
Net Amount L-ASN Crystallized (moIL-1) 5.3xl0-1 2.6xl0-1 6.4xlO-z
Max. Net Amount ofL-ASN Crystallized (moIL- 1) 7.3xlO-1 3.7xl0-1 1.1xlO-1
Process Efficiency (%) 72.5 69.4 57.1
The crystallization process efficiency is reduced from 72.5% at the highest initial
concentration ofD-ASN to 57.1% when D-ASN is at 3.0xlO-1 molL-1 and there is a large
excess of L-ASN (6.lxlO-1 moIL-1).The interest in having a low D-ASN initial
concentration compared to L-ASN lies in the ability to crystallize L-ASN for a longer
period of time while D-ASN remains dissolved and reaching an L-ASN concentration
closer to the equilibrium solubility (Table 4.11).
105
Page 130
CHAPTER 4: RESULTS AND DISCUSSION
Table 4.11: Effect of the Initial Concentrations of the Enantiomers on the Recovery of the Seeded Enantiomer (298 K, 18 g L-ASN seeds L-1
, Max Mixing Speed)
Initial Concentration D-ASN (moID') 9.0xl0-' 5.5xl0-' 3.0xl0-' Excess L-ASN (moID') 0 3.6xl0-' 6.1xl0-'
Final L-ASN Concentration (molL- 1) 3.9xl0- 1 2.8xlO-1 2.2xlO-1
Crystallizable L-ASN Left in Solution (molL- 1) 2.0xl0- 1 9.6xlO-L 3.9xlO-L
Final L-ASN Supersaturation 2.1 1.5 1.2
The smaller the initial L-ASN excess, the larger the final L-ASN concentration
and the larger the final L-ASN supersaturation. At no excess L-ASN, the amount of L-
ASN left in solution is 2.0xl0-1 molL-1 whereas this drops to 3.9xlO-2 molL-1 for a large
(6.1xlO-1 moIL-1) excess in L-ASN.
If the excess L-ASN were further increased, it would eventually be possible to
crystallize the solution for a time long enough to reach saturation in terms of L-ASN and
to keep all D-ASN initially present in solution.
It is clear from the above results that the initial supersaturation of both enantiomers as
well as the crystallization time can be manipulated in order to develop different
separation schemes. Since separation objectives vary, it is not possible to design one best
separation process. However, the following general rules have been observed:
If the emphasis is put on productivity, it is important to focus on creating
conditions of high supersaturation with little or no excess in the seeded
enantiomer. This will lead to high crystallization rates with short crystallization
time and therefore high productivity. This approach is most suited for bulk,
commodity-type solutes.
106
Page 131
CHAPTER 4: RESULTS AND DISCUSSION
If the emphasis is put on recovery of the compound, a low initial supersaturation
for the unseeded enantiomer with a large excess of the seeded enantiomer should
be used. It will promote large nucleation and growth rates for the seeded
enantiomer as weIl as permit long crystallization times. It will allow for an
extensive separation ofboth enantiomers to the detriment ofproductivity.
It is assumed that in aIl cases, the pure seeded enantiomer is to be recovered. In cases
where very high purity is not needed, longer crystallization time can be used. This will
increase the amount crystallized and reduce the purity of the crystals.
4.4.3 Cyclic Process
In general, when an enantiomeric system is produced through chemical reactions,
both enantiomers are present in the same amounts, leading to a racemic mixture. In this
section, the results of the experiments for a cyclic version of the separation process using
a racemate as the feed will be presented. The semi-continuous nature of this process will
generally allow for a better productivity.
The strategy for the separation process is described graphically in Figure 4.40. The
starting point is a racemate with equal amounts of L-ASN and D-ASN at a concentration
of B. The racemate is then enriched in one of the enantiomers (in this case L-ASN) to
bring the concentration of L-ASN to a value of A while the concentration of D-ASN
remains at a value of B. The solution is then seeded with L-ASN and allowed to
crystallize. As was shown in the previous sections, it is possible to determine the
conditions of initial supersaturation and crystallization time that will permit only the
107
Page 132
CHAPTER 4: RESUL TS AND DISCUSSION
crystallization of the seeded enantiomer (L-ASN) and keep the unseeded enantiomer (D-
ASN) in solution.
--------------------------------------------------------------------------------------------------- l --=- L-ASNj 1
D-ASN, 1 L ____ II
A
1 ---------------1
c 1
o 2 3 time
Figure 4.40: Cyc1ic Separation of L-ASN and D-ASN in a Racemic Mixture (Initial Enantiomeric Excess Equal to the Net Amount Crystallized)
At time 1 (Figure 4.40), the solid phase is filtered out and the crystallization is
stopped by heating up the solution to eliminate any supersaturation condition. The solid
phase is composed almost exc1usively of L-ASN since only L-ASN crystallized. There
may also be very small amounts of D-ASN due to the presence of nuc1ei formed during
the induction period of D-ASN. It is also important to note that the overall concentration
in D-ASN remains constant at B while the concentration of L-ASN is down to a value of
C. After time 1, a certain amount of racemate is added to the solution to bring the
concentration of L-ASN up to a value of B and the concentration of D-ASN up to a value
of A. At this point, the solution has an excess of D-ASN. It is then seeded with D-ASN
and cooled to allow crystallization. At time 2, D-ASN only has crystallized down to a
108
Page 133
CHAPTER 4: RESULTS AND DISCUSSION
concentration of C and L-ASN remained in solution at a constant concentration of B. The
solids are filtered out and consist almost entirely of D-ASN. Again, the presence of very
small amounts of L-ASN is possible due to the nuclei formed during the induction period
of L-ASN. The crystallization is then stopped by heating up the solution. Upon addition
of racemate, the solution concentration can be brought back to the initial conditions of
excess L-ASN (concentration value of A) and D-ASN at a concentration of B.
The two consecutive crystallization phases (the first one for L-ASN and the
second one for D-ASN) constitute one cycle. The process can be repeated at often as
necessary and uses racemic mixture as its feed. Only a certain amount of pure enantiomer
must be available for the creation of the excess in one enantiomer for the first
crystallization phase and first two seedings. Seeds for subsequent crystallization can be
sampled from the filtered solid phases.
A key element for the cyclic process described above lies in the size of the
enantiomeric excess (A-B) with respect to the amount of enantiomer crystallized (A-C). It
is important that the amount of pure enantiomer added to a racemic mixture prior to
crystallization be equal to the net amount of crystals produced or equal to half the total
amount of crystals produced in each crystallization phase. It is also essential that the
amount of racemate added after each crystallization phase is equal to the total amount of
crystals produced. This allows one to use a racemic mixture as the feed.
Figure 4.41 illustrates the situation when the amount of excess L-ASN added
initially and the amount of racemate added subsequently are larger than required. If the
amount of excess L-ASN initially added brings the L-ASN concentration to a value larger
than A, after crystallization, the L-ASN concentration does not go down to a value of C.
After addition of racemate, the concentration of L-ASN will be higher than B and there is
109
Page 134
CHAPTER 4: RESULTS AND DISCUSSION
no guarantee it will remain in solution during the time interval 1-2. The solid phase
produced during this time interval might therefore contain not only D-ASN but also L-
ASN. Similar problems will arise when racemate is added to the solution after time 2.
A
--z Cl'JB ~
c
o 2 time
~L=A~SNi
D-ASN
3
Figure 4.41: Cyclic Separation of L-ASN and D-ASN in a Racemic Mixture (Initial Enantiomeric Excess Larger than the Net Amount Crystallized)
A
1
.. -. -.. ---~J
c
o 2 3 time
Figure 4.42: Cyclic Separation of L-ASN and D-ASN in a Racemic Mixture (Initial Enantiomeric Excess Smaller than the Net Amount Crystallized)
110
Page 135
CHAPTER 4: RESULTS AND DISCUSSION
Figure 4.42 illustrates the situation when the amount of excess L-ASN added
initially and the amount of racemate added subsequently are smaller than required. In this
case, the concentration of L-ASN after time 0 will be smaller than A. Therefore the
amount of L-ASN crystallized will be smaller than expected. A similar situation will arise
when crystallizing D-ASN (1-2 time interval). In addition to producing a smaller amount
of pure crystals at each phase, the concentration of both enantiomers will slowly decrease
with each phase (for example, the concentration of L-ASN does not go back to a value of
B after time 1). This decrease in concentrations will decrease the supersaturation created
upon cooling, therefore reducing crystallization rates and amounts of crystals produced.
The cyclic process illustrated in Figure 4.40 can also be represented on a temary
diagram (Figure 4.43).
Water
Figure 4.43: Cyclic Separation of L-ASN and D-ASN in a Racemic Mixture (Initial LASN Excess Equal to the Net amount Crystallized, Mol Fractions)
111
Page 136
CHAPTER 4: RESULTS AND DISCUSSION
The starting composition for the separation is a racemic mixture located at point R
on the diagram. The initial L-ASN excess is added, moving the composition to point W
(straight line towards the real apex for L-ASN, not visible on the truncated diagram).
Upon seeding and crystallization of L-ASN, the composition moves away from the L
ASN apex to point X. It is important to note that the distance between points R and W
(excess L-ASN) is equal to the distance between R and X (net L-ASN crystallized). The
pure L-ASN crystals are then removed and, the crystallization is stopped and racemic
mixture is added. The composition of the solution goes to Y (excess D-ASN). The second
crystallization can then start upon seeding with D-ASN and cooling. The composition of
the solution moves away from the D-ASN apex towards point Z. The pure D-ASN
crystals are then removed, racemic mixture is added and the composition of the solution
is brought back to point W. The separation can be carried out over as many cycles or
crystallization phase as necessary. Pure L-ASN and pure D-ASN being produced
altematively in amounts equal to the amount of racemic mixture added at each phase.
The residual supersaturation curves (introduced in Section 2.5.2.2) can be used for
designing the separation process. Residual supersaturation curves for seeded and
unseeded ASN are presented in Figures 4.44 and 4.45 respectively. These curves were
obtained from data such as presented in Figures 4.23, 4.25, 4.26 and 4.27. For seeded
ASN, the isochrones are almost paraUel to each other i.e. even though the crystallization
rate increases with higher initial concentration (and initial supersaturation), the final
concentration after a fixed crystallization time is the same. The residual supersaturation
curves for unseeded ASN have a more classical shape, with a faster decrease in
supersaturation for higher initial concentrations and supersaturations.
112
Page 137
CHAPTER 4: RESULTS AND DISCUSSION
8.8E-01 ~
~ 7.8E-01 E ~ 6.8E-01 o
;0:1
.s 5.8E-01 c CIl u 54.8E-01 o ~ 3.8E-01 ct:
2.8E-01
t= 0
• t= t55 1
.............•..•...............................• t=305
.t=4551
.•••••••...•.•..•.•..••....•• j;: ~~: ••. •.• •. ·.• •. ·.i •••••••.•••••••••...•.••••••••••••••.•.•.•••.•.•.•.•.•.•.••••••• !~~7~ . 1.8E-01 ~--l"'-----,----.,-----,-------,---....,...-----,----..,.-----l
1.8E-01 2.8E-01 3.8E-01 4.8E-01 5.8E-01 6.8E-01 7.8E-01 8.8E-01 9.8E-01 Initial ASN Concentration (moll·1)
Figure 4.44: Residual Supersaturation Curves for Seeded ASN at 298 K
9.8E-01 ,...-------------.-----------.------------.-------,
8.8E-01 --':.J '07.8E-01 §. 56.8E-01
;0:1
.s 5.8E-01 c CIl
g 4.8E-01 o o z 3.8E-01 CI)
ct: 2.8E-01 '. oS t = 180 s
t = 0 t = 15 f= 30 s t = 45 5
t = 60 s
........... ::: .... '.
.... ::::. t=90s • t = 1205
1.8E-01 ~----,----.,__--__,_------,---_------,_----i
1.8E-01 2.8E-01 3.8E-01 4.8E-01 5.8E-01 6.8E-01 7.8E-01 8.8E-01 9.8E-01 Initial ASN Concentration (moll·1)
Figure 4.45: Residual Supersaturation Curves for Unseeded ASN at 298 K
Both sets of residual supersaturation curves can be used to determine what initial
concentration for the racemic mixture and what initial excess of one enantiomer are suited
for a cyc1ic process.
113
Page 138
CHAPTER 4: RESULTS AND DISCUSSION
An example is given here: The racemic solution to separate has a concentration of
8.3xlO-1 molL-1 for both L-ASN and D-ASN. If 7.5xlO-2 molL-1 of L-ASN are added to
create an initial excess, the initial concentration ofL-ASN becomes 9.0xlO-1 moIL-I• Thus
the total amount ofL-ASN crystallized must be 1.5xl0-l molL-1 (twice the initial excess).
The concentration of D-ASN remains at 8.3xl0-l molL-1 while the concentration of L-
ASN drops to 7.6xlO-1 moIL-I• In order to crystallize a seeded solution of L-ASN from
9.0xlO-1 molL-1 to 7.6xlO-1 moIL-I, the crystallization time must be approximately 15
seconds according to Figure 4.44. During this crystallization time, an unseeded solution
of D-ASN at 8.3xlO-1 molL-1 will not crystallize according to Figure 4.45. Therefore such
a separation process can be used in a cyclical way, crystallizing 1.5xlO-1 molL-1 of pure
crystals per crystallization phase. Experiments were carried out to verify the concept of
cyclic separation. A 2.7xl0-1 molL-1 excess ofL-ASN was added to a racemic solution of
L-ASN and D-ASN with concentrations of6.4xl0-1 molL-1 for both enantiomers.
1.0E+OO·
~ 8.0E-01 ~ "0 E -:: 6.0E-01 Z UJ ~ 4.0E-01
2.0E-01
• J'L.
1
o o
r ...- .- .-e •
• 1
O.OE+OO 1---___ ---------_------_---_------< R w x y
time z w
Figure 4.46: Cyclic Separation of L-ASN and D-ASN at 298 K (CDL-ASN,O = 6.4 X 10⁻¹
moIL-I, Excess L-ASN = 2.7 x 10⁻¹ moIL-I
, 18 g seeds L- I, Max Mixing Speed)
114
Page 139
CHAPTER 4: RESULTS AND DISCUSSION
The starting composition was 9.0xlO-1 molL-1 for L-ASN and 6.4xlO-1 molL-1 for
D-ASN. The crystallization time was set at 1 minute (interval WX and YZ in Figure
4.46). Figure 4.44 shows that in 1 minute, the seeded enantiomer would crystallize and
reduce its concentration from 9.0xlO-1 to 3.8xlO-1 moIL-I• It is important to re-emphasize
that the total amount of ASN crystallized in one crystallization phase (5.3xlO-1 moIL-I)
must be equal to twice the initial excess added (2.7xl0-1 moIL-I). It was also verified that
the unseeded enantiomer would remain in solution at a concentration of 6.4xl 0-1 moIL-I•
Figure 4.46 presents the results for the design of the process and the experimental data
points. It is clear that the experimental points are relatively close to their predicted values.
It was possible to crystallize the predicted amount (5.3xlO-1 moIL-I) of pure crystals
during each crystallization phase (WX and YZ). It was also possible to add the correct
amount of racemate at points X and Z to obtain the required pre-crystallization
composition. The same results can be presented in temary diagram form (Figure 4.47).
The changes in composition due to crystallization of L-ASN (WX) and D-ASN (YZ) as
well as the input of racemate (XY and ZW) are clearly shown on this type of graphical
representation.
The composition of the crystals obtained as weIl as the equivalent productivity and
efficiency of the process are listed in Table 4.12 below.
Table 4.12: Results of the Cyclic Separation of L-ASN and D-ASN (298 K, Racemic Concentration 6.4xlO-1 moIL- I
, Excess L-ASN 2.7xl0-1 moIL- I, Seeds 18 gL-I
, Max Mixing Speed)
Purity ofL-ASN Crystals (wt% or mol%) 95.8 Purity ofD-ASN Crystals (wt% or mol%) 97.7
Productivity of the Crystallization Phase (moIL-lmin-l) 5.3xlO-1
Process Efficiency (%) 73.1
115
Page 140
CHAPTER 4: RESULTS AND DISCUSSION
0.0500 'f---....-----+--......---+-/---.--~\+_-__,_--....y 0.95 0.0000 0.0125 0.0250 0.0375 0.0500
~~N D~N
Figure 4.47: Cyc1ic Separation of L-ASN and D-ASN at 298 K (CDL-ASN,O = 6.4 X 10⁻¹
moIL- I, Excess L-ASN = 2.7 x 10⁻¹ moIL- I
, 18 g seeds L- I, Max Mixing Speed, Mol
Fractions)
The crystals produced were found to have purity in excess of 95%. It is expected
that higher purities can be obtained using lower crystallization rates (lower
supersaturations and longer crystallization times).
The productivity of the crystallization phases was around 5.3xlO-1 moIL-lmin-l.
Since the cyc1ic process involves operations (e.g. addition of racemate after
crystallization) different from a c1assical one-pass crystallization as described in 4.3.2,
only the crystallization phase's productivity can be compared. Similarly, the process
efficiency in this case is not the same as for a c1assical separation process since excess
enantiomer is added only for the first crystallization phase.
116
Page 141
CHAPTER 4: RESULTS AND DISCUSSION
In the case of cyclic separation, the efficiency is defined as the ratio of the total
amount of crystals produced during one crystallization phase over the maximum total
amount of that enantiomer crystallized if the system were to reach equilibrium.
It must be emphasized that the design of a separation process using the methods
described above is entirely dependent on the requirements for the product in terms of
purity, quantity, productivity and recovery desired. The guidelines given at the end of
Section 4.4.2 should prove useful in designing the appropriate separation process for a
specifie application.
4.5 Modeling of the Crystallization and Separation Process
During the crystallization process, the two phenomena of nucleation and growth
occur simultaneously. Both phenomena are strongly dependent on supersaturation (among
other factors). However, the effect of supersaturation on the nucleation rate is not the
same as its effect on the growth rate. Since the supersaturation varies during the
crystallization process, the relative importance of nucleation and growth also changes. It
is therefore preferable to model the two phenomena separately. However, in the absence
of satisfactory particle size distribution data, it is not possible to model nucleation. Thus
only the growth rate was modeled in Section 4.5.1. The two phenomena can be modeled
together - but with less accuracy - under specifie experimental conditions. This was
attempted in Section 4.5.2.
117
Page 142
CHAPTER 4: RESUL TS AND DISCUSSION
4.5.1 Nucleation and Growth Rate
During crystallization and separation experiments, concentration was measured vs.
time. Since the cooling of the crystallizer tubes was very rapid (See Chapter 3), it can be
safely assumed that the temperature in the tube remained constant at the crystallization
temperature after the start of the experiment. For that reason, supersaturation can be
calculated from concentration and crystallization temperature data such as the ones shown
in Figure 4.23 for example.
The size and number of crystals in the tube were also investigated in order to
obtain a particle size distribution. Results were not reliable in the small particle size
range. This range is of particular importance for rapid and short crystallizations, as in the
present case, since a large number of nuclei and small crystals are expected. It was
therefore not possible to model the nucleation and growth processes independently.
Using the assumption that little or no nucleation occurs at lower supersaturations
and that growth is the main phenomenon involved in the reduction of supersaturation,
experimental data of supersaturation vs. time can be fitted to a growth rate equation. The
growth rate of the particle (rate of increase of the characteristic length of the particle) is
given by:
and,
dL=k sn dt g
(4.1)
(4.2)
118
Page 143
CHAPTER 4: RESULTS AND DISCUSSION
~
'1/1
1.2E-08 ,._ ............. _.-...... - .......................................... - .... -............................ - ...................... _-..................................... -......... -.-........................... -.-..... --.--.-,
1.0E-08 p ...
8.0E-09
E =- 6.0E-09
~ "CI
4.0E-09
2.0E-09 o ..tJ
o kg = 1.61E-09 rn.s·1
n = 8.8
R2 = 0.977
O.OE+OO .f-------,------,----...,-----,----.,---.....,-----I
O.OE+OO 1.0E+OO 2.0E+OO 3.0E+OO 4.0E+OO 5.0E+OO 6.0E+00 7.0E+00 Sn
Figure 4.48: Growth Rate of L-ASN at 298 K (so = 1.3, 18 g L-ASN seeds L-1, Max
Mixing Speed)
-
2.0E-07
1.8E-07
1.6E-07
1.4E-07
':"1/1 1.2E-07 E =- 1.0E-07
"CI ::J 80E-08 "CI .
6.0E-08 .
4.0E-08
2.0E-08 .. ·0
------_.-_. __ ... _-----
o
o
.··0
kg = 3.14E-09 rn.s·1
n = 3.7
R2 = 0.930
O.OE+OO .1---=.0_ .. _0 __ ----...,---------------,---------4
O.OE+OO 1.0E+01 2.0E+01 3.0E+01 sn
4.0E+01 5.0E+01 6.0E+01
Figure 4.49: Growth Rate of L-ASN at 298 K (so = 5.0, 18 g L-ASN seeds L-1, Max
Mixing Speed)
The equation parameters kg and n can then be deterrnined. Figures 4.48 and 4.49
show the results for one set of experiments with low initial supersaturation (1.3) and one
119
Page 144
CHAPTER 4: RESULTS AND DISCUSSION
set of experiment with a higher supersaturation (5.0), respectively. In both cases, the data
lie on a relatively straight line. There is slightly more scatter in the case of higher initial
supersaturation (Figure 4.49). This is probably due to the larger effect of nucleation,
which is more important under conditions ofhigh supersaturation. For both sets of data, it
is clear that if only lower supersaturation points were taken (lower sn on Figures 4.48 and
4.49), the fitted line would have had a smaller slope. Since nucleation is not as important
at low supersaturation, these regions on the charts represent more correctly the growth
phenomenon. A smaller slope would mean a smaller rate constant kg. It is possible to
conclude that the growth rate constant for L-ASN under the given conditions is
approximately 1. 61 x 10-9 ms -1. It is also safe to confirrn that the real rate constant is
probably below this value. The value of the apparent order of the process, n, is to be taken
cautiously due to its high sensitivity to scatter.
4.5.2 Desupersaturation Rate
Since the effect of nucleation and growth on the reduction of supersaturation
cannot be completely isolated, it is possible to model them in combination in a
desupersaturation rate with an equation of the type:
r =-k sn ,l~ dfi (4.3)
and,
120
Page 145
CHAPTER 4: RESULTS AND DISCUSSION
(4.4)
The desupersaturation rate as defined above takes into account both growth and
nuc1eation which are both dependent on the supersaturation of the system. In addition to
the experimental conditions such as the amount of seeds or the mixing speed, the
desupersaturation rate constant is dependent on the initial conditions of supersaturation of
the system.
Figures 4.50 to 4.53 present the data points for 4 different sets of experiments with
initial supersaturation varying between 1.3 and 5.0. The fit is relatively good with the data
points lying on a straight line and R2 values ranging between 0.938 and 0.984. The
desupersaturation rate constants kds have values in the range 4.23 x 10⁻⁴ S-I to 9.44 X 10⁻⁴
S-I and the apparent rate constant n varies between 3.2 and 3.9.
5.0E-02 ._---~-_ .. --------.--.----.----... ---------.-.-.-- .. --- ... ----.. ---.--.·------·---··---~~~-4-.2-5~~04 5-
1
1
O.OE+OO n = 3.5 1
ê -5.0E-02 1 .... ~ ~C> -1.0E-01 'fi
t;:
-.!!. -1.5E-01
-2.0E-01
o R2 = 0.938
..... Q
"'0.
o
-2.5E-01 +---r---...,-----,------~----r--__r--_,_--..,...----1
o 50 100 150 200 250
t (s)
300 350 400 450 500
Figure 4.50: Desupersaturation Rate of L-ASN at 298 K (so = 1.3, 18 g L-ASN seeds L -l,
Max Mixing Speed)
121
Page 146
CHAPTER 4: RESULTS AND DISCUSSION
2.0E-02 r· .. ·······.···.· .... -· .. ·.·---.····------···.···-··· ........... - ................. --.................. --.--... - .... - .... --.-.. --............... --.. -------.. -.-.. -----,
O.OE+OO
-2.0E-02
ê ~ -4.0E-02 ::;: ~o -6.0E-02 ~
~.!!!. -8.0E-02
-1.0E-01
-1.2E-01
-1.4E-01
o
"0.
o 50 100 150
o'···.
à··.
200 250
t (5)
kds = 4.23E-04 5.1
n = 3.9
R2 = 0.974
"0
300 350
Figure 4.51: Desupersaturation Rate of L-ASN at 298 K (so = 2.3, 18 g L-ASN seeds L- I,
Max Mixing Speed)
2.0E-02 ,-----------.-------.-.-----
O.OE+OO
-2.0E-02
__ -4.0E-02 c i:. -6.0E-02 -ê'
':'0 -8.0E-02 ~
li' -1.0E-01 -1/1
-- -1.2E-01
-1.4E-01
-1.6E-01
o
O'··. ..... ~
O'·· ..
kds = 9.44E-04 511 n = 3.2 1
R2 = 0.964
o -1.8E-01 -J-----,---,---..,.-----,----,---..,.-------,--........,.-----,---...........j
o 20 40 60 80 100
t (5)
120 140 160 180 200
Figure 4.52: Desupersaturation Rate ofL-ASN at 298 K (so = 3.0,18 g L-ASN seeds L-1,
Max Mixing Speed)
122
Page 147
CHAPTER 4: RESULTS AND DISCUSSION
2.0E-02
O.OE+OO 0 kds = 8.89E-04 S·1
-2.0E-02 0 n = 3.7
.-.. -4.0E-02 '-0. R2 = 0.984 c "0. t -6.0E-02 ::::.. .! -80E-02 '" . 0 fi)
1
-1.0E-01 li' ... .!!!. D· ..
-1.2E-01
-1.4E-01
-1.6E-01 '·0
-1.8E-01
0 20 40 60 80 100 120 140 160 180 200
t (5)
Figure 4.53: Desupersaturation Rate ofL-ASN at 298 K (so = 5.0,18 g L-ASN seeds L-1,
Max Mixing Speed)
In comparison, Campbell (2005) reported values of around 0.3 x 10⁻⁴ S-I for
glutamic acid crystallizing under similar experimental conditions. This is in agreement
with the much slower crystallization of glutamic acid observed in the laboratory. The
value of n is not accurate because of the sensitivity to experimental error when using
derivatives.
The decrease in supersaturation measured takes into account both the
nucleation and growth processes and thus the results are expected to be affected by the
initial supersaturation. Normally, the rate constant measured at a constant temperature
should be independent of the supersaturation. In the present case, the change in the
relative importance of nucleation and growth as supersaturation varies makes the rate
constant also dependent on the initial supersaturation. Figures 4.54 to 4.57 present a
comparison between the experimental results and the values of concentration predicted by
123
Page 148
CHAPTER 4: RESULTS AND DISCUSSION
the desupersaturation rate model. The predicted concentrations are relatively close to the
observed concentrations. The agreement between the experimental data and the model is
better at lower initial supersaturations (Figures 4.54 and 4.55). As mentioned before, this
is due to the fact that the model is taking into account two different processes taking place
simultaneously. The nucleation and growth rate are not modeled independently where in
reality the effect of supersaturation is not the same for the two processes.
3.0E-01
2.5E-01 o
-~ 2.0E-01 '0 §.
1.5E-01 ~ z rn <C do 1.0E-01
5.0E-02
O.OE+OO
0 50 100
()
150 200
-0
250
t (5)
300
- -0
350
[-a-Experimental] i - - - Model ! ~._--------'
400 450 500
Figure 4.54: Comparison between Experimental Data Points and Model for L-ASN (T = 298 K, So = 1.3, 18 g L-ASN seeds L- I
, Max Mixing Speed)
For lower supersaturation, the nucleation rate is lower and does not influence the
decrease in supersaturation as much as for higher supersaturations. The induction period
is also difficult to predict. The power-Iaw form of the desupersaturation rate equation
does not allow for a precise modeling of this phenomenon.
124
Page 149
CHAPTER 4: RESULTS AND DISCUSSION
4.5E-0 1 ,.....--..................... -... - ... -............ --.-.. -............. ------... -........... - ..................... - ... --..... -..... -.................. -........ -..... -----.................. -........ -... -.. -..... --.. --.... -... --.------.-,
4.0E-01
3.5E-01
-~ 3.0E-01 "0 .§. 2.5E-01
~ 2.0E-01 ct ~ 1.5E-01 ....
1.0E-01
5.0E-02
o
o
'0---0
o -E~perimentan -- _MOd~_J
O.OE+OO +----.,------,-------,-----,-----,------r-------1
o 50 100 150 200 250 300 350
t (s)
Figure 4.55: Comparison between Experimental Data Points and Model for L-ASN (T = 298 K, So = 2.3, 18 g L-ASN seeds L-I
, Max Mixing Speed)
6.0E-01 ... - .. --------... -.-..... --.-... -... ----.-.. -.... --....... -.... --........ -.---.. - .... -....... --.--.. -... -.----.----.......... --.-.... ----.----.---
5.0E-01 -
~ 4.0E-01 "0 E : 3.0E-01 z
~ 2.0E-01 .... 1.0E-01
o
o o
o o
c i 0 Experimental
L- Model
O.OE+OO +------,------...,.-------:--------~-~---,---___I
o 20 40 60 80 100
t(s) 120 140 160 180 200
Figure 4.56: Comparison between Experimental Data Points and Model for L-ASN (T = 298 K, So = 3.0, 18 g L-ASN seeds L- I
, Max Mixing Speed)
125
Page 150
CHAPTER 4: RESUL TS AND DISCUSSION
1.0E+00 r-··-···········-· .. --·----.... -.. -------·----.. --------·-----------... -.... ---........ --... ------.. --.. --.--------.-------.-.------.--------.----.-.--.---.--.--.-.-.. ------.-.---,,----------.
9.0E-01
8.0E-01
... - 7.0E-01 ~ ~ 6.0E-01
:: 5.0E-01 z ~ 4.0E-01 ..!J ..... 3.0E-01
2.0E-01
1.0E-01
o
à
o o -, - - - ,
0 0 0
jo Experimental
Model O.OE+OO +------_-------------_-~----____1
o 20 40 60 80 100 120 140 160 180 200 t (s)
Figure 4.57: Comparison between Experimental Data Points and Model for L-ASN (T = 298 K, So = 5.0, 18 g L-ASN seeds L-1
, Max Mixing Speed)
126
Page 151
CHAPTER 5: CONCLUSIONS AND RECOMMENDATIONS
Chapter 5: Conclusions and
Recommendations
127
Page 152
CHAPTER 5: CONCLUSIONS AND RECOMMENDATIONS
5.1 Summary and Conclusions
The effects of crystallization temperature, supersaturation, mixing and the addition
of seeds on the crystallization rates of the enantiomers of asparagine were studied. It was
demonstrated that differences in the crystallization rates of the two enantiomers could be
induced by the addition of seeds. Separation processes were developed and yielded high
purity products.
A nurnber of conclusions can be drawn from these results:
It was shown that the crystallization temperature did not have a significant effect
on the crystallization behaviour of ASN within the range studied.
Desupersaturation curves were almost identical. This was due to the small range
of temperature studied.
The initial supersaturation of crystallizing solutions had an important effect on the
crystallization of the individual enantiomers. A larger initial supersaturation
induced shorter induction period and overall faster reduction in supersaturation.
Very low supersaturation gave rise to metastable solutions in which no
crystallization could be observed over the entire experimental time.
ASN seeds were used to enhance the crystallization rates. The addition of seeds
of one enantiomer increased the crystallization rate of that enantiomer and had no
effect on the crystallization rate of the other. In aIl cases, the addition of seeds of
128
Page 153
CHAPTER 5: CONCLUSIONS AND RECOMMENDATIONS
one enantiomer significantly reduced the duration of the induction period or
eliminated it completely.
The fact that the other enantiomer was not affected also confirmed the
conglomerate-forming property of ASN.
The maximum crystallization rate of a seeded solution was lower than that of an
unseeded solution. The increased number of nuclei initially present and the rapid
decrease in supersaturation for the seeded solution was identified as the cause of
the reduced maximum crystallization rate.
The time at which the seeding occurred was shown to have a limited effect on the
crystallization behaviour of solutions. An earlier seeding induced slightly faster
crystallization.
In order to have high product recovery, it was shown that the best approach was to
maintain low initial supersaturation conditions along with a large initial excess of
the enantiomer to be recovered. This allowed for a high crystallization rate for the
enantiomer to be recovered as well as long crystallization times making maximum
recovery possible.
For high productivity, high initial supersaturations with little or no excess in the
enantiomer to be recovered allowed for maximum crystallization rate and short
crystallization time, maximizing productivity.
129
Page 154
CHAPTER 5: CONCLUSIONS AND RECOMMENDATIONS
A cyclic semi-continuous process was developed. It required the initial excess of
the first enantiomer to be crystallized to be equal to the net amount of that
enantiomer crystallized during the first cycle. Such a process could be used to
separate two enantiomers fed as a racemic mixture only requiring excess of one
enantiomer for the initial cycle and a relatively small amount of seeds for each
cycle. Purities of at least 95.8% were obtained with such a process. The
productivity reached 5.3 x 10⁻¹ moIL-lmin-1 with a recovery efficiency of73.1 %.
Nucleation could not be modeled independently due to the lack of accurate
particle size distribution data. Growth was modeled independently assuming the
nucleation process had a negligible effect on supersaturation at low initial
supersaturation. A rate law with rate constant 1.61 x 1 0-9 ms- I and an apparent order
of 8.8 was identified as the best fit. It was however acknowledged that the values
were to be used with caution. A desupersaturation rate was modeled. Rate-law
models were fitted to the experimental data points. Rate constants between 4.2 x
10-4 and 9.4 x 10⁻⁴ S-I and apparent orders between 3.2 and 3.9 were obtained. This
model had limited use because of the complexity of the simultaneous effects of
nucleation and growth during the crystallization process.
130
Page 155
CHAPTER 5: CONCLUSIONS AND RECOMMENDATIONS
5.2 Recommendations for Future Research
A number of assumptions made in the present work could relatively easily be
verified with a different experimental setup. The work on the effect of the amount of
seeds could be completed if larger amounts of ASN could be used as seeds.
Similarly, it would be interesting to investigate the effect of higher mixing speeds.
Collet et al. (1980) have previously observed, for certain systems, a decrease in
crystallization rate when mixing was increased beyond a specifie value.
A more extensive study of the effect of the crystallization temperature could also be
done with a different experimental setup.
However one of the most interesting are as for continuing research in this field lies
in study of the nuc1eation and growth processes. Obtaining reliable nucleation and growth
data would allow one to individually model the two most important processes of
crystallization. Partic1e size distribution data for the seeds and product crystals would
make it possible to use the population balance as part of a model to predict the
intermediate partic1e size distribution and provide vital information for work on the
properties of the final product. Shape and size of product crystals is of the utmost
importance in the pharmaceutical industry, these two factors being intimately related to
the bioavailability of drug molecules.
131
Page 156
CHAPTER 5: CONCLUSIONS AND RECOMMENDATIONS
5.3 Contributions to Knowledge
The present work constitutes the first systematic study of the separation of
enantiomers through the crystallization of conglomerates. It is also the tirst extensive
study of the separation of the enantiomers of ASN through crystallization by entrainment.
The effects of the important variables affecting the separation process have been
examined. These variables consisted of the crystallization, temperature, the
supersaturation, mixing and the addition of seeds.
The effect of seeds was particularly thoroughly studied by the experimental testing
of the effects of the type and amount of seed added as weIl as the time at which the seeds
were added. For the first time, these variables were used in combination, to maximize the
crystallization rate of one enantiomer while minimizing the crystallization rate of the
other enantiomer.
Separation processes involving conditions that more closely resemble industrial
process conditions such as high mixing speeds and short crystallization times were
developed. The product purity and productivity obtained were comparable to the highest
figures reported in the literature (See Chapter 2). In addition, these results were obtained
in single stage processes and did not require post processing such as re-crystallization.
The results also constitute a good basis for more extensive studies of the nucleation
and growth processes and the eventual modeling of the separation process using a
population balance framework.
132
Page 157
REFERENCES
References
133
Page 158
REFERENCES
Addadi, L., S. Weinstein, E. Gati, I. Weissbuch and M. Lahav, "Resolution of Conglomerates with the Assistance of Tailor-made Impurities. Generality and Mechanistic Aspects of the "Rule of ReversaI". A New Method for the Assignment of Absolute Configuration", J Am. Chem. Soc., 104,4610 (1982).
Addadi, L., Z. Berkovitch-Yellin, I. Weissbuch, M. Lahav and L. Leiserowitz, "A Link between Macroscopic Phenomena and Molecular Chirality", Top. Stereochem., 16, 1 (1986).
Ahuja, S., "Chiral Separation Methods", Ahuja, S. (ed.), Chiral Separations. Applications and Technology, American Chemical Society, Washington, DC, 139 (1997).
Abuja, S., "Chiral Separations and Technology: An Overview", Ahuja, S. (ed.), Chiral Separations. Applications and Technology, American Chemical Society, Washington, DC, 1 (1997).
Amiard, G., Bull. Soc. Chim. Fr., 447 (1956) [quoted in Collet et al. (1981)].
Aoun, M., E. Plasari, R. David and J. Villermaux, "A Simultaneous Determination of Nucleation and Growth Rates from Batch Spontaneous Precipitation", Chem. Eng. Sei., 54,1161 (1999).
Berkovitch-Yellin, Z., "Toward an Ab Initio Derivation of Crystal Morphology", J Amer. Chem. Soc., 107,8239 (1985).
Berlingozzi, S., G. Adembri and M. Ghe!ardoni, "Optically Active Amino Acids. Resolution of DL-asparagine", Gazz. chim. ital., 88, 9 (1958). [abstract]
Brassat, B., P. E. Hare, C. Ponnamperuma and W. Thiemann, "Determination of DLAsparagine by Gas Chromatography ", J Chromatogr., 354, 474 (1986).
Brienne, M. 1., A Collet and 1. Jacques, "A Convenient Optical Resolution of secPhenethyl Alcohol by Preferential Crystallization of its 3,5-Dinitrobenzoate", Synthesis Commun., 9, 704 (1983).
Brückner, H., M. Langer, M. Lüpke, T. Westhauser and H. Gode!, "Liquid Chromatographic Determination of Amino Acid Enantiomers by Derivatization with 0-
Phthaldialdehyde and Chiral Thiols. Applications with Reference to Food Science", J Chromatogr. A., 697, 229 (1995).
Campbell, M., "Resolution of Racemic Glutamic Acid Mixtures", MEng. dissertation, Mc Gill University, Montreal (2005).
Chianese, A, F. DiBerardino and A G. Jones, "On the Effect of Secondary Nucleation on the Crystal Size Distribution from a Seeded Batch Crystallizer", Chem. Eng. Sei., 48, 551 (1993).
134
Page 159
REFERENCES
Coffen, D. L., "Enzyme-Catalyzed Reactions", Ahuja, S. (ed), Chiral Separations. Applications and Technology, American Chemical Society, Washington, DC, 59 (1997). Collet, A., M. J. Brienne and J. Jacques, "Optical Resolution by Direct Crystallization of Enantiomer Mixtures", Chem. Rev., 80, 215 (1980).
Collet, A., "Le Dédoublement par Cristallisation, un Siècle et Demi Après Pasteur: Une Question Toujours d'Actualité, Actual. Chimique, Décembre 1995, p. 15, (1995).
Collet, A., "Resolution of Racemates: Did You Say 'Classical"', Angew. Chem. Int. Ed, 37,3239 (1998).
Collet, A., "Separation and Purification of Enantiomers by Crystallization Methods", Enantiomer, 4, 157 (1999).
Collins, A. N., G. N. Sheldrake and J. Crosby (eds.), Chirality in Industry II, Wiley, NY (1997).
Coquerel, G., R. Bouaziz and M. J. Brienne, "Optical Resolution of (±)-nAcylnorfenfluramine Derivatives by Preferential Crystallization", Tetrahedron Lett., 31, 2143 (1990).
Deshpande, S. and D. Kirwan, "Effect of Mixing on Size Distribution during Precipitation ofL-Asparagine in an Agitated Crystallizer", Int. Symp. Ind Cryst., 14th
, 340 (1999).
Doki, N., M. Yokota, S. Sasaki and N. Kubota, "Simultaneous Crystallization of D- and L- Asparagines in the Presence of Tailor-Made Additive by Natural Cooling Combined with Pulse Heating", Cryst. Growth Des., 4, 1359 (2004).
Farrell, R. 1. and Y. Tsai, "Modeling, Simulation and Kinetic Parameter Estimation in Batch Crystallization Processes", AIChE J, 40, 586 (1994).
Fogassy, E., M. Acs and 1. Gressay, "The Problems of the Optical Resolution of Asparagine and Aspartic Acid", Periodica Polytechnica, 20, 179 (1976).
Garside, 1., L. G. Gibilaro and N. S. Tavare, "Evaluation of Crystal Growth Kinetics from a Desupersaturation Curve using Initial Derivatives", Chem. Eng. Sei., 37, 1625 (1982).
Harada, K., "The Optical Resolution of DL-Aspartic Acid, DL-Glutamic Acid, DLAsparagine and DL-Glutamine by Preferential Crystallization", Bull. Chem. Soc. Japan, 38, 1552 (1965).
Hopp, R. and K. Mori (eds.), Recent Developments in Flavor and Fragrance Chemistry, VCH, Weinheim (1993).
Hyun, M. H., S. C. Han and S. H. Whangbo, "New Ligand Exchange Chiral Stationary Phase for the Liquid Chromatographic Resolution of u- and p-Amino Acids", J Chromatogr. A., 992, 47 (2003).
135
Page 160
REFERENCES
Jacques, 1., A. Collet and S. H. Wilen, Enantiomers, Racemates and Resolutions, Wiley, NY (1981).
Jones, M., Organic Chemistry, Norton, NY (1997).
Jungfleish, M. E., "Sur le Dédoublement de l'Acide Racémique", J Pharm. Chim., 5, 346 (1882).
Knightley, P., H. Evans, E. Potter and M. Wallace, Suffer the children : the story of thalidomide, Andre Deutsch, London (1979).
Kuboi, R, A. W. Nienow and R. Conti, "Mechanical Attrition of Crystals in Stirred Vessels", Janéié, S. J and E. J de Jong (eds.), Industrial Crystallization 84, Elsevier, Amsterdam, 211 (1984).
Lahav, M, L. Addadi and 1. Weissbuch, "Separating Mixtures ofD- and L-Amino Acids", German Patent DE3122537 (1982). [abstract]
Lee, S. H., A. Berthod and D.W. Armstrong, "Systematic Study on the Resolution of Derivatized Amino Acids Enantiomers on Different Cyc1odextrin-Bonded Stationary Phases", J Chromatogr., 603, 83 (1992).
Liu, Y., J. Wang and H. Wei, "Determination of Crystallization Kinetics in Solution", J Crystal Growth, 271, 238 (2004).
Mahajan, A. J., C. J. OrelIa and D. J. Kirwan, "Analysis of Size Distribution and Growth Kinetics during the Batch Crystallization of L-Asparagine", AIChE Symp. Ser. No. 284, 87, 143 (1991).
Mahajan, A. 1. and D. 1. Kirwan, "Rapid Precipitation of Biochemicals", J Phys. D: Appl. Phys., 26, 176 (1993)
Mahajan, A. J. and D. J. Kirwan, "Nuc1eation and Growth Kinetics of Biochemicals Measured at High Supersaturations", J Crystal Growth, 144,281 (1994).
McCoy, B. J., "A Population Balance Framework for Nuc1eation, Growth, and Aggregation", Chem. Eng. Sei., 57, 2279 (2002).
Mersmann, A., B. Braun and M. Loffelmann, "Prediction of CrystalIization Coefficients of the Population Balance", Chem. Eng. Sei., 57, 4267 (2002).
Morrison, Rand R Boyd, Organic Chemistry, 3rd edition, AlIyn and Bacon, Inc., Boston (1973).
Mullin, J. W., Crystallization, 3rd edition, Butterworth-Heinemann, Oxford (1993).
136
Page 161
REFERENCES
Nienow, A. W. and R. Conti, "Particle Abrasion at High Solids Concentration in Stirred Vessels", Chem. Eng. Sei., 33, 1077 (1978).
Noguchi Institute, "A Method for Obtaining Optically Active Crystals from Racemic Mixture Crystals", UK Patent 1217348 (1970).
Orella, C. J., "The Crystallization of Amino Acids from Mixtures of Water and Alcohol", PhD dissertation, University ofVirginia, Charlottesville (1990).
Pasteur, L., "Mémoires Lus", C. R. Hebd. Séances Acad. Sei., 26,535 (1848).
Piutti, A., "Sur une Nouvelle Espèce d'Asparagine", C. R. Hebd. Séances Acad. Sei., 103, 134 (1886).
Quintana-Hemandez, P., E. Bolafios-Reynoso, B. Miranda-Castro and L. SalcedoEstrada, "Mathematical Modeling and Kinetic Parameter Estimation in Batch Crystallization", A/ChE J,50, 1407 (2004).
Schroer, J., C. Wibowo and K. Ng, "Synthesis of Chiral Crystallization Processes", A/ChE J., 47, 369 (2001).
Schipper, P. E. and P.R Harrowell, "A Van der Waals Model of Chiral Mixtures Using a Chiral Lennard-Jones Potential. Applications to the Pasteur Experiment and Phenomena in Chiral Solvents", J Am. Chem. Soc., 105, 723 (1983).
Sheldon, R. A. Chirotechnology, Dekker, NY (1993).
Shiraiwa, T., M. Suzuki, y. Sakai, H. Nagasawa, K. Takatani, D. Noshi and K. Yamanashi, "Optical Resolution by Preferential Crystallization of (RS)-2-Benzoylamino-2-benzyl-3-hydroxypropanoic Acid and its Use in Synthesizing Optically Active 2-Amino-2-methyl-3-phenylpropanoic Acid", Chem. Pharm. Bull., 50, 1362 (2002).
Soos, R, E. Fogassy, 1. Gressay and A. Erdelyi, "Resolution of Asparagine", Hungarian Patent HU7573 19740128 (1974). [abstract]
Stephen, H. and T. Stephen, Solubilities of /norganic and Organic Compounds, Vol. 1 and Vol. 2, MacMillan, New York (1979).
Tadayon, A., S. Rohani and M. K. Bennett, "Estimation of Nucleation and Growth Kinetics of Ammonium Sulfate from Transients of a Cooling Batch Seeded Crystallizer", /nd. Eng. Chem. Res., 41, 6181 (2002).
Tavare, N. S. and J. Garside, "Analysis of Batch Crystallizers", /nd. Eng. Chem. Pro cess Des. Dev., 19,653 (1980).
Tavare, N. S. and 1. Garside, "Simultaneous Estimation of Crystal Nucleation and Growth Kinetics from Batch Experiments", Chem. Eng. Res. Des., 64, 109 (1986).
137
Page 162
REFERENCES
Toyokura, K., K. Yamazoe and J. Mogi, "Secondary Nuc1eation Rate of Alum ln
Fluidized Bed", AIChE Symp. Ser. No. 153, 72, 53 (1976). Ward, M. D., "Organic Films with a Twist", Nature, 426, 615(2003).
Watanabe, T. and G. Noyori, Kogyo Kagaku Zasshi, 72,1083 (1969). [abstract]
Weissbuch, L, L. Addadi, Z. Berkovitch-Yellin, E. Gati, S. Weinstein, M. Lahav and L. Leiserowitz, "Centrosymmetric Crystals for the Direct Assignment of the Absolute Configuration of Chiral Molecules. Applications to a-Amino Acids by their Effeet on Glycine Crystals",J Amer. Chem. Soc., 105,6615 (1983).
Wilen, S. H., A Collet and J. Jacques, "Strategies in Optical Resolutions", Tetrahedron, 33,2725 (1977).
Witiak, D. and M. Inbasekaran, "Optically Active Pharmaceuticals", M Grayson, (ed.), Kirk-Othmer Concise Encyclopedia ofChemical Technology, Wiley, New York (1985).
Yamamoto, A, "Amino Acids", M Grayson, (ed.), Kirk-Othmer Concise Encyclopedia ofChemical Technology, Wiley, New York (1985).
Yokota, M., A Sato and N. Kubota, "New Effective-Nuc1ei Concept for the Simplified Analysis of Batch Crystallization", AIChE J, 45, 1883 (1999).
Zbaida, D., 1 Weissbuch, E. Shavit-Gati, L. Addadi, L. Leiserowitz and M. Lahav, "Design of Chiral Polymers for the Kinetic Resolution of Racemic Conglomerates", React. Polym., 6, 241 (1987).
138
Page 163
ApPENDICES
Appendices
139
Page 164
ApPENDICES
Appendix 1: Sample Calculations
A1.1 Maximum Crystallization Rate
The maximum crystallization rates were defined as the maximum si ope of the
concentration vs. time curves for a crystallizing solution. For example, in Figure 4.3, for
the curve at 283K, the maximum slope occurs between t = 10 min with [L-ASN] = 7.3 x
10-1 moIL-1) and t = 15 min with [L-ASN] = 2.6 x 10⁻¹ moIL- I
•
Maximum Crystallization Rate = - [c[- Ci] / [t[- ti]
A1.2 Time to Reach s = 1.2
= - [2.6 X 10⁻¹ - 7.3 X 10⁻¹
] / [15 - 10]
= 9.4 X 10⁻² moIL-lmin-1
(A.l)
The time to reach s = 1.2 was interpolated from experimental data. For example,
in Figure 4.5, for the curve at So = 5.1, at t = 2 min, [L-ASN] = 2.6 x 10⁻¹ molL-1 and at t
= 3 min, [L-ASN] = 2.2 x 10⁻¹ moIL-I• In addition, c * = 1.9 x 10⁻¹ molL-1 therefore for s =
1.2, c = 2.3 X 10⁻¹ molel.
Time to Reach 's = 1.2' = tj + (Cj - c) / [(c[- Ci) / (t[ - tj)] (A.2)
= 2 + (2.6 X 10⁻¹ - 2.3 X 10⁻¹
) / [(2.2 X 10⁻¹ - 2.6 X 10⁻¹
) / (3 - 2)]
= 2.7 min
140
Page 165
ApPENDICES
A1.3 Duration of the Induction Period
The end of the induction period was defined as the time at which c = 0.95 x co. It
was interpolated from experimentai data in a method similar to the one describe in
section A1.2 above. For exampIe, in Figure 4.5, for the curve at So = 3.7, Co = 7.1 X 10⁻¹
moiL-1 and 0.95 x Co = 6.7 x 10⁻¹ moiL-I. At t = 0.5 min, Ci = 7.0 x 10⁻¹ moiL-1 and at t = 1
min, Cf = 6.7 x 10⁻¹ moiL-I• The end of the induction period is therefore equai to 1 min.
A1.4 Average Crystallization Rate
Average crystallization rates were defined as the average siope of the
concentration vs. time curves. For example, in Figure 4.21, for the curve with no mixing,
at t = 0, Co = 9.3 X 10⁻¹ moiL-1 and for t = 2, Cf = 7.0 X 10⁻¹ moiL-I•
Average Crystallization Rate = - (Cf - Co) / tr
= - (7.0 X 10⁻¹ - 9.3 X 10⁻¹
) / 2
= 1.2 X 10⁻¹ moiL-lmin-1
(A.3)
141
Page 166
ApPENDICES
A1.S Total Amount Crystallized
The total amount crystallized is define as the difference between the initial and
final concentration of the solute. For example, in Figure 4.38, the initial concentration of
L-ASN is 9.0 x 10⁻¹ molL-1 and the final concentration is 3.7 x 10⁻¹ moIL-1.
Total Amount Crystallized = Co - Cf
A1.6 Production Rate
= 9.0 X 10⁻¹ - 3.7 X 10-1
= 5.3 x 10⁻¹ molL-1
(A.4)
The production rate of a solute is defined as the ratio of the total amount
crystallized over time. For example in Figure 4.38, for L-ASN, the total amount
crystallized is 5.3 x 10⁻¹ molL-1 and the time is 1 min.
Production Rate = (co - Cf) / tf
= 5.3 x 10⁻¹ / 1
= 5.3 x 10⁻¹ moIL-1min-1
(A.5)
142
Page 167
ApPENDICES
Al.7 Net Amount Crystallized
The net amount crystallized is defined as the difference between the total amount
crystallized and the excess enantiomer. For example, in Figure 4.36 and Table 4.8, the
total amount ofL-ASN crystallized is 6.1 x 10⁻¹ molL-1 and the excess L-ASN is 3.6 x lO
I moIL-I.
Net Amount Crystallized = (co - Cf) - Cxs
= 6.1 X 10⁻¹ - 3.6 X 10-1
= 2.5 X 10⁻¹ molL-1
Al.8 Net Production Rate
(A.6)
The net production rate is the ratio of the net amount crystallized over time. For
example in Figure 4.36, for L-ASN, the net amount crystallized is 2.5 x 10⁻¹ molL-1 and
the time is 2 min.
Net Production Rate = [(co - Cf) - cxs] / tf
= 2.5 x 10⁻¹ / 2
= 1.3 x 10⁻¹ moIL-lmin-1
(A. 7)
143
Page 168
ApPENDICES
A1.9 Maximum Net Amount Crystallized
The maximum net amount of solute crystallized is defined as the difference
between the initial concentration and the solubility to which is subtracted the excess
solute initially present. For example, in Figure 4.36, the initial concentration ofL-ASN is
9.0 x 10⁻¹ moIL-I, the solubility is 1.9 x 10⁻¹ molL-1 and the excess L-ASN is 3.6 x 10⁻¹
molL-1
Maximum Net Amount Crystallized = Co - c * - Cxs (A.8)
= 9.0 x 10⁻¹ - 1.9 X 10⁻¹
- 3.6 X 10-1
= 3.7 X 10⁻¹ molL-1
A1.10 Process Efficiency
The process efficiency is defined as the ratio of the net amount crystallized over
the maximum net amount crystallized. For example in Figure 4.36, for L-ASN, the net
amount crystallized is equal to 2.6 x 10⁻¹ molL-1 and the maximum net amount
crystallized is equal to 3.7 x 10⁻¹ moIL-I•
Process Efficiency = (co - Cf - cxs) / (co - c * - cxs)
= 2.6 x 10⁻¹ /3.7 X 10-1
=0.69
= 69.4%
(A.9)
144
Page 169
ApPENDICES
A1.11 Enantiomer Left in Solution
The amount of enantiomer left in solution is defined as the difference between the
final concentration and the solubility. For example in Figure 4.36, for the final L-ASN
concentration is 2.8 x 10⁻¹ molL-1 and the solubility is 1.9 x 10⁻¹ moIL-I•
Enantiomer left in solution = Cf - C * (A.lO)
= 2.8 X 10⁻¹ - 1.9 X 10⁻¹
A1.12 Converting PSD from Volume% to Number%
The data obtained from the particle size analyser (PSA) consisted in volume% of
particles in different size intervals. The data collected by the PSA was processed by the
internaI software with the assumption that the particles were spheres. Therefore it was
necessary to make this assumption in order to convert the data into number fractions.
The volume of particles in each size interval was determined using the equation
for the volume of a sphere.
(A. 1 1 )
145
Page 170
ApPENDICES
The number of partic1es of that size in an arbitrary sample of volume 1 00 ~m3 was
then determined by di vi ding the volume fraction for this partic1e size by the volume of
one partic1e of that size.
npart volume fraction
Vp (A. 12)
The number fraction of partic1es of one size was determined by di vi ding the
number of partic1es of that size by the total number of partic1es in the arbitrary sample.
numberfraction (A.! 3)
Finally, the number% was obtained by multiplying the number fraction by 100.
number%=numberfractionxl00 (A. 14)
Al.13 Shape Factor
The shape factor was determined by first measuring the volume and length of
several sample crystals and then plotting the volume as a function of the length to the
power 3 (See Figure 4.10). A straight line intersecting the origin (0,0) was fitted and the
slope of that line was equal to the shape factor.
146
Page 171
ApPENDICES
A1.14 Activation Energy Calculations
The rate constant for crystallization were shown to follow a temperature
dependence well represented by the Arrhenius equation:
k =AexJ -=.E..-) l'RI;
(A.15)
If the ratio of two rate constants at two different temperature is taken, the resulting
equation becomes:
k2 -ex] ,1_1 _1 )] kl 1 '-"l RI; RI;
(A. 16)
If the activation energy of the process, E, is equal to 10000 Jmorl, R is 8.314
JmorlK-l and Tl is 293 K, it is possible to determine the ratio of the rate constant at
different temperatures.
If T2 is equal to 285 K and 283 K (~T of 8 and 10 K respectively), the ratio
becomes:
~~ =1.1221
and
147
Page 172
~~ =exJooo~.31lx283 8.31lx293)]
~~ =1.1561
ApPENDICES
Representing a 12.2 and 15.6% increase in the rates for an 8 and 10 K increase in
temperature.
148
Page 173
ApPENDICES
Appendix 2: Development of the Models
A2.1 Modeling of the Growth Rate
Since the growth rate was represented by the equation:
r = dl = k sn g dt g
(A.17)
A plot of dL/dt vs sn in theory should lead to a straight line with slope equal to the
growth rate constant kg. The experimental data available consisted in concentration at
different times. The concentration information was converted into crystal length data
using the following mass balance equation:
1
l(t)=[( Co -c(t)) VT+mseeds]3 n,eed.,aCp
(A.18)
Where Co is the initial solute concentration in terms of mass, cCt) is the solute
concentration at time t, V T is the total solution volume, mseeds is the total mass of seeds,
nseeds is the total number of seed particles, U c is the crystal volume shape factor and p is
the crystal density.
149
Page 174
ApPENDICES
The number of seed particles was calculated with the following equations:
mseeds
mseedparllcle
mseedparticle = P V,eedparticle
V,eedparticle =ac !J.,eedparticle
(AI9)
(A20)
(A2I)
Where the subscripts seeds refers to aIl the seeds and seedparticle refers to an individual
seed crystal.
L(t) was plotted against s"(t) with n being arbitrarily chosen. The value of n was
then modified to obtain the best fit for the straight line passing through the data points.
The slope of the curve was taken as kg and the optimized value of n was selected as n.
A2.2 Modeling of the Desupersaturation Rate
Since the desupersaturation rate is represented by the equation
(A.22)
it is possible, upon integration to convert it into the equation of the form
(A23)
150
Page 175
ApPENDICES
The integration is carried out from s = So to s and from t = 0 to t. It is then possible to
calculate the left hand side of Equation A.23 from experimental data for supersaturation
and to plot it against time using an arbitrary value for the rate order n.
The value of n was varied in order to optimize the fit of the straight line going
through the data points. This value of n was chosen as the rate order n. The slope of the
line was equal to the negative of the rate constant kds,
151
Page 176
ApPENDICES
Appendix 3: Use of a Ternary Diagram
s
L R 0.62
o
Figure A.1: Temary Diagram
The apices of the diagram, points S, L and D represent compositions of 100% S,
100% L and 100% D respectively.
Points along the axes represent binary systems. For example, point R represent an
equimolar mixture of L and D (no S present). Point Z represent a binary mixture of
18% S and 82% D.
If Land D represent two enantiomer and S represents a solvent, composition located
on the dotted line SR represent racemic mixtures (equal amounts of Land D). For
152
Page 177
ApPENDICES
example, at point Y, the system is composed of 18% S and the remaining 82% consist
of41% Land 41% D.
Points inside the diagram represent temary systems. For example, at point X, the
composition is 18% S, 62% D and 20% L.
When a solution of composition Y (racemic solution) crystallizes until its
composition becomes W, the composition of the solid phase produced is R. Similarly,
when a solution of composition V crystallizes until its composition becomes W, the
composition of the solid phase produced is L (pure component).
153
Page 178
ApPENDICES
Appendix 4: Discussion on the Reproducibility of the ResuUs
In order to ensure of the validity of the experimental results, all experiments were
repeated a minimum of three times. The majority of the data presented in this report
consist of average values. In sorne cases, all data points have been presented to
emphasize reproducibility. The plotting of average values improved the clarity of the
results.
Although no statistical analysis of the experimental data is presented, it was
observed that reproducibility was improved by the presence of seeds. Typically, data
variations of 1 - 5 % were observed in seeded experiments while unseeded experiments
lead to variations of up to 25 %. Figure A.2 (non-seeded experiment) and Figure A.3
(seeded experiment) illustrate typical experimental reproducibility. In both cases, all
replicates are plotted. It is clear that the scatter is reduced in the presence of seeds.
-.J -C) -z fi)
« 1
.J
140.0
120.0
100.0
80.0
60.0
40.0
20.0
0.0
0
• • •
0.5
• • • 1 1.5 2 2.5 3
t (min)
Figure A.2: L-ASN Crystallization Data Scatter in the Absence of Seeds (298 K, Co = 120 gL-1
)
3.5
154
Page 179
-...J -C) -..... Z U) «
1 ...J .....
ApPENDICES
140.0
120.0 ~
100.0
80.0 • 60.0
40.0 • • 20.0
0.0
0 0.5 1 1.5 2
t (min)
Figure A.3: L-ASN Crystallization Data Scatter in the Presence of Seeds (298 K, Co = 120 gL-1
, 12 g L-ASN seeds L-1)
2.5
155