37
The Significance of Precision and Recall in Automatic Metrics for MT Evaluation Alon Lavie, Kenji Sagae, Shyamsundar Jayaraman Language Technologies Institute Carnegie Mellon University
The Significance of Precision and Recall in Automatic Metrics
for MT Evaluation
Alon Lavie, Kenji Sagae, Shyamsundar Jayaraman
Language Technologies Institute
Carnegie Mellon University
Sept 29, 2004 AMTA 2004 2
Outline
• Similarity-based metrics for MT evaluation• Weaknesses in Precision-based MT metrics
(BLEU, NIST)• Simple unigram-based MT evaluation metrics• METEOR• Evaluation Methodology• Experimental Evaluation• Recent Related Work• Future Directions
Sept 29, 2004 AMTA 2004 3
Similarity-based MT Evaluation Metrics
• Assess the “quality” of an MT system by comparing its output with human produced “reference” translations
• Premise: the more similar (in meaning) the translation is to the reference, the better
• Goal: an algorithm that is capable of accurately approximating the similarity
• Wide Range of metrics, mostly focusing on word-level correspondences:– Edit-distance metrics: Levenshtein, WER, PIWER, …– Ngram-based metrics: Precision, Recall, F1-measure, BLUE,
NIST, GTM…• Main Issue: perfect word matching is very crude
estimate for sentence-level similarity in meaning
Sept 29, 2004 AMTA 2004 4
Desirable Automatic Metric
• High-levels of correlation with quantified human notions of translation quality
• Sensitive to small differences in MT quality between systems and versions of systems
• Consistent – same MT system on similar texts should produce similar scores
• Reliable – MT systems that score similarly will perform similarly
• General – applicable to a wide range of domains and scenarios
• Fast and lightweight – easy to run
Sept 29, 2004 AMTA 2004 5
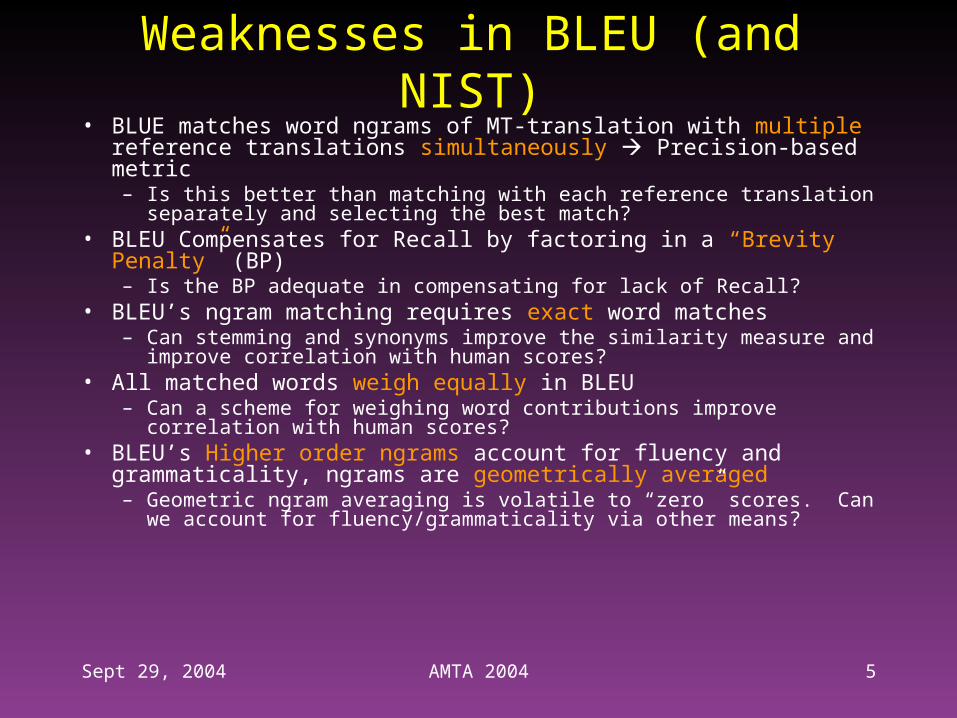
Weaknesses in BLEU (and NIST)• BLUE matches word ngrams of MT-translation with multiple
reference translations simultaneously Precision-based metric– Is this better than matching with each reference translation
separately and selecting the best match?• BLEU Compensates for Recall by factoring in a “Brevity
Penalty” (BP)– Is the BP adequate in compensating for lack of Recall?
• BLEU’s ngram matching requires exact word matches– Can stemming and synonyms improve the similarity measure and
improve correlation with human scores?• All matched words weigh equally in BLEU
– Can a scheme for weighing word contributions improve correlation with human scores?
• BLEU’s Higher order ngrams account for fluency and grammaticality, ngrams are geometrically averaged– Geometric ngram averaging is volatile to “zero” scores. Can we
account for fluency/grammaticality via other means?
Sept 29, 2004 AMTA 2004 6
Roadmap to a Desirable Metric• Establishing a metric with much improved correlations
with human judgment score at the sentence-level will go a long way towards our overall goals
• Our Approach:– Explicitly align the words in the MT translation with their
corresponding matches in the reference translation, allowing for:
• Exact matches, stemmed word matches, synonym and semantically-related word matches
– Combine unigram Precision and Recall to account for the similarity in “content” (translation adequacy)
– Weigh the contribution of matched words based on a measure related to their importance
– Estimate translation fluency/grammaticality based on explicit measure related to word-order, fragmentation and/or average length of matched ngrams
Sept 29, 2004 AMTA 2004 7
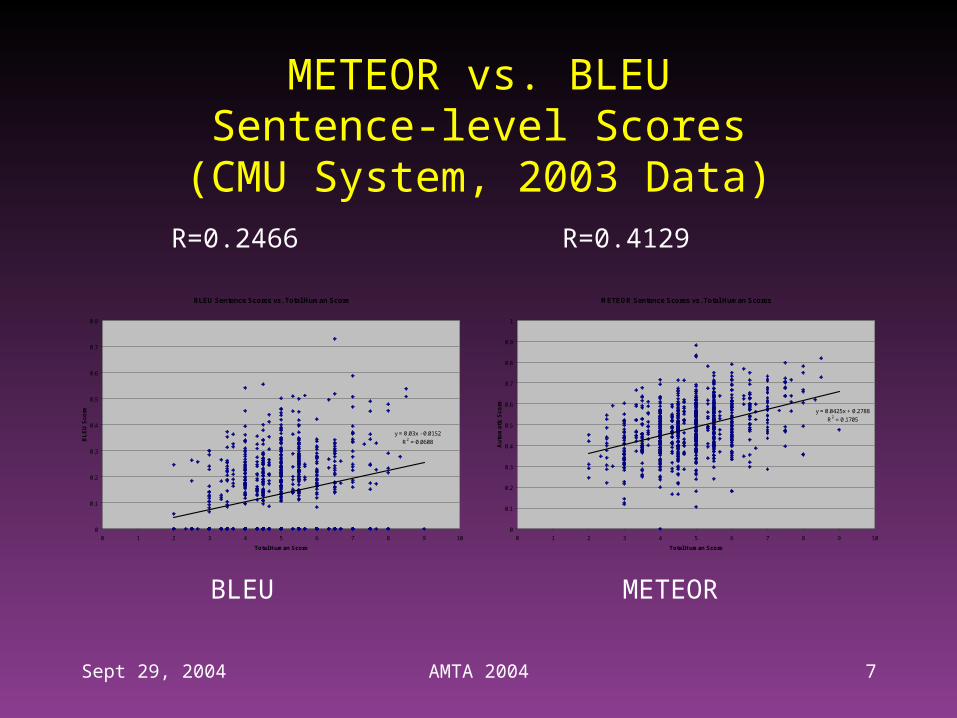
METEOR vs. BLEUSentence-level Scores
(CMU System, 2003 Data)
BLEU Sentence Scores vs. Total Human Score
y = 0.03x - 0.0152
R2 = 0.0608
0
0.1
0.2
0.3
0.4
0.5
0.6
0.7
0.8
0 1 2 3 4 5 6 7 8 9 10
Total Human Score
BL
EU
Sco
re
METEOR Sentence Scores vs. Total Human Scores
y = 0.0425x + 0.2788
R2 = 0.1705
0
0.1
0.2
0.3
0.4
0.5
0.6
0.7
0.8
0.9
1
0 1 2 3 4 5 6 7 8 9 10
Total Human Score
Au
tom
atic
Sco
re
R=0.2466 R=0.4129
BLEU METEOR
Sept 29, 2004 AMTA 2004 8
Unigram-based Metrics
• Unigram Precision: fraction of words in the MT that appear in the reference
• Unigram Recall: fraction of the words in the reference translation that appear in the MT
• F1= P*R/0.5*(P+R)• Fmean = P*R/(0.9*P+0.1*R)• With and without word stemming• Match with each reference separately and
select the best match for each sentence
Sept 29, 2004 AMTA 2004 9
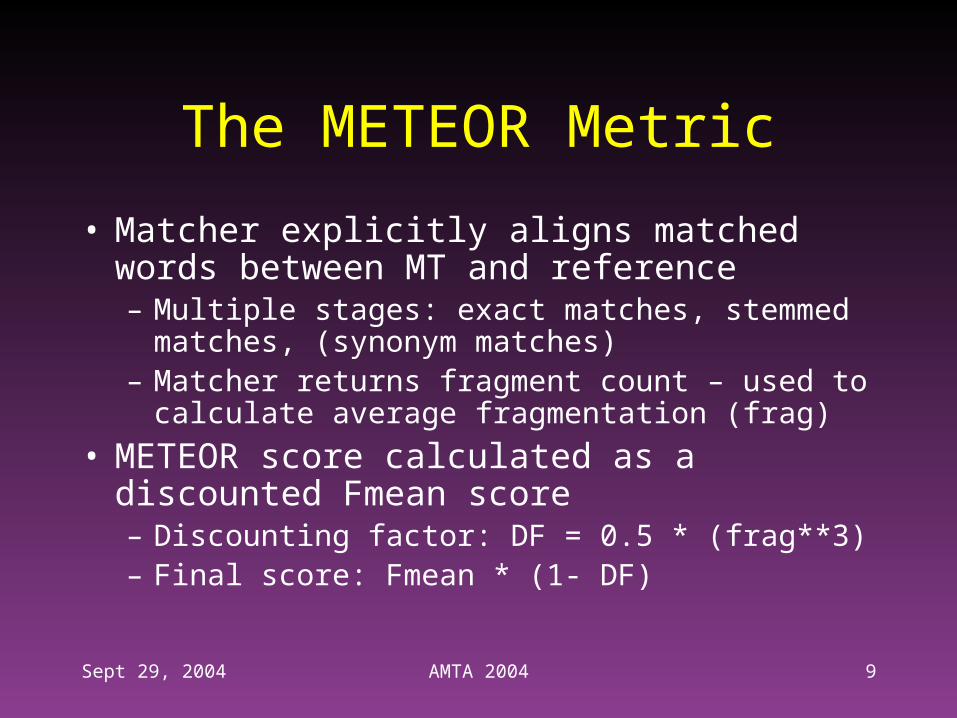
The METEOR Metric
• Matcher explicitly aligns matched words between MT and reference– Multiple stages: exact matches, stemmed
matches, (synonym matches)– Matcher returns fragment count – used to
calculate average fragmentation (frag)
• METEOR score calculated as a discounted Fmean score– Discounting factor: DF = 0.5 * (frag**3)– Final score: Fmean * (1- DF)
Sept 29, 2004 AMTA 2004 10
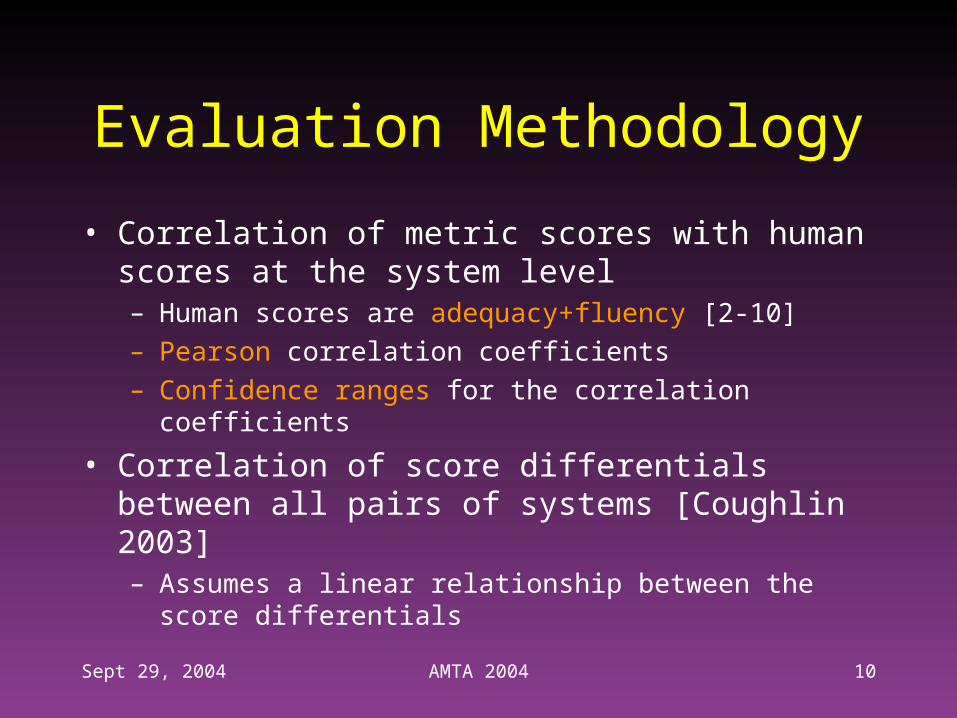
Evaluation Methodology
• Correlation of metric scores with human scores at the system level– Human scores are adequacy+fluency [2-10]– Pearson correlation coefficients– Confidence ranges for the correlation coefficients
• Correlation of score differentials between all pairs of systems [Coughlin 2003]– Assumes a linear relationship between the score
differentials
Sept 29, 2004 AMTA 2004 11
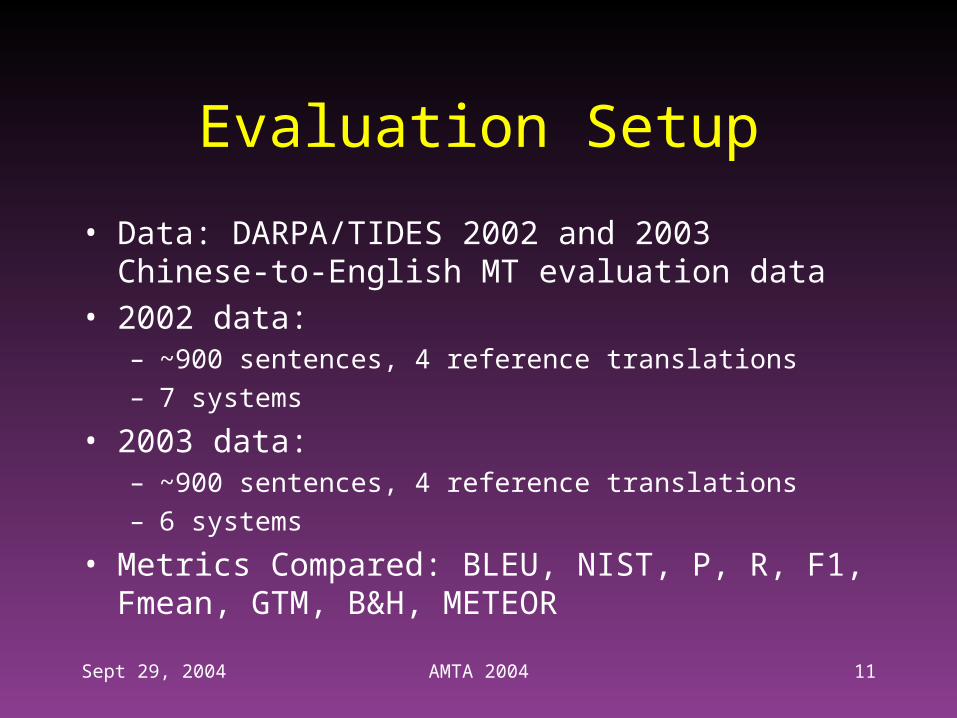
Evaluation Setup
• Data: DARPA/TIDES 2002 and 2003 Chinese-to-English MT evaluation data
• 2002 data: – ~900 sentences, 4 reference translations– 7 systems
• 2003 data:– ~900 sentences, 4 reference translations– 6 systems
• Metrics Compared: BLEU, NIST, P, R, F1, Fmean, GTM, B&H, METEOR
Sept 29, 2004 AMTA 2004 12
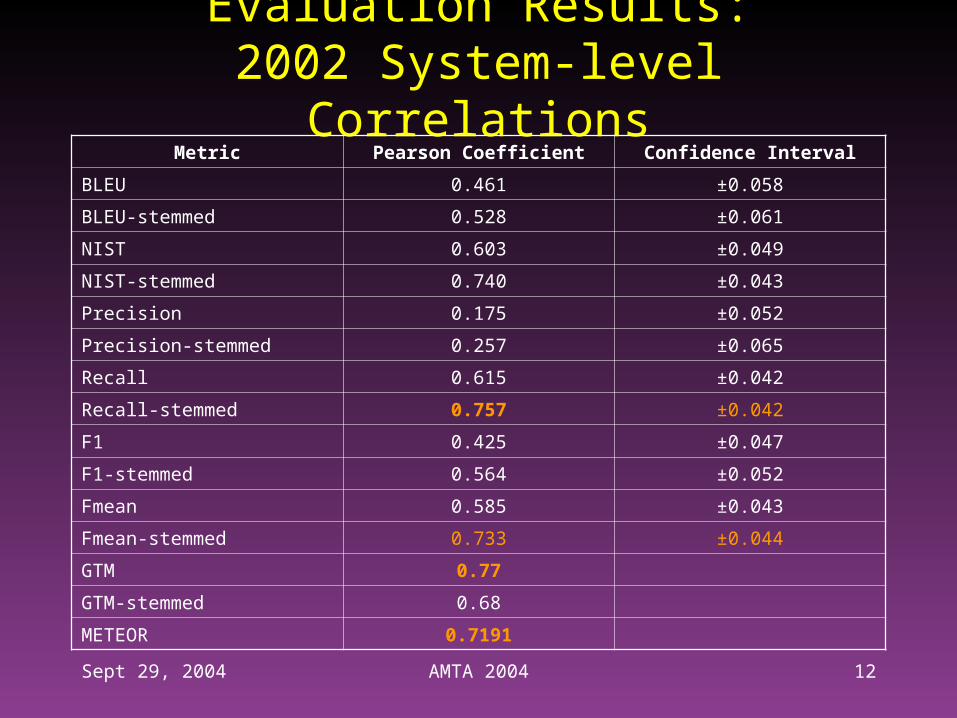
Evaluation Results:2002 System-level Correlations
Metric Pearson Coefficient Confidence Interval
BLEU 0.461 ±0.058
BLEU-stemmed 0.528 ±0.061
NIST 0.603 ±0.049
NIST-stemmed 0.740 ±0.043
Precision 0.175 ±0.052
Precision-stemmed 0.257 ±0.065
Recall 0.615 ±0.042
Recall-stemmed 0.757 ±0.042
F1 0.425 ±0.047
F1-stemmed 0.564 ±0.052
Fmean 0.585 ±0.043
Fmean-stemmed 0.733 ±0.044
GTM 0.77
GTM-stemmed 0.68
METEOR 0.7191
Sept 29, 2004 AMTA 2004 13
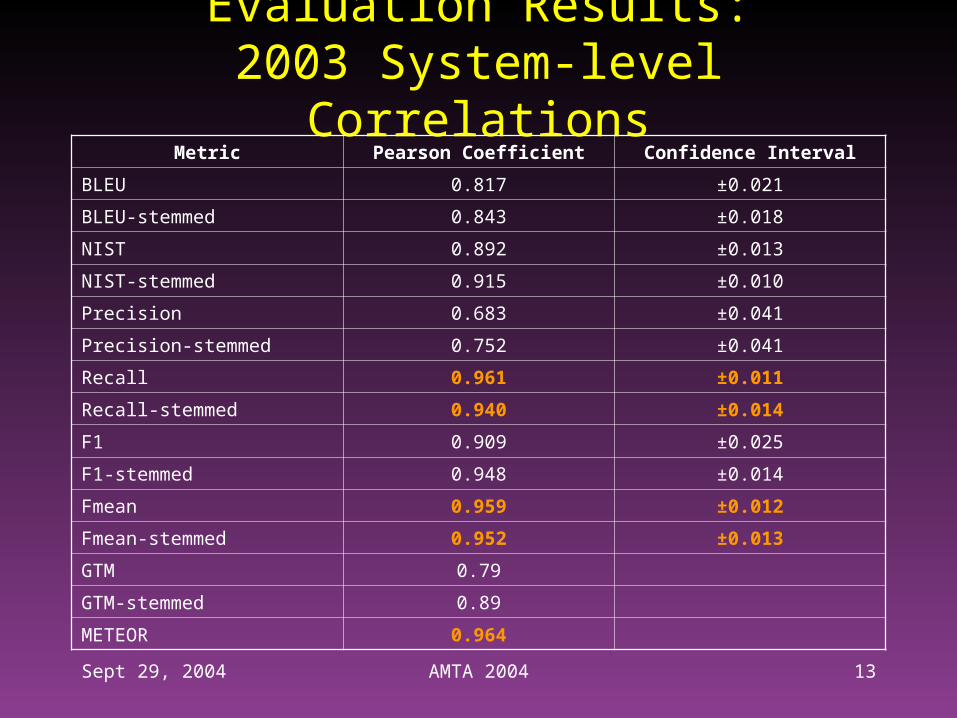
Evaluation Results:2003 System-level Correlations
Metric Pearson Coefficient Confidence Interval
BLEU 0.817 ±0.021
BLEU-stemmed 0.843 ±0.018
NIST 0.892 ±0.013
NIST-stemmed 0.915 ±0.010
Precision 0.683 ±0.041
Precision-stemmed 0.752 ±0.041
Recall 0.961 ±0.011
Recall-stemmed 0.940 ±0.014
F1 0.909 ±0.025
F1-stemmed 0.948 ±0.014
Fmean 0.959 ±0.012
Fmean-stemmed 0.952 ±0.013
GTM 0.79
GTM-stemmed 0.89
METEOR 0.964
Sept 29, 2004 AMTA 2004 14
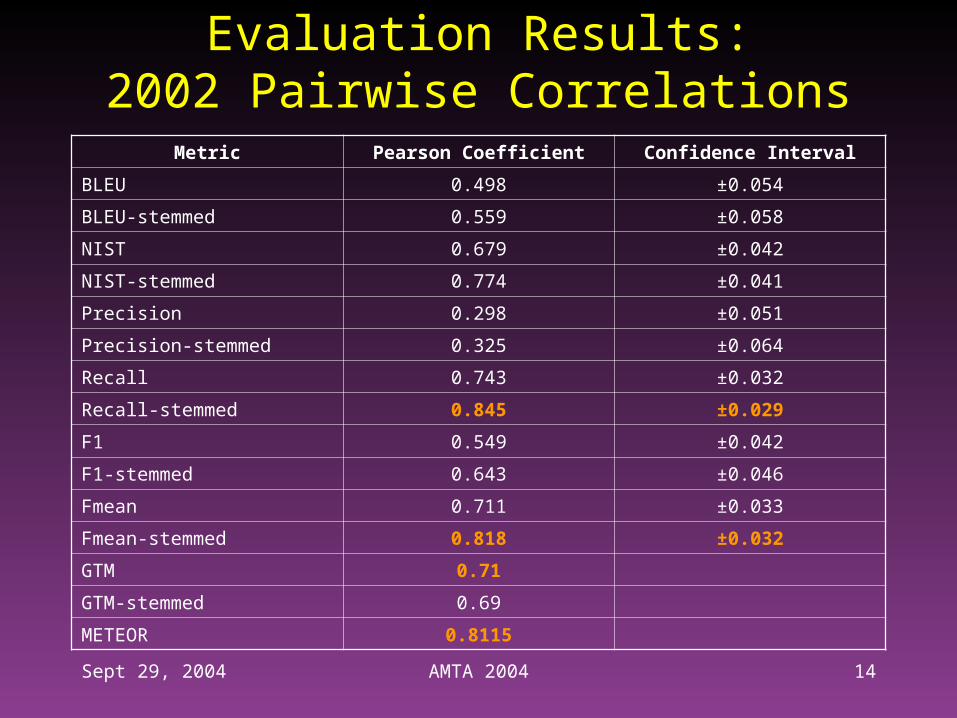
Evaluation Results:2002 Pairwise Correlations
Metric Pearson Coefficient Confidence Interval
BLEU 0.498 ±0.054
BLEU-stemmed 0.559 ±0.058
NIST 0.679 ±0.042
NIST-stemmed 0.774 ±0.041
Precision 0.298 ±0.051
Precision-stemmed 0.325 ±0.064
Recall 0.743 ±0.032
Recall-stemmed 0.845 ±0.029
F1 0.549 ±0.042
F1-stemmed 0.643 ±0.046
Fmean 0.711 ±0.033
Fmean-stemmed 0.818 ±0.032
GTM 0.71
GTM-stemmed 0.69
METEOR 0.8115
Sept 29, 2004 AMTA 2004 15
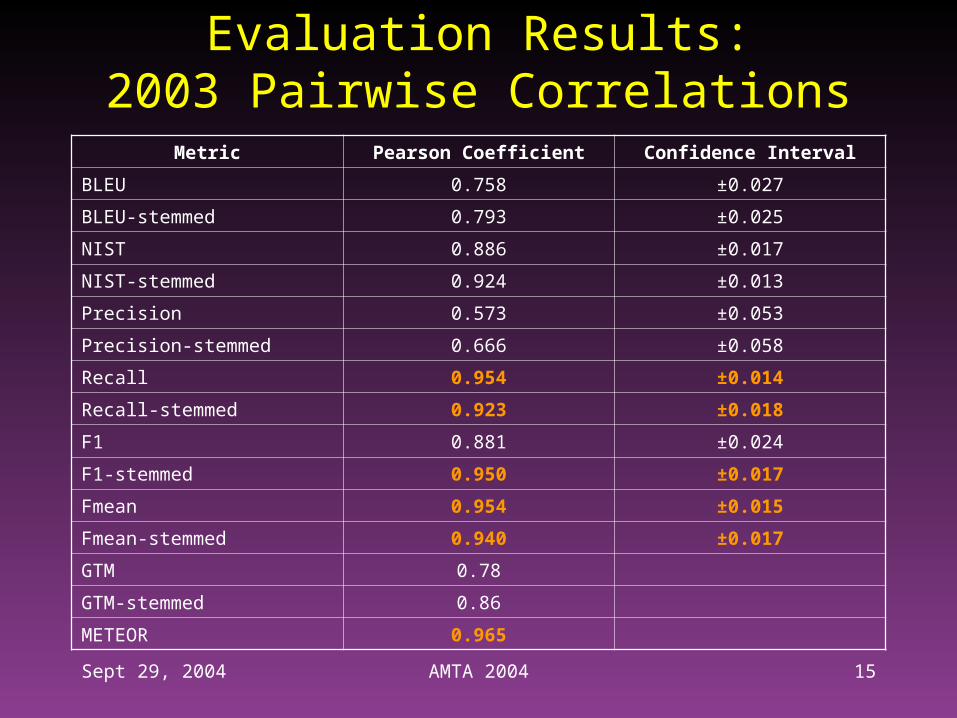
Evaluation Results:2003 Pairwise Correlations
Metric Pearson Coefficient Confidence Interval
BLEU 0.758 ±0.027
BLEU-stemmed 0.793 ±0.025
NIST 0.886 ±0.017
NIST-stemmed 0.924 ±0.013
Precision 0.573 ±0.053
Precision-stemmed 0.666 ±0.058
Recall 0.954 ±0.014
Recall-stemmed 0.923 ±0.018
F1 0.881 ±0.024
F1-stemmed 0.950 ±0.017
Fmean 0.954 ±0.015
Fmean-stemmed 0.940 ±0.017
GTM 0.78
GTM-stemmed 0.86
METEOR 0.965
Sept 29, 2004 AMTA 2004 16
Recent Related Work
• [Lin & Hovy 2003]• [Turian Shen & Melamed 2003]• [Babych & Hartley 2004]• [Soricut & Brill 2004]
Sept 29, 2004 AMTA 2004 17
Current and Future Directions
METEOR:Metric for Evaluation of Translation with Explicit Ordering
An Improved Automatic Metric for MT Evaluation
Faculty: Alon Lavie, Jaime Carbonell
Student:
Rachel Reynolds
Sept 29, 2004 AMTA 2004 19
Automatic Metrics for MT Evaluation
• Human evaluations are costly and time consuming
• Automatic evaluation is cheap and fast• Can support both objective comparison
between systems and incremental development of systems based on performance effects
• Essential to have a “good” metric: – Metric scores that correlate as closely as possible to
human judgments
Sept 29, 2004 AMTA 2004 20
The BLEU Metric• Proposed by IBM [Papineni et al, 2002]• First serious metric proposed, used extensively over last
couple of years (DARPA/TIDES, various other groups)• Main concepts in BLEU:
– Compare system output with a set of reference translations
– Calculate score based on n-grams matches (length 1-4) between the translation and the reference translations
– Aggregate Precision = # n-gram matches / total # of n-grams in system output (for each length n-gram)
– Weighed geometric averaging of the n-gram orders– Brevity Penalty if system output is too short– Compensation for not taking recall into account– Recall = # n-gram matches / total # n-grams in reference
translations (for each length n-gram)
Sept 29, 2004 AMTA 2004 21
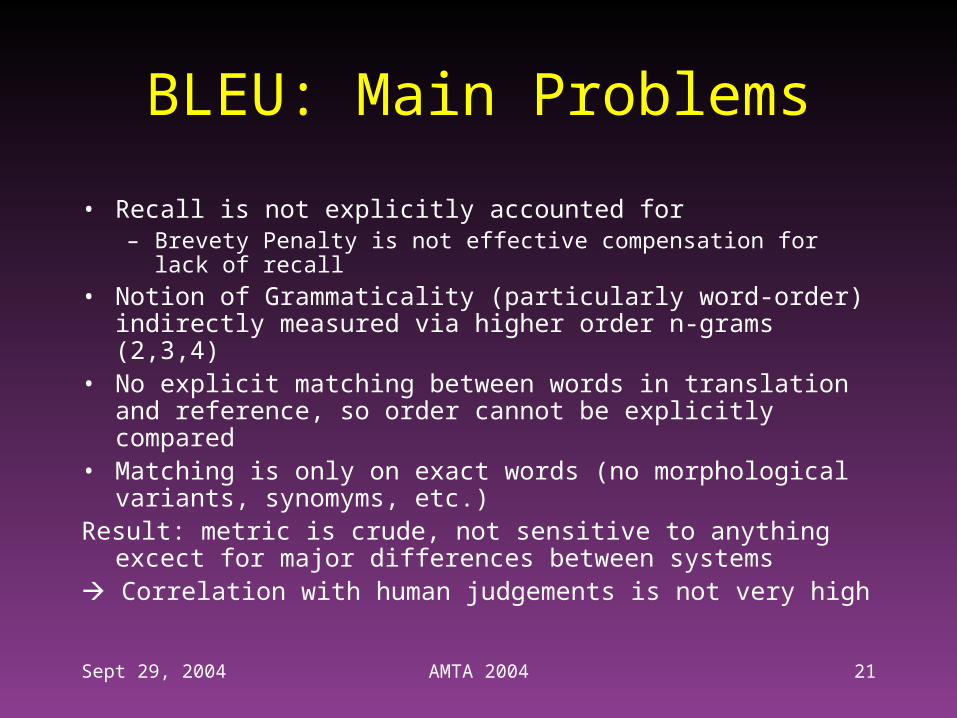
BLEU: Main Problems
• Recall is not explicitly accounted for– Brevety Penalty is not effective compensation for lack of
recall• Notion of Grammaticality (particularly word-order)
indirectly measured via higher order n-grams (2,3,4)• No explicit matching between words in translation and
reference, so order cannot be explicitly compared• Matching is only on exact words (no morphological
variants, synomyms, etc.)Result: metric is crude, not sensitive to anything excect for
major differences between systems Correlation with human judgements is not very high
Sept 29, 2004 AMTA 2004 22
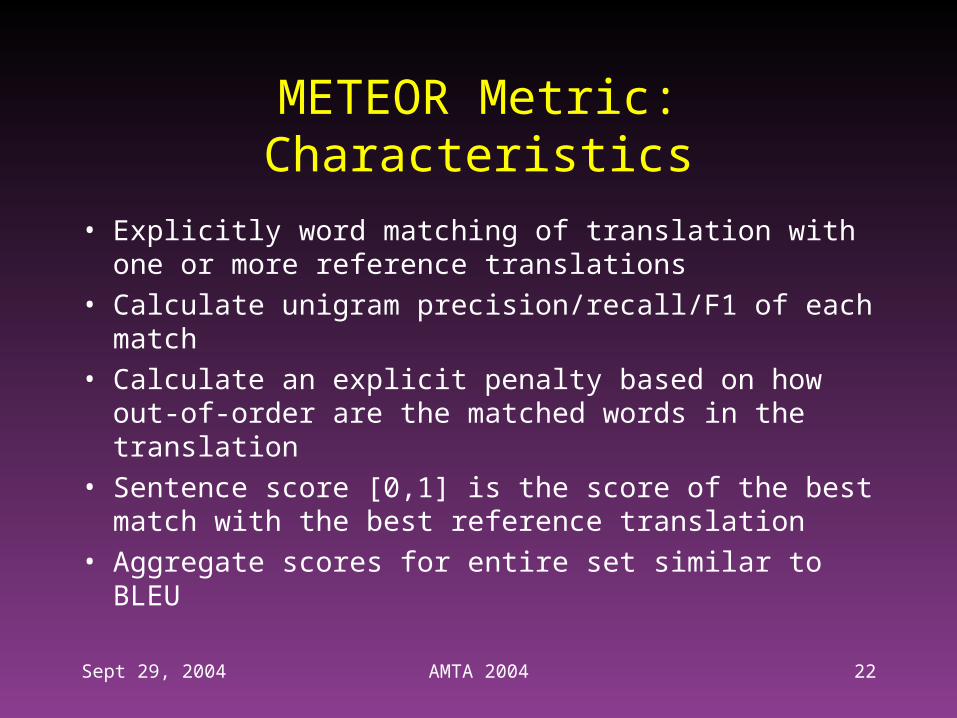
METEOR Metric: Characteristics
• Explicitly word matching of translation with one or more reference translations
• Calculate unigram precision/recall/F1 of each match
• Calculate an explicit penalty based on how out-of-order are the matched words in the translation
• Sentence score [0,1] is the score of the best match with the best reference translation
• Aggregate scores for entire set similar to BLEU
Sept 29, 2004 AMTA 2004 23
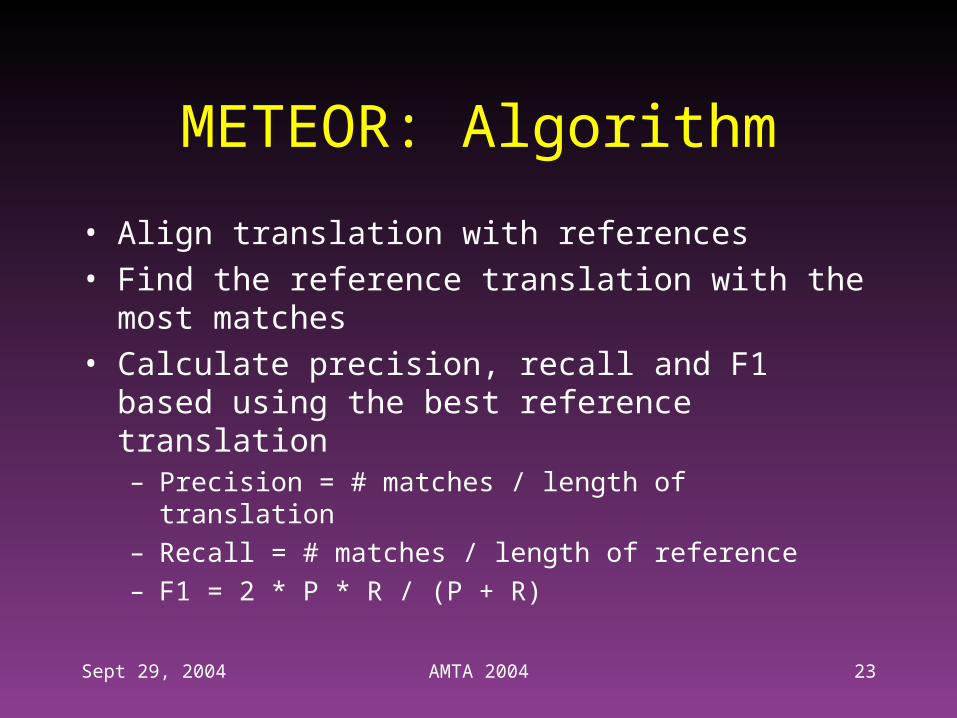
METEOR: Algorithm
• Align translation with references• Find the reference translation with the most
matches• Calculate precision, recall and F1 based using
the best reference translation– Precision = # matches / length of translation– Recall = # matches / length of reference– F1 = 2 * P * R / (P + R)
Sept 29, 2004 AMTA 2004 24
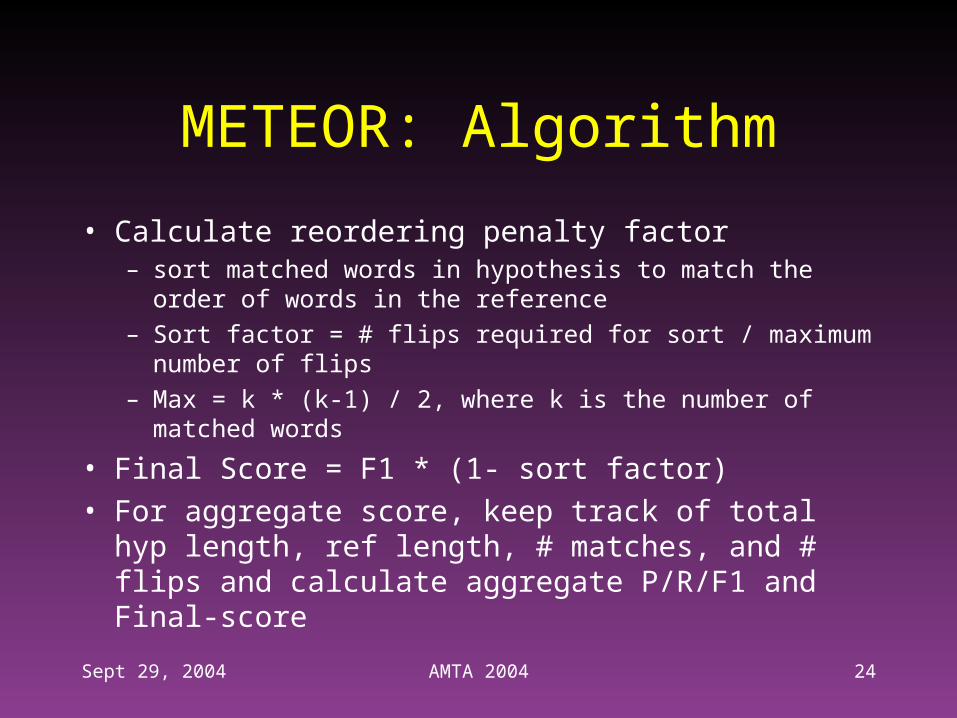
METEOR: Algorithm
• Calculate reordering penalty factor– sort matched words in hypothesis to match the order
of words in the reference– Sort factor = # flips required for sort / maximum
number of flips– Max = k * (k-1) / 2, where k is the number of
matched words
• Final Score = F1 * (1- sort factor)• For aggregate score, keep track of total hyp
length, ref length, # matches, and # flips and calculate aggregate P/R/F1 and Final-score
Sept 29, 2004 AMTA 2004 25
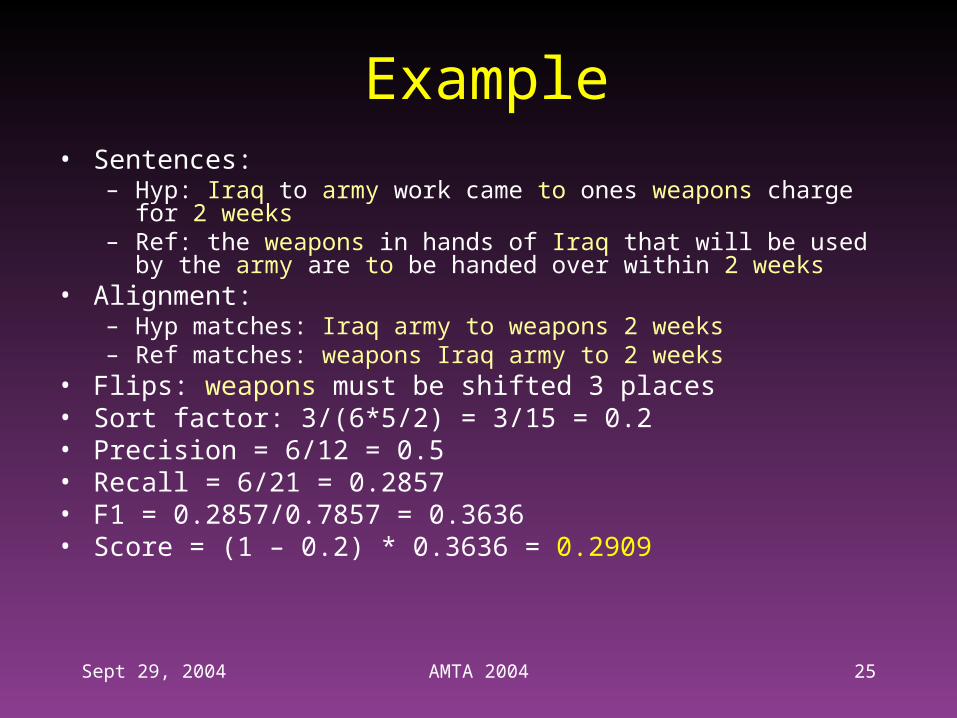
Example• Sentences:
– Hyp: Iraq to army work came to ones weapons charge for 2 weeks
– Ref: the weapons in hands of Iraq that will be used by the army are to be handed over within 2 weeks
• Alignment:– Hyp matches: Iraq army to weapons 2 weeks– Ref matches: weapons Iraq army to 2 weeks
• Flips: weapons must be shifted 3 places• Sort factor: 3/(6*5/2) = 3/15 = 0.2• Precision = 6/12 = 0.5• Recall = 6/21 = 0.2857• F1 = 0.2857/0.7857 = 0.3636• Score = (1 – 0.2) * 0.3636 = 0.2909
Sept 29, 2004 AMTA 2004 26
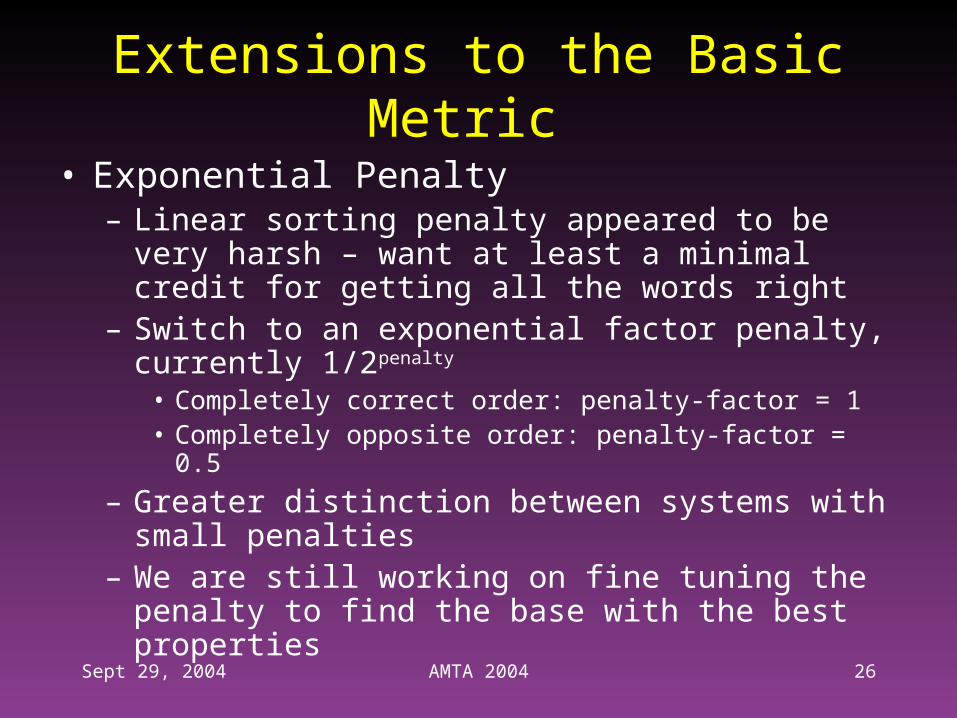
Extensions to the Basic Metric
• Exponential Penalty– Linear sorting penalty appeared to be very
harsh – want at least a minimal credit for getting all the words right
– Switch to an exponential factor penalty, currently 1/2penalty
• Completely correct order: penalty-factor = 1• Completely opposite order: penalty-factor = 0.5
– Greater distinction between systems with small penalties
– We are still working on fine tuning the penalty to find the base with the best properties
Sept 29, 2004 AMTA 2004 27
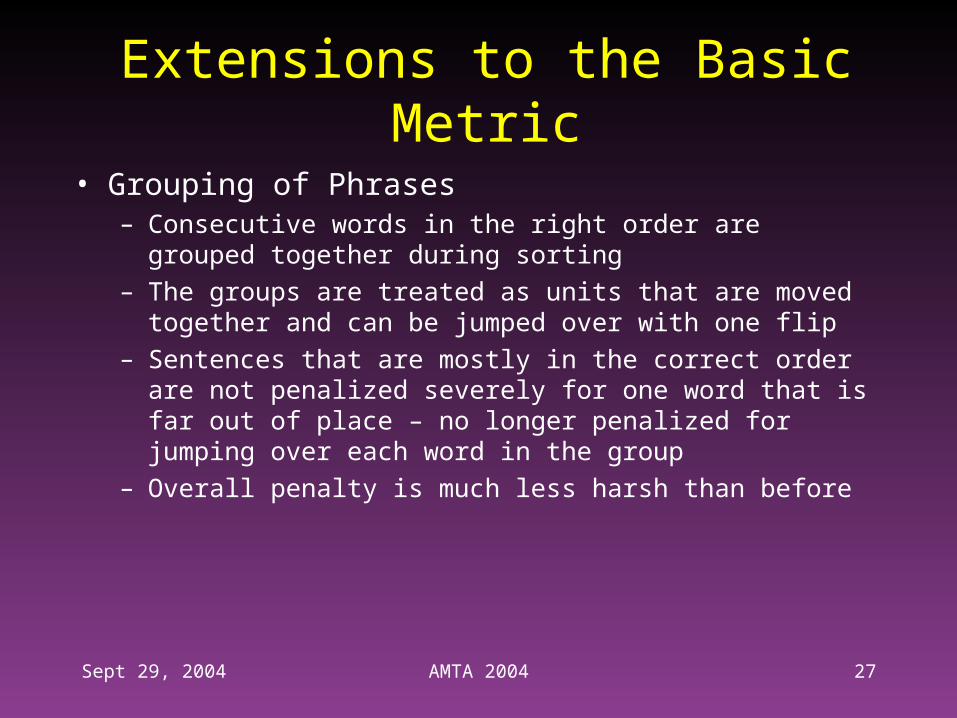
Extensions to the Basic Metric
• Grouping of Phrases– Consecutive words in the right order are grouped
together during sorting– The groups are treated as units that are moved
together and can be jumped over with one flip– Sentences that are mostly in the correct order are
not penalized severely for one word that is far out of place – no longer penalized for jumping over each word in the group
– Overall penalty is much less harsh than before
Sept 29, 2004 AMTA 2004 28
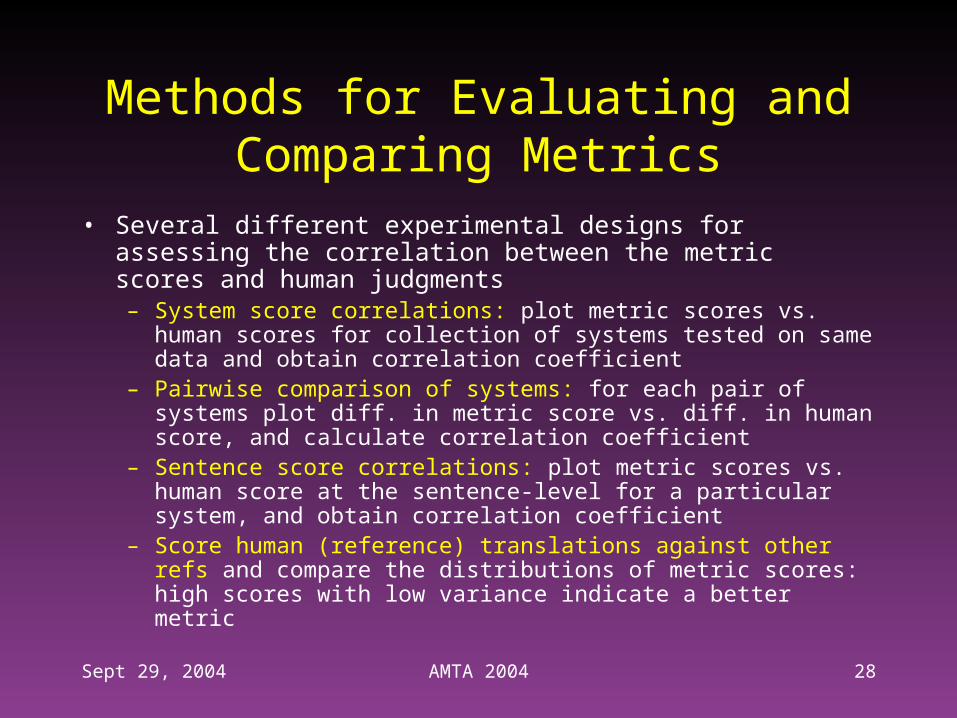
Methods for Evaluating and Comparing Metrics
• Several different experimental designs for assessing the correlation between the metric scores and human judgments– System score correlations: plot metric scores vs. human
scores for collection of systems tested on same data and obtain correlation coefficient
– Pairwise comparison of systems: for each pair of systems plot diff. in metric score vs. diff. in human score, and calculate correlation coefficient
– Sentence score correlations: plot metric scores vs. human score at the sentence-level for a particular system, and obtain correlation coefficient
– Score human (reference) translations against other refs and compare the distributions of metric scores: high scores with low variance indicate a better metric
Sept 29, 2004 AMTA 2004 29
Comparative Evaluation of METEOR vs. BLEU
• Two data sets: 2002 and 2003 Chinese-to-English TIDES MT system evaluations
• Human Evaluators– 11 Evaluators– Documents randomly distributed among evaluators– Each document graded by 2 evaluators
• Human Scores– Each sentence given a fluency and adequacy score– Both scores range from 1 to 5 (5 = highest)
• Quality of human evaluation is somewhat questionable (relatively low intergrader agreement)
Sept 29, 2004 AMTA 2004 30
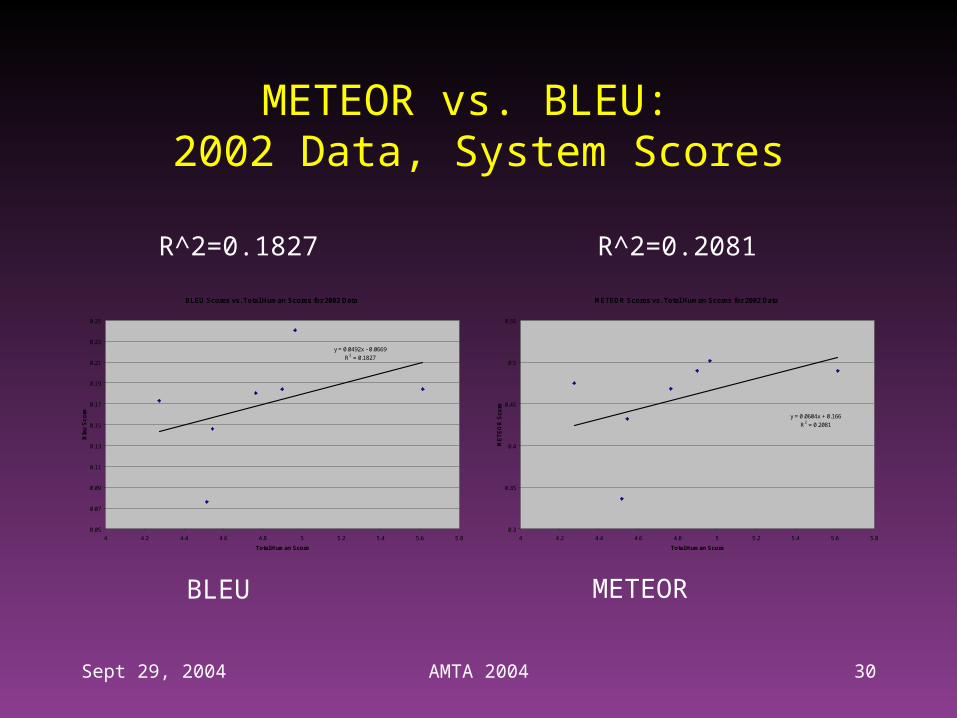
METEOR vs. BLEU: 2002 Data, System Scores
BLEU Scores vs. Total Human Scores for 2002 Data
y = 0.0492x - 0.0669
R2 = 0.1827
0.05
0.07
0.09
0.11
0.13
0.15
0.17
0.19
0.21
0.23
0.25
4 4.2 4.4 4.6 4.8 5 5.2 5.4 5.6 5.8
Total Human Score
Ble
u S
core
METEOR Scores vs. Total Human Scores for 2002 Data
y = 0.0604x + 0.166
R2 = 0.2081
0.3
0.35
0.4
0.45
0.5
0.55
4 4.2 4.4 4.6 4.8 5 5.2 5.4 5.6 5.8
Total Human Score
ME
TE
OR
Sco
re
R^2=0.1827 R^2=0.2081
BLEU METEOR
Sept 29, 2004 AMTA 2004 31
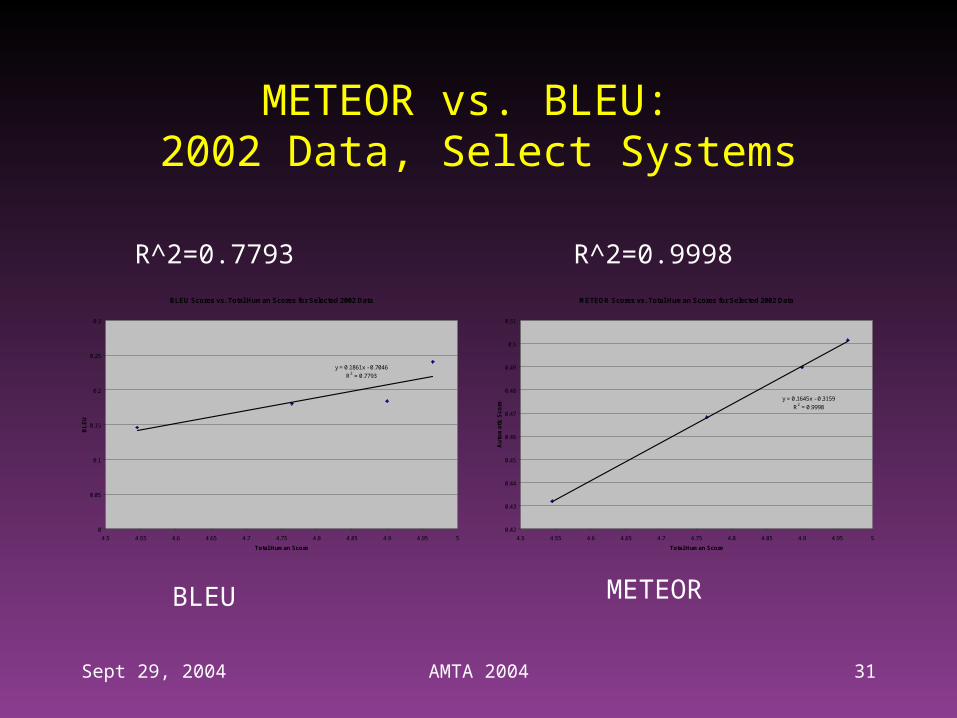
METEOR vs. BLEU: 2002 Data, Select Systems
BLEU Scores vs. Total Human Scores for Selected 2002 Data
y = 0.1861x - 0.7046
R2 = 0.7793
0
0.05
0.1
0.15
0.2
0.25
0.3
4.5 4.55 4.6 4.65 4.7 4.75 4.8 4.85 4.9 4.95 5
Total Human Score
BL
EU
METEOR Scores vs. Total Human Scores for Selected 2002 Data
y = 0.1645x - 0.3159
R2 = 0.9998
0.42
0.43
0.44
0.45
0.46
0.47
0.48
0.49
0.5
0.51
4.5 4.55 4.6 4.65 4.7 4.75 4.8 4.85 4.9 4.95 5
Total Human Score
Au
tom
atic
Sco
re
R^2=0.7793 R^2=0.9998
BLEU METEOR
Sept 29, 2004 AMTA 2004 32
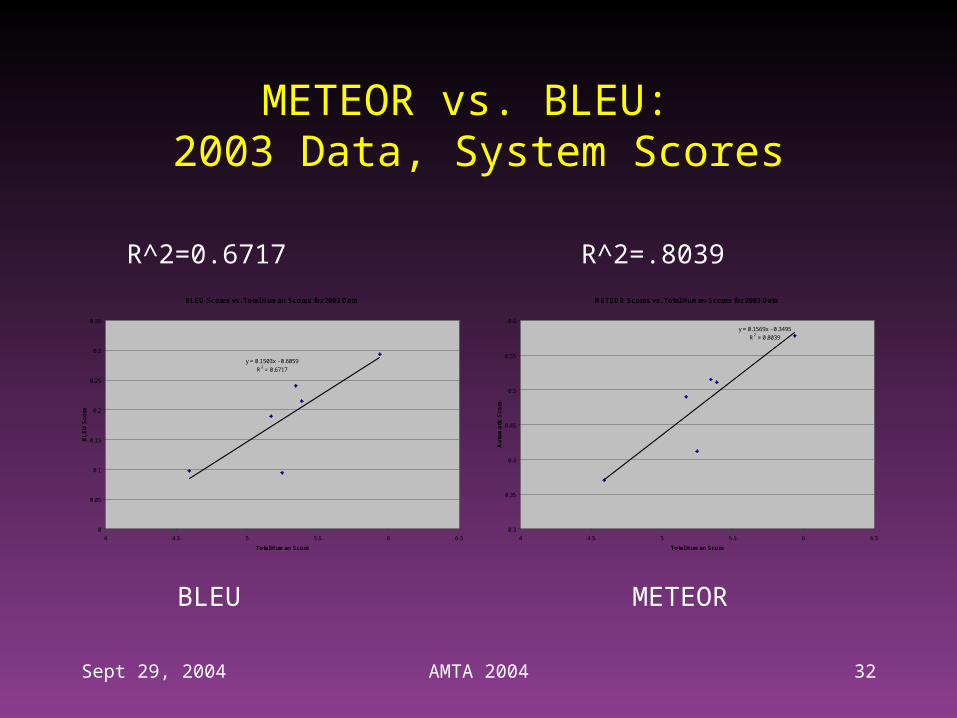
METEOR vs. BLEU: 2003 Data, System Scores
BLEU Scores vs. Total Human Scores for 2003 Data
y = 0.1503x - 0.6059
R2 = 0.6717
0
0.05
0.1
0.15
0.2
0.25
0.3
0.35
4 4.5 5 5.5 6 6.5
Total Human Score
BL
EU
Sco
re
METEOR Scores vs. Total Human Scores for 2003 Data
y = 0.1569x - 0.3495
R2 = 0.8039
0.3
0.35
0.4
0.45
0.5
0.55
0.6
4 4.5 5 5.5 6 6.5
Total Human Score
Au
tom
atic
Sco
re
R^2=0.6717 R^2=.8039
BLEU METEOR
Sept 29, 2004 AMTA 2004 33
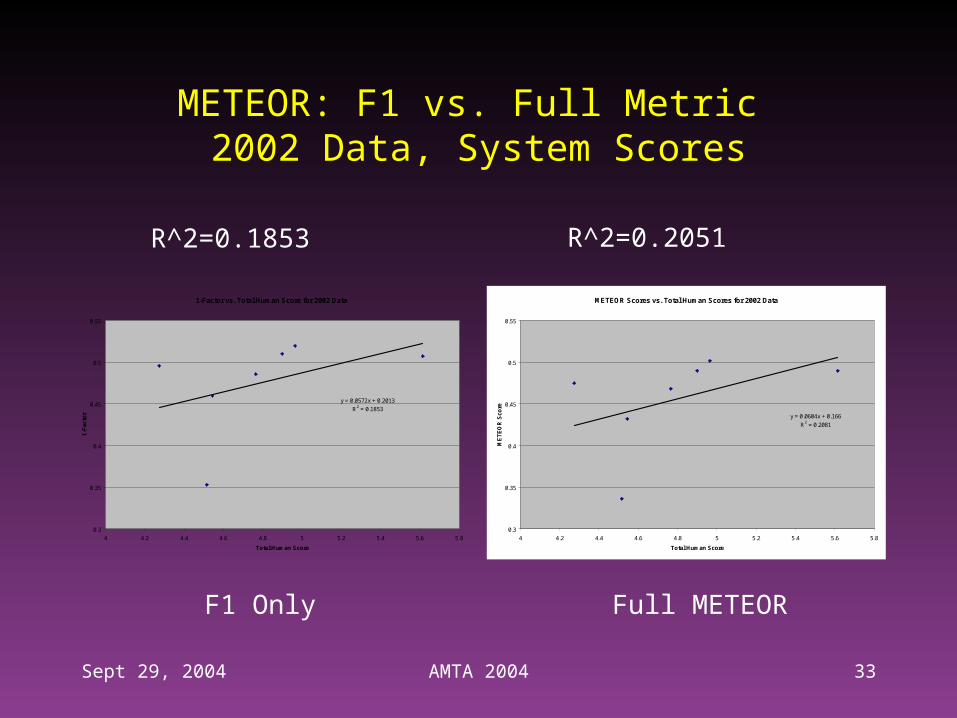
METEOR: F1 vs. Full Metric 2002 Data, System Scores
1-Factor vs. Total Human Score for 2002 Data
y = 0.0572x + 0.2013
R2 = 0.1853
0.3
0.35
0.4
0.45
0.5
0.55
4 4.2 4.4 4.6 4.8 5 5.2 5.4 5.6 5.8
Total Human Score
1-F
acto
r
METEOR Scores vs. Total Human Scores for 2002 Data
y = 0.0604x + 0.166
R2 = 0.2081
0.3
0.35
0.4
0.45
0.5
0.55
4 4.2 4.4 4.6 4.8 5 5.2 5.4 5.6 5.8
Total Human Score
ME
TE
OR
Sco
re
R^2=0.1853 R^2=0.2051
F1 Only Full METEOR
Sept 29, 2004 AMTA 2004 34
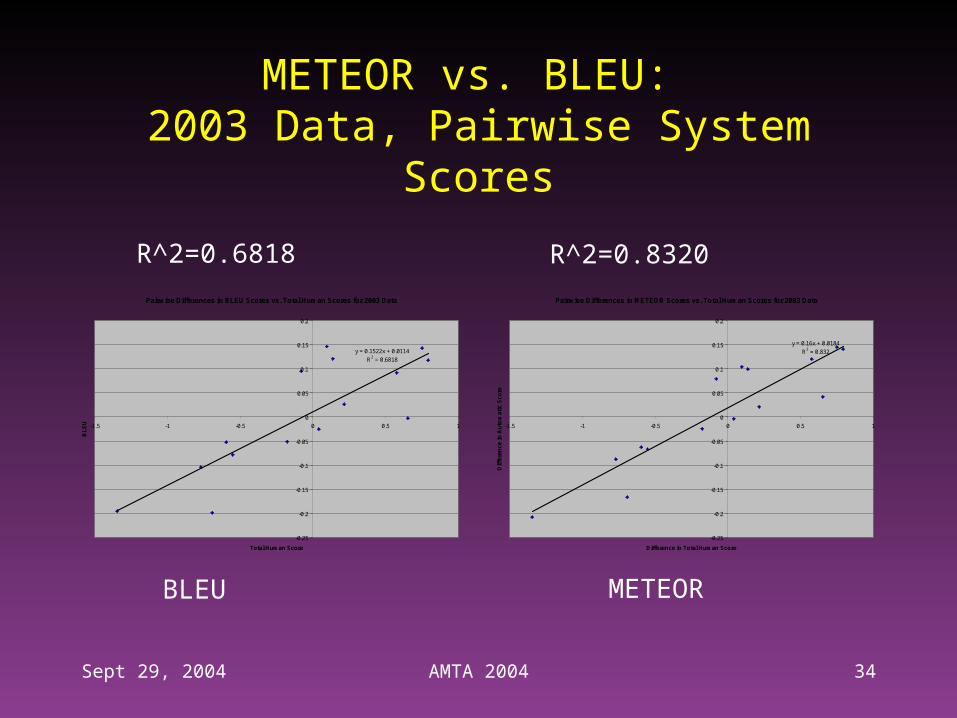
METEOR vs. BLEU: 2003 Data, Pairwise System Scores
Pairwise Differences in BLEU Scores vs. Total Human Scores for 2003 Data
y = 0.1522x + 0.0114
R2 = 0.6818
-0.25
-0.2
-0.15
-0.1
-0.05
0
0.05
0.1
0.15
0.2
-1.5 -1 -0.5 0 0.5 1
Total Human Score
BL
EU
Pairwise Differences in METEOR Scores vs. Total Human Scores for 2003 Data
y = 0.16x + 0.0184
R2 = 0.832
-0.25
-0.2
-0.15
-0.1
-0.05
0
0.05
0.1
0.15
0.2
-1.5 -1 -0.5 0 0.5 1
Difference in Total Human Score
Dif
fere
nce
in A
uto
mat
ic S
core
BLEU METEOR
R^2=0.6818 R^2=0.8320
Sept 29, 2004 AMTA 2004 35
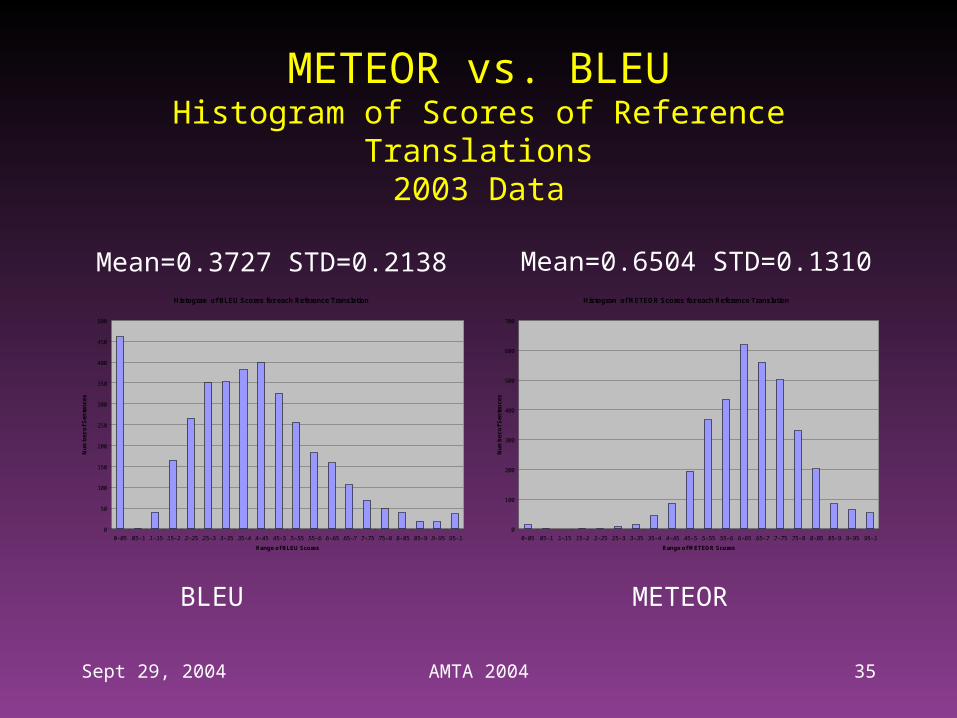
METEOR vs. BLEUHistogram of Scores of Reference Translations
2003 Data
Histogram of BLEU Scores for each Reference Translation
0
50
100
150
200
250
300
350
400
450
500
0-.05 .05-.1 .1-.15 .15-.2 .2-.25 .25-.3 .3-.35 .35-.4 .4-.45 .45-.5 .5-.55 .55-.6 .6-.65 .65-.7 .7-.75 .75-.8 .8-.85 .85-.9 .9-.95 .95-.1
Range of BLEU Scores
Nu
mb
er o
f S
ente
nce
s
Histogram of METEOR Scores for each Reference Translation
0
100
200
300
400
500
600
700
0-.05 .05-.1 .1-.15 .15-.2 .2-.25 .25-.3 .3-.35 .35-.4 .4-.45 .45-.5 .5-.55 .55-.6 .6-.65 .65-.7 .7-.75 .75-.8 .8-.85 .85-.9 .9-.95 .95-.1
Range of METEOR Scores
Nu
mb
er o
f S
ente
nce
s
BLEU METEOR
Mean=0.3727 STD=0.2138 Mean=0.6504 STD=0.1310
Sept 29, 2004 AMTA 2004 36
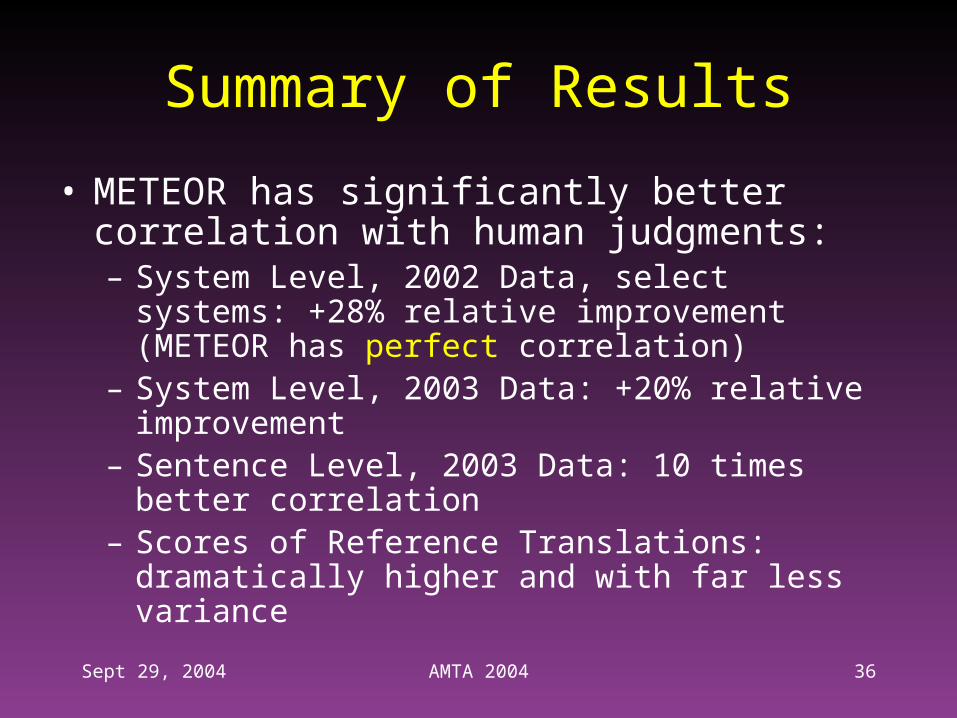
Summary of Results
• METEOR has significantly better correlation with human judgments:– System Level, 2002 Data, select systems:
+28% relative improvement (METEOR has perfect correlation)
– System Level, 2003 Data: +20% relative improvement
– Sentence Level, 2003 Data: 10 times better correlation
– Scores of Reference Translations: dramatically higher and with far less variance
Sept 29, 2004 AMTA 2004 37
Work in Progress
• Tuning the exponential penalty for the right degree of differentiation and maximum penalty
• Using a lattice to create new “synthetic” reference translations so that the best reference can be a combination of references
• Weighing matches based on part of speech so that content words can influence the score more than function words
• Matching with partial credit for words similar in meaning to a word in the reference translation: morphological variants, synonyms


