Draft version June 11, 2020 Typeset using L A T E X preprint style in AASTeX62 The Sixth Data Release of the Radial Velocity Experiment (Rave) – I: Survey Description, Spectra and Radial Velocities Matthias Steinmetz, 1 Gal Matijeviˇ c, 1 Harry Enke, 1 Tomaˇ z Zwitter, 2 Guillaume Guiglion, 1 Paul J. McMillan, 3 Georges Kordopatis, 4 Marica Valentini, 1 Cristina Chiappini, 1 Luca Casagrande, 5 Jennifer Wojno, 6 Borja Anguiano, 7 Olivier Bienaym´ e, 8 Albert Bijaoui, 4 James Binney, 9 Donna Burton, 10, 11 Paul Cass, 10 Patrick de Laverny, 4 Kristin Fiegert, 10 Kenneth Freeman, 5 Jon P. Fulbright, 6 Brad K. Gibson, 12 Gerard Gilmore, 13 Eva K. Grebel, 14 Amina Helmi, 15 Andrea Kunder, 16 Ulisse Munari, 17 Julio F. Navarro, 18 Quentin Parker, 19, 20 Gregory R. Ruchti, 6, * Alejandra Recio-Blanco, 4 Warren Reid, 21, 22 G. M. Seabroke, 23 Alessandro Siviero, 24 Arnaud Siebert, 8 Milorad Stupar, 10, 25 Fred Watson, 26 Mary E.K. Williams, 1 Rosemary F.G. Wyse, 6, 27 Friedrich Anders, 28, 1 Teresa Antoja, 29 Danijela Birko, 30 Joss Bland-Hawthorn, 31 Diego Bossini, 32 Rafael A. Garc´ ıa, 33, 34 Ismael Carrillo, 1 William J. Chaplin, 35, 36 Yvonne Elsworth, 37, 36 Benoit Famaey, 8 Ortwin Gerhard, 38 Paula Jofre, 39 Andreas Just, 14 Savita Mathur, 40, 41 Andrea Miglio, 37, 36 Ivan Minchev, 1 Giacomo Monari, 1, 8 Benoit Mosser, 42 Andreas Ritter, 20 Thaise S. Rodrigues, 17 Ralf-Dieter Scholz, 1 Sanjib Sharma, 31 and Kseniia Sysoliatina 14 (The Rave collaboration) 1 Leibniz-Institut f¨ ur Astrophysik Potsdam (AIP), An der Sternwarte 16, 14482 Potsdam, Germany 2 University of Ljubljana, Faculty of Mathematics and Physics, Jadranska 19, SI-1000 Ljubljana, Slovenia 3 Lund Observatory, Department of Astronomy and Theoretical Physics, Lund University, Box 43, 22100 Lund, Sweden 4 Universit´ e Cˆ ote d’Azur, Observatoire de la Cˆote d’Azur, CNRS, Laboratoire Lagrange, France 5 Research School of Astronomy & Astrophysics, The Australian National University, Canberra, Australia 6 The Johns Hopkins University, Department of Physics and Astronomy, 3400 N. Charles Street, Baltimore, MD 21218, USA 7 Department of Astronomy, University of Virginia, Charlottesville, VA, 22904, USA 8 Observatoire astronomique de Strasbourg, Universit´ e de Strasbourg, CNRS, 11 rue de l’Universit´ e, F-67000 Strasbourg, France 9 Rudolf Peierls Centre for Theoretical Physics, Clarendon Laboratory, Parks Road, Oxford, OX1 3PU, UK 10 Australian Astronomical Observatory, Siding Spring, Coonabarabran NSW 2357, Australia 11 University of Southern Queensland (USQ), West Street Toowoomba Qld 4350 Australia 12 E.A. Milne Centre for Astrophysics, University of Hull, Hull, HU6 7RX, United Kingdom 13 Institute of Astronomy, Cambridge, UK 14 Astronomisches Rechen-Institut, Zentrum f¨ ur Astronomie der Universit¨at Heidelberg, M¨onchhofstr. 12–14, 69120 Heidelberg, Germany 15 Kapteyn, Astronomical Institute, University of Groningen, P.O. Box 800, 9700 AV Groningen, The Netherlands 16 Saint Martin’s University, 5000 Abbey Way SE, Lacey, WA, 98503, USA 17 INAF Astronomical Observatory of Padova, 36012 Asiago (VI), Italy 18 Department of Physics and Astronomy, University of Victoria, Victoria, BC, Canada V8P5C2. 19 CYM Physics Building, The University of Hong Kong, Pokfulam, Hong Kong SAR, PRC Corresponding author: Matthias Steinmetz [email protected]arXiv:2002.04377v2 [astro-ph.SR] 9 Jun 2020
Transcript
Draft version June 11, 2020
Typeset using LATEX preprint style in AASTeX62
The Sixth Data Release of the Radial Velocity Experiment (Rave) – I: Survey Description, Spectraand Radial Velocities
Matthias Steinmetz,1 Gal Matijevic,1 Harry Enke,1 Tomaz Zwitter,2 Guillaume Guiglion,1
Paul J. McMillan,3 Georges Kordopatis,4 Marica Valentini,1 Cristina Chiappini,1
Luca Casagrande,5 Jennifer Wojno,6 Borja Anguiano,7 Olivier Bienayme,8
Albert Bijaoui,4 James Binney,9 Donna Burton,10, 11 Paul Cass,10 Patrick de Laverny,4
Kristin Fiegert,10 Kenneth Freeman,5 Jon P. Fulbright,6 Brad K. Gibson,12
Gerard Gilmore,13 Eva K. Grebel,14 Amina Helmi,15 Andrea Kunder,16 Ulisse Munari,17
Julio F. Navarro,18 Quentin Parker,19, 20 Gregory R. Ruchti,6, ∗ Alejandra Recio-Blanco,4
Warren Reid,21, 22 G. M. Seabroke,23 Alessandro Siviero,24 Arnaud Siebert,8
Milorad Stupar,10, 25 Fred Watson,26 Mary E.K. Williams,1 Rosemary F.G. Wyse,6, 27
Friedrich Anders,28, 1 Teresa Antoja,29 Danijela Birko,30 Joss Bland-Hawthorn,31
Diego Bossini,32 Rafael A. Garcıa,33, 34 Ismael Carrillo,1 William J. Chaplin,35, 36
Yvonne Elsworth,37, 36 Benoit Famaey,8 Ortwin Gerhard,38 Paula Jofre,39 Andreas Just,14
Savita Mathur,40, 41 Andrea Miglio,37, 36 Ivan Minchev,1 Giacomo Monari,1, 8
Benoit Mosser,42 Andreas Ritter,20 Thaise S. Rodrigues,17 Ralf-Dieter Scholz,1
Sanjib Sharma,31 and Kseniia Sysoliatina14
(The Rave collaboration)
1Leibniz-Institut fur Astrophysik Potsdam (AIP), An der Sternwarte 16, 14482 Potsdam, Germany2University of Ljubljana, Faculty of Mathematics and Physics, Jadranska 19, SI-1000 Ljubljana, Slovenia
3Lund Observatory, Department of Astronomy and Theoretical Physics, Lund University, Box 43, 22100 Lund, Sweden4Universite Cote d’Azur, Observatoire de la Cote d’Azur, CNRS, Laboratoire Lagrange, France
5Research School of Astronomy & Astrophysics, The Australian National University, Canberra, Australia6The Johns Hopkins University, Department of Physics and Astronomy, 3400 N. Charles Street, Baltimore, MD
21218, USA7Department of Astronomy, University of Virginia, Charlottesville, VA, 22904, USA
8Observatoire astronomique de Strasbourg, Universite de Strasbourg, CNRS, 11 rue de l’Universite, F-67000Strasbourg, France
9Rudolf Peierls Centre for Theoretical Physics, Clarendon Laboratory, Parks Road, Oxford, OX1 3PU, UK10Australian Astronomical Observatory, Siding Spring, Coonabarabran NSW 2357, Australia
11University of Southern Queensland (USQ), West Street Toowoomba Qld 4350 Australia12E.A. Milne Centre for Astrophysics, University of Hull, Hull, HU6 7RX, United Kingdom
13Institute of Astronomy, Cambridge, UK14Astronomisches Rechen-Institut, Zentrum fur Astronomie der Universitat Heidelberg, Monchhofstr. 12–14, 69120
Heidelberg, Germany15Kapteyn, Astronomical Institute, University of Groningen, P.O. Box 800, 9700 AV Groningen, The Netherlands
16Saint Martin’s University, 5000 Abbey Way SE, Lacey, WA, 98503, USA17INAF Astronomical Observatory of Padova, 36012 Asiago (VI), Italy
18Department of Physics and Astronomy, University of Victoria, Victoria, BC, Canada V8P5C2.19CYM Physics Building, The University of Hong Kong, Pokfulam, Hong Kong SAR, PRC
20The Laboratory for Space Research, Hong Kong University, Cyberport 4, Hong Kong SAR, PRC21Department of Physics and Astronomy, Macquarie University, Sydney, NSW 2109, Australia
22Western Sydney University, Locked bag 1797, Penrith South, NSW 2751, Australia23Mullard Space Science Laboratory, University College London, Holmbury St Mary, Dorking, RH5 6NT, UK24Dipartimento di Fisica e Astronomia G. Galilei, Universita’ di Padova, Vicolo dell’Osservatorio 3, I-35122,
Padova, Italy25Western Sydney University, Locked Bag 1797, Penrith South, NSW 2751, Australia
26Department of Industry, Innovation and Science, 105 Delhi Rd, North Ryde, NSW 2113, Australia27Kavli Institute for Theoretical Physics, University of California, Santa Barbara, CA 93106, USA
28Institut de Ciencies del Cosmos, Universitat de Barcelona (IEEC-UB), Martı i Franques 1, 08028 Barcelona, Spain29Institut de Ciencies del Cosmos de la Universitat de Barcelona, Martı i Franques 1, 09028 Barcelona (Spain)
30University of Ljubljana, Faculty of Mathematics and Physics, Ljubljana, Slovenia31Sydney Institute for Astronomy, School of Physics, The University of Sydney, NSW 2006, Australia
32Instituto de Astrofısica e Ciencias do Espaco, Universidade do Porto, CAUP, Rua das Estrelas, 4150-762Porto,Portugal
33IRFU, CEA, Universite Paris-Saclay, F-91191 Gif-sur-Yvette, France34AIM, CEA, CNRS, Universite Paris-Saclay, Universite Paris Diderot, Sorbonne Paris Cite, F-91191
Gif-sur-Yvette, France35School of Physics and Astronomy, University of Birmingham, Edgbaston, Birmingham B15 2TT, UK
36Stellar Astrophysics Centre (SAC), Department of Physics and Astronomy, Aarhus University, DK-8000 Aarhus C,Denmark
37School of Physics and Astronomy, University of Birmingham, Edgbaston, Birmingham, B15 2TT, UK38Max-Planck-Institut fur extraterrestrische Physik, Postfach 1312, Giessenbachstr., 85741 Garching, Germany
39Nucleo de Astronomıa, Facultad de Ingenierıa y Ciencias, Universidad Diego Portales, Ejercito 441, Santiago deChile
40Instituto de Astrofısica de Canarias, La Laguna, Tenerife, Spain41Dpto. de Astrofısica, Universidad de La Laguna, La Laguna, Tenerife, Spain
42LESIA, Observatoire de Paris, PSL Research University, CNRS, Sorbonne Universite, Universite Paris Diderot,92195 Meudon, France
ABSTRACT
The Radial Velocity Experiment (Rave) is a magnitude-limited (9 < I < 12) spectroscopicsurvey of Galactic stars randomly selected in the southern hemisphere. The Rave medium-resolution spectra (R ∼ 7500) cover the Ca-triplet region (8410− 8795 A). The 6th and finaldata release (DR6 or FDR) is based on 518 387 observations of 451 783 unique stars. Raveobservations were taken between 12 April 2003 and 4 April 2013. Here we present the gene-sis, setup and data reduction of Rave as well as wavelength-calibrated and flux-normalizedspectra and error spectra for all observations in Rave DR6. Furthermore, we present de-rived spectral classification and radial velocities for the Rave targets, complemented by crossmatches with Gaia DR2 and other relevant catalogs. A comparison between internal errorestimates, variances derived from stars with more than one observing epoch and a compar-ison with radial velocities of Gaia DR2 reveals consistently that 68% of the objects have avelocity accuracy better than 1.4 km s−1, while 95% of the objects have radial velocities betterthan 4.0 km s−1. Stellar atmospheric parameters, abundances and distances are presented in
Rave DR6 - I.: spectra and radial velocities 3
subsequent publication. The data can be accessed via the Rave Web sitea) or the Vizierdatabase.
Keywords: surveys — stars: abundances, distances
1. INTRODUCTION
Deciphering the structure and formation history of the Galaxy provides important clues for under-standing galaxy formation in a broader context. Wide field spectroscopic surveys play a particularlyimportant role in the analysis of the Milky Way: Spectroscopy enables a measure of a star’s radialvelocity (RV), one of the six-dimensional coordinates of position and velocity, which in turn allowsus to study the details of Galactic dynamics. Spectroscopy also permits a measure of the abun-dances of chemical elements in a star’s atmosphere, which holds important clues to the star’s initialchemical composition and the subsequent metal enrichment of the interstellar medium traced bystars of different ages and metallicities (see, e.g., Freeman & Bland-Hawthorn 2002; Bland-Hawthorn& Gerhard 2016). However, despite the importance of stellar spectroscopy for Galactic dynamicsand Galactic archaeology, the data situation in the early 2000s was far from satisfactory. RVs werelisted for some 50,000 stars in the databases of the Centre de Donnees astronomiques de Strasbourg(CDS), an astonishingly small number compared to the approximately one million spectra availablefor galaxy redshifts listed at that time. Furthermore, these RVs and their underlying spectra com-prised a very heterogeneous sample in terms of selection, resolution, epoch or signal-to-noise ratio(SNR). The situation changed somewhat with the advent of the Geneva Copenhagen survey (CGS,Nordstrom et al. 2004), which provided radial velocities, effective temperatures, and metalicities fora homogeneous sample of 14,139 stars. However, this sample covered only a sphere of about 100 pcradius around the Sun (the so-called Hipparcos sphere).
The RAdial Velocity Experiment (Rave) was originally set up as a pilot survey using the ex-isting 6dF multi-object spectrograph at AAO’s UK Schmidt telescope (UKST) to observe about100,000 stars in ∼ 180 nights of unscheduled bright time during the years 2003-2005 (Steinmetz2003). Spectra were to be taken covering the IR Ca triplet region also employed by the Gaia RVSsystem (see Recio-Blanco et al. 2016). Motivated also by the astrometric satellite mission conceptsDIVA (Deutsches Interferometer fur Vielkanalphotometrie und Astrometrie, Bastian et al. 2001)and FAME (Full-sky Astrometric Mapping Explorer, Johnston 2003), this pilot survey was intendedas a path finder for a considerably larger campaign targeting up to 40 million targets using a newEchidna-based multi-object spectrograph for the UKST, thus providing a vast kinematic databasethree orders of magnitude larger than any other survey planned in this period. While the DIVA andFAME missions were terminated in 2004, the results of the Rave pilot survey were very encouraging.In particular, in addition to radial velocities, the determination of relevant information on stellar at-mospheric parameters and potentially even abundance ratios appeared feasible. Consequently Rave
was continued for, eventually, a full ten year period, providing one of the largest data bases for stellarparameters and radial velocities. Meanwhile a series of five data releases (DRs) with an increasingnumber of targets and increasingly refined data products have been released: DR1 (Steinmetz et al.2006) provided radial velocities derived from 25,274 spectra; DR2 (Zwitter et al. 2008) radial veloci-
a) http://rave-survey.org∗ deceased
4 Steinmetz et al.
ties and atmospheric parameters derived from 51,829 spectra; DR3 (Siebert et al. 2011) the full pilotsurvey with 83,072 spectra; DR4 (Kordopatis et al. 2013) employed a new and much more refinedpipeline for stellar parameter determination, and provided radial velocities and stellar parametersbased on 482,430 spectra; DR5 (Kunder et al. 2017) provided a new and enhanced calibration of thederived stellar parameters, included a new calibration of giant stars based on information from theasteroseismic K2 mission, and linked Rave targets to the Tycho-Gaia astrometric solution of GaiaDR1 (TGAS: Lindegren et al. 2016). The Rave data releases were complemented by value addedcatalogs, including spectro-photometric distances (Breddels et al. 2010; Zwitter et al. 2010; Burnettet al. 2011; Binney et al. 2014; McMillan et al. 2018), chemical abundances (Boeche et al. 2011;Casey et al. 2017), and automated spectral classification (Matijevic et al. 2012) as well as catalogsof active stars (Zerjal et al. 2013, 2017) and of candidates for very metal-poor stars (Matijevic et al.2017). Furthermore, Rave has meanwhile been complemented by surveys of similar or even largersize at lower (e.g., SEGUE (Yanny et al. 2009) and LAMOST (Zhao et al. 2012)) and higher spectralresolution (e.g., APOGEE (Majewski et al. 2017), GALAH (De Silva et al. 2015), and Gaia-ESO(Gilmore et al. 2012)). For a recent review on abundances derived from large spectroscopic surveyswe refer to Jofre et al. (2019).
The pair of this paper (DR6-1) and its accompanying paper (DR6-2 Steinmetz et al. 2020) is the 6thand last publication in the series of Rave data release papers. DR6-1 will focus on the spectra takenand is accompanied by a data base of wavelength calibrated and flux normalized spectra for 518 387observations of 451 783 unique stars. DR6-2 provides a new set of stellar parameters employingparallax information from Gaia DR2 (Gaia Collaboration et al. 2018), a robust [α/Fe] ratio, andindividual [Fe/H], [Al/H] and [Ni/H] ratios.
DR6-1 is structured as follows: in Section 2 we give an overview of the survey facility and perfor-mance. We outline the data reduction and provide direct references to sections of previous paperswhere the interested reader can find further details. Section 3 presents the spectra in the Ravespectral catalog, which we are releasing here for the first time, and the reduction procedure of theRave raw data. Section 4 presents the automated classification of Rave spectra. Section 5 is de-voted to the derivation of radial velocities. Rave data validation including a comparison of Raveradial velocities with Gaia DR2 data is done in Section 6. Section 7 presents the Rave spectral DR6catalog, radial velocities, classification, and crossmatch with other relevant catalog data. Finally,Section 7 gives a summary, draws some conclusions, and provides an outlook.
2. SURVEY DESCRIPTION
Most of the technical specification and description of the Survey performance in terms of observa-tional setup, procedure, and data reduction are outlined in the DR1-DR5 data release papers. Sincethis paper describes the final data release, we give an overview of the basic survey procedures andprovide references to the sections in previous papers where the interested reader can find furtherdetails.
2.1. Survey Facility
Rave observations were performed at the 1.23m UK Schmidt telescope at Siding Spring in Australiausing the 6dF multi-object spectrograph (Watson et al. 2000), featuring a 5.7◦ field of view. 6dFconsisted of an off-telescope robotic fiber positioner, two fiber field plates of 150 fibers each (three asof February 2009), and a bench-mounted spectrograph, mounted on the floor of the telescope dome.
Rave DR6 - I.: spectra and radial velocities 5
The spectrograph was fed from the UKST when one of the field plates was mounted to the telescope.Each fiber had a diameter corresponding to 6.7′′ on the sky and could be placed with an accuracyof 0.7′′ within the ∼ 6◦ diameter field. The spectrograph used a volume phase holographic (VPH)transmission grating of medium dispersing power; this 1700 lines mm−1 grating was tuned for highefficiency in the I-band. This setup corresponded to an average resolving power of R ≈ 7500 overthe calcium triplet region at 8410 − 8795 A. The wavelength region covered by Rave is thus verysimilar to that probed by the Gaia RVS instrument (Cropper et al. 2018) at somewhat lower averageresolution (RRVS = 11, 500). The CCD used in the 6dF instrument was a Marconi (EEV) CCD47-BIdetector that features 13µm pixels in a 1056× 1027 array. It had a quantum efficiency of 30-40% inthe wavelength region adopted by Rave. For further details we refer to DR1, Section 2.1.
Each field plate featured ≈ 150 fibers deployed from a ring around the periphery of the 5.7◦ field.Each fiber could nominally reach 10% past the field center and was constrained to an angle of ±14◦,resulting in subtle allocation biases (Miszalski et al. 2006, see also Figure 3 in DR1). The actualallocatable fiber numbers typically varied between 100 and 120 (but could be as low as 80 immediatelybefore fiber bundles were refurbished). The most common problem for fiber unavailability were fiberbreakages while parking fibers. Other problems include deterioration of fiber throughput or problemsfor the robot picking up fiber buttons.
Prior to configuring a field, each target was drawn from the input catalog (see Section 2.2) based onpriorities given within the input target list. The targets were then manually checked for contamina-tion, double star proximity and variability by downloading thumbnail images from the SupercosmosSky Survey (SSS, Hambly et al. 2001) that are large enough to cover the fibers field of view. Con-taminated stars were replaced until a clean, homogeneous field was achieved. Each candidate wasthen allocated to a given fiber using a sophisticated field configuration algorithm based on that de-veloped for the 2dF spectrograph (Lewis et al. 2002). The field configuration algorithm accepts anuser-supplied input catalog and configures fibers based on priorities given within the input targetlist.
Configuring a full field plate typically took about an hour, a relevant boundary condition for settingthe typical exposure time (and magnitude of the targets). At a magnitude of I = 10−11, the exposuretime to reach a SNR > 40, the target density of objects of that magnitude at the Galactic poles withina 5.7◦ field, and the configuration time fitted neatly together to give a sensible exposure time of ≈ 1h.
After the conclusion of the Rave survey in April 2013, the 6dF facility (spectrograph, robot, andpositioner) was decommissioned and taken out of operation.
2.2. Survey design and input catalog
Rave was designed to be a magnitude limited spectroscopic survey that avoids any kinematic biasesin the target selection. The magnitude range probed corresponds to 9 < I < 12, where I is CousinsI. No color selection was performed (see however the discussion below for the added fields at lowGalactic latitudes). The wavelength range of Rave of 8410− 8795 A overlaps with the photometricCousins I band.
When the Rave survey started preparation for the first years of operation in 2002, neither the2MASS (Skrutskie et al. 2006) nor the DENIS (Epchtein et al. 1997) catalog was available. Therefore,Rave targets stars were drawn from the Tycho-2 catalog (Høg et al. 2000) and from SSS. For theTycho I-band, the magnitudes were estimated using the transformation formulae from Perryman
6 Steinmetz et al.
(1997) and Bessell (1979). The photographic IIVN magnitudes in SSS are directly equivalent toCousins I (Blair & Gilmore 1982) and no further transformation was applied.
Stars between 11 < I < 12 were exclusively drawn from SSS. Stars with 9 < I < 11 originatepredominantly in Tycho-2, but SSS stars that do not appear within 6.7′′ (corresponding to the sizeof a fiber on the sky) of a Tycho star are included as well. We also did not include stars in Tycho2 or SSS that were within 6.7′′ of another Tycho-2/SSS star to exclude possible contamination byunresolved multiple sources . For the same reason, i.e., to avoid unresolved multiple sources withina single fiber, the initial input catalog was limited to fields at Galactic latitudes of b > 25◦, but forobserving efficiency reasons (available sky regions observable with UKST for given observing epoch),fields with 15◦ < |b| ≤ 25 deg were subsequently added for all Galactic longitudes (`). The fieldcenters of the first input catalog are 6◦ apart.
The early input catalog of the first 2 years of operation thus contained about 300,000 stars of whichabout half the sample originated from Tycho 2, the other half from SSS. The first three data releasesof Rave (DR1, DR2, and DR3) are entirely based on this input catalog. An a posteriori comparisonwith DENIS DR3 (DENIS Consortium 2005) revealed that, owing to saturation effects for I < 13, a≈ 1 mag offset between DENIS and SSS at I ≈ 11 emerged. As a consequence, while Rave comprisesa kinematically unbiased sample, the early input catalog exhibits some color biases (see discussionin DR1 Section 2.3).
A new and more refined input catalog was brought into use in March 2006. The main sample has|b| > 25, and uses DENIS DR3 cross-matched with 2MASS to define targets to I = 12 with a defaultof four pointings on each field center – two bright and two faint. The field centers are now 5 degreesapart to ensure some overlap between adjacent fields. With the new input catalog, also an attemptwas made to more carefully extend the input catalog to lower Galactic latitudes, i.e., to include moreof the Galactic disk towards the Galactic anti-rotation direction (225◦ < ` < 315◦, 5◦ < |b| < 25◦).A mild color cut of J −K > 0.5 was used in this region to avoid observing young stars, as the weakPaschen lines in the CaT region mean that radial velocities and, in particular, stellar parameters,can be only poorly determined (see Section 3.3 and Figure 5 below).
In the post-2010 operations, the input catalog was further extended, again for reasons of observingefficiency, to lower Galactic latitudes and thus closer to the Galactic mid plane, so that reddeninghad to be taken into account. The aforementioned color cut of J −K > 0.5 is capable of rejectingyoung foreground stars provided that E(B−V ) < 0.35 mag. Thus, low latitude fields (10◦ < b < 25◦)are included for 315◦ < ` < 330◦ and ` < 225◦, and, analogously (for −25◦ < b < −10◦), fields withGalactic longitudes of ` < 225◦, ` > 315◦ and ` < 30◦, respectively.
The fields observed at |b| < 25◦ of the old input catalog (no color cut) compared to the new inputcatalog (with color cut J−K > 0.5) can be easily identified by having an observing date ≤ 20060312.The stars from these earlier fields are excluded from the selection function, as discussed in Section2.6.
Finally, and again for observing efficiency reasons, targets for 0◦ ≤ δ ≤ 5◦ and 0h ≤ α ≤ 6h,7h30m ≤ α ≤ 17h, and 19h30m ≤ α ≤ 24h were needed. However, no DENIS counterpart wasavailable for targets north of δ = 2◦. Targets were therefore defined from 2MASS, with their estimatedI magnitudes derived from 2MASS J and K, following equation 1 in DR4.
In addition to the survey fields described above, a number of targeted observations were performedthat focused on a selection of open and globular clusters. These fields were acquired to allow in-
Rave DR6 - I.: spectra and radial velocities 7
dependent checks on the Rave stellar parameters and their errors (for details, see DR5 Section7.1).
For details regarding the input catalogs we refer to DR1 Section 2 and to DR4 Section 2, respectively.
2.3. Observing procedure
Observations for Rave followed a sequence of target field exposures, arc and flat. Ne, Rb, and Hg-Cd calibration exposures were obtained for each field, together with a quartz flat field for spectrumextraction in the data reduction. Typically, one 10s RbNe arc exposure and five 15s fiber flats (quartzhalogen) were taken before and after each field exposure series. The field exposure series themselvesconsisted of five consecutive exposures (see below), allowing adequate SNR to be obtained in thesummed spectra, while minimizing the risk of saturation from particularly bright stars. In the caseof poor conditions or low sky transparency, additional exposures were made.
Several target fibers were reserved in order to monitor the sky for background subtraction. Each ofthe Rave target frames contained spectra of at least 10 sky samples, obtained using dedicated skyfibers. These were combined and scaled in the reduction process for sky subtraction.
We used the two field plates (three field plates starting in 2009) on an alternating basis, i.e., fibersfrom one field plate were configured while we observed with the other field plate. So fibers from a givenfield plate were mounted to the spectrograph slit prior to the observation of each field. To do this thecover of the spectrograph needed to be removed, so its temperature might change abruptly. Becauseof the associated thermal stress we took the flatfields and neon arc lamp exposures immediately afterthe set of scientific exposures, i.e., at a time when the spectrograph was largely thermally stabilized.
Taking account of the physical transportation and exchange of the field plates, the slew time forthe telescope, field acquisition, etc., an experienced observer was able to accumulate acceptable datafor up to eight Rave fields on a midwinter’s night at the latitude of Siding Spring Observatory.
2.4. Major changes in the performance of the Rave survey
Rave observations span a period of ten years. Based on the lessons learned with early data releases,in particular DR1 and DR2, a number of procedural optimizations were introduced. Furthermore,maintenance and refurbishments of the telescope and the facility resulted in a few modifications. Wesummarize the most relevant ones in the following:
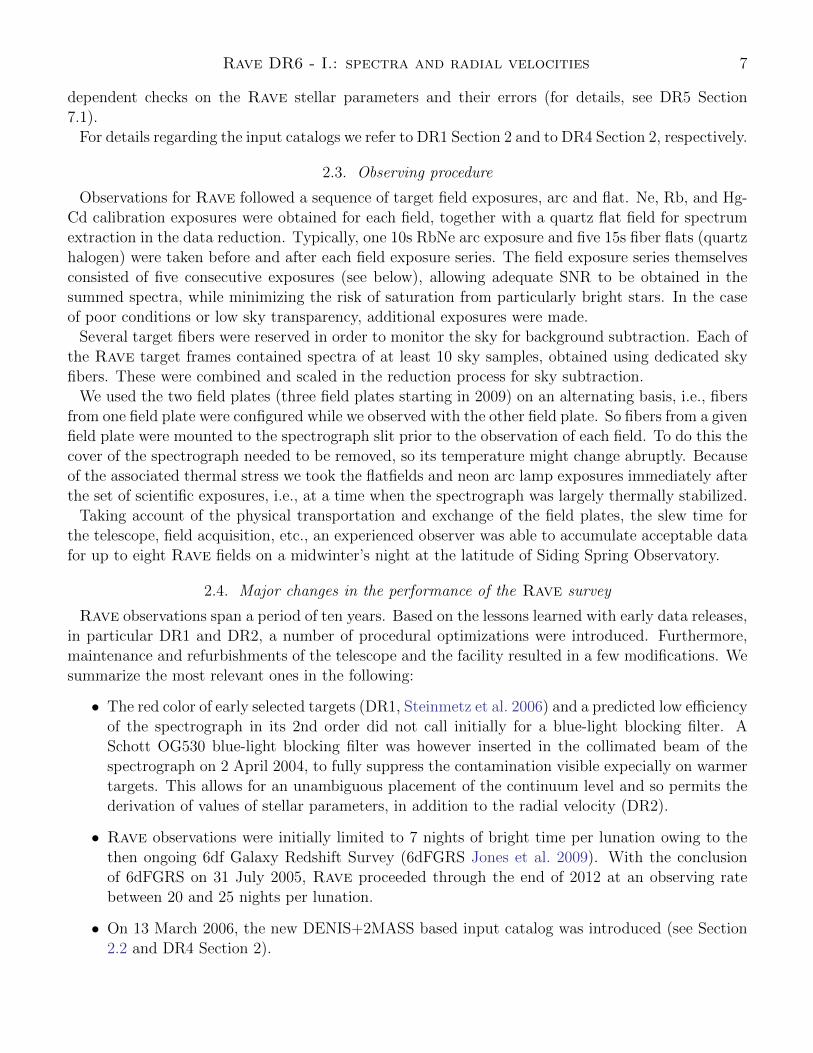
• The red color of early selected targets (DR1, Steinmetz et al. 2006) and a predicted low efficiencyof the spectrograph in its 2nd order did not call initially for a blue-light blocking filter. ASchott OG530 blue-light blocking filter was however inserted in the collimated beam of thespectrograph on 2 April 2004, to fully suppress the contamination visible expecially on warmertargets. This allows for an unambiguous placement of the continuum level and so permits thederivation of values of stellar parameters, in addition to the radial velocity (DR2).
• Rave observations were initially limited to 7 nights of bright time per lunation owing to thethen ongoing 6df Galaxy Redshift Survey (6dFGRS Jones et al. 2009). With the conclusionof 6dFGRS on 31 July 2005, Rave proceeded through the end of 2012 at an observing ratebetween 20 and 25 nights per lunation.
• On 13 March 2006, the new DENIS+2MASS based input catalog was introduced (see Section2.2 and DR4 Section 2).
8 Steinmetz et al.
• On 29 March 2006, the number of fiber flats was increased from 1 to 5.
• Rave observations initially consisted of 5 exposures of 600 s. Since the beginning of 2007,Rave targets were segregated into four magnitude bins (bin1: 8 ≤ I ≤ 10, bin2: 10 ≤ I < 10.8,bin3: 10.8 ≤ I < 11.3, and bin4: 11.3 ≤ I < 12) in order to maximize observing efficiency andto avoid cross-talk contamination of fibers on faint sources adjacent to fibers targeting brightobjects. Exposure times corresponded to 5 × 600 s for bin1 and bin2, 5 × 900 s for bin3, and5× 1200 s for bin4.
• Observations were paused between 4 June 2007 and 11 June 2007 for service on the 6dF robotand between 26 June 2007 and 6 August 2007 for asbestos removal work at the UKST.
• In February 2009 a third field plate was introduced and subsequently the original two fieldplates were fully refurbished with new fiber bundles. After this procedure, each observingnight started with two fully configured field plates, thus considerably increasing the surveyspeed.
• The Wambelong bushfire at Siding Spring in early 2013 forced observations to be suspendedbetween 13 January 2013 and 1 April 2013.
2.5. Data reduction
The data reduction of Rave follows the sequence of the following pipeline:
1. quality control of the acquired data on site with the RAVEdr software package (Section 3.1).
2. reduction of the spectra (Section 3.1).
3. spectral classification (Section 4).
4. determination of (heliocentric) radial velocities with SPARV (‘Spectral Parameter And RadialVelocity’, Section 5).
5. determination of atmospheric parameters with MADERA (‘MAtisse and DEgas used in RAve’,(paper DR6-2, Section 3.1, see also Kordopatis et al. 2013).
6. determination of the effective temperature using additional photometric information (InfraRedFlux Method (IRFM), DR6-2, Section 3.2, see also Kunder et al. 2017).
7. determination of atmospheric parameters combining Rave spectroscopic information with ad-ditional photometry and Gaia DR2 parallax priors using BDASP (Bayesian Distances Ages andStellar Parameters, DR6-2 Section 3.3, see also McMillan et al. 2018).
8. recalibration of the stellar parameters for giant stars based on K2 asteroseismic information(DR6-2, Section 3.4, see also Valentini et al. 2017).
9. determination of the abundance of iron group elements and an overall [α/Fe] ratio with thepipeline GAUGUIN (DR6-2, Section 4).
The output of these pipelines is accumulated in a PostgreSQL data base and accessible via theRave website http://www.rave-survey.org (Section 7 and DR6-2, Section 7).
Rave DR6 - I.: spectra and radial velocities 9
Table 1. Contents of Rave DR6.
in DR6 N. of spectra N. of unique stars
Observed targets 518,387 451,783
– with snr med sparv > 20 474,649 416,365
– with snr med sparv > 40 262,199 232,282
– with snr med sparv > 60 66,815 58,992
– with snr med sparv > 80 14,056 12,417
with 2MASS cross match 518,300 451,706
with Gaia DR2 cross match 517,095 450,641
Galactic
9.0 < I < 10.0
Galactic
10.0 < I < 10.8
Galactic
10.8 < I < 11.3
Galactic
11.3 < I < 12.0
0 0.5 1NRAVE/N2MASS
Figure 1. Mollweide projection of Galactic coordinates of the completeness of the stars for which RaveDR6 radial velocity measurements are available for the core sample (see Section 6). Each panel shows thecompleteness over a different magnitude range, where the HEALPix pixels are color-coded by the fractionalcompleteness (NRave/N2MASS).
.
2.6. Survey Selection Function
In order to draw robust conclusions from the data gathered via large spectroscopic surveys such asRave, it is crucial to understand the relationship between the observed targets and their underlyingpopulation, known as the selection function. A comprehensive overview of the selection function ofRave is given in Wojno et al. (2017), which we summarize here. Rave targets were selected from anumber of input catalogs. These targets were selected uniformly over the entire Southern hemisphere,
10 Steinmetz et al.
7 8 9 10 11 12 13I
0
5000
10000
15000
20000
25000
No. o
f sta
rs p
er b
in
7 8 9 10 11 12 13I
0
10
20
30
40
50
60
rela
tive
fract
ion
[%]
Figure 2. Left: histogram of the number of spectra with derived radial velocities in the Rave footprint perI magnitude bin of 0.1 . Magnitude bins used per field plate are indicated with dashed lines (see Section2.2). Right: The completeness of RAVE DR6 (stars with radial velocities) with respect to the completenessof 2MASS is shown as a function of the I magnitude.
with the exception of regions where a mild color-cut of (J−K > 0.5 mag) was enforced (Section 2.2).Figure 1 shows the completeness fraction (number of Rave stars divided by number of 2MASS starsper area on the sky) for the observed I magnitude bins. The I magnitude is in principle availablefrom catalogs as DENIS, however DENIS I suffers from saturation effects for I < 10. As in Wojnoet al. (2017), we approximate the DENIS I magnitude from 2MASS J and Ks via
(I − J) = (J −Ks) + 0.2 exp(J −Ks)− 1.2
0.2+ 0.12 (1)
(for the number of spectra based on measured APASS i′ magnitude (for Rave DR4), see Figure 11of Munari et al. 2014). Figure 2 shows the completeness of stars with determined radial velocitiesover the overall Rave footprint. As Wojno et al. (2017) showed for Rave DR5 , we also find RaveDR6 to be kinematically unbiased.
2.7. Repeats
Rave was designed as a survey with its main focus on studies of Galactic dynamics and Galacticevolution. The primary design goals were therefore to have an unbiased input catalog and observingprocedure, a wide coverage of the accessible sky, and a magnitude limited layout aiming at highcompleteness from the brighter to the fainter magnitudes. The technical boundaries (large multiplexand long configuration times combined with weather patterns and block-out periods around the fullmoon) made it difficult to account systematically for repeat observations following a fixed cadence, inparticular without compromising the aims of coverage and completeness. On the other hand, repeatobservations are critical to check for coherency and repeatability of Rave data products, and toallow modellers to account for the effects of unresolved binaries.
In order to measure, at least statistically, the effects of binarity, about 4000 stars were selectedfor a series of repeat observations in the observing semester 2009A (1 February 2009 - 31 July2009). The aim was to roughly follow a logarithmic series with a cadence of separations of 1, 4,10, 40, 100, and 1000 days. The repeat sequence was selected from the first observations of the
Rave DR6 - I.: spectra and radial velocities 11
100 101 102 103
t [d]
0
1000
2000
3000
4000
5000
6000
7000
N
Figure 3. Time interval between consecutive observations of stars with at least 4 repeat observations.The red dotted lines mark the guiding cadence of 1, 4, 10, 40, 100, and 1000 days, the black dashed linemultiples of 365 days.
new input catalog introduced on 12 March 2006, so the difference between the 2009 and the 2006observations served to approximate the 1000 day separation. Weather patterns, block out periods,and fiber availability, however, resulted in considerable dispersion and non-observations around thetarget cadence (Figure 3). The repeat sequence mainly constitutes the subsets with 4, 5, 6, and morethan 7 observations (see Table 2), and can nicely be seen in the clustering at −120◦ < l < 30◦ andb > +30◦ (Figure 4).
In addition to these systematic repeats, whole fields were repeated when they were marked asproblematic in the post-observation quality review. Furthermore, individual stars could be re-targetedif no higher-priority (i.e. unobserved) targets were available in the fiber configuration process. Thesequality repeats and chance repeats make up most of the targets with 2 or 3 visits. Indeed, Figure 4reveals that these targets are much more evenly spread over the Rave footprint, as expected. Finally,targeted observations of calibration fields, in particular open and globular clusters, also give rise tomany repeat observations, also visible in the Mollweide projection of Figure 4.
3. Rave SPECTRA
3.1. Spectra and their Reduction
12 Steinmetz et al.
150 120 90 60 30 0 -30 -60 -90 -120 -150
-60°
-30°
0°
30°
60° equatorN = 1N = 2N = 3N = 4N = 5N 6
Figure 4. Mollweide projection of Rave fields color-coded by the number of revisits.
Table 2. Stars with multipleobservations in Rave DR6.
in DR6
Stars with 1 visit 404,428
Stars with 2 visits 39,340
Stars with 3 visits 3,606
Stars with 4 visits 1,034
Stars with 5 visits 1,418
Stars with 6 visits 1,205
Stars with ≥7 visits 757
All Rave spectra were reduced with a semi-automated pipeline based on a sequence of dedicatedIraf routines. The use of a pipeline approach ensures a proper uniformity of reductions, while therequirement of specific human-approved standardized checks increase their reliability. The pipelineis described in DR1 and DR2. Here we summarize its main features and report on experience gainedover a decade of its use. We also add specific information that is relevant for legacy purposes andthat is important for a reader who would like to understand the underlying systematics.
To account for the temperature sensitivity of the spectrograph (Section 2.3), we adopted a policywhere each set of scientific exposures was accompanied by a flat-field and an arc-line exposure, bothusually done immediately after the scientific ones. Flat-field exposures were used to establish position,width and shape of spectral tracings in other exposures, to normalize relative fiber throughput andto filter-out interference fringing, which can be quite prominent when using a thinned backsideilluminated CCD detector at the Rave wavelength range. Typically, fringing jumps that reach up
Rave DR6 - I.: spectra and radial velocities 13
to 20% of the flux are damped to ∼ 1% with this approach, but note that techniques of Gaussianfiltering would be required to reach a better continuum normalization on scales of ∼ 20 A, a typicalfringe width. A small fraction of Rave spectra suffer from internal reflection of light within thespectrograph, which causes an emission ghost located blue-ward of the Ca II 8498 A line. This isan additive feature that can be removed through careful spectral normalization, though its widthof ∼ 23 A makes this a challenging task. Such spectra have a problematic continuum, so they areflagged with ‘c’ (Table 4) in the final database.
Extracted one-dimensional spectra of object, flat-field, and arc-lamp exposures need to be correctedfor fiber cross-talk and for scattered light contributions from all fibers with flux levels above a setthreshold. Fiber cross-talk is removed iteratively, assuming a Gaussian shape of fiber illuminationin the direction perpendicular to the tracing direction. In the end, we estimate that in the finalspectrum the contribution of stars to adjacent fibers does not exceed 0.001 of their flux. About 13%of the incoming light is scattered in the spectrograph, with the exact amount decided manually byminimizing the flux in the gaps between the three fiber sub-bundles (fibers 50-51 and 100-101) andby analyzing flux levels in sky fibers that have very low continuum levels or, in the case of cirrusclouds and moonlight, should have positive fluxes compatible with the strength of the Solar spectrumin lines of the calcium IR triplet. In our model the scattered light from each point in the focal planeis scattered over an axially symmetric Gaussian with a FWHM of ∼ 200 CCD pixels.
A neon arc lamp exposure is used to wavelength calibrate the spectra. The lamp includes 9emission lines in the Rave spectral range that are strong enough for this purpose. Table 3 reportstheir adopted wavelengths. Note that each spectrum includes 1031 pixels spanning a wavelengthrange of 384.6± 1.7 A, but its central wavelength varies in a parabolic manner from ∼ 8595 A at theedges of the field plate to ∼ 8604 A at its center (see Figure 3 in DR2). Consequently, the Ar I 8408A arc line is missing in fibers near the center of the field plate while at the edges of the field plateextrapolation has to be used to wavelength calibrate the reddest 15 A of the wavelength range. Allobserved spectra have been fit using 5 or more arc lines and 91% have been fit using N = 8 arc lines.A single cubic spline with df = 4 free coefficients is used to convert pixel units into wavelengths. Perline it achieves a median difference between the fitted and assumed wavelength of 0.015 A (for 99% ofthe spectra, this difference is smaller than 0.072 A), which at 8600 A corresponds to 0.52 km s−1. Thisimplies a typical error in the derived radial velocity of ∼ 0.52/
√N − df km s−1 = 0.26 km s−1. So the
radial velocity accuracy is mostly limited by temperature shifts in the spectrograph, by the achievedSNR, and by the accuracy of flat-fielding, and not by uncertainties in the wavelength calibration.
In 90% of the cases the spectra of sky fibers are dominated by sky emission lines and have neg-ligible continuum levels, while the rest include a detectable level of moonlight, usually scattered onthin cirrus clouds. The main contributor to sky spectra are therefore airglow emission lines belong-ing to three series: OH transitions 6-2 at wavelengths shortward of 8651 A, OH transitions 7-3 atwavelengths longward of 8758 A, and O2 bands between 8610 A and 8710 A (see DR5 for details).Both airglow and cirrus scattering can vary on shorter timescales and smaller spatial scales than atypical ∼ 50-minute sequence of scientific exposures over a 5.7◦ field of view. Therefore, we assumea complete scrambling and use a scaled median of sky fibers as the background model. The usershould be aware that in rare cases this may not be true, as both airglow line intensity and cirruscloud scattering may depend on fiber position. In such cases objects with adjacent positions on thesky should show similar levels of sky residuals. We made sure that to the best of our knowledge the
14 Steinmetz et al.
Table 3. Wavelengths ofarc lines.
Element Wavelength [A]
Ar I 8408.2096
Ar I 8424.6475
Ne I 8495.3598
Ar I 8521.4422
Ne I 8591.2583
Ne I 8634.647
Ne I 8654.3831
Ne I 8780.621
Ne I 8783.7533
sky fibres were positioned on “empty” regions of the sky. We use two additional checks to avoid skyover-subtraction due to contamination by unknown sources: first, the person responsible is asked tovisually approve all sky spectra to be used in the background calculation and second, the use of ascaled median rejects any remaining outliers.
Airglow emission lines have fixed wavelengths, so they have been used for the calculation of theradial velocity zero point and for the correction of temperature fluctuations in the spectrograph.Their signal is much cleaner in the sky fibers than in the stellar spectra. The zero-point correctionis obtained from a weighted sum measurement of sky and stellar spectra, with the former having a10-times higher weight and typically amounts to ≈ −0.5± 1km s−1.
The final stages of reduction include sky subtraction and shifting of the stellar spectrum to theinertial frame of the Solar system barycenter. Note that at all stages of the reduction the wavelengthbin corresponds to one pixel in the dispersion direction. This simplifies the recognition and treatmentof discrete features, like cosmetic defects of the CCD or cosmic ray hits. A sequence of ∼ 5 10-minuteexposures of each object is median-combined, thus rejecting most of the cosmic ray hits (except forthe rare hits in the flat-field exposure).
As a final check, the pipeline makes two graphs that are visually inspected and stored: the firstplot compares measured average fluxes in individual fibers with the ones expected from the availableground-based photometry. Since fiber throughput varies over time and position, we advise the userto use normalized spectra only. Still, a comparison of fluxes should show a clear correspondence withstellar magnitudes and low or negligible fluxes in sky and parked fibers. This helps to avoid anybook-keeping errors, which are always possible when observing hundreds of thousands of stars overthousands of nights. Finally, the responsible person is shown a collection of final spectral tracingsof a given field: the idea is to check that the results seem reasonable, but a visual check of everyspectrum is not feasible for such a large survey. The design of the spectrograph does not allowto derive accurate absolute fluxes, so we provide spectra with a normalized continuum. These arederived with an iterative low-order polynomial fitting and with asymmetric rejection limits. We useda second-order spline function with the upper rejection limit set to 2 residual standard deviations and
Rave DR6 - I.: spectra and radial velocities 15
lower limit to 1.3. Note, however, that any comparison of observed and synthetic spectra requiresthat both spectra are first normalized again using the same normalization parameters.
In summary, Rave uses a dedicated data reduction pipeline, which has been tuned by our experiencegained over a decade of its use. Our insistence on specific human approved checks and adjustmentsincreases the reliability of its results. Note that this is different from surveys that use general-purposeinstruments and often use or at least start with the instrument supplied pipeline. On the other hand,the HERMES spectrograph is a general purpose instrument at the AAO, but its extensive use bythe GALAH survey makes the survey’s dedicated pipeline (Kos et al. 2017) increasingly popular alsofor general users as well. Finally, we note that all these pipelines use the standard reverse-modellingapproach. It seems that with photonic combs an alternative forward modelling approach is possible,which convolves a list of spectral templates with assumed values of stellar parameters with knownaberrations in the spectrograph to produce a fit to the original CCD image. This approach may yieldmuch better results in the future (Kos et al. 2018).
The wavelength range of the Rave spectra is dominated by strong spectral lines: for the majorityof stars, the dominant absorption features are due to the infrared calcium triplet, which in hot starsgives way to the Paschen series of hydrogen. There are also weaker metallic lines present for solar-type stars and molecular bands for the coolest stars. Within an absorption trough the flux is small, soshot noise is more significant in the middle of a line than in the adjacent continuum. Error levels alsoincrease at wavelengths of airglow sky emission lines, which have to be subtracted during reduction.As a consequence, a single number, usually reported as SNR, is not an adequate quantification of theobservational errors associated with a given spectrum. For this reason, we provide error spectra thatcomprise uncertainties (errors) for each pixel of the spectrum. These are provided both for spectraprior to sky subtraction and for the final sky-subtracted ones (for details, see DR5, Section 4).
The main contribution to the error spectrum is shot noise, which can be parametrized as SNR =gNs/
√gNu, where Nu is the number of counts per pixel before sky subtraction, Ns is its counterpart
after the subtraction and the effective gain g = 0.416 e−/ADU (see DR5 for details). As explainedabove, the main source of the difference between Nu and Ns are airglow emission lines. So the relativeflux errors increase within deep stellar absorption lines, such as the Ca II infra-red triplet, and atpositions of airglow lines. Note that subtraction of the latter in the sky subtracted spectra may besub-optimal due to a rapid variability of sky airglow. Other contributions to the error spectrum arescattered light and imperfect flat-field fringing removal, which typically contribute at a 0.8% level,added in quadrature. Finally, the resulting error spectra are smoothed with a window of a widthequal to 3 pixels in the dispersion direction, which takes into account the noise correlation betweenadjacent pixels.
Error spectra are given as relative errors. A value of 0.01 implies that a 1% error in flux with anexpected approximately Gaussian distribution at this wavelength bin.
3.2. Signal to noise
As described in the previous paragraph, the errors on the normalized fluxes of the reduced spectravary from pixel-to-pixel and it is problematic to represent a whole spectrum with a single value.On the other hand, a priori estimates of the SNR per pixel are needed for the radial-velocity andstellar-parameter pipelines (see, e.g., DR2, section 3.4, DR3 section 2.2 or DR4, section 3.2). Thecorresponding values are reported in the respective catalog files (Section 7 and DR6-2, Section 7).
Figure 5. Typical spectra (left) and error spectra (right) for some typical objects in the Rave data base.Stellar parameters are derived using the BDASP pipeline (see DR6-2, Section 3.3). From top to bottom: a)a high SNR cool dwarf; b) a high SNR warm dwarf; c) a high SNR hot dwarf; d) a high SNR red clumpstar; e) a high SNR giant star; f) a moderately high SNR giant; g) a low SNR giant; h) an emission line cooldwarf; i) a very cool star with molecular bands (using calibrated stellar parameters obtained via the MADERA
pipeline (see DR6-2, Section 3.1). Error spectra are given as relative errors. A value of 0.01 implies that a1% error in flux with an approximately Gaussian distribution is expected at this wavelength bin.
Rave DR6 - I.: spectra and radial velocities 17
0 20 40 60 80 100 120SNR
0
5000
10000
15000
20000
25000N
SNR_SPARVSNR_med_SPARV
Figure 6. Distribution of the a posteriori signal-to-noise estimate snr med sparv and the a priori estimatessnr sparv for all stellar spectra in the Rave DR6 database.
A better a posteriori estimate describing the quality of a spectrum, e.g., for data selection for aparticular science application, is given by snr med sparv, defined as the inverse of the median ofthe error spectrum. snr med sparv scales on average with snr sparv in a somewhat stronger thanproportional manner (see Figure 6). The median snr med sparv over the whole SPARV sample is≈ 40 (see Figure 6).
3.3. Morphology of Rave spectra
A sample of typical Rave spectra and their associated error spectra for a range of targets is shownin Figure 5, which, from top to bottom, represents: a) a high SNR cool dwarf; b) a high SNRwarm dwarf; c) a high SNR hot dwarf; d) a high SNR red clump star; e) a high SNR giant star;f) a moderately high SNR giant; g) a low SNR giant; h) an emission line cool dwarf; i) a very coolstar with molecular bands. In all spectra other than those for the hot dwarf and the cool star withmolecular bands, the Ca triplet can easily be recognized as the dominant feature. For hot dwarfs, theCa triplet feature is replaced by strong and broad Paschen lines. Consequently, radial velocities canonly be determined poorly for this class of stars, and atmospheric parameters (if at all convergent)are highly unreliable. The Ca triplet wavelength region also shows a considerable number of weakmetal lines, which are used in Section 4 of paper DR6-2 to derive abundances of individual elementsand [α/Fe]-ratios. These absorption lines are clearly visible in the high signal to noise cases and alsoin the moderate SNR spectrum 6), but become difficult to discriminate against noise for SNR of 20and lower, as we demonstrate more quantitatively in Section 6 of paper DR6-2.
4. SPECTRAL CLASSIFICATION
The classification of Rave spectra was introduced in Matijevic et al. (2012). For this data releasewe modified the original classification scheme in order to simplify its use. Previously, the classification
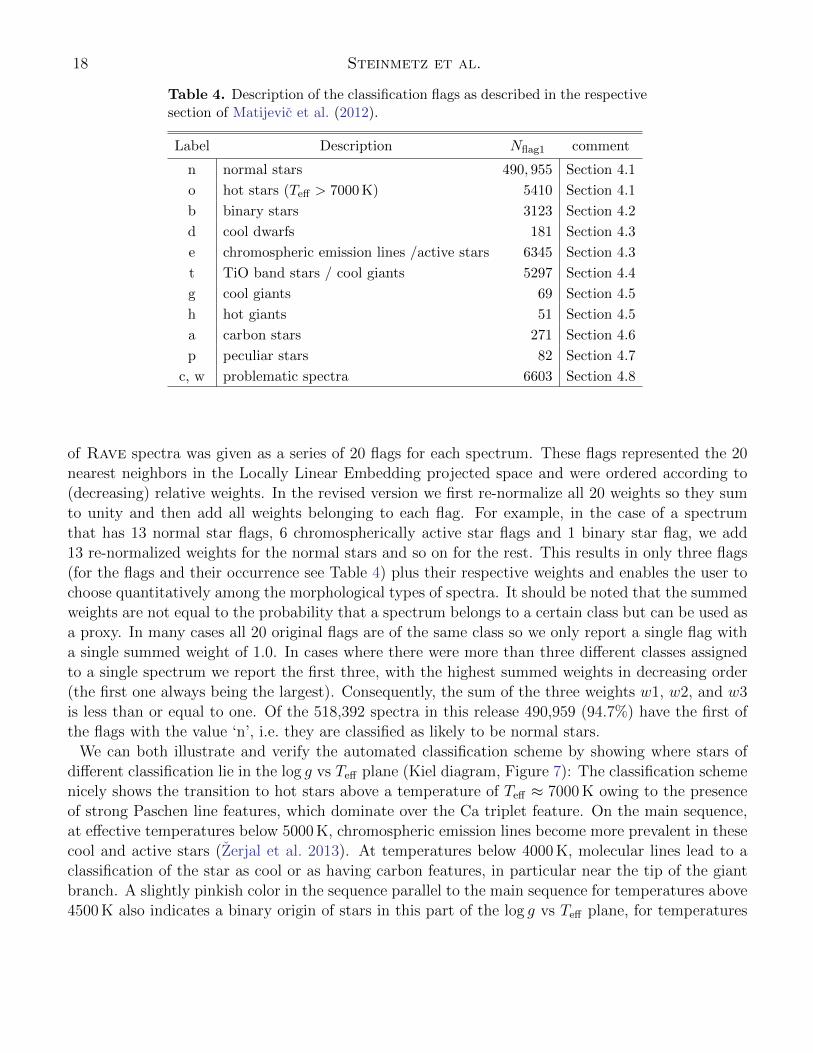
18 Steinmetz et al.
Table 4. Description of the classification flags as described in the respectivesection of Matijevic et al. (2012).
Label Description Nflag1 comment
n normal stars 490, 955 Section 4.1
o hot stars (Teff > 7000 K) 5410 Section 4.1
b binary stars 3123 Section 4.2
d cool dwarfs 181 Section 4.3
e chromospheric emission lines /active stars 6345 Section 4.3
t TiO band stars / cool giants 5297 Section 4.4
g cool giants 69 Section 4.5
h hot giants 51 Section 4.5
a carbon stars 271 Section 4.6
p peculiar stars 82 Section 4.7
c, w problematic spectra 6603 Section 4.8
of Rave spectra was given as a series of 20 flags for each spectrum. These flags represented the 20nearest neighbors in the Locally Linear Embedding projected space and were ordered according to(decreasing) relative weights. In the revised version we first re-normalize all 20 weights so they sumto unity and then add all weights belonging to each flag. For example, in the case of a spectrumthat has 13 normal star flags, 6 chromospherically active star flags and 1 binary star flag, we add13 re-normalized weights for the normal stars and so on for the rest. This results in only three flags(for the flags and their occurrence see Table 4) plus their respective weights and enables the user tochoose quantitatively among the morphological types of spectra. It should be noted that the summedweights are not equal to the probability that a spectrum belongs to a certain class but can be used asa proxy. In many cases all 20 original flags are of the same class so we only report a single flag witha single summed weight of 1.0. In cases where there were more than three different classes assignedto a single spectrum we report the first three, with the highest summed weights in decreasing order(the first one always being the largest). Consequently, the sum of the three weights w1, w2, and w3is less than or equal to one. Of the 518,392 spectra in this release 490,959 (94.7%) have the first ofthe flags with the value ‘n’, i.e. they are classified as likely to be normal stars.
We can both illustrate and verify the automated classification scheme by showing where stars ofdifferent classification lie in the log g vs Teff plane (Kiel diagram, Figure 7): The classification schemenicely shows the transition to hot stars above a temperature of Teff ≈ 7000 K owing to the presenceof strong Paschen line features, which dominate over the Ca triplet feature. On the main sequence,at effective temperatures below 5000 K, chromospheric emission lines become more prevalent in thesecool and active stars (Zerjal et al. 2013). At temperatures below 4000 K, molecular lines lead to aclassification of the star as cool or as having carbon features, in particular near the tip of the giantbranch. A slightly pinkish color in the sequence parallel to the main sequence for temperatures above4500 K also indicates a binary origin of stars in this part of the log g vs Teff plane, for temperatures
Rave DR6 - I.: spectra and radial velocities 19
300040005000600070008000900010000Teff_BDASP
0
1
2
3
4
5
logg
_BDA
SP
Peculiar Cold Binary Carbon Continuum
Emission Hot Normal Wavelength
Figure 7. Kiel diagrams assuming :Teff and log g from the BDASP pipeline (see DR6-2), color encoded bythe average automated classification of the stars in the respective hexagon.
below 4500 K, the emission line characteristics dominates the classification also in this part of theparallel sequence.
5. RADIAL VELOCITIES
Radial velocities (RVs) are derived with the pipeline SPARV in a manner identical to that pre-sented in DR4 and DR5, and as detailed in Section 2 of DR3. The spectra are cleaned in thespectral regions that are strongly affected by fringing (DR3 Section 2.4) and then matched toa grid of spectra discretized in Teff , log g, [M/H], [α/Fe], and stellar rotational velocity vrot, as-suming a fixed microturbulence ξ = 2 km s−1 . The underlying algorithm is a standard cross-
20 Steinmetz et al.
correlation algorithm in Fourier space. The grid employs the synthetic spectral library of Mu-nari et al. (2005) based on ATLAS 9 model atmospheres, and was extended with a finer grainedspacing toward the densest region of the observed parameter space. The grid has [M/H] =−2.5,−2.0,−1.5,−1.0,−0.8,−0.6,−0.4,−0.2, 0.0, 0.2, 0.4, and 0.5 dex. For stars cooler than 4500 Kthe grid includes also molecular lines, while any influence of dust or chromospheric activity is ne-glected. The latter can be important in young cool stars descending toward the main sequence(Zerjal et al. 2013, 2017), so an increased template mismatch reflects in an increased RV error forsuch objects. The process to match templates and thus derive RVs follows a two-step procedure: Ina first step a provisional estimate of the radial velocity is obtained using a subset of only 10 templatespectra. This first estimate typically results in RVs with an accuracy better than 5 km s−1 and is usedto put the spectrum in the zero velocity frame. Then a new template is created using a penalizedchi-square method as described in DR2, which in turn is used to derive the final, more precise RV. Todetermine the zero point, the processing pipeline uses the available sky lines in the Rave wavelengthwindow and fits a combination of a third-order polynomial and a constant function to the relationbetween sky radial velocity and fiber number (see DR3, Section 2.5). This fitting function defines themean trend of zero-point offsets and provides the zero-point correction as a function of fiber number.The internal error is defined as the error in the determination of the maximum of the correlationfunction using IRAF xcsao. This procedure results in RVs with an internal error distribution peak-ing near 1 km s−1 with a long tail towards higher RV errors probably owing to problematic spectraand/or variability from stellar binaries (see Figure 8). 68% of the sample has an internal accuracybetter than 1.4 km s−1 (see DR5).
The RVs and their respective errors were confirmed by external observations and also by thosetargets that have repeat observations (see DR4 and DR5). The long tail in the repeat observationscan be reduced by 90% by applying quality criteria indicative of derived radial velocities with highconfidence, namely |correctionRV| < 10 km s−1, σ(RV) < 8 km s−1, and correlationCoeff > 10(Kordopatis et al. 2013).
RVs provided by Rave do not include corrections for gravitational redshift effects, nor do theytake into account any convective motions in the stellar atmosphere. As discussed in DR2, our choiceto omit these two contributions follows Resolution C1 of the IAU General Assembly in Manchester(Rickman 2001) and is consistent with the derived RVs reported by most other spectroscopic surveys,including Gaia DR2. The reader should however note that such an RV does not correspond tothe line-of-sight component of the velocity of the stellar center of mass, which corresponds to theRV reported by the GALAH survey (Zwitter et al. 2018) and which is expected to be followedalso by Gaia DR3. Typical values of gravitational redshifts are +0.5 ± 0.2 km s−1 for dwarfs and+0.1 ± 0.1 km s−1 for giants, while convective shifts in the optical range are −0.45 ± 0.15 km s−1
for dwarfs and −0.3 ± 0.2 km s−1 for giants (Zwitter et al. 2018). As these values do not cancelexactly one should take care when studying the detailed internal dynamics of loosely bound stellarassociations or streams where the reported Rave RVs may exhibit systematic effects with spectraltype at a level of ∼ 0.1 km s−1.
6. VALIDATION OF Rave DR6 PARAMETERS
The data product of large surveys like Rave is always a compromise between the quality of theindividual data entry and the area and depth of the survey. This applies to design decisions (likethe applied exposure time/targeted SNR) as well as to the decision which data to keep in the sample
Rave DR6 - I.: spectra and radial velocities 21
0 10 20 30 40 50HRV [km s 1]
100
101
102
103
104N
fullCorr>5Corr>10Corr>20
Figure 8. Distribution of the internal error estimate εHRV for the full sample and for subsamples with acorrelation coefficient R larger than 5, 10, and 20, respectively. Increasing the requirements on R stronglysuppresses the tail of high-velocity errors.
and which ones to exclude. Our policy for Rave is to provide the maximum reasonable data volumepossible, which allows the user to consider the tails of the distribution function. The exact choiceof the (sub)sample used for a particular science case has to be made by the user basedon the criteria needed for the respective science application! Here, we only can give somefirst guidelines/recommendations regarding the data downselection. For a description of the variousparameters in the following paragraph, we refer to the tables in Section 7.
Stars with correlation coeff > 10 have an internal velocity error distribution that peaks nearεHRV ≈ 1− 2 km s−1 with the tail toward very large velocity errors strongly suppressed compared tothe uncut sample (see Figure 8). For repeat measurements, such a sample features a small scatter inthe repeat measurements of their heliocentric radial velocity. The distribution peaks near 0.0 km s−1,and the tail toward very large velocity differences is reduced by 90%, again compared to the uncutsample, indicative of a high confidence measurement (see below). We refer to the data set defined bythese criteria as the core sample, or RV00.
The reported internal RV errors reflect both, statistical uncertainty and systematics owing to a mis-match between observed and synthetic spectra. The Rave radial velocities and their uncertaintiescan be verified against independent external sources (Section 6.1), providing a measure for the accu-racy, or internally by considering repeat observations providing an estimate of the precision (Section6.2).
22 Steinmetz et al.
Table 5. Rave subsamples used in this publication for validationand first science applications.
Figure 9. Left: Radial Velocity derived from Rave DR6 vs those from Gaia DR2. Right: Distributionof radial velocity differences between Gaia DR2 and Rave DR6. The green line compares this distributionfunction with a fit using two Gaussians with a standard deviation of 1.2 km s−1 (red) and 3.4 km s−1 (blue),respectively.
We alert the reader that the above mentioned quality criteria were drawn under the assumption thatRave is used as a statistical sample. Should the Rave catalogs be used to identify individual candi-dates for followup studies (e.g. candidates for high radial velocities), additional criteria constrainingthe uncertainty of the measurement σ(RV ) and of the zero-point correction (|correction rv|) shouldbe applied.
6.1. Validation of Radial Velocities against Gaia DR2
The accuracy of Rave radial velocities as compared to external observations was extensively dis-cussed in DR3 Section 3.1 and DR4 Section 8.1. On 25 April 2018, the 2nd data release of the ESAmission Gaia was published (Gaia Collaboration et al. 2018), featuring radial velocities for some 7million targets. The Radial Velocity Spectrometer (RVS) of Gaia also operates in the Ca tripletregion, though at a somewhat higher resolution of R = 11, 000. The radial velocities of Rave DR5and Gaia DR2 are compared in Steinmetz et al. (2018), showing a very good agreement between bothdata sets and also identifying a very small subset of Rave stars in DR5 with problematic wavelengthcalibration (almost exclusively stars at the edge of the field plate at observing periods with a high
Figure 10. Radial velocity differences between Rave DR6 and Gaia DR2 as a function of BDASP stellarparameters and MADERA [M/H]. Left: temperature; Middle: giants (log g < 3.5) vs dwarfs (log g ≥ 3.5);Right: metallicity.
rate of disabled fibers). These stars have been removed in DR6 (see Appendix A). Rave DR6 andGaia DR2 have 450,646 stars in common. This provides an opportunity to comprehensively compareRave and Gaia radial velocities. Since Rave, however, provided the largest subset of targets forvalidating the Gaia pipeline (Sartoretti et al. 2018), the two data sets are not fully independent.Furthermore, the RVS of Gaia, covers the same spectral range at a similar resolving power, so thatany spectral mismatches approximately cancel out each other.
Figure 9 compares the radial velocities published in Gaia DR2 with those presented here (RV00sample). Overall this comparison confirms the excellent agreement between those two data sets. Thevelocity differences can well be matched with two Gaussians with standard deviations of 1.2 km s−1
and 3.4 km s−1, respectively, plus an additional exponential tail towards higher velocity errors. Wewill discuss the possible origins of this behaviour in the next section.
There is a systematic offset of about −0.32 km s−1. The offset is also comparable to the offset foundbetween Gaia DR2 and other ground-based spectroscopic surveys in a similar magnitude range, suchas APOGEE (Sartoretti et al. 2018), indicative that the source for this offset may at least partiallybe related to the radial velocity zero point of Gaia DR2. The difference is also within the internalerror estimates described above, errors as compared to external samples, and errors derived from asubset of stars with repeat observations.
A further analysis exhibits no systematic tendency of the RVs with Rave derived effective temper-atures for stars with 4000 K< Teff <7000 K (Figure 10, left panel). Stars cooler than 4000 K exhibita somewhat smaller shift of −0.1 km s−1. For stars hotter than 7000 K (a small subset of the Rave
sample), the accuracy of the radial velocity deteriorates resulting in a larger systematic shift anda considerably increased spread, owing to the increasing dominance of broad Paschen lines at theexpense of a less prominent Calcium triplet. With increasing SNR, the prominence of the 1.2 km s−1
Gaussian increases, while that of the 3.4 km s−1 Gaussian decreases. A lower fraction of dwarf stars(log g > 3.5) lies within the 1.1 km s−1 Gaussian than for giant stars (Figure 10, middle panel).
There is a very mild tendency for the velocity shift between Rave and Gaia DR2 to change withmetallicity (Figure 10, right panel). This effect amounts to about 0.5 km s−1 between [Fe/H] < −1and [Fe/H] > 0.
24 Steinmetz et al.
6.2. Validation with repeat observations
A further way to validate the quality of the Rave data products is to compare the parametersderived for multiple observations of the same object (see Section 2.7). In the following analysis wecalculate for each star k that has Nk
repeat > 1 observations, that fulfills the quality threshold for theRV00 sample, and that has a match in the Gaia DR2 catalog. This corresponds to a total of 95068spectra, or about 18% of the total Rave database. We determine the uncertainty ∆RV in the radialvelocity by three methods:
• From internal errors: ∆RV k for star k is randomly sampled assuming a normal distributionwith a width corresponding to the internal error estimate εkHRV .
• From repeat observations: The difference ∆RV ki between the radial velocity of star k deter-
mined from observation i (1 ≤ i ≤ Nkrepeat), RV
ki , and the mean RV
kfor the respective repeat
sequence.
• From comparison with Gaia DR2: The difference between the radial velocity from Gaia DR2and that of Rave DR6.
We then analyze the distribution function over all stars and observations and approximate it bytwo Gaussians using a least-squares fit analogously to Section 6.1.
The top row of Figure 11 shows the distribution function in RV for the aforementioned sample forthree different methods in the left, middle, and right column, respectively. Furthermore we show thesame analysis separated into giants (52405 spectra, middle row) and dwarfs (42663 objects, bottomrow). In each panel a fit of the distribution with two Gaussians is shown.
The comparison between the repeat sequence and the internal error distributions gives very consis-tent results, basically resulting in very similar values for both fitting Gaussian for each of the threesamples (all, giants, dwarfs).
The comparison with Gaia RVs finds identical fitting parameters as in Figure 9 indicating nosystematic difference between the repeat sample studied here and the full RV00 data set. Thewidth of the narrower Gaussians is a factor of 1.4 larger, the factor of the wider Gaussian is typicallysomewhat higher. This behavior is in very good agreement with our expectation: for two independentobservations of similar uncertainty (which is what we would expect for Gaia and Rave consideringthe comparable resolution and SNR), the errors should add in quadrature resulting in a
√2 wider
distribution function1.The fit by two Gaussians should be merely seen as a simple model to approximate a distribution
function which cannot be approximated by a single normal distribution but exhibits considerablenon-normal wings. The reason for this wings are manifold and include: (i) poorer fits in generalfor dwarf than for giants; (ii) systematic decrease in accuracy towards higher temperatures owing tothe less prominent Ca triplet feature; (iii) objects with intrinsically variable RVs, as the observationepochs of RAVE and Gaia DR2 data are between a few days and up to 12 years apart, (iv) varyingpresence of emission line features for active stars that can vary on similar time scales; (v) objectswith a large mismatch between the observed spectrum and its best synthetic counterparts. The lattercan be a consequence of inadequate modelling of certain types of spectra but also poor observing
1 note that for the repeat sequence the difference at on epoch to the mean is taken rather than the difference betweenthe velocity at two observation epoch. In the latter case we get the same
√2 factor
Rave DR6 - I.: spectra and radial velocities 25
10 3
10 2
10 1
100
all= 0.8 km s 1
A1 = 0.27= 2.0 km s 1
A2 = 0.08Gauss 1+2data
vepoch v [km s 1]
all1 = 0.8 km s 1
A1 = 0.282 = 2.0 km s 1
A2 = 0.08Gauss 1+2data
all1 = 1.2 km s 1
A1 = 0.202 = 3.4 km s 1
A2 = 0.05Gauss 1+2data
10 3
10 2
10 1
100
giants= 0.7 km s 1
A1 = 0.33= 1.7 km s 1
A2 = 0.09Gauss 1+2data
vepoch v [km s 1]
giants1 = 0.8 km s 1
A1 = 0.332 = 2.0 km s 1
A2 = 0.07Gauss 1+2data
giants1 = 1.1 km s 1
A1 = 0.242 = 3.3 km s 1
A2 = 0.04Gauss 1+2data
5 0 5vinternal [km s 1]
10 3
10 2
10 1
100
dwarfs= 1.0 km s 1
A1 = 0.22= 2.6 km s 1
A2 = 0.07Gauss 1+2data
5 0 5vepoch v [km s 1]
dwarfs1 = 0.9 km s 1
A1 = 0.222 = 2.2 km s 1
A2 = 0.08Gauss 1+2data
5 0 5vGaia [km s 1]
dwarfs1 = 1.4 km s 1
A1 = 0.162 = 3.7 km s 1
A2 = 0.05Gauss 1+2data
Figure 11. Difference in the radial velocity for all stars (top row), dwarfs (medium row) and giants(bottom row) with more than one observation. The left column shows the distribution of the expectedvelocity difference if the radial velocity RV k for each star k is normally distributed with variance εkHRV.The middle column shows the difference of the radial velocity RV k
i of star k measured at epoch i against
RVk, the radial velocity averaged over all epochs available for star k. The right column shows a comparison
between the radial velocity measured by Gaia and the radial velocity measured by Rave. The red and bluecurves correspond to the individual Gaussians of a two-Gaussian fit to the distribution, shown in green.
conditions or suboptimal instrument performance. We note that the latter is more common for starsobserved through fiber numbers 1–2, or 145–150, i.e. the ones at the extreme edges of the CCD.Consistent with the assumptions (iv) and (v) we also find the wings of the distribution function tobe less pronounced and the wider Gaussian to be somewhat suppressed for subsamples limited tohigh SNR.
26 Steinmetz et al.
Table 6. DR6 SPARV catalog description
Col Format Units NULL Label Explanations
1 char - N rave obs id Rave spectrum designationa
2 char - N raveid Rave target designationb
3 char - N objectid object identifier used in input catalogc
4 float km s−1 N hrv sparv Heliocentric radial velocity (HRV)
5 float km s−1 N hrv error sparv HRV error
6 float - N correlation coeff sparv Tonry-Davis R correlation coefficient
7 float - N correction rv sparv zero-point correction of the HRV
8 float - N chisq sparv χ2 of the SPARV pipeline
9 float - N snr med sparv median SNR d
aObservation date, field name, fibre number.
bJ2000 GCS RA and Dec.cTycho-2, SSS, DENIS.
das derived from SPARV, see Section 3.2.
Based on this analysis we conclude that 68% of the radial velocities on Rave DR6 have a velocityaccuracy better than 1.4 km s−1, while 95% of the objects have radial velocities better than 4.0 km s−1.
7. THE SIXTH Rave PUBLIC DATA RELEASE: CATALOG PRESENTATION I
Rave DR6 spectra and derived quantities are made available through a data base accessible viadoi:10.17876/rave/dr.6/. Since key words and unquoted identifiers are case insensitive, in SQL,in general lower case identifiers are used in the data base. The two main identifiers are rave obs id
and raveid: the former, rave obs id, is the unique identifier denoting the observation of a particularspectrum – the name is a composite of the observing date, field name, and fiber number allocated tothe star on that occasion.raveid is the unique identifier of the target star, the name being a composite of the targets Galactic
coordinates in the J2000.0 system. Consequently, objects that have several observations have the sameraveid for all, but differ in their rave obs id. The data base contains also a considerable number ofauxiliary parameters that can be employed to further scrutinize the specifics of the reductions usingthe various pipelines. These variables are described on the aforementioned website. Furthermore,ample information regarding cross-identification with other catalogs is given.
For convenience we also provide a set of FITS, CSV, and HDF files of the overall Rave cata-log, featuring key variables sufficient for the majority of applications of the Rave survey. Thesedata are organized in 16 files according to the pipeline employed; the content for 6 of these files isbriefly described in the following paragraphs and associated tables, for the remining 10 we refer topaper DR6-2. We avoid duplication of variable entries in the different files, with the exception ofrave obs id, which can be used to link the contents of the various catalogs.
7.1. The Rave DR6 catalog of spectra
Rave DR6 - I.: spectra and radial velocities 27
Table 7. DR6 ObsData catalog description.
Col Format Units NULL Label Explanations
1 char - N rave obs id Rave spectrum designation
2 char deg N ra input RA in input catalog
3 char deg N dec input Dec in input catalog
4 char - N field field denotator, composite of obsdate and fieldname
5 int - N obsdate Observation date yyyymmdd
6 char - N fieldname name of the field: RA and Dec of field center
7 char - N fibernumber Number of optical fiber [1,150]
8 char - N ut start exposure start in Coordinated Universal Time
9 char - N ut end exposure end in Coordinated Universal Time
10 char - N lst start exposure start in Local Sidereal Time
11 char - N lst end exposure end in Local Sidereal Time
12 int s N exposure time total exposure time
13 char deg N ra field RA field center
14 char deg N dec field Dec field center
15 int - N platenumber Number of field plate [1..3]
16 float - N airmass Airmass
17 float - Y lunar phase Lunar phase
18 char - N healpix4096 HEALPix valuea
19 int - Y cluster flag 1: targeted observation, NULL: otherwise
21 int - Y footprint flag 1: star in the Rave footprint, NULL: otherwise
aHierarchical Equal-Area iso-Latitude Pixelisation (HEALPix) values were computed using the resolutionparameter Nside = 4096 (resolution index of 12) and the NESTED numbering scheme. Any lower-resolution index HEALPix value can be computed from the given one by dividing it by 4(12−n), wheren < 12 is the desired resolution index.
Table 8. DR6 Class catalog description.
Col Format Units NULL Label Explanations
1 char - N rave obs id Rave spectrum designation
2 char - N flag1 class Primary flag
3 char - Y flag2 class Secondary flag
4 char - Y flag3 class Tertiary flag
5 float - N w1 class Weight associated with primary flag
6 float - Y w2 class Weight associated with secondary flag
7 float - Y w3 class Weight associated with tertiary flag
28 Steinmetz et al.
Table 9. DR6 Repeats catalog description.
Col Format NULL Label Explanations
1 char N raveid Unique object identifier
2 int N n repeats number of repeat observations (between 1 and 13)
3- char Y rave obs id1 - unique spectrum identifiers
15 rave obs id13 for all repeat observations
Rave spectra and error spectra are available via the data base on the Rave webpage2
(DR6 Spectra, doi:10.17876/rave/dr.6/019). Spectra are made available in FITS files with aname based on their rave obs id containing (i) the actual wavelength-calibrated and flux normal-ized spectrum and (ii) the associated error spectrum (for example, see Figure 5).
Only spectra that successfully passed the SPARV pipeline (i.e., where a radial velocity can be derived)are added to the data base.
7.2. The Rave DR6 catalog of radial velocities
The DR6 SPARV table (doi:10.17876/rave/dr.6/001) should be seen as the master file of theRave DR6 data release. It contains all observations and objects for which a spectrum can be foundin the spectral data base, contains all observations for which the pipeline converged to provide aradial velocity, and is the sample of spectra that served as input for further analysis pipelines, e.g.,those to derive stellar atmospheric parameters or abundances.DR6 SPARV contains the heliocentric radial velocity, information on the zero-point calibration us-
ing sky lines (see Section 5) and convergence information of the pipeline (Table 6). In the Ravedata base, additional information such as stellar parameters from matching templates is provided(DR6 SPARV aux, doi:10.17876/rave/dr.6/002). These data should, if at all, be used with care forfurther astrophysical applications, as they are subject to complicated biases (see DR4, Section 4.4).
7.3. The Rave DR6 catalog of diagnostic data
DR6 ObsData (doi:10.17876/rave/dr.6/003) contains helpful diagnostic information regardingthe Rave data and the derived data products (Table 7). This includes, e.g., the observing date,exposure time, fiber number, field plate used, number of arc lines used for the wave length calibration,the coordinates of the field plate center, phase of Moon, and healpix coordinates.
7.4. The Rave DR6 catalog of classification
Results of the automated classification (Section 4) are assembled in the DR6 Class file(doi:10.17876/rave/dr.6/004, Table 8), giving up to 3 classification flags and their relative weights.
7.5. The Rave DR6 catalog of repeat observations
To enable an easy analysis of stars with more than one observation date, the DR6 Repeats file(doi:10.17876/rave/dr.6/005, Table 9) features the raveid to identify the target uniquely, the
2 http://www.rave-survey.org
Rave DR6 - I.: spectra and radial velocities 29
number of revisits n Repeats, and the respective rave obs ids of all observations of that particulartarget (for a detailed analysis, see Section 2.7).
7.6. Cross match of Rave DR6 with Gaia DR2 and other catalogs
The Rave DR6 data release is complemented by two files cross-matching Rave DR6 with Gaia DR2(DR6 GaiaDR2, doi:10.17876/rave/dr.6/015) and with a suite of other catalogs including Tycho-2,2MASS, WISE, APASS9, and SKYMAPPER (DR6 XMatch, doi:10.17876/rave/dr.6/016).
8. SUMMARY AND CONCLUSIONS
The Rave final data release concludes a more-than-15 year effort to provide a homogeneous dataset for Galactic archaeology studies. Rave DR6 presents spectra and radial velocities for indi-vidual stars in the magnitude range 9 < I < 12 mag. The spectra cover a wavelength rangeof 8410 − 8795 A at an average resolution of R ∼ 7500. The Rave catalog can be accessed viadoi:10.17876/rave/dr.6/001. The typical SNR of a Rave star is 40, and the typical uncertaintyin radial velocity is < 2 km s−1. Catalogs containing observing statistics, repeat observations, anautomated classification scheme, and cross matches with the Gaia DR2 and other catalogs suchas 2MASS, DENIS, HIPPARCOS, TYCHO2, WISE, SKYMAPPER, and APASS9 complement theRave final data release. Accompanying derived data products such as stellar parameters, chemicalabundances, and distances as well as some science applications are presented in Paper DR6-2.
Major scientific projects like the Rave survey are made possible by the contributions of many, inparticular those of graduate students and postdocs. This final data release is published in memoryof one of the first and most active student participants in Rave Gregory R. Ruchti (1980 - 2019),whose life was taken far too early. His enthusiasm and dedication were key elements of the successof the Rave collaboration and his contributions live on in the discoveries that are enabled by theRave data.
Funding for Rave has been provided by: the Leibniz-Institut fur Astrophysik Potsdam (AIP); theAustralian Astronomical Observatory; the Australian National University; the Australian ResearchCouncil; the French National Research Agency (Programme National Cosmology et Galaxies (PNCG)of CNRS/INSU with INP and IN2P3, co-funded by CEA and CNES); the German Research Foun-dation (SPP 1177 and SFB 881: Project-ID 138713538); the European Research Council (ERC-StG240271 Galactica); the Istituto Nazionale di Astrofisica at Padova; The Johns Hopkins University; theNational Science Foundation of the USA (AST-0908326); the W. M. Keck foundation; the MacquarieUniversity; the Netherlands Research School for Astronomy; the Natural Sciences and EngineeringResearch Council of Canada; the Slovenian Research Agency (research core funding no. P1-0188); theSwiss National Science Foundation; the Science & Technology Facilities Council of the UK; Opticon;Strasbourg Observatory; and the Universities of Basel, Groningen, Heidelberg and Sydney. PJM issupported by grant 2017-03721 from the Swedish Research Council. LC is the recipient of the ARCFuture Fellowship FT160100402. RAG acknowledges the support from the PLATO CNES grant.SM would like to acknowledge support from the Spanish Ministry with the Ramon y Cajal fellow-ship number RYC-2015-17697. MV acknowledges support of the Deutsche Forschungsgemeinschaft(DFG, project number: 428473034). MS thanks Research School of Astronomy & Astrophysics inCanberra for support through a Distinguished Visitor Fellowship. RFGW thanks the Kavli Institutefor Theoretical Physics and the Simons Foundation for support as a Simons Distinguished Visiting
30 Steinmetz et al.
Scholar. This research was supported in part by the National Science Foundation under Grant No.NSF PHY-1748958 to KITP.
This work has made use of data from the European Space Agency (ESA) mission Gaia (https://www.cosmos.esa.int/gaia), processed by the Gaia Data Processing and Analysis Consortium(DPAC, https://www.cosmos.esa.int/web/gaia/dpac/consortium). Funding for the DPAC has beenprovided by national institutions, in particular the institutions participating in the Gaia MultilateralAgreement.
In total there are 7041 Rave DR5 spectra that are not in this final data release. These fall into tothe following two categories:
1. Fewer than 4 arc lines were available for wavelength calibrations. This condition mainly occursnear the edges of the field plate owing to the fast focal ratio of the spectrograph camera whenmany fibers have been broken (Steinmetz et al. 2018) (687 spectra).
2. Cases where the processing failed or the corresponding error spectrum could not be computed(6434 spectra).
Furthermore, 4727 spectra were added that are not in Rave DR5, mainly corresponding to targetedobservations in the context of the Aquarius substructure (Williams et al. 2011).
Bastian, U., Roser, S., & Scholz, R. D. 2001, inAstronomical Society of the Pacific ConferenceSeries, Vol. 228, Dynamics of Star Clusters andthe Milky Way, ed. S. Deiters, B. Fuchs,A. Just, R. Spurzem, & R. Wielen, 321
Bessell, M. S. 1979, PASP, 91, 589,doi: 10.1086/130542
Johnston, K. J. 2003, in Proc. SPIE, Vol. 4854,Future EUV/UV and Visible SpaceAstrophysics Missions and Instrumentation., ed.J. C. Blades & O. H. W. Siegmund, 303–310
Jones, D. H., Read, M. A., Saunders, W., et al.2009, MNRAS, 399, 683,doi: 10.1111/j.1365-2966.2009.15338.x
Kordopatis, G., Gilmore, G., Steinmetz, M., et al.2013, AJ, 146, 134,doi: 10.1088/0004-6256/146/5/134
Mink, D. J., & Kurtz, M. J. 1998, in AstronomicalSociety of the Pacific Conference Series, Vol.145, Astronomical Data Analysis Software andSystems VII, ed. R. Albrecht, R. N. Hook, &H. A. Bushouse, 93
Miszalski, B., Shortridge, K., Saunders, W.,Parker, Q. A., & Croom, S. M. 2006, MNRAS,371, 1537,doi: 10.1111/j.1365-2966.2006.10777.x
Munari, U., Henden, A., Frigo, A., et al. 2014, AJ,148, 81, doi: 10.1088/0004-6256/148/5/81
Nordstrom, B., Mayor, M., Andersen, J., et al.2004, A&A, 418, 989,doi: 10.1051/0004-6361:20035959
Oliphant, T. E. 2006, A guide to NumPy, Vol. 1(Trelgol Publishing USA)
Perryman, M.A.C., e. a. 1997, The Hipparcos andTycho Catalogues, (ESA SP-1200; Nordwijk:ESA)
Recio-Blanco, A., de Laverny, P., Allende Prieto,C., et al. 2016, A&A, 585, A93,doi: 10.1051/0004-6361/201425030
Rickman, H. 2001, in Trans. of the IAU, Proc. ofthe 24th General Assembly (San Francisco, CA:ASP), 91
Sartoretti, P., Katz, D., Cropper, M., et al. 2018,A&A, 616, A6,doi: 10.1051/0004-6361/201832836
Siebert, A., Williams, M. E. K., Siviero, A., et al.2011, AJ, 141, 187,doi: 10.1088/0004-6256/141/6/187
Skrutskie, M. F., Cutri, R. M., Stiening, R., et al.2006, AJ, 131, 1163, doi: 10.1086/498708
Steinmetz, M. 2003, in Astronomical Society ofthe Pacific Conference Series, Vol. 298, GAIASpectroscopy: Science and Technology, ed.U. Munari, 381
Steinmetz, M., Zwitter, T., Matijevic, G., Siviero,A., & Munari, U. 2018, Research Notes of theAmerican Astronomical Society, 2, 194,doi: 10.3847/2515-5172/aaead0
Steinmetz, M., Zwitter, T., Siebert, A., et al.2006, AJ, 132, 1645, doi: 10.1086/506564
Steinmetz, M., Guiglion, G., McMillan, P. J.,et al. 2020, arXiv e-prints, arXiv:2002.04512.https://arxiv.org/abs/2002.04512
Tody, D. 1993, in Astronomical Society of thePacific Conference Series, Vol. 52, AstronomicalData Analysis Software and Systems II, ed.R. J. Hanisch, R. J. V. Brissenden, & J. Barnes,173
Valentini, M., Chiappini, C., Davies, G. R., et al.2017, A&A, 600, A66,doi: 10.1051/0004-6361/201629701
Watson, F. G., Parker, Q. A., Bogatu, G., et al.2000, in Proc. SPIE, Vol. 4008, Optical and IRTelescope Instrumentation and Detectors, ed.M. Iye & A. F. Moorwood, 123–128
Wes McKinney. 2010, in Proceedings of the 9thPython in Science Conference, ed. Stefanvan der Walt & Jarrod Millman, 56 – 61
Williams, M. E. K., Steinmetz, M., Sharma, S.,et al. 2011, ApJ, 728, 102,doi: 10.1088/0004-637X/728/2/102