The Size of the Sports Industry in the United States Jane E. Ruseski University of Alberta Department of Economics Brad R. Humphreys University of Alberta Department of Economics IASE 10 th Annual Conference 10 May 2008 Gijón, Spain
Transcript
The Size of the Sports Industry in the United
States
Jane E. RuseskiUniversity of Alberta
Department of Economics
Brad R. HumphreysUniversity of Alberta
Department of Economics
IASE 10th Annual Conference 10 May 2008Gijón, Spain
Organization of Presentation
• Motivation• Definition / Data Sources• Estimates of Size of Sports Industry
– Sports participation– Sports viewing– Economic Value - Demand Side– Economic Value - Supply Side
Motivation• Few estimates of the total economic scope of the
sports industry– Studies estimate the contribution of sport to the local
economy– Many studies estimate the economic impact of
sporting events
• Document the economic scope of sport in the US from a macroeconomic perspective– Focus on US for convenience and access to data
Definition of Sports Industry
• Three primary components– Individual participation in sport– Attendance at spectator sporting events– Following spectator sporting events through media
– newspaper, television, internet
• Why these three components?– Encompasses active and passive
participation in sports– Both aspects are important in trying to
estimate the size and scope of the industry
Challenges• Estimating economic value and extent of
participation proved to be challenging• Unlike other industries, such as the hotel
industry, there is no commonly accepted definition of the sports industry for measuring economic performance
• Solutions – develop a working definition of the sports industry – use a variety of data sources, construct estimates
from both supply and demand side
Data Sources
Data SourceActive Participation
Inactive Participation
Economic Value: Supply Side
Economic Value: Demand Side
NSGA – 2005 ▲ ▲ - tv ▲ - revenues ▲ - spending
BRFSS – 2000 ▲
Vital Statistics of US – 2005
▲ -multimedia
Statistical Abstract of US – 2005
▲ - internet
US Census – 2002
▲ - revenues
Datamonitor – 2005
▲ - revenues
US BEA – 2005 ▲ - admissions
US CEX – 2005 ▲ - consumer spending
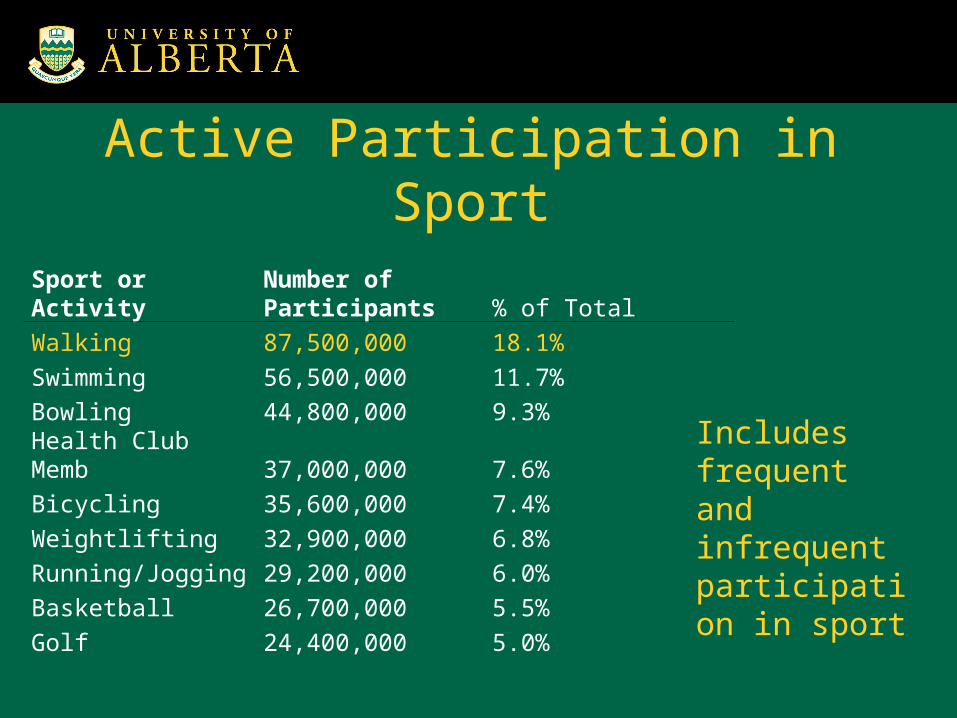
Sport or ActivityNumber of Participants % of Total
Walking 87,500,000 18.1%
Swimming 56,500,000 11.7%
Bowling 44,800,000 9.3%
Health Club Memb 37,000,000 7.6%
Bicycling 35,600,000 7.4%
Weightlifting 32,900,000 6.8%
Running/Jogging 29,200,000 6.0%
Basketball 26,700,000 5.5%
Golf 24,400,000 5.0%
Active Participation in Sport
Includes frequent and infrequent participation in sport
Sport Lower bound Mean Upper Bound
Walking 68,600,000 69,301,784 70,000,000
Running/Jogging 12,500,000 12,901,119 13,300,000
Weightlifting 7,118,775 7,396,304 7,673,832
Golf 4,787,312 4,982,688 5,178,063
Bicycling 4,588,754 4,791,467 4,994,179
Aerobics 4,189,563 4,355,448 4,521,333
Basketball 3,276,901 3,461,372 3,645,844
Health Club 2,375,871 2,510,246 2,644,621
Swimming 2,216,229 2,356,134 2,496,039
Total 118,481,056 122,094,722 125,702,581
Active Participation in Sport
Table 3: Estimated Total Attendance at Sports Events, NGSA 2005 –
Sports with at least 2 million in Attendance
SportTotal
AttendanceMajor League Baseball 74,385,100NCAA Football 43,486,574NCAA Men's Basketball 30,568,645National Basketball Association 21,369,078National Hockey League (2004) 19,854,841National Football League 17,011,986Minor League Baseball 15,636,000NASCAR Winston Cup Series 6,300,000Minor League Hockey 6,179,000Horse Racing 5,979,000Professional Rodeo 5,429,000NASCAR Busch Series 3,911,000Professional Golfers Association 3,200,000Arena Football League 2,939,000Major League Soccer 2,900,715Minor League Basketball 2,625,000
Inactive Participation - Attendance
Total attendance just over 277 million
Estimate of opportunity cost, based on average wage of $18 per hour ≈ $19.9 billion in 2005 or 0.25% of $8.2 trillion of personal spending
In addition to opportunity cost of time, other economic activity associated with tickets, parking, concessions, etc.
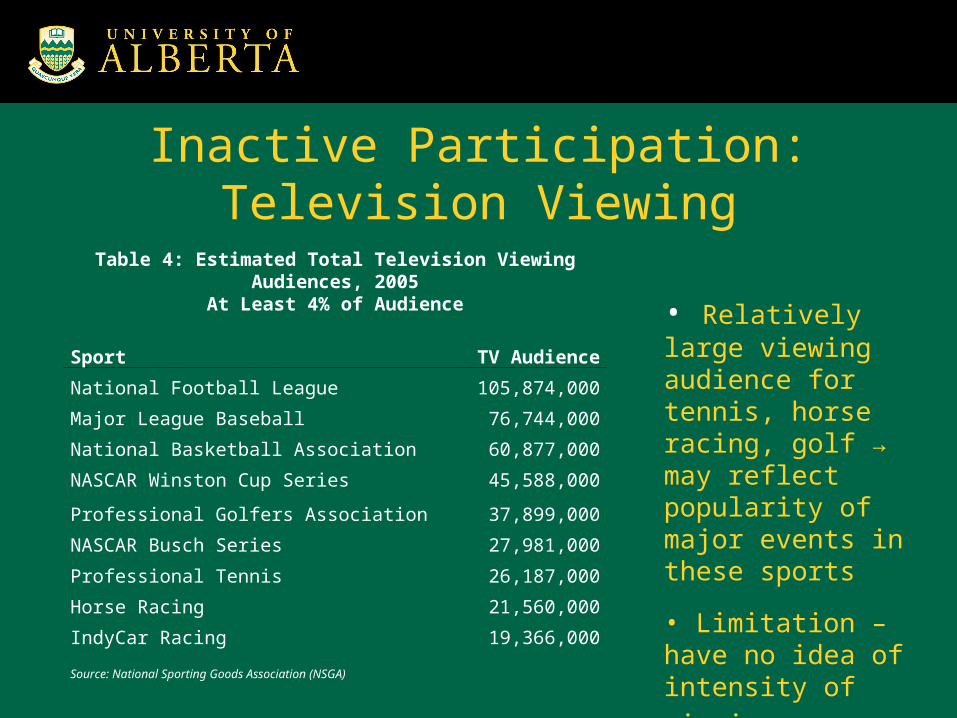
Table 4: Estimated Total Television Viewing Audiences, 2005
At Least 4% of Audience
SportTV
Audience
National Football League 105,874,000
Major League Baseball 76,744,000
National Basketball Association 60,877,000
NASCAR Winston Cup Series 45,588,000
Professional Golfers Association 37,899,000
NASCAR Busch Series 27,981,000
Professional Tennis 26,187,000
Horse Racing 21,560,000
IndyCar Racing 19,366,000
Source: National Sporting Goods Association (NSGA)
Inactive Participation: Television Viewing
• Relatively large viewing audience for tennis, horse racing, golf → may reflect popularity of major events in these sports
• Limitation – have no idea of intensity of viewing
Table 5: Summary Statistics for Firms in the Sports Industry, 2002
Sub-Industry NAICS Code
# Estab. Employees
Revenues (mil)
Payroll (mil)
Spectator Sports Teams 711211 674 40,746 $13,025 $9,106
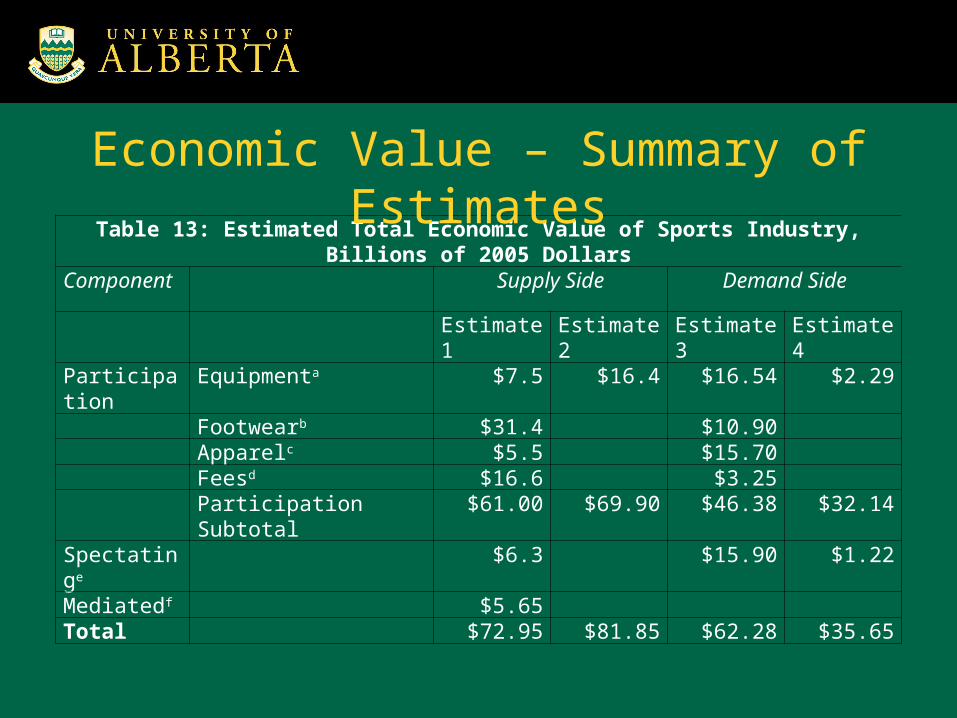
Summary of Estimates• Difference in supply side estimates → value of sports
equipment produced and sold– NSGA estimate is $7.5 billion– Datamonitor estimates is $16.4 billion. – Difference could be due to different definitions of sports
equipment, survey methods or survey samples• Difference in demand side estimates
– Estimates of consumer purchases of sports equipment generated by Datamonitor and the Consumer Expenditure Survey → CEX includes only household spending while Datamonitor includes household, business and institutional spending
– Estimates of spending on attending spectator sports generated by the Bureau of Economic Analysis Current Business Survey and the Consumer Expenditure Survey → not clear what explains difference