Received: 19 September 2016 | Accepted: 1 June 2017
DOI: 10.1002/mas.21540
REVIEW ARTICLE
The Skyline ecosystem: Informatics for quantitative mass
spectrometry proteomics
Lindsay K. Pino | Brian C. Searle | James G. Bollinger | Brook Nunn |
Brendan MacLean | Michael J. MacCoss
Department of Genome Sciences, University
of Washington School of Medicine, Seattle,
Washington
Correspondence
Michael J. MacCoss, PhD, Department of
Genome Sciences, University of Washington
School of Medicine, Seattle, WA.
Email: [email protected]
Funding information
National Institutes of Health, Grant numbers:
R01 GM103551, R01 GM121696, P41
GM103533, U54 HG008097, R21
CA192983, P30 AG013280
Skyline is a freely available, open-source Windows client application for accelerating
targeted proteomics experimentation, with an emphasis on the proteomics and mass
spectrometry community as users and as contributors. This review covers the
informatics encompassed by the Skyline ecosystem, from computationally assisted
targeted mass spectrometry method development, to raw acquisition file data
processing, and quantitative analysis and results sharing.
K E YWORD S
informatics, quantitative mass spectrometry, targeted proteomics
1 | INTRODUCTION
Since the completion of the Human Genome project1–3 a wealth of
functional genomic techniques have emerged as the focus of research
shifts to assigning function and understanding the regulation of each of
the identified gene products. The objective of these efforts is to better
understand how the information stored in a genome encodes all the
complexity necessary to sustain a complex multicellular organism.4
Nothwithstanding impressive gains in these technologies, interpreta-
tion of their results is limited without corresponding data on proteins,
the primary functional macromolecules encoded by the genome. This
limitation is highlighted by the observation that measurements
performed at the nucleic acid level tend to correlate very poorly
with those performed at the protein level5,6 especially in cases when
experimental noise is not considered.7 A combination of factors likely
contribute to the poor protein-transcript correlation, including the
variable lifetime of each protein dictated by its respective synthesis
and degradation rates; the existence of multiple different forms of
each transcript product due to post-translational modifications; and
finally, the temporal/spatial regulation imparted by protein complexes
and the highly compartmentalized nature of cellular processes.
Accordingly, the direct analysis of proteins, albeit more technically
challenging, is absolutely crucial to a complete understanding of gene
regulation and systems biology.
1.1 | Introduction to quantitative mass spectrometry
proteomics
Tomeet these ends, tandemmass spectrometry (MS/MS) has emerged
as the dominant analytical platform for the direct characterization of
the protein fraction from complex biological matrices.8 To date, a
majority of mass spectrometry-based proteomic workflows have
utilized a “bottom-up” approach in which proteins are digested with an
endoprotease prior to analysis. The resulting peptide mixture is
typically separated via nano-flow reverse-phase liquid chromatogra-
phy, ionized, and emitted directly into a mass spectrometer for
analysis.
Both absolute and relative quantitative measurements, reviewed
in detail elsewhere,8 are possible via several of the commonly applied
MS acquisition methods. Targeted acquisition methods, including
selected reaction monitoring (SRM),9 also known as multiple reaction
monitoring (MRM),10 and parallel reaction monitoring (PRM),11
quantify peptides from a pre-programmed list of precursor-fragment
pairs and scheduled isolation windows based on previously deter-
mined chromatography elution times. Data-independent acquisition
(DIA)12 such as Sequential Window Acquisition of all Theoretical
Fragment ion spectra (SWATH)13 forgo pre-programmed precursor-
fragment pairs, widening the isolation windows to activate all ions in a
pre-specified mass-to-charge (m/z) range. A detailed review of DIA
Mass Spec Rev. 2017;1–16. wileyonlinelibrary.com/journal/mas © 2017 Wiley Periodicals, Inc. | 1
methodology can be found elsewhere,14,15 including peptide-centric
approaches to DIA.16 It is also possible, through MS1 filtering
informatics techniques,17 to use data dependent acquisition (DDA)
for quantitative analysis as opposed to conventional detection
analysis.
The type of acquisition influences the selectivity, reproducibility,
repeatability, limit of detection, dynamic range, and data density of the
assay.18 Additionally, acquisition type places specific requirements on
assay development and influences the computational strategy for
analyzing data. A variety of individual informatics tools have been
developed to aid in assay development and to process the data
collected with various acquisition types, reviewed elsewhere.19,20
Many freely available informatics tools, however, struggle with
community adoption, due to issues with limited end user design,
and lack a complete pipeline spanning method development through
data analysis for an experiment.
1.2 | Overview of the Skyline ecosystem for
quantitative mass spectrometry informatics
Properties such as easy access, large dataset management, integration
with other commonly used tools, intuitive data visualization, timely
issue resolution, documentation, support, as well as facilitated sharing
of data files and the methods used to collect them21 are important
aspects that influence software adoption. With these needs in mind,
the freely available and open-source Skyline ecosystemwas developed
with a user-friendly interface, comprehensive file compatibility,
vendor-neutral data processing, intuitive visualization, and reasonable
computational requirements.22 The original objective of the Skyline
project was to create a single informatics tool to generateMSmethods
and to analyze the data collected for chromatography-based
quantitative MS experiments. In addition to these core functions,
Skyline now invites the community to share their own informatics tools
through an external tool store23 for software tools that support point-
and-click installation and can be run from the Skyline Tools menu.
Furthermore, the introduction of additional software to the Skyline
ecosystem such as Chorus for sharing raw MS files (http://
chorusproject.org) and Panorama for sharing Skyline processed
experimental results,24 has helped facilitate large-scale MS datasets
and inter-laboratory collaborations.
The Skyline ecosystem is unique among freely available, open
source mass spectrometry proteomics software in its end-to-end
support of the targeted proteomic mass spectrometry workflow. A
Skyline document is first used for assay development, aiding in
instrument method creation for targeted and DIA experiments (Fig. 1).
Skyline exports the methods for use in mass spectrometry acquisition
on a broad range of instruments from six different mass spectrometer
vendors (Table 1). Without need of any file conversion, Skyline then
supports importing raw data from most LCMS capable instruments,
calculating peak areas in a vendor-neutral manner. Peak area data may
be explored within the Skyline document using core analyses,
comparing peptide retention times, peak areas, sample groups,
underlying chromatograms, and even mass spectra when available.
Further analyses are possible, including those made available by
external tools integrated into the Skyline ecosystem and through data
report exports that researchers can process using their own tools, and
custom code in R, MATLAB, Python, etc. Although a freely available,
open source academic project, Skyline’s engineering includes rigorous
nightly testing to ensure any code changes made during the day are
compatible with the program’smany other various functions. This level
of thoroughness ensures the mass spectrometry community receives
an informatics toolkit that is consistent and highlymaintained, allowing
FIGURE 1 Generalized workflow for quantitative MS assay development. Six main steps are outlined, beginning with the development of a
hypothesis and continuing through additional analyses, with examples of the associated Skyline ecosystem features
2 | PINO ET AL.
researchers to upgradewith confidence as the software is adapted and
changed.
Today, over 8700 mass spectrometrists are registered Skyline
users with more than 64 000 installations since first public release, and
over 1100 publications have cited the original Skyline paper. We next
describe how the community uses the Skyline ecosystem, and the
informatics employed by the Skyline ecosystem, from assay develop-
ment, to data processing and visualization, and finally dissemination of
results.
2 | ASSAY DEVELOPMENT
The requirements for developing an effective quantitative MS
proteomics assay are specific to the type of experiment and the
peptide targets being assayed. For all experiments, prior to MS
acquisition, it is obligatory to create a program for the instrument that
defines the instrument parameters and defines how the data are to be
collected by the instrument. In addition, depending on the acquisition
mode of the instrument (ie, SRM/MRM, PRM, DIA, and DDA), multiple
decisions must be made to optimize the acquisition of the data (Fig. 1).
For example, the experiments with the most intensive assay
development, scheduled SRM/MRM and PRM type experiments,
necessitate selection of target peptides and their transitions (SRM
only) prior to acquisition, validation of transitions by MS/MS spectra,
potentially optimization of individual parameters (such as collision
energy—CE), and determination of retention times (RT) for optimal MS
instrument scheduling. On the other hand, for DIA experiments, the
only required step pre-acquisition is calculating isolation window
schemes. Although this review is focused on the Skyline ecosystem for
quantitative proteomics, we note that the ecosystem also works for
generalized small molecules25 and briefly describe considerations for
non-peptide targets. In this section, we describe the steps required for
assay development, noting which steps are necessary for which
experiment types.
2.1 | Peptide and transition selection for targeted
experiments
Many proteomics hypotheses are rooted in biological observations,
and so selecting proteins of interest and peptides that are exclusively
representative of those proteins is often the first experimental design
step in targeted bottom-up proteomic experiments, such as SRM/
MRM and PRM. Selection of peptides for targeted assays is a complex
process, involving consideration of (i) specific peptides or amino acid
modifications of interest; (ii) biological influences on the protein of
interest; (iii) chemical influences on peptide suitability for MS
experiments; and (iv) for SRM/MRM experiments, the selection of
fragment ions for quantitation.
2.1.1 | Specific peptides or amino acid modifications
of interest
In the first case, specific amino acid modifications, especially post-
translational modifications at the protein level, may dictate a peptide
sequence of interest. This is especially seen in targeted phosopho-
proteomics assays, where the phosphosite of interest has previously
been determined by prior experiments.17,26,27 In these cases, it may be
easiest to manually enter the peptide sequences of interest. Skyline
accepts peptides added directly to the document as lists in the Targets
window. Peptides added as lists may have modifications and even
charge states specified in the added sequence text. They may also be
modified manually within Skyline one at a time, or in bulk by changing
the Skyline modification settings.
2.1.2 | Biological influences on the protein of interest
For situations where the peptide sequence is not defined by the
experiment, Skyline accepts lists of proteins, either entered manually,
copy-pasted, or as a FASTA file import. After proteins are added to the
document, Skyline digests the proteins in silico to generate a list of
peptides. The result of Skyline’s in silico digestion depends on the
particular endoprotease specified in the settings of the Skyline
document. The most common endoproteases used in bottom-up
proteomics are Lys-C, which hydrolyzes specifically at the carboxyl
side of lysine; chymotrypsin, which cleaves amide bonds on the
carboxyl side; and trypsin, which cleaves the carboxyl side of lysine or
arginine. Other Skyline Peptide Settings that affect results of peptide
list generation are common biochemical sample preparation concerns
such asmissed cleavages, oxidizedmethionine, and peptide amino acid
length.28–30 After endoprotease(s) are selected and biochemical
considerations are defined in the Peptide Settings in the Skyline
document, researchers can add proteins of interest to the Skyline
target list and Skyline automatically performs in silico digestion on the
proteins and the resulting peptides displayed, organized by protein of
origin.
A point of consideration for proteomics research with clinical
applications is the selection of peptides that may have naturally
occurring amino acid variations due to individual subjects’ genetic
TABLE 1 Proprietary file formats supported by Skyline
Vendor
File
extension
Instruments
supported
Acquisitions
supported
Agilent .d (Directory) QqQ, Q-TOF,
IMS-TOF
DDA, SRM, DIA
Bruker .d (Directory) Q-TOF DDA, PRM, DIA
Sciex .wiff (File) QqQ, Q-TOF DDA, SRM,
PRM, DIA
Shimadzu .qgd QqQ SRM
Thermo .raw (File) QqQ, Q-OT, Q-
LIT
DDA, SRM,
PRM, DIA
Waters .raw (Directory) QqQ, Q-TOF,
IMS-TOF
SRM, PRM, DIA
Vendors and instruments supported by the Skyline ecosystem are specified
along with their respective proprietary file format and general acquisition
types (QqQ, triple quadrupole;Q-TOF, quadrupole-time of flight; IMS-TOF,
ion mobility spectrometry-time of flight; Q-OT, quadrupole-Orbitrap; Q-
LIT, quadrupole-linear ion trap).
PINO ET AL. | 3
backgrounds. Single nucleotide polymorphisms (SNPs) in the genome
may give rise to amino acid changes in the final proteoform, which may
alter a peptide sequence. To help guide users collecting data on clinical
samples that may include SNP-related variation, Skyline provides users
with access to the informatics tool Population Variation.31 Population
Variation reveals all human sequence variation within a set of user-
specified peptides or proteins by identifying theminor allele frequency
of peptide targets. The tool then filters SNP data records from dbSNP
by criteria directly relevant to proteomics experiments, storing entries
with minor allele frequency >0.01, a non-null protein accession, and a
protein-influencing mutation (missense, stop-gain, frameshift). The
refined list is stored as a SQLite database and can be accessed through
a Skyline plug-in. Running the Population Variation Skyline plug-in
outputs a table listing the isoforms and peptide variants for all proteins
included in the Skyline document. Researchers can use this output to
consider variant peptide targets to ensure that the assay accurately
measures.
2.1.3 | Chemical considerations of selected peptides
Next, the hypothesis-based, biologically considered peptides must be
validated for chemical considerations, namely MS signal robustness.
Peptides from the same protein of interest have a range of MS signal
response, with some peptides reliably responding strongly and others
responding weakly or variably to MS conditions.32 These widely
ranging responses are dictated by sequence-specific physiochemical
properties (eg, length of the amino acid sequence, charge, presence of
various amino acids, and hydrophobicity) and can be empirically
determined using prior knowledge fromMS experiments33 or by using
predictive algorithms.
Empirical determination of high-responding peptides requires
performing preliminary MS experiments with the potential targets,
often synthesized or purchased, in the intended sample matrix.33 The
mass spectrometrist then evaluates the potential target peptide and
transition pairs for signal response and chemical noise interference.
Skyline facilitates this empirical evaluation with simple transition
deletion and addition tools, including ability to Undo these operations,
allowing researchers to easily create or modify transition lists for
targeted assay development. Besides empirical determination, how-
ever, it is also possible to query past MS experiments to evaluate
peptide signal response, making use of Skyline-supported online
repositories like PeptideAtlas,34 Human Proteinpedia,35 GPM Proteo-
mics Database,36 and PRIDE.37 A caveat to using repositories, as
opposed to an assay-specific preliminary experiment, is that peptide
response is not the same across instruments and acquisition types.
In addition to empirical determination, predictive algorithms
provide an alternative or complementary method to select the target
peptides most likely to be high-responding for a set of proteins.38–41
For researchers interested in using predictive algorithms for SRM/
MRM and PRM peptide selection, Skyline has implemented the
publically available, open-source PREGO algorithm42 as a plug-in.
PREGO42 predicts high responding peptides using an artificial neural
network on DIA experimental data. The artificial neural network was
trained using 11 minimally redundant, maximally relevant physio-
chemical properties that describe peptide size, structure, and
hydrophobicity. PREGO outperforms previous predictive algorithms,
correctly predicting more high-responding peptides than other
algorithms. This performance improvement is believed to stem from
a more representative training set. As mentioned above in this section
(section 2.1.3), peptide signal response differs between instruments
and acquisition types. PREGO, being trained on a DIA dataset, may
perform better because peptide signals in DIA datasets better
represent peptide signals in SRM datasets. An important note is that
these predictive algorithms mentioned above do not predict transition
signal response, only peptide response.
The final number of peptides required for a quantitative assay
depend on the analytical rigor of the experiment, the details of the
project, and the purpose. A description of these considerations and
their implications on assay development is described elsewhere.43
2.1.4 | Selection of transitions for SRM/MRM
experiments
By definition of the method, all transitions for a precursor are
measured for a PRM experiment, and therefore, PRM experiments
do not require selection of fragments prior to acquisition. However,
SRM/MRM experiments target only the transitions pre-programmed
for acquisition. Selection of optimal transitions is critical for quantita-
tive experiments, as poorly designed assays will suffer unreliable,
inaccurate, or nonspecific quantitation.44
It is common to choose y-type ion fragments, due to high ion
abundance compared to the alternative, b-type ion fragments.45 Similar
to peptide selection, transition selectionmust be evaluated for chemical
considerations, namely transition MS signal response and transition
selectivity. Transition signal response may be assessed empirically
through preliminaryMS experiments to evaluate potential transitions in
the appropriate experimental samplematrix andunder the experimental
instrument conditions. The mass spectrometrist must manually confirm
that the transitions are high-responding and free of interference, and
remove any transitions that do not meet those criteria. Alternatively,
predictive algorithms for thermodynamic peptide fragmentation46,47
may provide computationally assisted transition selection, and compu-
tational tools have been designed to aid in SRMmethoddevelopment,48
though none have been integrated with Skyline yet.
Current standard practice43monitors three ormore transitions per
peptide to make a reliable quantitation. However, statistically, if the
transition has been evaluated as high-responding and free of
interference, it is possible to perform quantitative analysis on one
transition, using the other monitored transitions for confirming the
identity of the peptide precursor.
2.2 | Retention time determination for scheduled MS
experiments
Most quantitative mass spectrometry experiments hyphenate re-
versed-phase high performance liquid chromatography (RP HPLC) to
4 | PINO ET AL.
separate and simplify complex proteomic samples. Coupling LC to MS
adds a time dimension to the data, as peptides elute off the solid-state
column at a particular time in the chromatographic gradient. As with
other modes of reversed phase chromatography, LC-MS peptide RT is
dependent on several experimental factors, such as the physiochem-
ical properties of the target peptide itself; background matrix of the
sample; column-specific details including stationary phase material,
bed length, and temperature; and the chromatography details
including gradient percentage and delivery speed.49 In the case of
liquid chromatography coupled SRM/MRMand PRMexperiments (LC-
SRM/MRM, LC-PRM) on triple-quadrupole mass spectrometers, the
number of peptide precursor-fragment transitions to bemeasuredmay
exceed the speed at which the instrument can measure them and still
maintain a cycle time appropriate for quantification (2-3 sec per cycle
maximum). In these cases, “scheduling”methods enablemeasurements
of tens to hundreds of individual peptides, by allowing only a subset of
the targeted peptides to be measured in any given cycle. The
acquisition schedule for these methods includes precursor m/z,
transition m/z, and the RT, or time window during which the precursor
peptide elutes off the LC column.
Skyline’s ecosystem incorporates several complementary tools to
predict peptide RT. The first, SSRCalc,50,51 is based on calculated
hydrophobicity, as determined from the peptide amino acid sequence,
to predict a peptide RT. This approach is particularly useful when
empirical RT is unknown for a peptide. Alternatively, when peptide RT
has been previously observed, a standard set of reference peptides can
be used to calibrate RT prediction for any number of target peptides of
interest on new columns or chromatography methods. In this
approach, termed indexed retention time (iRT),52 the reference
peptides act as anchor points across a range of hydrophobicities,
allowing the HPLC run-time to be calibrated and the assay-specific
peptides to be aligned to the observed iRT reference peptide anchors.
The iRT method is particularly useful in interlaboratory and large-scale
experiments, projects which typically necessitate use of multiple LC
systems and columns. For these projects, the iRT workflow integrated
into Skyline provides a simple method to transfer chromatography
empirical knowledge fromone system to another, or to easily transition
to a new column when the previous is replaced.
After predicting peptide RT through either method, or simply by
using prior measurements that have already been imported, Skyline
can export an acquisition table including all relevant information for a
scheduled LC-SRM/MRM or LC-PRM method, including start and end
times for peptide elution. The priority for these experiments is to
capture the entirety of the chromatogram peak as the peptide elutes
from the column, but with as narrow a window as possible. The mass
spectrometer is limited in the number of peptide precursors it can
measure at any given time, as dictated by the speed of the instrument
(duty cycle), and the number of transitions to measure at that time, as
dictated by predicted RT and thewidth of the scheduling timewindow.
In order to assay as many peptides as possible, it is necessary to adjust
the scheduling windows to reflect the instrument’s speed and the
number of transitions eluting at each time point. Skyline facilitates this
adjustment with a visualization option in the retention time pane that
displays the number of transitions eluting over the chromatographic
gradient under several potential scheduling window widths.
2.3 | Instrument parameter optimization
Determining the optimal set of MS instrument parameters for a
targeted experiment is necessary in order to create an effective assay.
One parameter of particular importance to targeted experiments is
collision energy (CE). Optimized CE increases fragment ion intensity,
which confers stronger, more reliable signal response.53 Computa-
tional estimation of optimal CE based on precursor m/z and a simple
linear equation (Equation 1) is useful for both triple quadrupole54 and
quadrupole time-of-flight instruments.30,55 An automated pipeline for
optimizing CE specifically for quantitative assays is integrated in
Skyline to achieve maximum fragment ion intensity,56 and therefore,
strongest, most reliable signal response for the peptides in the assay.
Recent versions have added the ability to store optimized parameter
values in a library for future re-use and easier sharing.
Equation 1 Generalized equation for predicting optimal collision
energy.
Collision energy ¼ k precursor mz
� �
þ b
2.4 | MS/MS spectral library creation
Although not strictly required for assay development, inclusion of
spectral libraries in quantitative proteomics aids in downstream data
processing. In spectral library searching, spectra acquired by tandem
mass spectrometry (MS/MS) are compared with previously identified
reference spectra.57 The benefits to library searching as opposed to
database searching, in which spectra are compared with spectra
predicted from amino acid sequences,58 is amore accurate comparison
of fragment ion intensities and a more efficient spectra search.
The Skyline ecosystem includes a suite of software tools,
Bibliospec,59 for creating and searching MS/MS peptide spectrum
libraries. The Bibliospec 2.0 software package is composed of two
informatics tools: BlibBuild and BlibFilter. All Skyline installations
include these tools, and Skyline itself provides user interface for
creating spectral libraries. The first step in building a spectral library is
creating a full redundant library of peptide MS/MS spectra matched
with known peptide identifications, which is performed computation-
ally by BlibBuild and written to sqlite3 database file. To obtain peptide
identifications for this step, an assortment of available database search
programs are supported by BiblioSpec 2.0 (Table 2). Second, BlibFilter
refines the redundant library to choose just one representative
spectrum for each peptide, preserving the original retention times of
the redundant spectra, and then writes a new non-redundant sqlite3
database containing this information. BlibFilter choses the one
representative spectrum by measuring the similarity between all pairs
of redundant spectra for a given peptide, and selecting the spectrum
with the highest average similarity score.
The Skyline GUI also supportsMS/MS spectral library creation. To
do so, it takes the best scoring PSM from a variety of supported search
engines (Table 2) as a reference spectrum, picking the most intense in
PINO ET AL. | 5
the event of a tie. In addition to creation of spectral libraries, Skyline
supports several sources of reference libraries, including Peptide
Atlas,34 theNational Institute of Standards and Technology (NIST), and
the Global ProteomeMachine (GPM).36Most Skyline users will choose
to use their spectral libraries, once created, for targeted method
creation and data extraction.
2.5 | Skyline for small molecule research
Although this review is focused on the Skyline ecosystem for
quantitative proteomics, the ecosystem also works for generalized
small molecules,25 such as lipidomics, glycomics, and metabolomics.
While some functions do not yet work for non-proteomic data, online
tutorials detailing with how to make use of the Skyline ecosystem for
small molecule research, including assay development, are available
on-line with the Skyline software documentation.
Generally, the Skyline informatics for small molecule assay develop-
mentmirrors that proteomic experiments described above (section2.4). A
notable difference, however, is the way Skyline treats ionization. For
proteomics data, typically only sequence and charge state are required to
describe a charged peptide. As such, Skyline assumes ionization by
protonation, the most typical ionization for these experiments. Ionization
of smallmolecules occurs throughmanymeans, including sodiumaddition
and hydrogen loss. Therefore, Skyline’s informatics work best with
manually entered charges states and either generalized ion formulas or
manually entered m/z values for precursors and products.
2.6 | Isolation window determination for DIA
experiments
Unlike targeted experiments, DIA experiments do not require selection
of proteins, peptides, or transitions prior to acquisition. There are
TABLE 2 Peptide spectrum matching pipelines supported by Skyline with BiblioSpec for spectral library-building
Peptide spectrum matching
pipeline Type Creator Peptide ID file Spectrum file
Mascot Proprietary Matrix Science83 .dat
ByOnic Proprietary Protein Metrics, Inc.84 .mzid .MGF, .mzXML,
.mzML
Comet/SEQUEST/Percolator Open
source
Dept. Genome Sciences, University of
Washington58,85,86.perc.xml (.sqt) .cms2, .ms2
ID Picker (Myrimatch) Open
source
MSRC Bioinformatics, Vanderbilt University87 .idpXML .mzXML, .mzML
MaxQuant Andromeda Freeware Max Planck Institute88 msms.txt
Morpheus Open
source
Coon lab, University of Wisconsin-Madison89 .pep.xml, .pep.XML,
.pepXML
.mzXML, .mzML
MS-GF+ Freeware Pevzner lab, UCSD90 .mzid, .pepXML .MGF, .mzXML,
.mzML
OMSSA Open
source
NCBI91 .pep.xml, .pep.XML,
.pepXML
.mzXML, .mzML
PEAKS DB Proprietary Bioinformatics Solutions, Inc.92 .pep.xml, .pep.XML,
.pepXML
.mzXML, .mzML
Proteomics Identifications
(PRIDE)
EMBL-EBI93 .pride.xml
Protein Pilot Proprietary SCIEX94 .group.xml
Protein Prospector Open
source
UCSF mass spectrometry facility95 pepXML/mzXML
Proteome Discoverer Proprietary Thermo .msf
Scaffold Proprietary Proteome Software96 .mzid .MGF, .mzXML,
.mzML
Spectrum Mill Proprietary Agilent .pep.xml, .pep.XML,
.pepXML
.mzXML, .mzML
Trans-Proteomic Pipeline (TPP) Open
source
Aebersold lab, Institute for Systems Biology97 pepXML/mzXML
X! Tandem Open
source
Global Proteome Machine Organization98 .xtan.xml
ProteinLynx Global SERVER
(PLGS)—MSeProprietary Waters final_fragment.csv
Custom .ssl
6 | PINO ET AL.
multiple data collection strategies for DIA experiments with associated
advantages and disadvantages that have been evaluated elsewhere.14
The most basic method used with Skyline60 acquires MS and MS/MS
data for all molecular species between a certain predefined precursor
m/z range in specified fragment m/z isolation windows. Determining
the most appropriate MS/MS isolation scheme requires consideration
of the particular instrument’s scan rate, resolving power, dynamic
range, and sensitivity of the mass analyzer.61 For many DIA experi-
ments analyzedwith Skyline, our labmonitors a precursorm/z range of
500-900m/z as this m/z range reflects most proteotypic peptides.
Restricting the total range can allow for smaller, more selective
precursor isolation windows or shorter cycle times. Skyline is
extremely flexible and currently supports all commonly used isolation
schemes.
For the precursor m/z isolation scheme, window placement is
calculated one of two ways: integer or optimized. Simple arithmetic
division is used for integer window placement. For example, a 20
window isolation schemewith eachwindowcovering 5m/z (20 × 5) for
a 500-600m/z range are placed at 500-505m/z, 505-510m/z, etc.
This method requires a margin (usually 0.5m/z) added to the
instrument method but ignored during extraction, for example,
499.5-505.5 m/z, 504.5-510.5 m/z, etc. Alternatively, optimized
window placement considers peptide mass distribution and calculates
isolation windows that encompass “allowable regions.”62 By placing
window edges at “forbidden zones” where peptide masses do not
occur and windows over “allowable regions,” the resulting window
width and position is optimized for m/z ranges where peptides are
most likely occur. This algorithm for calculating optimized isolation
window placement is integrated into Skyline, facilitating quick
generation of isolation lists for DIA methods.
2.7 | Final method export and refinement
Once a Skyline document is built with the settings and optimizations
described above (section 2), the final developed assay is exported
either as a native method for triple quadrupole instruments or as
scheduled isolation lists for certain Q-TOF and the ThermoQ-Exactive
instruments. After acquiring mass spectrometry data, the acquisition
files are imported into the Skyline document for method refinement
such as peptide and transition validation. The cycle of export,
acquisition, and refinement is repeated until the assay is considered
effective, at which point final acquisition and quantitative analysis
begins.
3 | DATA PROCESSING: PEAK DETECTION
AND INTEGRATION
Skyline’s targeted data analysis strategy begins when the researcher
selects raw mass spectrometer acquisition files to import. Skyline
derives information from the native, vendor-specific file formats or
from portable files like mzXML63 or mzML and caches the information
into a single, high-performance data file. The caching step is critical to
Skyline’s ability to quickly load large experiments with many data files,
allowing researchers to process multiple MS runs at the same time.
Skyline handles files sequentially or in parallel, performing the
operations described below on each data file. The end result of
Skyline’s data processing is a calculated peak area, or area under the
curve (AUC), for each peptide ion (modified peptide plus charge state)
in the Skyline Target list, visualizations of the data, and cached
chromatogram information for quick recall.
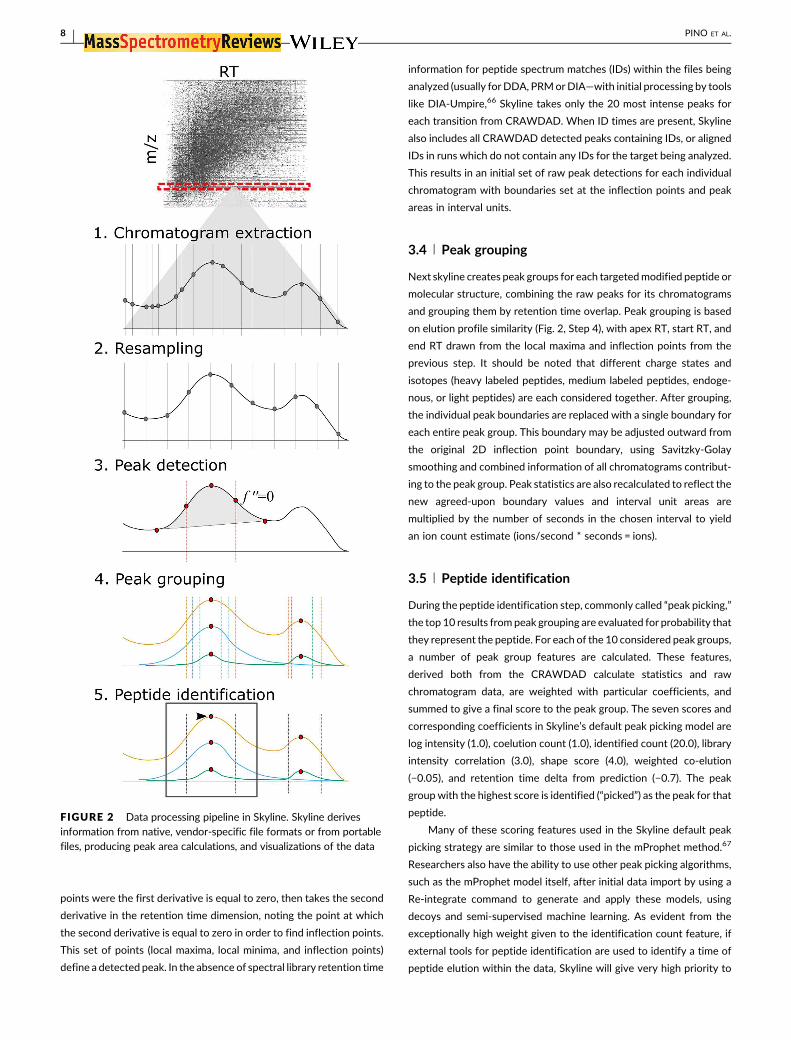
3.1 | Chromatogram extraction
Mass spectrometry data contains three dimensions: m/z, retention time,
and intensity. In the first step of data processing, Skyline extracts the
retention time and intensity information for a given m/z (Fig. 2, Step 1).
For PRM or DIA experiments, this information is calculated from the
measured spectra as extracted-ion chromatograms (XIC), and for SRM/
MRM experiments, the measured chromatograms are themselves
imported. No file conversion is necessary prior to this step; raw files
from the instrument are directly imported. It should be noted, however,
that several settings in Skyline affect the chromatogram extraction
process, such as retention time window width and parameters for
instrument resolving power for profile spectra or mass accuracy for
centroided spectra, therefore, researchers shouldbe sure that theSkyline
document is preparedwith the appropriate instrument and experimental
details before importing data. These settings can be exported and
imported from other Skyline documents, aiding repeatability in data
processing and ensuring the proper instrument and experimental details
are preserved across laboratory sites and experiments.
3.2 | Resampling
For all tandem mass spectrometry data acquisition types, the
time intervals between MS2 scans are irregular. For example, in an
SRM/MRMexperiment, the rate ofMS2 scans depends on the number
of transitions scheduled for collection at a given time and the dwell
time for each. For its purposes, Skyline requires all chromatogram time,
intensity points for a peptide to be placed on a uniform scale with a
consistent interval. Even for DIA, this requires some adjustment of
MS1 with MS2 scans and ions for multiple charge states or isotope
labeling. To place these points, a linear interpolation of each raw
chromatogram is performed. Skyline calculates an interval that
captures as much information about the peak as possible (Fig. 2,
Step 3). Intervals placed too wide distort the shape of the peak, while
intervals too narrow are costly in storage and processing time. The end
product of resampling is an interval width that works best for the
dataset, avoiding as much distortion as possible.
3.3 | Peak detection
The resampled data are then searched for areas that represent peaks.
Peak detection is performed by the Chromatogram Retention time
Alignment andWarping for Differential Analysis of Data (CRAWDAD)
Peaks algorithm.64,65 CRAWDAD finds the maxima and minima by
PINO ET AL. | 7
points were the first derivative is equal to zero, then takes the second
derivative in the retention time dimension, noting the point at which
the second derivative is equal to zero in order to find inflection points.
This set of points (local maxima, local minima, and inflection points)
define a detected peak. In the absence of spectral library retention time
information for peptide spectrum matches (IDs) within the files being
analyzed (usually forDDA, PRMorDIA—with initial processing by tools
like DIA-Umpire,66 Skyline takes only the 20 most intense peaks for
each transition from CRAWDAD. When ID times are present, Skyline
also includes all CRAWDAD detected peaks containing IDs, or aligned
IDs in runs which do not contain any IDs for the target being analyzed.
This results in an initial set of raw peak detections for each individual
chromatogram with boundaries set at the inflection points and peak
areas in interval units.
3.4 | Peak grouping
Next skyline creates peak groups for each targetedmodified peptide or
molecular structure, combining the raw peaks for its chromatograms
and grouping them by retention time overlap. Peak grouping is based
on elution profile similarity (Fig. 2, Step 4), with apex RT, start RT, and
end RT drawn from the local maxima and inflection points from the
previous step. It should be noted that different charge states and
isotopes (heavy labeled peptides, medium labeled peptides, endoge-
nous, or light peptides) are each considered together. After grouping,
the individual peak boundaries are replaced with a single boundary for
each entire peak group. This boundary may be adjusted outward from
the original 2D inflection point boundary, using Savitzky-Golay
smoothing and combined information of all chromatograms contribut-
ing to the peak group. Peak statistics are also recalculated to reflect the
new agreed-upon boundary values and interval unit areas are
multiplied by the number of seconds in the chosen interval to yield
an ion count estimate (ions/second * seconds = ions).
3.5 | Peptide identification
During the peptide identification step, commonly called “peak picking,”
the top 10 results frompeak grouping are evaluated for probability that
they represent the peptide. For each of the 10 considered peak groups,
a number of peak group features are calculated. These features,
derived both from the CRAWDAD calculate statistics and raw
chromatogram data, are weighted with particular coefficients, and
summed to give a final score to the peak group. The seven scores and
corresponding coefficients in Skyline’s default peak picking model are
log intensity (1.0), coelution count (1.0), identified count (20.0), library
intensity correlation (3.0), shape score (4.0), weighted co-elution
(−0.05), and retention time delta from prediction (−0.7). The peak
groupwith the highest score is identified (“picked”) as the peak for that
peptide.
Many of these scoring features used in the Skyline default peak
picking strategy are similar to those used in the mProphet method.67
Researchers also have the ability to use other peak picking algorithms,
such as the mProphet model itself, after initial data import by using a
Re-integrate command to generate and apply these models, using
decoys and semi-supervised machine learning. As evident from the
exceptionally high weight given to the identification count feature, if
external tools for peptide identification are used to identify a time of
peptide elution within the data, Skyline will give very high priority to
FIGURE 2 Data processing pipeline in Skyline. Skyline derives
information from native, vendor-specific file formats or from portable
files, producing peak area calculations, and visualizations of the data
8 | PINO ET AL.
finding a peak at that time, using retention time alignment between
runs to propagate ID times between runs.
3.6 | Peak area calculation
In Skyline, the peak area, or area under the curve (AUC), refers to the
total integrated area within the peak boundaries, minus the
background area (in intensity for seconds of time units—or ion count
where intensity is ions per second). Background area is defined as the
total integrated area of the minimum of background height and
intensity at each point, where background height is the minimum
intensity of the two points where the chromatogram crosses the
integration boundaries, which is assumed to be the level of intensity
contributed not by the transitions themselves but from chemical noise
(background) in the measurement. The background area is subtracted
from the total integrated area within the peak boundaries to return the
final reported peak area. Although Skyline allows display of chromato-
grams with various smoothing options (2D, 1D, Savitzky-Golay)
applied, it uses the interpolated points displayed in the unsmoothed
graphs to calculate peak area. Total area values sum the AUC values of
individual chromatograms, rather than performing a separate AUC
calculation on a summed chromatogram.
4 | CORE ANALYSES AND VISUALIZATIONS
Once raw acquisitions are processed, Skyline creates visual displays of
the data. Chromatograms for each peptide in the Skyline document are
displayed with visualizations of the boundaries and indicators for the
retention time and dot product of each picked peak. Retention times
for the top 10 peaks detected in the RT window are also shown,
allowing researchers to see other candidates that were considered in
peak picking.
4.1 | Data curation and quality assessment
Visualizations in Skyline allow researchers to quickly identify issues in
data, explore causes, and evaluate solutions to resolve the issues. One
common example of this functionality of data visualization in Skyline is
“peak picking.” Although automated peak detection and boundary
setting are generally reliable, it is important to manually curate data to
ensure reliable quantification.68Here, Skyline’s visualizations facilitate
determination ofwhich peptides can be robustlymeasured in a specific
target matrix, which transitions for a peptide are the best transitions
for the measurable peptides, and whether a given peak actually
measures the peptide of interest. The picked peak is marked by a solid
black arrowhead in Skyline’s chromatogram window (Fig. 3A). Evalua-
tion of peptide identification (“peak picking”) is computationally aided
by display of iRT-predicted RT, relative transition intensities compared
to library intensities. Dot product values are calculated,69,70 correlating
peak intensities of the transitions with the library spectrum for that
peptide (dotp), between precursor isotope peak intensities and
expected isotope distribution (idotp), between analyte peak intensities
and matching isotope labeled reference peptides (rdotp), to establish a
measure of confidence in peak detection.30,71Peak boundaries are also
displayed as dashed vertical lines, shown in Fig. 3A, and researchers are
able to adjust the boundaries as they deem appropriate. Skyline
recalculates peak statistics, including peak area integration, with the
new manually-revised boundaries or peak picking.
Critically for quantification, Skyline allows convenient evaluation
of transitions. Skyline gives the option to display for each peptide all
transitions included in the document, precursors-only (M, M + 1,
M + 2, etc.), products-only, a single transition, or a total ion
chromatogram, summing all transitions, for each precursor. The
individual fragments measured for a peptide are visualized as
different colored chromatograms (Fig. 3A). The ability to simply
delete or add transitions for a peptide precursor in the Target
window, and easily undo such changes, lets researchers visually
evaluate transitions for characteristics such as intensity, co-elution
with interference, shouldering, and other qualities undesirable for
accurate, robust quantification. For MRM experiments with heavy-
paired peptide targets, the Automated Detection of Inaccurate and
Imprecise Transitions in Peptide Quantification (AuDIT) algorithm72
employed by the Skyline External Tool QuaSAR automatically
suggests transitions for removal based on similar criteria. In addition
to the chromatogram view, clicking on a chromatogram opens a Full-
Scan view of normal 2D spectra (intensity by m/z).
4.2 | Native, real-time updating visualizations
Statistics for data are shown as visual graphs in embeddable live plot
windows. Statistics include plots of retention time, peak area, mass
error, and group comparisons. The retention time display is user-
defined to show a floating column chart by replicate or peptide, a linear
regression plot of the peptide elution times by SSRCalc or iRT score, or
a scheduling window with the number of expected transitions over
time for multiple scheduling window widths. Retention time data can
be plotted by Replicate Comparison or Peptide Comparison, allowing
researchers to evaluate various aspects of their data. Specifically,
replicate comparisons can be sorted as they are in the document or by
acquired time helping tomake the impact of instrument run ordermore
easily understood. For example, when the retention times are
displayed as Replicate Comparison for an experiment, it is clear if a
particular run deviates significantly from others (Fig. 3C), which may
indicate a potentially mis-picked peak. Options for display of peak
areas allow the researcher to specify between displaying a bar chart of
total peak areas, peak areas normalized to heavy peptide isotope pairs,
user-specified global standards (Fig. 3D), maximums, or the total peak
area; or to view bar graphs of coefficient of variance (CV) (Fig. 3B).
Similar to notably deviating retention time values, an outlying peak
area may prompt a researcher to visually examine that replicate or
peptide.
In addition to retention time and peak area data, mass error graphs
are available for inspecting mass error summary information. Mass
error is calculated in Skyline as a weightedmean of themass error in all
the integrated points across the annotated chromatogram. When
PINO ET AL. | 9
visualized as a Replicate Comparison, this data are helpful for detecting
interference at the transition level. As a Peptide Comparison,
researchers may sort by mass error to get an overview of all targeted
peptides. Unique to the mass error visualization options are a
histogram (for display of mass error at the full document scope or
each replicate for detecting calibration issues and a 2D histogram with
m/z and retention time dimensions available for increased visibility of
instrument calibration issues.
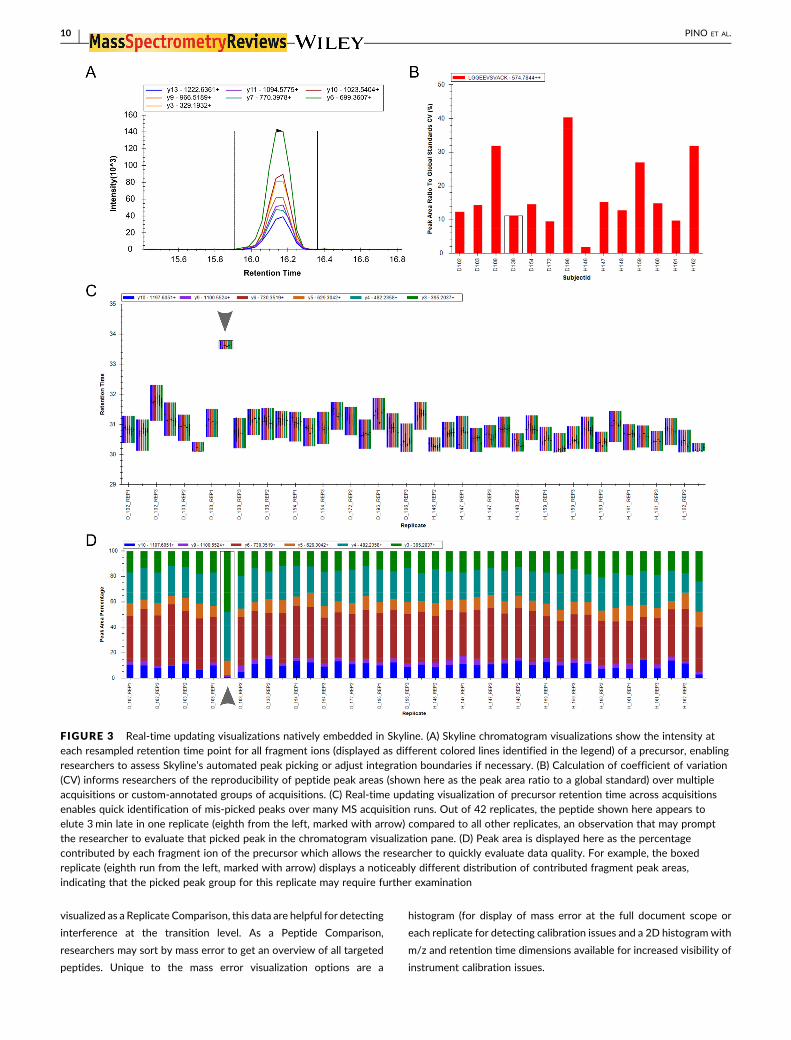
FIGURE 3 Real-time updating visualizations natively embedded in Skyline. (A) Skyline chromatogram visualizations show the intensity at
each resampled retention time point for all fragment ions (displayed as different colored lines identified in the legend) of a precursor, enabling
researchers to assess Skyline’s automated peak picking or adjust integration boundaries if necessary. (B) Calculation of coefficient of variation
(CV) informs researchers of the reproducibility of peptide peak areas (shown here as the peak area ratio to a global standard) over multiple
acquisitions or custom-annotated groups of acquisitions. (C) Real-time updating visualization of precursor retention time across acquisitions
enables quick identification of mis-picked peaks over many MS acquisition runs. Out of 42 replicates, the peptide shown here appears to
elute 3min late in one replicate (eighth from the left, marked with arrow) compared to all other replicates, an observation that may prompt
the researcher to evaluate that picked peak in the chromatogram visualization pane. (D) Peak area is displayed here as the percentage
contributed by each fragment ion of the precursor which allows the researcher to quickly evaluate data quality. For example, the boxed
replicate (eighth run from the left, marked with arrow) displays a noticeably different distribution of contributed fragment peak areas,
indicating that the picked peak group for this replicate may require further examination
10 | PINO ET AL.
For instances where displaying data in the form of Replicate or
Peptide Comparison is inadequate, Skyline offers options for
grouping and ordering of peptides by a number of characteristics,
including custom annotations that researchers can add based on
experimental details or sample characteristics. The Group Com-
parisons feature natively calculates differential statistics for
proteins in a table or graph view within Skyline. For many
proteomics studies, correcting for multiple hypothesis testing is
required. To calculate statistically significant differential expres-
sion, Group Comparisons employs a user-specified cut-off for the
Benjamini-Hochberg adjusted P-value to account for false discov-
ery rate.73
In experiments where absolute quantification of the analyte target
is necessary, Skyline allows for internal single point calibration to a
reference and also multiple point calibration curves via the Calibration
Curve feature. The Calibration Curve feature works with data from a
dilution series of isotope-labeled reference peptides. This external
calibration curve is used to regress the known concentration of each
reference peptide target against the intensitymeasured for that target,
allowing conversion of intensity measurements into absolute quanti-
tative values. Although this method requires multiple injections to
gather the external calibration curve data, the Calibration Curve
feature accounts for linear peptide responses that have nonstandard
slopes or intercepts. At this time, the feature provides conversion of
measured intensity values to absolute quantitation values like
concentration, not for determining limits of detection or limits of
quantitation.
4.3 | Skyline informatics considerations for ion
mobility spectrometry
In experiments involving gas-phase ion mobility spectrometry (IMS)
separations in place of or hyphenated with LC, the additional
dimension of drift-time is introduced to the data.74 For these
datasets, as a single LC RT has multiple associated drift-times,
Skyline considers drift-time data in processing, allowing chromato-
gram extraction to be limited to specified drift time ranges, and
visualization. Spectra from which chromatogram points are
extracted can be visualized in a 3D heat map plot (intensity by
m/z and drift time), displayed when the chromatogram is clicked
on. As fragments have the same drift-time as their precursor
(potentially slightly offset by a constant fragmentation factor) a
drift time value and extraction range allow Skyline to ignore signal
outside a targeted drift range, improving selectivity. Skyline’s
incorporation of IMS considerations and continuing optimization of
IMS informatics holds promise for analysis of large, multi-
dimensional datasets involving IMS.
5 | ADDITIONAL ANALYSES: EXTERNAL
TOOLS
5.1 | Goals for external tools
One distinguishing aspect of the Skyline ecosystem is the ability for
researchers to contribute their data processing software packages
through the external tools framework.23 Through this framework,
researchers can conveniently and quickly distribute their programs
to the community. The ultimate goal is to provide a common,
convenient hub that connects the data found in a Skyline document
with the community’s many informatics methods. Although Skyline
itself is built from the C# programming language, the installable tools
framework includes extra support for tools using the R or Python
programming languages. To date, nine external tools from commu-
nity researchers are integrated in the Skyline ecosystem with
applications ranging from assay development to biological inference
(Table 3).
TABLE 3 Community-built informatics tools integrated into the Skyline ecosystem
Tool Creator Integration date Purpose
Biodiversity
plugin
Computational Proteomics Group, Pacific
Northwest National Laboratory16Jun 10 2015 Mass spectrometry data retrieval by organism and biological
pathway
MPPReport Agilent Technologies Sep 9 2014 Data export for use in Agilent’s Mass Profiler Professional
multivariate statistics software
MS1Probe Gibson Lab, The Buck Institute for
Research on Aging17Apr 16 2014 High throughput statistical quantification of MS1 Filtering
datasets
MSstats Vitek Lab, Purdue University77 Jul 30 2015 Statistical relative quantification of proteins and peptides in
global, targeted, and data-independent proteomics
Population
Variation
Computational Proteomics Group, Pacific
Northwest National Laboratory31Dec 20 2013 Protein variant lookup from dbSNP and the 1000 Genome
project
Prego MacCoss lab, University of Washington42 Jun 23 2015 Peptide SRM response prediction
Protter Wollscheid Lab, ETH Zurich80 Dec 19 2015 Transmembrane protein topology visualization
QuaSAR Carr Lab, Broad Institute of MIT and
Harvard78Oct 23 2014 QC, statistical analysis, and visualization of data from
quantitative MRM-MS
SProCoP Bereman Lab, North Carolina State
University76Dec 3 2014 Visualization, detection, and identification of assignable causes
of variation in LC-MS
PINO ET AL. | 11
5.2 | External tools for assay development
Generating a specific hypothesis for a quantitative MS experiment
often begins with prior knowledge from previous proteomics experi-
ments. The Biodiversity Library Plugin75 enables fast, convenient
survey, and retrieval of existing proteomics data for an organism and
biological pathway of interest. Researchers can query spectra for over
3 million peptides and 230 000 proteins, annotated with KEGG
pathways, from118 organisms. These functionalities allow researchers
to quickly compile a list of potential assay proteins on the basis of a
biological function.
As mentioned in the computationally assisted assay development
section, selecting target peptides for an SRM/MRM or PRM poses a
significant challenge. One such challenge in clinical applications is
natural genetic variation, which may confound MS experiments that
attempt to measure a specific protein. The Population Variation
external tool31 enables researchers to explore possible variants for
their protein of interest by surveying the dbSNP and 1000 Genome
project for mutations. The PREGO external tool42 is an algorithm that
ranks peptides by their predicted response level, intended to facilitate
the selection of peptides that will produce the most intense MS signal.
5.3 | External tools for acquisition monitoring
It is necessary to control for LC-MS performance variations during
acquisition in order to ensure accurate, reproducible measurements.
Aspects such as retention time, chromatographic peak width, mass
measurement, and ion intensity all influence the robustness of an assay
and are affected run to run by minor, necessary adjustments like
column changing. The external tool Statistical Process Control in
Proteomics (SProCoP)76 allows for semi-automated real time evalua-
tion of an assay, including both chromatographic and mass spectro-
metric performance. SProCop assesses metrics such as retention time
reproducibility, peak asymmetry, targeted peptide ion intensity, and
mass measurement accuracy, constructing control charts and boxplots
that a researcher monitors throughout the lifetime of an experiment to
ensure reproducibility between LC-MS runs.
5.4 | External tools for quantitative statistical
analysis
The experimental workflow used to generate samples for mass
spectrometry each require specialized data analysis strategies. The
combination of sample generation method (labeled vs label-free) and
the spectral acquisition method (DDA, SRM/MRM and PRM, or DIA)
require different informatics approaches. The external tool MSstats77
considers these data properties to calculate the relative quantification
of proteins and peptides. MSstats begins with data processing and
visualization of the identified and quantified spectral peaks. It then
performs statistical modeling and inference using linear mixed models,
customized to the method of sample generation and MS acquisition.
Finally, researchers can specify a particular statistical power for their
experiment, andMSstats determines the minimal number of replicates
required to achieve that statistical power by considering the dataset as
a pilot experiment.
Other external tools are designed for use with specific acquisition
methods. For DDA analyses, an MS1 filtering approach through the
external tool MS1Probe17 enables high throughput statistical quanti-
fication of peptide analytes. The external tool QuaSAR78 produces
figures of merit (limit of detection, LOD; limit of quantitation, LOQ) for
statistical characterization of stable isotope dilution MRM-MS assays
(SID-MRM-MS) generated with heavy labeled stable-isotope peptide
standards. Within the QuaSAR external tool, AuDIT72 performs
automated filtering of transition validation, improving sensitivity,
and specificity for peptide quantitation by SID-MRM-MS. For label-
free quantitativeDIA analyses, Skyline exported custom reports can be
used to optimize fragment selection and detect interferences using the
nonoutlier fragment ion (NOFI) ranking algorithm.79
In addition to the tools described in this section (section 5.3),
Skyline also enables the export of results for analysis in other software
suites. TheMPPReport tool, for example, creates a results file designed
for import into Agilent’s Mass Profiler Professional multivariate
statistics software package. Researchers can create their own custom
reports with a wide range of values to view, edit, and export. Exported
custom reports enable researchers to perform their own statistical
analyses in Excel, R, Matlab, Java, C++, and other languages, and
formats of custom reports can be saved as templates to share and re-
use in future analyses.
5.5 | External tools for biological inference
The ultimate goal of many MS proteomics experiments is deriving
biological information. Toward this end, researchers have developed
several tools to facilitate the visualization and biological importance of
peptide and protein measurements. The external tool Protter80
combines known annotations of protein structure and function with
experimental MS data to give researchers an interactive visualization
of protein topology. Protter is especially powerful for visualization of
membrane protein topology.
6 | METHODS AND RESULTS SHARING
Skyline, being designed for the mass spectrometry proteomics
community, is ideal for interlaboratory collaborations and experimen-
tal results comparisons in a vendor-neutral manner. With these types
of collaborations in mind, the Skyline ecosystem grew to include
storage and sharing applications.
6.1 | Panorama and CHORUS projects for raw and
Skyline file storage and sharing
Panorama,24 a web-based application for storing, sharing, analyzing,
and reusing targeted Skyline assays, allows laboratories to communi-
cate the details for replicating or reproducing targeted Skyline
experiments. To this end, during the development of Panorama,
12 | PINO ET AL.
data integrity, security, and scalability were stressed. Storing Skyline
documents in Panorama does not confer any loss of information and
data can be made public or kept private at the discretion of the
researcher.
It is possible to automate entire informatics pipelines, from
acquisition to Panorama publishing, using the command-line version of
Skyline, called SkylineRunner. An exemplary case of informatics
automation is AutoQC, a completely automated pipeline designed to
monitor system suitability in bottom-up proteomics.81 As a mass
spectrometer runs, AutoQC imports quality control acquisitions into
Skyline, extracts multiple identification-free metrics, and uploads the
data to a Panorama Skyline document repository. Users can view
system suitability metrics in the web-based interface, including Levey-
Jennings and Pareto plots.
In addition to the Panorama module, the CHORUS platform was
developed to provide storage, analysis, and sharing function for raw
mass spectrometry files with a simple user interface. When raw data
are placed into CHORUS, it is uploaded to the Amazon Web Services
(AWS) cloud and translated into a distributed data structure. By
utilizing AWS cloud computing and the unique distributed file format,
accessing DIA data remotely from CHORUS is faster than from the
local hard drive. When researchers wish to request data from the
cloud, Skyline requests the extracted ion chromatograms, CHORUS
generates the chromatograms, and then returns a Skyline cache. In
addition to this scalable data access and remote extraction of
chromatograms, CHORUS also provides a browser-based vendor-
neutral spectrum and chromatogram viewer, integrated protein
database searching and quantitative analysis tools. CHORUS is
intended to facilitate community-driven mass spectrometry proteo-
mics, and is therefore a not-for-profit public/private partnership.
6.2 | CPTAC: An exemplary use case scenario
The Clinical Proteomic Technologies Assessment for Cancer (CPTAC)
program82 exemplifies the strengths of Skyline formethods and results
sharing in large, multi-site collaborations. As part of the CPTAC efforts
to improve cancer diagnosis, treatment, and prevention with LC-
MRM-MS methodologies, the Skyline ecosystem has been utilized to
develop targeted proteomics assays that are precise, accurate,
reproducible, and transferable between laboratories, across expertise
levels, and over instrument platforms. CPTAC scientists utilized the
Skyline ecosystem for computationally assisted methods develop-
ment, taking ease of simple transition evaluation, retention time
scheduling, and method export. Additionally, because Skyline’s
analysis pipeline is instrument-independent, the CPTAC researchers
were able to integrate data across LC-MS platforms. Further,
informatics tools developed by the CPTAC team to quantitatively
analyze the data, namely QuaSAR, have been integrated into the
Skyline ecosystem as external tools. From assay development to
quantitative data analysis, the Skyline ecosystem helped to enable
scientists of the CPTAC consortium accomplish their goals for a robust,
sensitive absolute quantification assay across laboratory sites,
instrument platforms, and operators.
7 | PERSPECTIVES
The Skyline informatics ecosystem described here has become a
powerful tool in the quantitative measurement and analysis of
peptides by mass spectrometry. Skyline’s generalized, vendor-neutral
design provides the base for an informatics toolkit that expands to fit
the needs of the community. As new needs arise from the community,
Skyline frequently releases software developments in the form
updates for Skyline-daily, the beta release version of Skyline. Areas
of orthogonal interest such as small molecule research, analytical
methods for rigorous quantitation, and statistical techniques are
inspiring new Skyline developments. Important future goals are
adapting Skyline’s informatics for big data mass spectrometry
proteomics through parallelization of file processing. These develop-
ments will be vital in obtaining the robust, sensitive quantitative
measurements required to better understand the systems biology of
cells, organisms, and disease states.
ACKNOWLEDGMENTS
We thank the members of the MacCoss laboratory and Skyline team,
especially Nat Brace, Brian Pratt, and Nicholas Shulman, for helpful
discussion of manuscript material. This work was supported in part by
National Institutes of Health Grants R01 GM103551, R01 GM121696,
P41 GM103533, U54 HG008097, R21 CA192983, and P30 AG013280.
Additionally LKP acknowledges training support provided by T32
HG000035 and F31AG055257; BCSwas supported by F31GM119273.
REFERENCES
1. Consortium, International Human Genome Sequencing. Initial se-
quencing and analysis of the human genome. Nature. 2001;409:
860–921.
2. Venter JC, Adams MD, Myers EW, et al. The sequence of the human
genome. Science. 2001;291:1304–1351.
3. Consortium, International Human Genome Sequencing. Finishing the
euchromatic sequence of the human genome. Nature. 2005;50:
162–168.
4. Lander ES. Initial impact of the sequencing of the human genome.
Nature. 2011;470:187–197.
5. Greenbaum D, Colangelo C, Williams K, Gerstein M. Comparing
protein abundance and mRNA expression levels on a eenomic scale.
Genome Biol. 2003;4:117.
6. Schrimpf SP, Weiss M, Reiter L, et al. Comparative functional analysis
of the caenorhabditis elegans and drosophila melanogaster pro-
teomes. PLoS Biol. 2009;7:e48.
7. Csardi G, Franks A, Choi DS, et al. Accounting for experimental noise
reveals that mRNA levels, amplified by post-transcriptional processes,
largely determine steady-state protein levels in yeast. PLoS Genet.
2015;11:e1005206.
8. Ong SE, Mann M. Mass spectrometry-based proteomics turns
quantitative. Nat Chem Biol. 2005;1:252–262.
9. Picotti P, Aebersold R. Selected reaction monitoring-based proteo-
mics: workflows, potential, pitfalls and future directions. Nat Methods.
2012;9:555–566.
10. Zhang H, Liu Q, Zimmerman LJ, et al. Methods for peptide and protein
quantitation by liquid chromatography-multiple reaction monitoring
mass spectrometry. Mol Cell Proteomics. 2011;10:M110.006593.
PINO ET AL. | 13
11. Peterson AC, Russell JD, Bailey DJ, Westphall MS, Coon JJ. Parallel
reaction monitoring for high resolution and high mass accuracy
quantitative, targeted proteomics. Mol Cell Proteomics. 2012;11:
1475–1488.
12. Venable JD, Dong MQ, Wohlschlegel J, Dillin A, Yates JR. Automated
approach for quantitative analysis of complex peptide mixtures from
tandem mass spectra. Nat Methods. 2004;1:39–45.
13. Gillet LC, Navarro P, Tate S, et al. Targeted data extraction of the MS/
MS spectra generated by data-independent acquisition: a new
concept for consistent and accurate proteome analysis. Mol Cell
Proteomics. 2012;11:O111.016717.
14. Chapman JD, Goodlett DR, Masselon CD. Multiplexed and data-
independent tandemmass spectrometry for global proteomeprofiling.
Mass Spectrom Rev. 2014;33:452–470.
15. Bilbao A, Varesio E, Luban J, et al. Processing strategies and software
solutions for data-independent acquisition in mass spectrometry.
Proteomic. 2015;15:964–980.
16. Ting YS, Egertson JD, Payne SH, et al. Peptide-centric proteome
analysis: an alternative strategy for the analysis of tandem mass
spectrometry data. Mol Cell Proteomics. 2015;14:2301–2307.
17. Schilling B, Rardin MJ, MacLean BX, et al. Platform-independent
and label-free quantitation of proteomic data using MS1
extracted ion chromatograms in Skyline: application to protein
acetylation and phosphorylation. Mol Cell Proteomics. 2012;11:
202–214.
18. Domon B, Aebersold R. Options and considerations when selecting a
quantitative proteomics strategy. Nat Biotechnol. 2010;28:710–721.
19. Cham JA, Bianco L, Bessant C. Free computational resources for
designing selected reaction monitoring transitions. Proteomics. 2010;
10:1106–1126.
20. Colangelo CM, Lisa Chung L, CanBruceC, Kei-Hoi CheungKH. Review
of software tools for design and analysis of large scaleMRMproteomic
datasets. Methods. 2013;61:287–298.
21. Codrea MC, Jiménez CR, Heringa J, Marchiori E. Tools for
computational processing of LC-MS datasets: a user’s perspective.
Comput Methods Programs Biomed. 2007;86:281–290.
22. MacLean B, Tomazela DM, Shulman N, et al. Skyline: an open source
document editor for creating and analyzing targeted proteomics
experiments. Bioinformatics. 2010;26:966–968.
23. Broudy D, Killeen T, Choi M, et al. A framework for installable external
tools in Skyline. Bioinformatics. 2014;30:1–26.
24. Sharma V, Eckels J, Taylor GK, et al. Panorama: a targeted proteomics
knowledge base. J Proteome Res. 2014;13:4205–4210.
25. Tang X, Melissa M, Keenan MM, et al. Comprehensive profiling of
amino acid response uncovers unique methionine-deprived response
dependent on intact creatine biosynthesis. PLoS Genet. 2015;11:
e1005158.
26. Sherrod SD, Myers MV, Li M, et al. Label-free quantitation of
protein modifications by pseudo selected reaction monitoring
with internal reference peptides. J Proteome Res. 2012;11:
3467–3479.
27. Abelin JG, Patel J, Lu X, et al. Reduced-representation phosphosigna-
turesmeasured by quantitative targetedms capture cellular states and
enable large-scale comparison of drug-induced phenotypes. Mol Cell
Proteomics. 2016;15:1622–1641.
28. Anderson L, Hunter CL. Quantitative mass spectrometric multiple
reaction monitoring assays for major plasma proteins. Mol Cell
Proteomics. 2005;5:573–588.
29. Lange V, Picotti P, Domon B, Aebersold R. Selected reaction
monitoring for quantitative proteomics: a tutorial. Mol Syst Biol.
2008;4:222.
30. Prakash A, Tomazela D, Frewen B, MacLean B, Peterman S, MacCoss
MJ. Expediting the development of targeted SRM assays: using data
from shotgun proteomics to automate method development.
J Proteome Res. 2009;8:2733–2739.
31. Fujimoto GM, Matthew E, Monroe ME, et al. Accounting for
population variation in targeted proteomics. J Proteome Res. 2014;
13:321–323.
32. Kuster B, Schirle M, Mallick M, Aebersold R. Scoring proteomes with
proteotypic peptide probes. Nat Rev Mol Cell Biol. 2005;6:577–583.
33. Stergachis AB, MacLean B, Lee K, Stamatoyannopoulos JA, MacCoss
MJ. Rapid empirical discovery of optimal peptides for targeted
proteomics. Nat Methods. 2011;8:1041–1043.
34. Desiere F, Deutsch EW, King NL, et al. The peptide atlas project. Nucl
Acids Res. 2006;34:D655–D658.
35. Mathivanan S, Ahmed M, Ahn NG, et al. Human proteinpedia enables
sharing of human protein data. Nat Biotechnol. 2008;26:164–167.
36. Craig R, Cortens JP, Beavis RC. Open source system for analyzing,
validating, and storing protein identification data. J Proteome Res.
2004;3:1234–1242.
37. Jones P, Côté RG, Cho SY, et al. PRIDE: new developments and new
datasets. Nucl Acids Res. 2008;36:878–883.
38. Mallick P, Schirle M, Chen SS, et al. Computational prediction of
proteotypic peptides for quantitative proteomics. Nat Biotechnol.
2007;25:125–131.
39. Fusaro VA, Mani DR, Mesirov JP, Carr SA. Prediction of high-
responding peptides for targeted protein assays by mass spectrome-
try. Nat Biotechnol. 2009;27:190–198.
40. Eyers CE, Lawless C, Wedge DC, Lau KW, Gaskell SJ,
Hubbard SJ. CONSeQuence: prediction of reference peptides
for absolute quantitative proteomics using consensus
machine learning approaches. Mol Cell Proteomics. 2011;10:
M110.003384–M110.003384.
41. Muntel J, Boswell SA, Tang S, et al. Abundance-based classifier for the
prediction of mass spectrometric peptide detectability upon enrich-
ment (PPA). Mol Cell Proteomics. 2015;14:430–440.
42. Searle BC, Egertson JD, Bollinger J, Stergachis AB,MacCossMJ. Using
data independent acquisition to model high-responding peptides for
targeted proteomics experiments. Mol Cell Proteomics. 2015;14:
2331–2340.
43. Carr SA, Abbatiello SE, Ackermann BL, et al. Targeted peptide
measurements in biology and medicine: best practices for mass
spectrometry-based assay development using a fit-for-purpose
approach. Mol Cell Proteomics. 2014;13:907–917.
44. Ludwig C, ClaassenM, Schmidt A, Aebersold R. Estimation of absolute
protein quantities of unlabeled samples by selected reaction
monitoring mass spectrometry. Mol Cell Proteomics. 2012;11:
M111.013987–M111.013987.
45. Holstein CA, Gafken PR, Martin DB. Collision energy optimization of
B- and Y-Ions for multiple reaction monitoring mass spectrometry.
J Proteome Res. 2011;10:231–240.
46. Zhang Z. Prediction of low-energy collision-induced dissociation
spectra of peptides. Anal Chem. 2004;76:3908–3922.
47. Zhang Z. Prediction of low-energy collision-induced dissociation
spectra of peptides with three or more charges. Anal Chem. 2005;
77:6364–6373.
48. Rost H,Malmstrom L, Aebersold R. A computational tool to detect and
avoid redundancy in selected reactionmonitoring.Mol Cell Proteomics.
2012;11:540–549.
49. Moseley MA, Deterding LJ, Tomer KB, Jorgenson JW. Nanoscale
packed-capillary liquid chromatography coupled with mass spectrom-
etry using a coaxial continuous-flow fast atom bombardment
interface. Anal Chem. 1991;1:1467–1473.
50. Krokhin OV. Sequence-specific retention calculator. algorithm for
peptide retention prediction in ion-pair RP-HPLC: application to 300-
and 100-a pore size C18 sorbents. Anal Chem. 2006;78:7785–7795.
51. Spicer V, Yamchuk A, Cortens J, et al. Sequence-specific retention
calculator. a family of peptide retention time prediction algorithms in
reversed-phase HPLC: applicability to various chromatographic
conditions and columns. Anal Chem. 2007;79:8762–8768.
14 | PINO ET AL.
52. Escher C, Reiter L, MacLean B, et al. Using iRT, a normalized retention
time for more targeted measurement of peptides. Proteomics.
2012;12:1111–1121.
53. Sherwood CA, Eastham A, Lee LW, et al. Rapid optimization of MRM-
MS instrument parameters by subtle alteration of precursor and
product M/z targets. Proteome. 2009;8:3746–3751.
54. Picotti P, Bodenmiller B, Mueller LN, Bruno Domon B. Full dynamic
range proteome analysis of S. cerevisiae by targeted proteomics. Cell.
2010;138:795–806.
55. Griffin PR, Coffman JA, Hood LE, Yates JR. Structural analysis of
proteins by capillary HPLC electrospray tandem mass spectrometry.
Int J Mass Spectrom Ion Processes. 1991;111:131–149.
56. MacLean B, Daniela M, Tomazela DM, et al. Effect of collision energy
optimization on the measurement of peptides by selected reaction
monitoring (SRM) mass spectrometry. Anal Chem. 2010;82:
10116–10124.
57. Craig R, Cortens JP, Beavis RC. The use of proteotypic peptide libraries
for protein identification. Rapid Commun Mass Spectrom.
2005;19:1844–1850.
58. Eng JK, McCormack AL, Yates JR. An approach to correlate tandem
mass spectral data of peptides with amino acid sequences in a protein
database. J Am Soc Mass Spectrom. 1994;5:976–989.
59. FrewenBE,MerrihewGE,WuCC,NobleWS,MacCossMJ. Analysis of
peptide MS/MS spectra from large-scale proteomics experiments
using spectrum libraries. Anal Chem. 2006;78:5678–5684.
60. Egertson JD, MacLean M, Johnson R, Xuan Y, MacCoss MJ.
Multiplexed peptide analysis using data-independent acquisition
and Skyline. Nat Protoc. 2015;10:887–903.
61. Zhang Y, Bilbao A, Bruderer T, et al. The use of variable Q1 isolation
windows improves selectivity in LC-SWATH-MS acquisition.
J Proteome Res. 2015;14:4359–4371.
62. Egertson JD, Kuehn A, Merrihew GE, et al. Multiplexed MS/MS for
improved data-independent acquisition. Nat Methods. 2013;10:
744–746.
63. Pedrioli PG, Eng JK, Hubley R, et al. A common open representation of
mass spectrometry data and its application to proteomics research.
Nat Biotechnol. 2004;22:1459–1466.
64. Finney GL, Blackler AR, Hoopmann MR, Canterbury JD, Wu CC,
MacCoss MJ. Label-free comparative analysis of proteomics mixtures
using chromatographic alignment of high-resolution µLC-MS data.
Anal Chem. 2008;80:961–971.
65. Finney GL. Tools and Analyses for Differential Label-Free Proteomics
Using Mass Spectrometry [dissertation]. Seattle: University of Wash-
ington; 2012.
66. Tsou CC, Avtonomov D, Larsen B, et al. DIA-Umpire: comprehensive
computational framework for data-independent acquisition proteo-
mics. Nat Methods. 2015;12:258–264.
67. Reiter L, Rinner O, Picotti P, et al. MProphet: automated data
processing and statistical validation for large-scale srm experiments.
Nat Methods. 2011;8:430–435.
68. BeremanMS,MacLeanB, TomazelaDM, LieblerDC,MacCossMJ. The
development of selected reaction monitoring methods for targeted
proteomics via empirical refinement. Proteomics. 2012;12:
1134–1141.
69. Stein SE, Scott DR. Optimization and testing of mass spectral library
search algorithms for compound identification. J Am Soc Mass
Spectrom. 1994;5:859–866.
70. Tabb DL, MacCoss MJ, Wu CC, Anderson SD, Yates JR. Similarity
among tandem mass spectra from proteomic experiments: detection,
significance, and utility. Anal Chem. 2003;75:2470–2477.
71. Sherwood CA, Eastham A, Lee LW, Risler J, Vitek O, Martin DB.
Correlation between Y-type ions observed in ion trap and triple
quadrupole mass spectrometers. J Proteome Res. 2010;8:4243–4251.
72. Abbatiello SE, Mani DR, Keshishian H, Carr SA. Automated detection
of inaccurate and imprecise transitions in peptide quantification by
multiple reaction monitoring mass spectrometry. Clin Chem.
2010;56:291–305.
73. Benjamini Y, Hochberg Y. Controlling the false discovery rate: a
practical and powerful approach to multiple testing. J R Stat Soc Series
B Methodol. 1995;57:289–300.
74. Baker ES, Burnum-Johnson KE, Ibrahim YM, et al. Enhancing bottom-
up and top-down proteomic measurements with ion mobility
separations. Proteomics. 2015;15:2766–2776.
75. Payne SH, Monroe ME, Overall CC, et al. The Pacific Northwest
National Laboratory library of bacterial and archaeal proteomic
biodiversity. Sci Data. 2015;2:150041.
76. Bereman MS, Johnson R, Bollinger J, et al. Implementation of
statistical process control for proteomic experiments Via LC MS/
MS. J Am Soc Mass Spectrom. 2014;25:581–587.
77. ChoiM, Chang CY, Clough T, et al. MSstats: an R package for statistical
analysis of quantitative mass spectrometry-based proteomic experi-
ments. Bioinformatics. 2014;30:1–2.
78. Mani DR, Abbatiello SE, Carr SA. Statistical characterization of
multiple-reaction monitoring mass spectrometry (MRM-MS) assays
for quantitative proteomics. BMC Bioinformatics. 2012;16:S9.
79. Bilbao A, Zhang Y, Varesio E, et al. Ranking fragment ions based on
outlier detection for improved label-free quantification in data-
independent acquisition LC-MS/MS. J Proteome Res. 2015;14:
4581–4593.
80. Omasits U, Ahrens CH, Müller S, Wollscheid B. Protter: interactive
protein feature visualization and integration with experimental
proteomic data. Bioinformatics. 2014;30:884–886.
81. BeremanMS, Beri J, Sharma V, et al. An automated pipeline tomonitor
system performance in liquid chromatography-tandem mass spec-
trometry proteomic experiments. J Proteome Res. 2016;15:
4763–4769.
82. Abbatiello SE, Schilling B, Mani DR, et al. Large-scale inter-laboratory
study to develop, analytically validate and apply highly multiplexed,
quantitative peptide assays to measure cancer-relevant proteins in
plasma. Mol Cell Proteomics. 2015;14:2357–2374.
83. Perkins DN, Pappin DJC, Creasy DM, Cottrell JS. Probability-based
protein identification by searching sequence databases using mass
spectrometry data. Electrophoresis. 1999;20:3551–3567.
84. Bern M, Cai Y, Goldberg D. Lookup peaks: a hybrid of de novo
sequencing and database search for protein identification by tandem
mass spectrometry. Anal Chem. 2007;79:1393–1400.
85. Eng JK, Jahan TA, Hoopmann MR. Comet: an open-source MS/MS
sequence database search tool. Proteomics. 2013;13:22–24.
86. Käll L, Canterbury JD, Weston J, Noble WS, MacCoss MJ. Semi-
supervised learning for peptide identification from shotgun proteo-
mics datasets. Nat Methods. 2007;4:923–925.
87. Tabb DL, Fernando CG, Chambers MC. MyriMatch: highly accurate
tandem mass spectral peptide identificaiton by multivariate hyper-
geometric analysis. J Proteome Res. 2007;6:654–661.
88. Cox J, Neuhauser N, Michalski A, Scheltema RA, Olsen JV, Mann M.
Andromeda: a peptide search engine integrated into the MaxQuant
environment. J Proteome Res. 2011;10:1794–1805.
89. Wenger CD, Coon JJ. A proteomics search algorithm specifically
designed for high-resolution tandem mass spectra. J Proteome Res.
2013;12:1377–1386.
90. Kim S, Mischerikow N, Bandeira N. The generating function of CID,
ETD, and CID/ETD pairs of tandem mass spectra: applications to
database search. Mol Cell Proteomics. 2010;9:2840–2852.
91. Geer LY, Markey SP, Kowalak JA, et al. Open mass spectrometry
search algorithm. J Proteome Res. 2004;3:958–964.
92. Zhang J, Xin L, Shan B, et al. PEAKS DB: de novo sequencing assisted
database search for sensitive and accurate peptide identification.Mol
Cell Proteomics. 2012;11:M111.010587.
93. Martens L, Hermjakob H, Jones P, et al. PRIDE: the proteomics
identifications database. Proteomics. 2005;5:3537–3545.
PINO ET AL. | 15
94. Shilov IV, Seymour SL, Patel AA, et al. The paragon algorithm, a next
generation search engine that uses sequence temperature values and
feature probabilities to identify peptides from tandem mass spectra.
Mol Cell Proteomics. 2007;6:1638–1655.
95. Baker PR, Clauser KR. ProteinProspector [website]. https://
prospector.ucsf.edu
96. Searle BC. Scaffold: a bioinformatic tool for validating MS/MS-based
proteomic studies. Proteomics. 2010;10:1265–1269.
97. Deutsch EW, Mendoza L, Shteynberg D, Slagel J, Sun Z, Moritz RL.
Trans-proteomic pipeline, a standardized data processing pipeline for
large-scale reproducible proteomics informatics. Proteomics Clin Appl.
2015;9:745–754.
98. Craig R, Beavis RC. TANDEM: matching proteins with tandem mass
spectra. Bioinformatics. 2004;20:1466–1467.
How to cite this article: Pino LK, Searle BC, Bollinger JG,
Nunn B, MacLean B, MacCoss MJ. The Skyline ecosystem:
Informatics for quantitative mass spectrometry proteomics.
Mass Spec Rev. 2017;1–16. https://doi.org/10.1002/
mas.21540
16 | PINO ET AL.